")
Back to Journals » International Journal of General Medicine » Volume 16
Identification of Oxidative Stress-Related Biomarkers in Acute Myocardial Infarction
Authors Sun Y, Wang M, Tan X, Zhang H, Yang S
Received 28 July 2023
Accepted for publication 30 September 2023
Published 26 October 2023 Volume 2023:16 Pages 4805—4818
DOI https://doi.org/10.2147/IJGM.S428709
Checked for plagiarism Yes
Review by Single anonymous peer review
Peer reviewer comments 2
Editor who approved publication: Prof. Dr. Yuriy Sirenko
Yihan Sun,1,2 Min Wang,1,2 Xi Tan,1,2 Huidi Zhang,3 Shuang Yang1,2
1Department of Cardiology, The Second Affiliated Hospital of Harbin Medical University, Harbin, People’s Republic of China; 2Key Laboratory of Myocardial Ischemia, Chinese Ministry of Education, Harbin, People’s Republic of China; 3Department of Cardiology, The Fourth Affiliated Hospital of Harbin Medical University, Harbin, People’s Republic of China
Correspondence: Shuang Yang, Key Laboratory of Myocardial Ischemia, Chinese Ministry of Education, Harbin, People’s Republic of China, Tel +86 15945154368, Email [email protected]
Purpose: Acute Myocardial Infarction (AMI) is globally prevalent, with oxidative stress as a key contributor to its pathogenesis. This study aimed to explore oxidative stress-related genes as potential AMI biomarkers, elucidating their role in disease progression.
Patients and Methods: Gene expression data from AMI samples in the Gene Expression Omnibus (GEO) database and oxidative stress-related genes (OSRGs) from the GeneCards database were extracted. Weighted Gene Co-expression Network Analysis (WGCNA) identified key module genes associated with AMI. Intersecting OSRGs, key module genes, and differentially expressed genes (DEGs) between AMI and normal samples led to the extraction of differentially expressed ORSGs (DE-ORSGs) related to AMI. Feature genes were mined using the Least Absolute Shrinkage and Selection Operator (LASSO) regression and Support Vector Machine (SVM) algorithm, followed by potential diagnostic value assessment using receiver operating characteristic (ROC) curves. Gene Set Enrichment Analysis (GSEA) was executed on the identified key genes. Immune infiltration levels were explored using the CIBERSORT algorithm, and a Transcription Factor (TF) -mRNA regulatory network of key genes was created. The key genes were validated using qRT-PCR.
Results: We authenticated three key genes (MMP9, TGFBR3, and S100A12) from 6 DE-ORSGs identified in AMI. GSEA revealed that these key genes were enriched in immune-related signaling pathways. Immune infiltration analysis identified three differential immune cell types (resting NK cells, Monocytes, and M0 Macrophages) between AMI and normal groups. Correlation analysis revealed positive associations of MMP9 with M0 Macrophages and S100A12 with Monocytes and M0 Macrophages, whereas TGFBR3 was negatively related to Monocytes. A TF-mRNA regulatory network was generated based on these key genes. qRT-PCR validation confirmed the differential expression of S100A12 and TGFBR3 between AMI and control samples.
Conclusion: TGFBR3, and S100A12 were identified as potential oxidative stress-related biomarkers in AMI, providing new insights for AMI diagnosis and treatment.
Keywords: acute myocardial infarction, oxidative stress-related genes, immune infiltration, biomarker
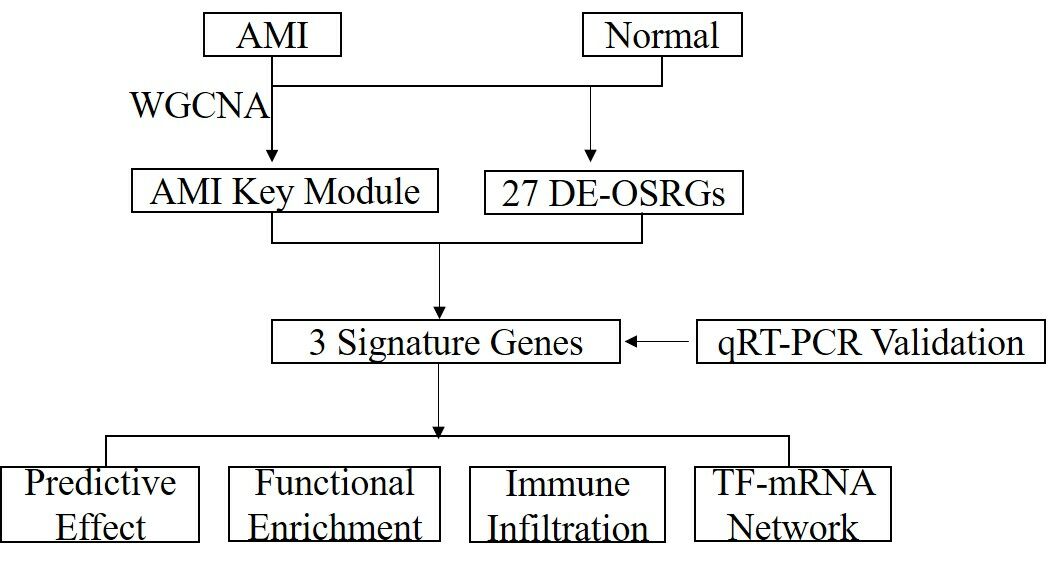
Graphical Abstract:
Introduction
Acute myocardial infarction (AMI), a result of blood flow disruption in specific heart regions, is a principal cause of global cardiovascular disability and death. AMI is triggered by acute coronary syndrome (ACS), predominantly due to the formation of plaque or intravascular thrombus, leading to myocardial hypoxia, necrosis, and widespread myocardial damage. AMI’s risk factors chiefly involve the interplay of genetic and environmental elements, such as diabetes, hypercholesterolemia, obesity, and hypertension. While Troponin serves as a diagnostic marker and PCI as a therapeutic intervention for AMI, refining and innovating these modalities is imperative for enhanced early detection and optimized patient outcomes.
Oxidative stress is a phenomenon resulting from an imbalance between the accumulation of reactive oxygen species (ROS) in cells and tissues and the capacity of biological systems to detoxify these reaction products. ROS metabolism stimulates the p53 and NF-κB signaling pathways, thereby increasing pro-inflammatory cytokine expression and disturbing glucose metabolism.1 In AMI cases, ROS, produced in ischemic myocardium post-reperfusion, can directly impair myocardial cell membranes, leading to cell death.2 Moreover, ROS can incite signaling transduction related to inflammatory cytokine secretion, including tumor necrosis factor-alpha (TNF-α) and interleukins (IL)-1β and −6.3 Further, these inflammatory cytokines contribute to regulating cell survival and death in tandem with ROS.1,4
Various studies have highlighted the increasing role of immune cell infiltration in disease onset and progression. In AMI, eosinophils,5 M2 type macrophages,6 and NKT cells7 have been found to aid in heart function recovery post-AMI, shedding new light on post-myocardial infarction heart immune regulation. Despite this, limited research has been conducted using CIBERSORT to investigate immune cell infiltration in AMI.
In our research, we investigated disparities in oxidative stress-associated gene expression between AMI and healthy samples using the Gene Expression Omnibus (GEO) database. With machine learning algorithms and Receiver Operating Characteristic (ROC) analysis, we pinpointed crucial genes, then employed Gene Set Enrichment Analysis (GSEA) for further examination of these genes. As a result, we constructed a transcription factor regulatory network associated with these pivotal genes and explored immune cell infiltration in AMI. To validate the expression of these core genes, we conducted quantitative real-time reverse transcription polymerase chain reaction (qRT-PCR). Our results significantly contribute to the understanding of AMI’s pathogenesis and provide potential avenues for diagnostic biomarker discovery.
Materials and Methods
Data Acquisition and Preparation
We retrieved acute myocardial infarction (AMI)-associated datasets from the Gene Expression Omnibus (GEO) database. Specifically, the GSE48060 dataset, with 21 normal and 31 AMI patient blood samples, and the GSE60993 validation dataset, which included 7 normal and 17 AMI patient blood samples. In parallel, we extracted 9438 oxidative stress-related genes (OSRGs) from the Gene Cards database using “oxidative stress” as the keyword.
Identifying Differentially Expressed OSRGs
Utilizing the “limma” R package, we identified differentially expressed genes (DEGs) between AMI and normal samples. We used the “ggpubr” and “Heatmap” R packages to visualize these differences through a Volcano Plot and a heatmap, respectively. By intersecting the DEGs with the OSRGs, we derived differentially expressed OSRGs (DE-OSRGs), depicted via a Venn diagram.
Functional Analysis and PPI Network Construction
We determined the enriched biological functions and signaling pathways of DE-OSRGs via Gene Ontology (GO) and Kyoto Encyclopedia of Genes and Genomes (KEGG) analyses. Simultaneously, we constructed a Protein-Protein Interaction (PPI) network using the Search Tool for the Retrieval of Interacting Genes (STRING) website, setting the confidence level at 0.4.
Weighted Gene Co-Expression Network Analysis (WGCNA)
Using the “WGCNA” R package, we analyzed the relationship between AMI and gene modules. After removing outliers, we segmented modules, merged similar ones, and analyzed the correlation between each module and AMI. Key modules most associated with AMI were selected for further analysis.
Feature Genes Selection and ROC Curve Analysis
We identified candidate genes through the intersection of DE-OSRGs and module genes. Feature genes were then identified via Absolute Shrinkage and Selection Operator (LASSO) regression and Support Vector Machine (SVM) algorithms. Using the “pROC” R package, we created and visualized Receiver Operating Characteristic (ROC) curves of feature genes in both the training and validation sets.
Single-Gene Gene Set Enrichment Analysis (GSEA)
Single-gene GSEA was conducted to investigate the molecular mechanism of the key gene in AMI, using the “clusterProfiler” R package with predefined thresholds based on GO and KEGG gene sets.
Immune Cells Infiltration and Correlation Analysis
We utilized the CIBERSORT algorithm to calculate the infiltration proportion of 22 immune cell types in all samples of the GSE48060 dataset. Following that, differential immune cells between normal and AMI groups were identified through a Wilcoxon-test. Subsequently, we performed a Pearson correlation analysis to assess the association between key genes and differential immune cells.
Establishment of a TF-mRNA Regulatory Network
We employed the Network Analyst database to predict the transcription factors (TFs) regulating the biomarkers. With the help of Cytoscape, we constructed a TF-mRNA network.
Statistical Analysis
We executed all analyses using the R programming language, considering a p-value < 0.05 as statistically significant, unless otherwise specified.
Quantitative Real-Time Reverse Transcription Polymerase Chain Reaction (qRT-PCR)
For our qRT-PCR analysis, we enrolled patients between October 2022 and January 2023 from The Second Affiliated Hospital of Harbin Medical University’s Cardiology Department. Our cohort consisted of 6 patients diagnosed with AMI based on a combination of clinical symptoms, ECG changes indicative of ischemia, and elevated cardiac troponin levels, all aged between 30–60 years. Additionally, we included 6 age-matched normal individuals with no known history of cardiovascular diseases or any other major health conditions, all of whom had normal findings in their routine health check-ups. We extracted blood RNA using a RNeasy kit and assessed the RNA concentrations and purity using ultraviolet spectrophotometer. We performed qPCR using a LightCycler 480 real-time PCR machine. The primers for each gene to be tested are listed in Table 1. GAPDH was used as the reference gene, with the relative gene expression quantified using the cycle threshold (ΔΔCT) method. The study received approval from the Harbin Medical University ethics committee, and all participants provided written informed consent.
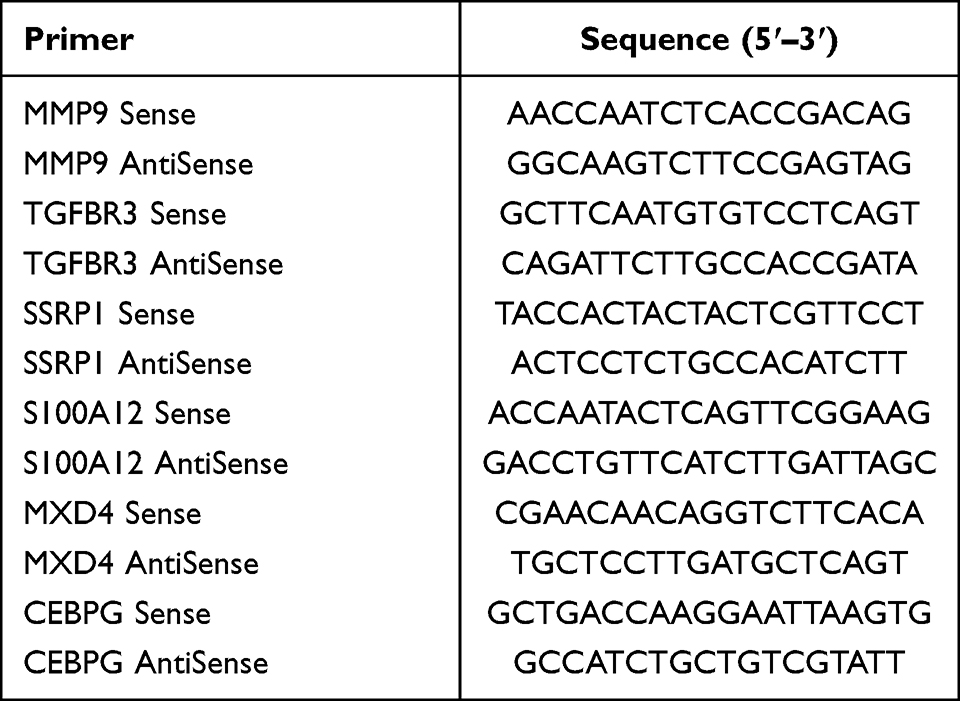 |
Table 1 Real-Time qPCR Primers |
Results
Differentially Expressed Oxidative Stress-Related Gene (DE-OSRG) Identification and Functional Enrichment Analysis between AMI and Normal Samples
Using the GSE48060 dataset, we discovered a total of 60 differentially expressed genes (comprising 21 upregulated and 39 downregulated genes) in AMI versus normal samples (Figure 1A and B). Further, by overlapping these 60 differentially expressed genes with 9438 Oxidative Stress-Related Genes (OSRGs), we pinpointed 27 DE-OSRGs (Figure 1C). In order to delve into the biological processes and signaling pathways tied to DE-OSRGs, we conducted Gene Ontology (GO) and Kyoto Encyclopedia of Genes and Genomes (KEGG) analyses. The top ten GO terms indicated that these DE-OSRGs were notably involved in the biological processes of negative regulation of T cell-mediated immunity, cell lysis, and cytotoxicity (Figure 1D). KEGG analysis unveiled that the graft-versus-host disease and natural killer cell-mediated cytotoxicity signaling pathways were associated with DE-OSRGs (Figure 1E).
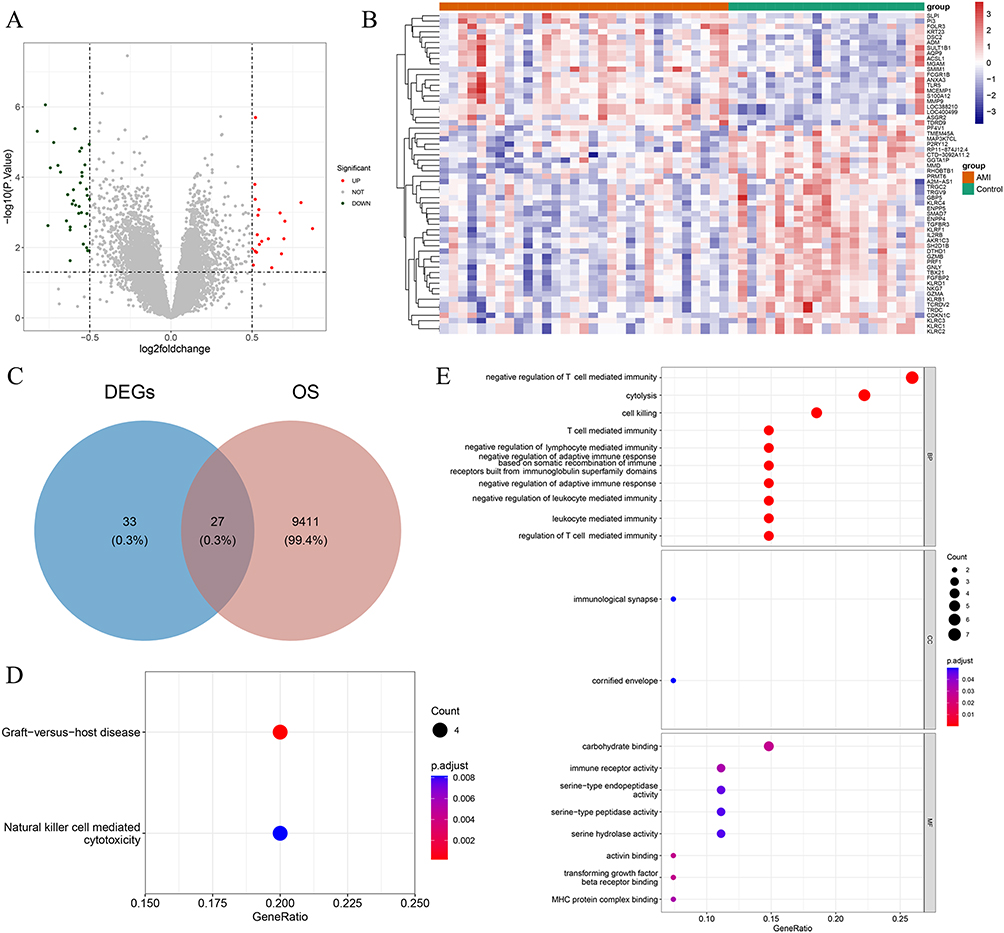 |
Figure 1 Differentially Expressed Oxidative Stress-Related Genes (DE-OSRGs) and Functional Enrichment Analysis in AMI and Normal Samples. (A and B) Total of 60 differentially expressed genes identified between AMI and normal samples using the GSE48060 dataset, which includes 21 upregulated genes and 39 downregulated genes. (C) Identification of 27 DE-OSRGs by overlapping the 60 differentially expressed genes with 9438 OSRGs. (D) Top 10 Gene Ontology (GO) terms, showing that these DE-OSRGs are significantly enriched in the biological processes of negative regulation of T cell-mediated immunity, cell lysis, and cytotoxicity. (E) Kyoto Encyclopedia of Genes and Genomes (KEGG) analysis revealing that the graft-versus-host disease and natural killer cell-mediated cytotoxicity signaling pathways are associated with DE-OSRGs. |
Analysis of Protein-Protein Interaction (PPI) Network in AMI with DE-OSRGs
We established a PPI network to investigate the links between the 27 identified DE-OSRGs. The network comprises 17 nodes and 37 edges (Figure 2). Notably, GZMB interacts with various proteins (TBX21, IL2RB, KLRC1, KLRD1, GNLY, GZMA, and PRF1), while S100A12 interacts with AQP9, ANXA3, PI3, and MMP9.
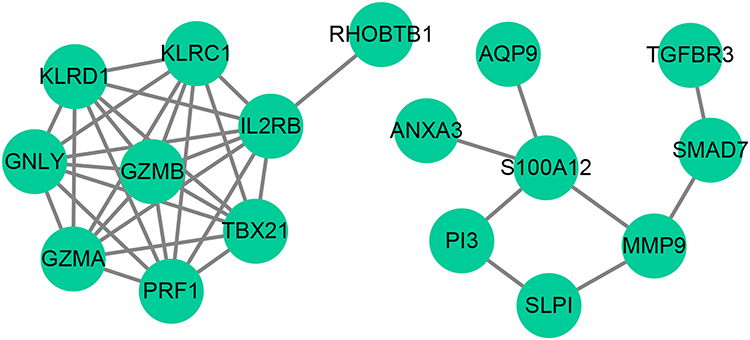 |
Figure 2 Protein-Protein Interaction (PPI) Network Analysis of DE-OSRGs in AMI. The PPI network, comprised of 17 nodes and 37 edges, represents the interactions among the 27 DE-OSRGs. Key interactions between GZMB and multiple proteins, and S100A12 and a set of proteins, are highlighted. |
AMI-Related Key Module Genes
Utilizing Weighted Gene Co-expression Network Analysis (WGCNA), we sought to find co-expressed genes associated with AMI. Two outlier samples were first eliminated, leaving 50 samples for further analysis (Figure 3A and B). We then created a scale-free network with a soft threshold of β=18 (scale-free R2=0.8) (Figure 3C). A clustering dendrogram was presented, and using a dynamic tree-cutting algorithm (with MEDissThres set at 0.1), we obtained 14 gene modules (Figure 3D). The black and salmon modules, found to be highly correlated with AMI (Figure 3E), were designated as key gene modules.
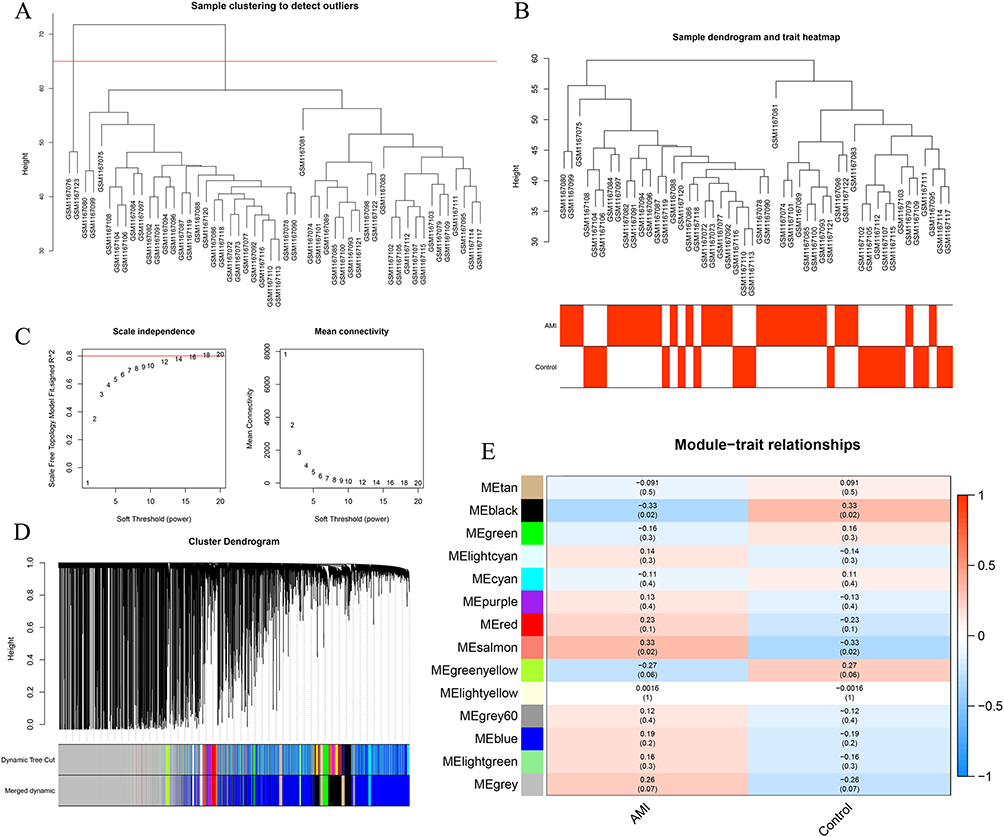 |
Figure 3 Key Module Genes Related to AMI Identified by Weighted Gene Co-expression Network Analysis (WGCNA). (A and B) Following the exclusion of two outlier samples, the remaining 50 samples were processed. (C) Construction of a scale-free network with a soft threshold β=18. (D) A total of 14 gene modules obtained from a clustering dendrogram, using a dynamic tree-cutting algorithm. (E) Correlation analysis revealing two modules, black and salmon, highly related to AMI. |
Identification of Signature Genes
Initially, an overlap of the 27 DE-OSRGs and 3054 key module genes yielded 6 candidate genes (Figure 4A). Subsequently, five signature genes - MMP9, TGFBR3, DSC2, SMAD7, and S100A12 - were identified based on the intersection of results from LASSO regression (Figure 4B) and Support Vector Machine (SVM) algorithm (Figure 4C), as shown in Figure 4D.
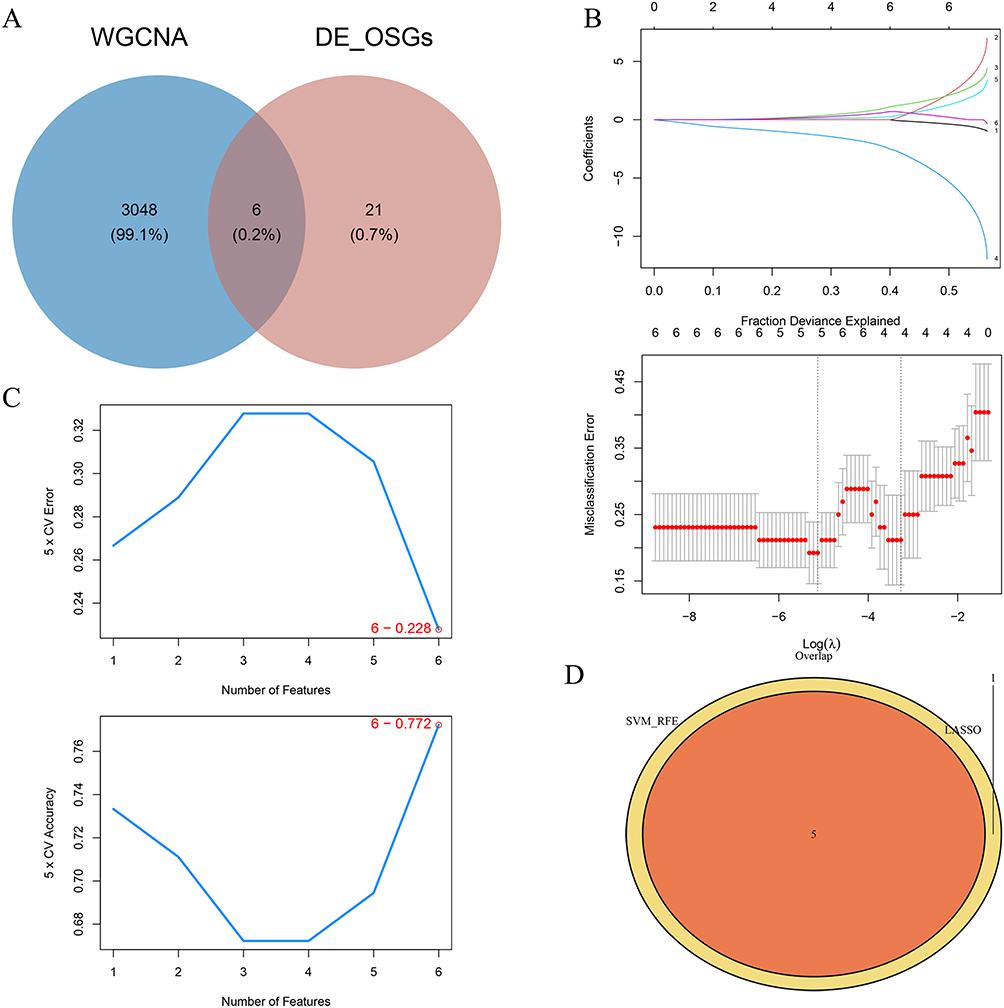 |
Figure 4 Identification of Signature Genes. (A) Overlapping the 27 DE-OSRGs with 3054 key module genes to obtain 6 candidate genes. (B and C) Results derived from LASSO regression and the SVM algorithm. (D) Five identified signature genes—MMP9, TGFBR3, DSC2, SMAD7, and S100A12. |
ROC Curve Evaluation of Key Genes and Expression Validation
ROC curve analysis was conducted to evaluate the diagnostic abilities of signature genes in the GSE48060 (training set) and GSE60993 (validation set). The results identified MMP9, TGFBR3, and S100A12 as key genes or oxidative stress-related biomarkers (Figure 5A) due to an AUC of ≥0.7 in both datasets. Subsequently, we further confirmed the expression consistency of these genes across the datasets. As shown in Figure 5B, the expressions of MMP9 and S100A12 were significantly elevated in the LDH group, while TGFBR3 expression was notably reduced.
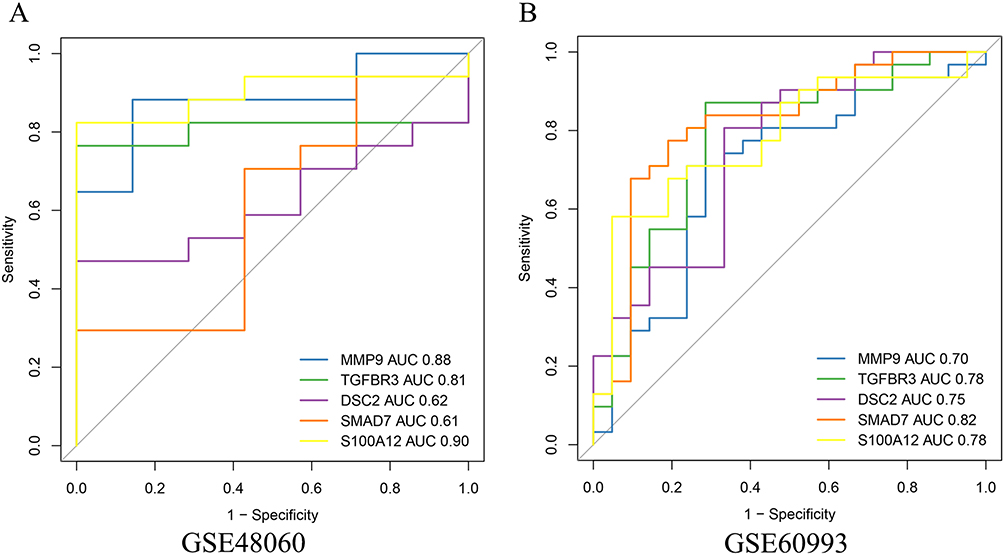 |
Figure 5 ROC Curve Evaluation and Expression Validation of Key Genes. (A) ROC curve analysis demonstrating the diagnostic capabilities of MMP9, TGFBR3, and S100A12 in the GSE48060 (training set) and GSE60993 (validation set) datasets. (B) Expression validation of MMP9, TGFBR3, and S100A12 in both datasets, showing significant upregulation of MMP9 and S100A12, and downregulation of TGFBR3 in the LDH group. |
Key Genes’ Gene Set Enrichment Analysis (GSEA)
GSEA was performed to identify biological processes and signaling pathways related to key genes in the disease condition. These genes were found to be enriched in the biological process of ribosomal structural constituents. Both the structural components and their related signaling pathways were associated with the key genes (Figure 6A–C). Additionally, our analysis revealed that these key genes are also linked to immune-related signaling pathways (Supplementary Table 1: GSEA analysis of MMP9; Supplementary Table 2: GSEA analysis of TGFBR3; Supplementary Table 3: GSEA analysis of S100A12).
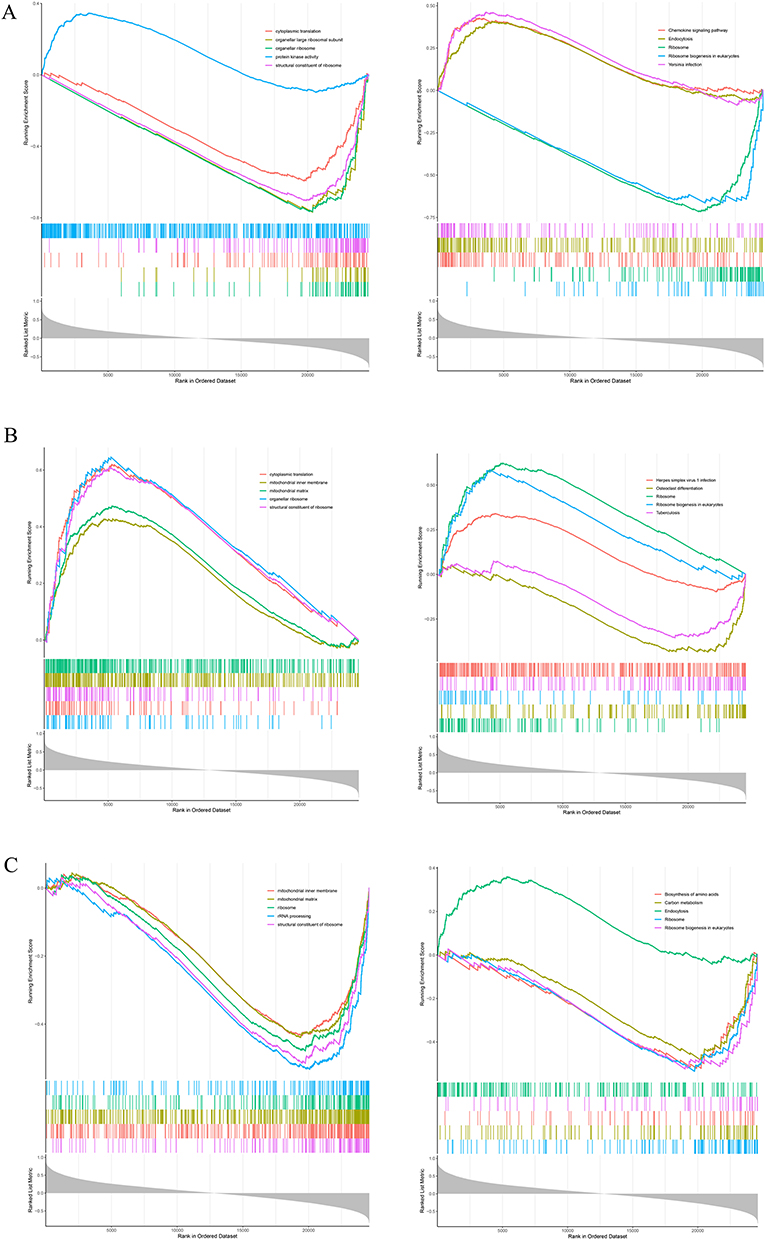 |
Figure 6 Gene Set Enrichment Analysis (GSEA) of Key Genes. (A–C) Enrichment of key genes in the biological process of ribosomal structural components, with associated signaling pathways also showing significant involvement of these key genes. |
Immune Microenvironment Analysis and Correlation Between Key Genes and Differential Immune Cells
We used the CIBERSORT algorithm to identify differential immune cell types between AMI and normal groups by calculating the proportions of 22 infiltrating immune cells (Figure 7A). We used the Wilcoxon test to acquire differential immune cells. The analysis showed that resting NK cells were more abundant in the normal group, while monocytes and M0 macrophages were more prevalent in the AMI group (Figure 7B). Correlation analysis demonstrated that MMP9 had a positive correlation with M0 macrophages, TGFBR3 had a negative correlation with monocytes, and S100A12 exhibited a positive correlation with monocytes and M0 macrophages (Figure 7C).
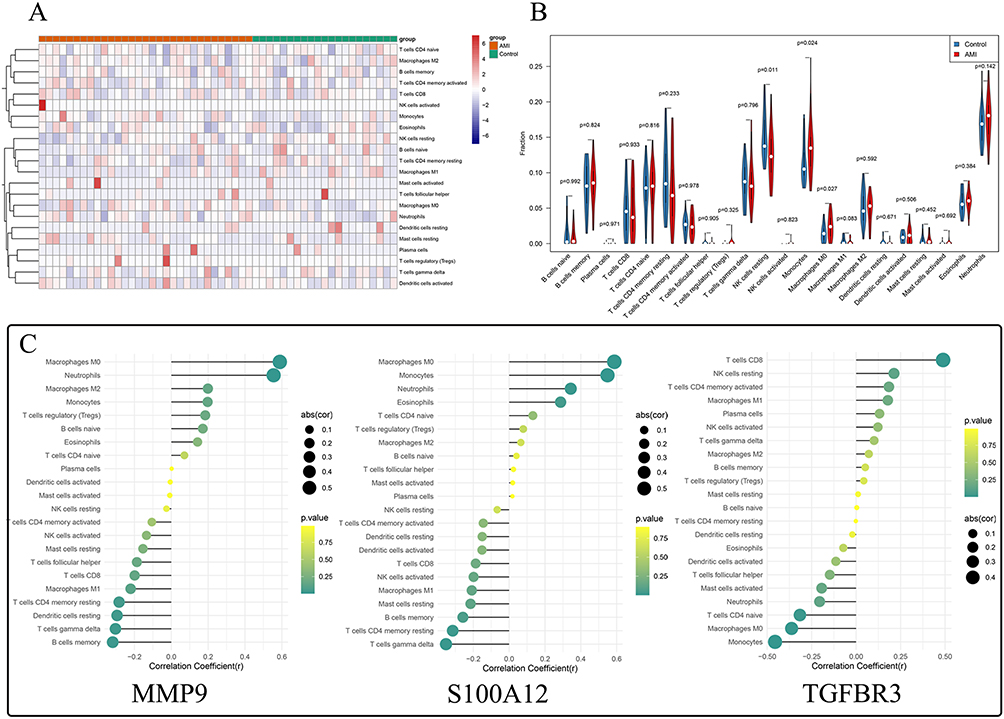 |
Figure 7 Analysis of Immune Microenvironment and Correlation between Key Genes and Differential Immune Cells. (A) Calculation of proportions of 22 infiltrating immune cells in AMI and normal groups using the CIBERSORT algorithm. (B) Analysis showing that resting NK cells were more abundant in the normal group, while monocytes and M0 macrophages were more prevalent in the AMI group. (C) Correlation analysis revealing positive correlation of MMP9 with M0 macrophages and S100A12 with both monocytes and M0 macrophages, and a negative correlation of TGFBR3 with monocytes. |
Transcription Factor (TF)-mRNA Network Based on AMI Key Genes
To delve deeper into the regulatory mechanisms of key genes, we anticipated 39 transcription factors associated with the three key genes using the Network Analyst database. Subsequently, we established a TF-mRNA network composed of 42 nodes (39 transcription factors and 3 key genes) and 45 edges (Figure 8A). In this network, MMP9 is regulated by 22 transcription factors (including SSRP1, MXD4, ID3, CUX1, and MXD3), TGFBR3 by 17 transcription factors (including SSRP1, MXD4, CEBPG, ZNF2, and BCL11A), and S100A12 by FOS, STAT3, and CEBPG. We performed PCR tests to verify differentially expressed genes between AMI and healthy controls (Figure 8B, Supplementary Table 4: Expression levels of 6 genes in normal individuals; Supplementary Table 5: Expression levels of 6 genes in patients). We discovered that S100A12 is highly expressed in patients, whereas TGFBR3 exhibits high expression in the normal group, consistent with RNA-seq results. Nevertheless, there was no significant difference in CEBPG between the normal and patient groups, suggesting that CEBPG, acting as a transcription factor, exerts distinct mechanisms on downstream TGFBR3 and S100A12, collaboratively contributing to AMI.
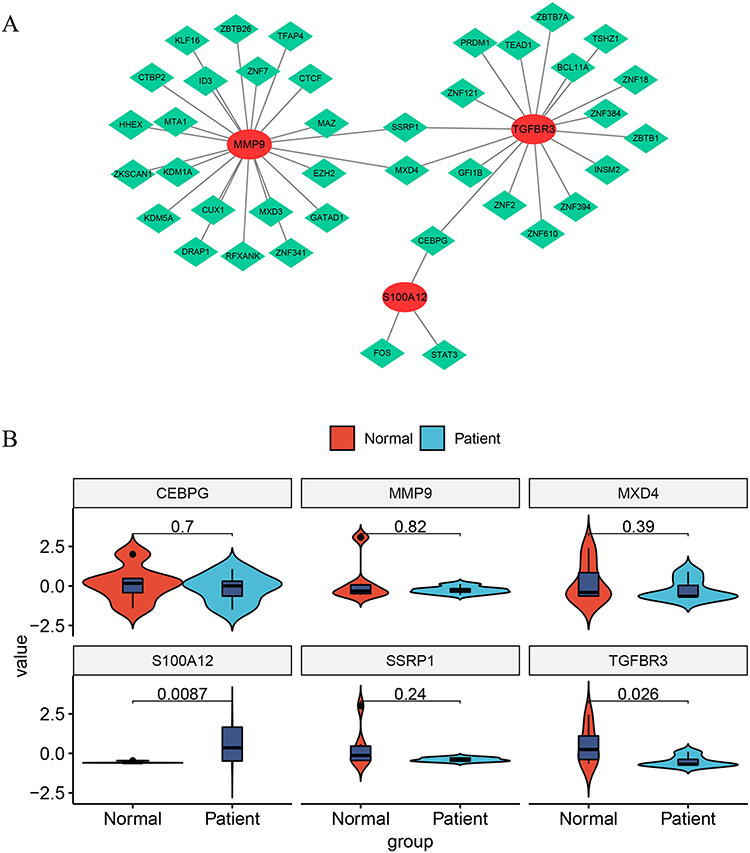 |
Figure 8 Transcription Factor (TF)-mRNA Network Based on AMI Key Genes. (A) The network, comprised of 42 nodes (39 transcription factors and 3 key genes) and 45 edges, shows the regulatory relationships of key genes. MMP9 is regulated by 22 transcription factors, TGFBR3 by 17 transcription factors, and S100A12 by three transcription factors (FOS, STAT3, and CEBPG). This diagram illustrates the complex interplay of these factors in the pathogenesis of AMI. (B) The expression of each of the three key genes and core transcription factors was validated by qPCR. |
Discussion
Acute Myocardial Infarction is the result of irreversible cardiac damage, precipitated by coronary artery thrombosis or occlusion. Recent research has shed light on the role of oxidative stress in the pathogenesis of cardiac injury in AMI. An increase in Oxygen Free Radical Species (OFRs) can lead to atherosclerosis, a contributing factor to AMI, through oxidative modifications of Low-Density Lipoprotein (LDL) molecules. In this study, we extracted differentially expressed oxidative stress-related genes (DE-OSRGs) between AMI and normal samples. We used Weighted Gene Co-expression Network Analysis (WGCNA) to detect gene modules related to AMI, yielding six intersecting genes from these two lists as candidate genes. Utilizing machine learning algorithms, Receiver Operating Characteristic (ROC) analysis and qRT-PCR for external validation, we ultimately identified TGFBR3, and S100A12 as oxidative stress-related biological markers.
MMP-9 is a critical enzyme capable of cleaving peptide bonds in the helical domain of soluble collagen proteins, found to be associated with the instability of atherosclerotic plaques and the formation of atherosclerosis.8 Overexpression of MMP-9 leads to the degradation of the extracellular matrix of vascular wall cells, resulting in thinning or rupture of coronary atherosclerotic plaques.9 A study by Garvin et al reported that levels of MMP-9 were independently associated with the risk of a first coronary heart disease event.10 Transforming Growth Factor Beta Receptor 3 (TGFBR3) is a membrane proteoglycan, typically functioning as a co-receptor with other TGF-β receptor superfamily members. A recent study found that expression of let-7 was significantly downregulated after MI, targeting TGFBR3 through the activation of the p38 MAPK pathway.11 The let-7-TGFBR3-p38 MAPK signaling may play a significant role in cardiomyocyte apoptosis post-MI, making TGFBR3 a potential therapeutic target and biomarker for MI. A study revealed that S100A12,12 enriched in the Mitogen-Activated Protein Kinase (MAPK) signaling pathway, NF-κB signaling pathway, and inflammatory response pathway, is associated with the onset and progression of AMI. Previous research has shown that ribosomes and mitochondria have a significant impact on AMI.13 Mitochondrial ribosomes play various roles in energy metabolism, including regulating cellular respiration, oxidative phosphorylation (OXPHOS), Reactive Oxygen Species (ROS) balance, and cell death. In this study, GSEA analysis revealed a link between oxidative stress-related biomarkers and ribosomal and mitochondrial structure. Further research should be conducted if AMI is regulated by the interaction of ribosomal and mitochondrial components with oxidative stress processes.
Recent studies emphasize the significant interplay between immune cells and cardiac conditions. Notably, CD4+T-cells exhibit distinct responses after myocardial infarction (MI) and during heart failure (HF), underscoring their multifaceted roles in cardiac injury.14 In hypertrophic cardiomyopathy (HCM), inflammation, driven by genetic and environmental factors, is believed to be a key player, influencing both cardiomyocyte dysfunction and conditions like Fabry disease and cardiac amyloidosis.15 The pathobiology of HCM, including tissue-level inflammation, contributes to myocardial fibrosis and ventricular remodeling.16 Additionally, inflammation is highlighted as a core component in a broad spectrum of cardiovascular diseases, aiding in the diagnosis and prognosis of conditions like HCM.17 Furthermore, understanding the role of the TNF-α/TNFR1 axis in T-cell activation provides potential therapeutic avenues, especially in the context of HF.18 In our study, a significant increase in monocytes and M0 macrophages and a decrease in resting NK cells in AMI samples. The increase in monocytes and M0 macrophages may be attributed to the enhanced conversion of foam cells from macrophages in AMI patients,19 in turn promoting macrophage infiltration. NK cells have direct and indirect cytotoxic effect mechanisms. In addition to lysosome granule expulsion, activated NK cells can mediate apoptosis by interacting with TRAIL-R1/-R2 or CD95/Fas on the surface of diseased cells through the expression of TRAIL and/or Fas ligand (FasL).20 Furthermore, NK cells can interact with inflammatory macrophages through the IFN-γ/TNF-α/IL-12 cytokine axis to enhance each other’s activity and increase inflammation in the infarct area.21 Circulating monocytes are key factors in the pathogenesis of coronary atherosclerosis and its complication,22 namely, atherosclerotic thrombosis. They adhere to activated endothelial cells, permeate the vascular wall, differentiate into macrophages, participate in the development, progression, and activation of atherosclerotic plaques, eventually leading to plaque rupture, causing acute myocardial infarction.22 The continuous recruitment of monocytes to the subcutaneous area is related to the increase in plaque size,23 while inhibiting the influx of monocytes leads to a decrease in plaque progression.24 The correlation analysis showed that MMP9 is positively correlated with M0 macrophages and S100A12 and monocytes, and TGFBR3 is negatively correlated with monocytes, indicating that M0 macrophages and monocytes may be the main targets of oxidative stress-related biomarkers. MXD4 and CEBPG were found to be upstream transcription factors of oxidative stress-related biomarkers. Therefore, we hypothesized SSRP1, MXD4 and CEBPG can enhanced the transcription of MMP9, TGFBR3 and S100A12 which process affects oxidative stress of monocyte through regulating ribosome, leads to its differentiation to Macrophage causing lipid deposition, and finally results in AMI.
In general, our study identified oxidative stress-related biomarkers in AMI for the first time. However, this study has some limitations. One important drawback was that more data were needed to support our clinical application of biomarkers. In future, we will keep focusing on the functions of these markers through various experiments.
Conclusion
Our study looked into how certain genes related to oxidative stress play a role in Acute Myocardial Infarction (AMI). We found differences in gene activity in AMI patients and identified MMP9, TGFBR3, and S100A12 as possible markers linked to oxidative stress. These markers are involved in processes like atherosclerosis, inflammation, and cell death which are important in AMI. We also saw connections between these markers and certain immune cells, mainly M0 macrophages and monocytes. This suggests these cells might be key in AMI. Using qRT-PCR, we confirmed the importance of S100A12 and TGFBR3 as markers for AMI. Our findings help us better understand AMI at the molecular level and point to potential markers for diagnosis and treatment. However, more research is needed to fully understand these findings. Our study offers direction for future work on AMI prevention, diagnosis, and treatment.
Abbreviations
AMI, Acute Myocardial Infarction; DEGs, Differentially Expressed Genes; DE-ORSGs, Differentially Expressed Oxidative Stress-Related Genes; GEO, Gene Expression Omnibus; GSEA, Gene Set Enrichment Analysis; LASSO, Least Absolute Shrinkage and Selection Operator; MMP9, Matrix Metallopeptidase 9; NK, Natural Killer; OSRGs, Oxidative Stress-Related Genes; ROC, Receiver Operating Characteristic; SVM, Support Vector Machine; TGFBR3, Transforming Growth Factor Beta Receptor 3; WGCNA, Weighted Gene Co-expression Network Analysis; qRT-PCR, Quantitative Real-Time Polymerase Chain Reaction; S100A12, S100 Calcium Binding Protein A12.
Data Sharing Statement
We confirm that all data accessed in this study complied with relevant data protection and privacy regulations.
Informed Consent Statement
This study was performed in line with the principles of the Declaration of Helsinki. Approval was granted by the Ethics Committee of The Second Affiliated Hospital of Harbin Medical University (2022.09 IRB: YJSKY2022-308).
Informed consent was obtained from all subjects involved in the study, and written informed consent has been obtained from the patient(s) to publish this paper.
Acknowledgments
We want to show sincere appreciation for the constructive suggestion provided by our colleagues in the Department of Cardiology. We would also like to express our gratitude to the data analysis platform Bigpt (biogpt.org.cn) for their data support, making our research more comprehensive and accurate.
Disclosure
The authors report no conflicts of interest in this work.
References
1. Liu B, Chen Y, St Clair DK. ROS and p53: a versatile partnership. Free Radic Biol Med. 2008;44(8):1529–1535. doi:10.1016/j.freeradbiomed.2008.01.011
2. Suematsu N, Tsutsui H, Wen J, et al. Oxidative stress mediates tumor necrosis factor-alpha-induced mitochondrial DNA damage and dysfunction in cardiac myocytes. Circulation. 2003;107(10):1418–1423. doi:10.1161/01.CIR.0000055318.09997.1F
3. Cailleret M, Amadou A, Andrieu-Abadie N, et al. N-acetylcysteine prevents the deleterious effect of tumor necrosis factor-(alpha) on calcium transients and contraction in adult rat cardiomyocytes. Circulation. 2004;109(3):406–411. doi:10.1161/01.CIR.0000109499.00587.FF
4. Chen L, Gong P, Su Y, et al. Angiotensin II type 2 receptor agonist attenuates LPS-induced acute lung injury through modulating THP-1-derived macrophage reprogramming. Naunyn Schmiedebergs Arch Pharmacol. 2023. doi:10.1007/s00210-023-02589-0
5. Lagan J, Naish JH, Fortune C, et al. Myocardial involvement in eosinophilic granulomatosis with polyangiitis evaluated with cardiopulmonary magnetic resonance. Int J Cardiovasc Imaging. 2021;37(4):1371–1381. doi:10.1007/s10554-020-02091-1
6. Cheng Y, Luo D, Zhao Y, Rong J. N-Propargyl caffeate amide (PACA) prevents cardiac fibrosis in experimental myocardial infarction by promoting pro-resolving macrophage polarization. Aging. 2020;12(6):5384–5398. doi:10.18632/aging.102959
7. Liu LL, Lu JL, Chao PL, Lin LR, Zhang ZY, Yang TC. Lower prevalence of circulating invariant natural killer T (iNKT) cells in patients with acute myocardial infarction undergoing primary coronary stenting. Int Immunopharmacol. 2011;11(4):480–484. doi:10.1016/j.intimp.2010.12.019
8. Smekal A, Vaclavik J. Adipokines and cardiovascular disease: a comprehensive review. Biomed Pap Med Fac Univ Palacky Olomouc Czech Repub. 2017;161(1):31–40. doi:10.5507/bp.2017.002
9. Zhou F, Liu D, Ning HF, Yu XC, Guan XR. The roles of p62/SQSTM1 on regulation of matrix metalloproteinase-9 gene expression in response to oxLDL in atherosclerosis. Biochem Biophys Res Commun. 2016;472(3):451–458. doi:10.1016/j.bbrc.2016.01.065
10. Garvin P, Jonasson L, Nilsson L, Falk M, Kristenson M, Li Y. Plasma matrix metalloproteinase-9 levels predict first-time coronary heart disease: an 8-year follow-up of a community-based middle aged population. PLoS One. 2015;10(9):e0138290. doi:10.1371/journal.pone.0138290
11. Tan X, Dai Q, Sun H, et al. Systematic bioinformatics analysis based on public and second-generation sequencing transcriptome data: a study on the diagnostic value and potential mechanisms of immune-related genes in acute myocardial infarction. Front Cardiovasc Med. 2022;9:863248. doi:10.3389/fcvm.2022.863248
12. Xie J, Luo C, Mo B, et al. Inflammation and oxidative stress role of S100A12 as a potential diagnostic and therapeutic biomarker in acute myocardial infarction. Oxid Med Cell Longev. 2022;2022:2633123. doi:10.1155/2022/2633123
13. Wallace DC, Fan W, Procaccio V. Mitochondrial energetics and therapeutics. Annu Rev Pathol. 2010;5(1):297–348. doi:10.1146/annurev.pathol.4.110807.092314
14. Kumar V, Prabhu SD, Bansal SS. CD4(+) T-lymphocytes exhibit biphasic kinetics post-myocardial infarction. Front Cardiovasc Med. 2022;9:992653. doi:10.3389/fcvm.2022.992653
15. Lillo R, Graziani F, Franceschi F, et al. Inflammation across the spectrum of hypertrophic cardiac phenotypes. Heart Fail Rev. 2023;28(5):1065–1075. doi:10.1007/s10741-023-10307-4
16. Becker RC, Owens AP, Sadayappan S. Tissue-level inflammation and ventricular remodeling in hypertrophic cardiomyopathy. J Thromb Thrombolysis. 2020;49(2):177–183. doi:10.1007/s11239-019-02026-1
17. Matthia EL, Setteducato ML, Elzeneini M, et al. Circulating biomarkers in hypertrophic cardiomyopathy. J Am Heart Assoc. 2022;11(23):e027618. doi:10.1161/JAHA.122.027618
18. Kumar V, Rosenzweig R, Asalla S, Nehra S, Prabhu SD, Bansal SS. TNFR1 contributes to activation-induced cell death of pathological CD4(+) T lymphocytes during ischemic heart failure. JACC Basic Transl Sci. 2022;7(10):1038–1049. doi:10.1016/j.jacbts.2022.05.005
19. Peet C, Ivetic A, Bromage DI, Shah AM. Cardiac monocytes and macrophages after myocardial infarction. Cardiovasc Res. 2020;116(6):1101–1112. doi:10.1093/cvr/cvz336
20. Prager I, Watzl C. Mechanisms of natural killer cell-mediated cellular cytotoxicity. J Leukoc Biol. 2019;105(6):1319–1329. doi:10.1002/JLB.MR0718-269R
21. Knorr M, Munzel T, Wenzel P. Interplay of NK cells and monocytes in vascular inflammation and myocardial infarction. Front Physiol. 2014;5:295. doi:10.3389/fphys.2014.00295
22. Fiorelli S, Anesi A, Porro B, et al. Lipidomics analysis of monocytes from patients with acute myocardial infarction reveals lactosylceramide as a new player in monocyte migration. FASEB J. 2021;35(5):e21494. doi:10.1096/fj.202001872RRR
23. Swirski FK, Pittet MJ, Kircher MF, et al. Monocyte accumulation in mouse atherogenesis is progressive and proportional to extent of disease. Proc Natl Acad Sci U S A. 2006;103(27):10340–10345. doi:10.1073/pnas.0604260103
24. Potteaux S, Gautier EL, Hutchison SB, et al. Suppressed monocyte recruitment drives macrophage removal from atherosclerotic plaques of Apoe-/- mice during disease regression. J Clin Invest. 2011;121(5):2025–2036. doi:10.1172/JCI43802
 © 2023 The Author(s). This work is published and licensed by Dove Medical Press Limited. The full terms of this license are available at https://www.dovepress.com/terms.php and incorporate the Creative Commons Attribution - Non Commercial (unported, v3.0) License.
By accessing the work you hereby accept the Terms. Non-commercial uses of the work are permitted without any further permission from Dove Medical Press Limited, provided the work is properly attributed. For permission for commercial use of this work, please see paragraphs 4.2 and 5 of our Terms.
© 2023 The Author(s). This work is published and licensed by Dove Medical Press Limited. The full terms of this license are available at https://www.dovepress.com/terms.php and incorporate the Creative Commons Attribution - Non Commercial (unported, v3.0) License.
By accessing the work you hereby accept the Terms. Non-commercial uses of the work are permitted without any further permission from Dove Medical Press Limited, provided the work is properly attributed. For permission for commercial use of this work, please see paragraphs 4.2 and 5 of our Terms.