
Back to Journals » Journal of Inflammation Research » Volume 18
Identification of Mitochondrial Unfolded Protein Response-Related Genes and Diagnostic Biomarkers in Atherosclerosis by Integrative Multidimensional Analysis and Experimental Validation
Authors Wu S, Liu Y, Li Y, Lai J, Wan Q, Wu J, Ma Y
Received 28 August 2025
Accepted for publication 18 November 2025
Published 27 November 2025 Volume 2025:18 Pages 16637—16665
DOI https://doi.org/10.2147/JIR.S562903
Checked for plagiarism Yes
Review by Single anonymous peer review
Peer reviewer comments 2
Editor who approved publication: Prof. Dr. Chengming Fan
Shuguang Wu,1,2 Yanhong Liu,3 Yu Li,2 Junyu Lai,3 Qiang Wan,3 Jianguang Wu,2,3 Yirong Ma2
1Jiangxi Province Hospital of Integrated Chinese & Western Medicine, Nanchang, People’s Republic of China; 2Jiangxi University of Chinese Medicine, Nanchang, People’s Republic of China; 3Cardiology Department, Affiliated Hospital of Jiangxi University of Chinese Medicine, Nanchang, People’s Republic of China
Correspondence: Yirong Ma, Email [email protected] Jianguang Wu, Email [email protected]
Background: Atherosclerosis (AS) is a common cardiovascular disease worldwide. The mitochondrial unfolded protein response (UPRmt) is a defense mechanism that enhances protein folding and degradation to maintain mitochondrial function and cellular homeostasis under stress. Research suggests a strong link between mitochondrial dysfunction and AS, particularly related to oxidative stress and inflammation. However, the exact relationship between UPRmt and AS is unclear. Identifying biomarkers associated with UPRmt is crucial for improving AS diagnosis and treatment.
Methods: Microarray datasets related to AS were retrieved from the Gene Expression Omnibus (GEO) database. After integrating these datasets and eliminating batch effects, we obtained 101 AS and 67 control samples. Based on the expression levels of UPRmt-related genes (MRGs), the samples were classified into two subtypes and subjected to differential analysis, weighted correlation network analysis, and immune infiltration analysis. A predictive model was built using 12 machine learning algorithms to identify hub genes associated with UPRmt. Additionally, single-cell RNA-seq data and the CellChat algorithm were used to explore intercellular communication mechanisms mediated by these hub genes in AS. Mendelian randomization analysis was performed to identify biomarkers linked to AS. Molecular simulation techniques assessed the therapeutic potential of Iloprost. Finally, the expression and distribution of core genes were analyzed by RT-qPCR, Western blot, and immunofluorescence.
Results: We identified seven hub genes at the intersection of UPRmt dysregulation and atherosclerosis. These genes showed consistent differential expression across cohorts and formed coherent mitochondria-stress modules. Their expression correlated with multiple immune-cell infiltration scores, including macrophage and T-cell signatures, and with inflammatory mediators. A classifier based on the seven-gene panel distinguished atherosclerotic from non-atherosclerotic samples across external datasets and remained robust after accounting for clinical covariates. Experimental assays confirmed altered expression of selected genes and their modulation under mitochondrial stress. Molecular simulation suggested that Iloprost can bind to the APOC1 protein’s active pocket.
Conclusion: ARHGAP25, CYTH4, ITGB7, APOC1, WDFY4, MARCO and PLCB2 are pivotal genes intimately linked to AS and the UPRmt. They potentially play crucial roles in mitochondrial dysfunction and immune regulation. As such, these genes may be promising biomarkers and therapeutic targets for AS.
Keywords: atherosclerosis, mitochondrial unfolded protein response, machine learning, immune infiltration, single-cell sequencing analysis, molecular dynamics
Introduction
Atherosclerosis (AS) is a complex, multifactorial disease characterised by endothelial dysfunction and abnormal lipid metabolism, culminating in chronic inflammation and plaque formation.1,2 Aberrant activation of immune cells and sustained release of pro-inflammatory cytokines drive structural and functional decline of the vascular wall.3 Globally, AS is a leading cause of cardiovascular disease; prevalence increased from 271 million in 1990 to 523 million in 2019 and deaths from 12.1 to 18.6 million.4,5
These trends have intensified efforts to dissect molecular mechanisms, particularly the crosstalk between oxidative stress and immunity. Oxidised low-density lipoprotein (LDL) accumulation in endothelium triggers cellular stress and LOX-1–NF-κB signalling, promoting release of cytokines such as IL-6 and TNF-α.6–8 Toll-like receptors (TLRs) recognise PAMPs and DAMPs, amplifying immune-cell recruitment and activation, thereby aggravating inflammation and plaque instability.9,10 New therapies, including PCSK9 inhibitors and anti-inflammatory agents, reduce cardiovascular events, yet overall efficacy remains suboptimal; multi-omics biomarker discovery may help refine treatment strategies.11,12 Nevertheless, there is a need to improve treatment efficacy for patients with AS. In the future, employing rapidly advancing multi-omics approaches to identify new therapeutic biomarkers will be crucial in refining treatment strategies for AS.
Mitochondria are essential energy converters in eukaryotic cells, crucial for ATP production and play a pivotal role in regulating cellular apoptosis, signal transduction, reactive oxygen species (ROS) processing, and disease-associated metabolic pathways.13,14 The UPRmt is a cellular defense mechanism activated under conditions of protein misfolding or stress accumulation in eukaryotic cells. It promotes the folding, repair, and degradation of proteins by enhancing the transcriptional activity of specific genes, thus preserving mitochondrial functional integrity and cellular viability.15–17 In pathological states characterized by increased oxidative stress or mitochondrial DNA damage, the activation of UPRmt plays a critical role in mitigating disease progression, primarily through the reduction of mitochondrial damage and the maintenance of cellular metabolic homeostasis.18,19 Furthermore, UPRmt modulates gene expression through the regulation of retrograde signaling from mitochondria to the nucleus, aiding the cellular adaptive responses to diverse environmental stressors, including temperature variations and nutritional shortages.20
The regulatory network of the UPRmt comprises various signaling pathways and transcription factors, including ATF5, CHOP, and HSP60. These components interact to form a sophisticated network that improves cellular adaptability and response accuracy under stress. In disease models such as cardiovascular and neurodegenerative diseases, cancer, and metabolic disorders, mitochondrial dysfunction is intricately associated with disease progression. Strategies that target mitochondrial function regulation or enhancement through UPRmt have demonstrated significant therapeutic potential. Specifically, in cardiovascular diseases, UPRmt activation is tightly linked to cardiomyocyte protection and cardiac function improvement, highlighting its potential in the prevention and treatment of these diseases.21,22 Furthermore, UPRmt plays a pivotal role in modulating immune-inflammatory responses. Mitochondrial damage-induced mtDNA release can initiate intracellular inflammatory reactions, but UPRmt can mitigate these reactions by reducing mtDNA release. Additionally, UPRmt’s regulatory effects contribute to alleviating oxidative stress and suppressing the activation of inflammatory pathways, thus decelerating AS progression.23–25 UPRmt also enhances the metabolic flexibility and stress response capabilities of immune cells like macrophages, affecting their polarization states and significantly influencing both local and systemic inflammation regulation.26,27 Therefore, the UPRmt is not only a crucial internal stress response mechanism but also a vital connector of metabolic health, immune regulation, and disease progression. Its potential value in future disease treatments warrants further investigation.
Although the UPRmt is linked to oxidative and inflammatory responses and growing evidence implicates it in cardiovascular and immune-inflammatory processes, its specific impact on atherosclerosis—and the molecular mediators involved—has not been systematically characterised. This study aimed to identify UPRmt-related biomarkers in AS using integrative bioinformatics, machine learning, and experimental validation. We employed a comprehensive approach to investigate the role of UPRmt in the development of AS, examining the effects of MRGs across different AS subtypes. Machine learning techniques were utilized to develop predictive models, identifying key UPRmt-related genes, which were then validated using an AS validation dataset. Additionally, we constructed a transcription factor (TF)-mRNA-miRNA network, predicted potential therapeutic drugs, and analyzed the complex interactions between hub genes and the AS immune microenvironment. This work provides novel insights into the role of immune regulation in disease progression and validates the expression levels and distribution of these genes in animal models. The workflow and key findings of this study are illustrated in Figure 1. Our results offer valuable insights for understanding the complex pathological mechanisms of AS and for the development of therapeutic strategies targeting UPRmt-related factors.
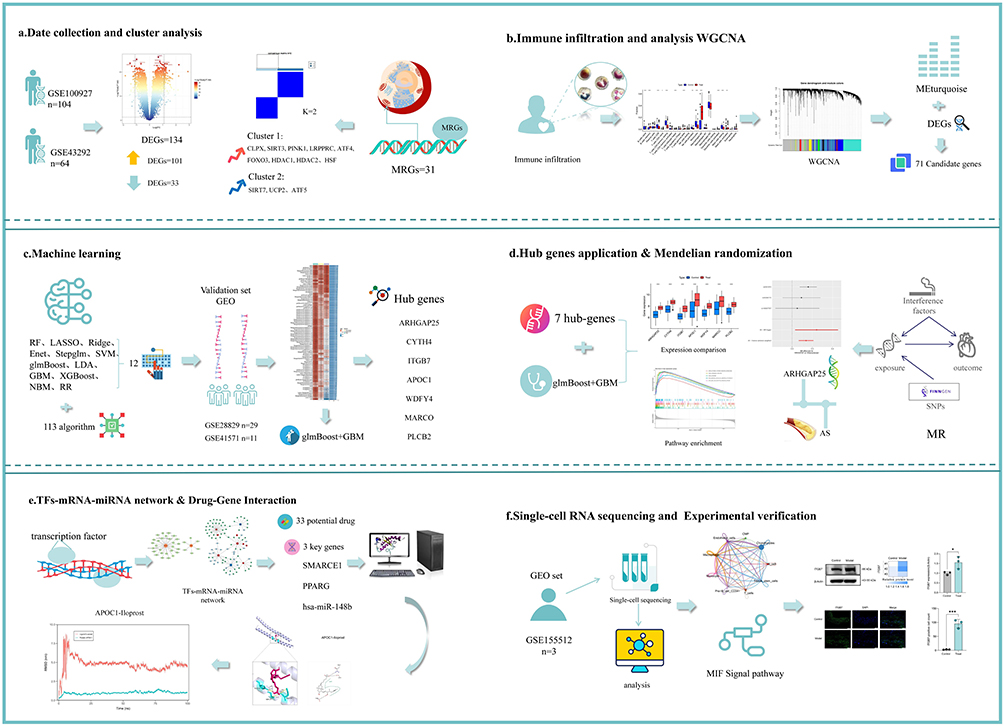 |
Figure 1 Workflow of the analysis. |
Method
Data Collection
Using “Atherosclerosis” as the search term, four microarray datasets—GSE100927, GSE43292, GSE28829 and GSE41571—were retrieved from the GEO database. Specifically, GSE100927 includes 69 atherosclerotic and 35 healthy arterial samples, GSE43292 comprises 32 atherosclerotic plaque and 32 distal macroscopically intact tissue samples, GSE28829 contains 16 late-stage and 13 early-stage atherosclerotic plaque samples, and consists of 5 ruptured plaque and 6 stable plaque samples. We employed the “SVA” package in R software to integrate the GSE100927 and GSE43292 datasets and to correct for batch effects,28 using GSE28829 and GSE41571 as validation sets. Furthermore, 31 MRGs were identified from previous studies,29–31 (Supplementary Material 1).
Differential Gene Expression Screening
We utilized the Limma package in R software (version 4.4.1) to identify DEGs, setting the criteria as Log2|fold change (FC)| > 1.1 and P-value < 0.05.32 Visualization of these DEGs was achieved using the “ggplot” package, which facilitated the creation of volcano plots and heatmaps for the top 50 ranked genes. Additionally, we conducted functional enrichment analysis of the DEGs using the “clusterProfiler” package. This analysis was instrumental in delineating the roles of these genes within biological processes, cellular components, and molecular functions, and in identifying their pivotal positions in metabolic or signaling pathways.33,34
Consensus Clustering Analysis
To conduct the primary analysis, we integrated data from two distinct microarray datasets, GSE100927 and GSE43292, creating a merged dataset. Consensus clustering analysis was executed using the “ConsensusClusterPlus” package.35 We set the maximum number of clusters (maxK) to 9, based on the gene expression levels in the treatment group samples. The process included 50 repeated iterations, with each iteration randomly selecting 80% of the features for clustering to increase the robustness of the analysis. To identify the optimal number of clusters, we examined the cumulative distribution function curves and the heatmaps produced from the consistency matrix. These procedures systematically evaluated the consistency among samples, thereby enhancing the reliability and accuracy of the clustering outcomes.
WGCNA Analysis
We conducted an analysis of categorized gene expression data using the “WGCNA” package in R to explore the correlations between genes and phenotypes.36 Initially, we processed sample data from two categories, C1 and C2, following the consensus clustering results. We calculated the Pearson correlation coefficients for all gene pairs to generate a correlation matrix, subsequently transformed into a weighted adjacency matrix using a specific method. We then selected an optimal soft-thresholding power (b) to compute adjacency, converting the matrix into a topological overlap matrix (TOM) to enhance network robustness and minimize noise interference. From the dissimilarity measure of the TOM, we used average linkage hierarchical clustering to categorize genes with similar expression patterns into modules, setting a minimum module size of 60 genes. Additionally, we focused on correlating module eigengenes with specific phenotypes to identify crucial gene modules.
Construction of Biomarkers and Diagnostic Features Based on Machine Learning
The intersection of DEGs identified from differential analyses with key module genes from WGCNA analysis revealed candidate diagnostic genes associated with MRGs. To develop a highly accurate and stable diagnostic model, we integrated 12 machine learning algorithms across 113 combinations. These algorithms included Random Forest (RF), LASSO, Ridge Regression, Elastic Net (Enet), Stepwise GLM, Support Vector Machine (SVM), glmBoost, Linear Discriminant Analysis (LDA), Gradient Boosting Machine (GBM), XGBoost, and Naive Bayes. The model development process encompassed several steps: (a) identification of expression profiles for candidate hub genes associated with MRGs; (b) application of 113 algorithm combinations to these candidate hub genes using a merged dataset from GSE100927 and GSE43292 for 10-fold cross-validation; (c) model validation using datasets GSE28829 and GSE41571; (d) calculation of the area under the curve (AUC) for each model, selecting the combination with the highest average AUC as the indicator of the most promising model, and identifying the top seven diagnostic hub genes. We visualized the optimal predictive model using bar charts, calibration curves, and decision curves, employing packages such as “rms” and “rmda”.
Gene Set Variation Analysis
Gene Set Variation Analysis (GSVA) is an unsupervised, non-parametric approach that assesses gene set enrichment within transcriptomic data. This technique converts gene-level expression variations into pathway-level functional changes, assigning scores that reflect the activation or inhibition status of each gene set in individual samples. In our study, we extracted relevant gene sets from version 7.0 of the Molecular Signatures Database (MsigDB) and employed GSVA to evaluate the variations in biological functions across diverse samples comprehensively. Prior to analysis, we normalized all gene expression data to enhance the accuracy and reproducibility of our findings.
Gene Set Enrichment Analysis
This study employed Gene Set Enrichment Analysis (GSEA) to determine the statistical significance of expression differences across predefined gene sets between various biological states. GSEA computes association scores between gene sets and phenotypes, ranks these scores based on empirical distributions, and assesses the significance of enrichment by comparing the enrichment scores (ES) to those from a random distribution. We used the gene set c5.go.bp.v7.5.1.entrez.gmt, setting the significance criteria for enrichment analysis at a p-value below 0.05, an absolute Normalized Enrichment Score (NES) above 1, and a False Discovery Rate (FDR) q-value below 0.05. Additionally, the enrichment plots illustrate the top five activating and inhibitory pathways for each pivotal gene under two disease conditions, highlighting variations in functional phenotypes and their associated biological pathways.
Immune Infiltration Analysis
To further explore immune system changes in AS patients, this study employed the CIBERSORT R package and the LM22 gene signature from the CIBERSORT website to quantitatively analyze 22 types of immune cells.37 Subsequently, we investigated the relationships between various immune cell phenotypes and key genes using Pearson correlation analysis. These associations were then graphically represented using suitable visualization techniques.
Predicting Transcription Factors and miRNAs
Utilizing the ENCODE and TarBase databases, we constructed TF-gene and gene-miRNA regulatory networks using the NetworkAnalyst 3.0 platform. The ENCODE database offers extensive annotated data on functional elements of human and mouse genomes, such as gene expression, transcription factor binding sites, and epigenetic modifications. Similarly, the miRTarBase provides experimentally validated data on miRNA-target mRNA interactions, crucial for studies on gene regulation and function. Finally, we visualized these interactions using Cytoscape.
Predicting Therapeutic Drugs
The Drug-Gene Interaction Database (DGIdb, http://www.dgidb.org)38 is a repository that integrates information on drug-gene interactions, offering data on genes as drug targets, gene-drug sensitivity, and gene-drug interactions. In this study, we utilized DGIdb to identify potential drugs targeting biomarkers, thereby discovering new therapeutic targets. These targets were then visualized using Cytoscape.
Mendelian Randomization Analysis
Mendelian randomisation (MR) was used to test the causal effect of core-gene expression on AS. Analyses were performed in R (v4.4.1) with the TwoSampleMR package using summary statistics from FinnGen. For each gene, we selected cis-acting variants and retained at least three independent instruments after linkage-disequilibrium clumping (r2<0.001; 10,000-kb window). Exposure and outcome datasets were harmonised, removing palindromic or ambiguous SNPs; variants showing association with the outcome at P ≤ 1×10⁻⁵ were excluded. The inverse-variance weighted (IVW) estimator was the primary analysis, complemented by MR-Egger, weighted-median and mode-based methods for sensitivity. Horizontal pleiotropy and robustness were further assessed using MR-PRESSO (global and outlier tests), Cochran’s Q for heterogeneity, and leave-one-out analysis.
Single-Cell Sequencing Analysis
In this study, we obtained single-cell RNA sequencing data of atherosclerotic plaques from three patients from the GEO database (GSE155512). Data analysis was conducted using the Seurat software package.39 To ensure data quality, we excluded cells that met any of the following criteria: fewer than 300 or more than 10,000 detected genes, mitochondrial gene expression ratios exceeding 10%, or fewer than 500 unique molecular identifiers (UMIs). Additionally, we removed low-expression genes present in fewer than five cells. We then normalized the filtered data using the LogNormalize method and identified 2000 highly variable genes through the FindVariableFeatures function. Subsequent analyses included principal component analysis (PCA), clustering using Seurat’s “FindClusters” function, and visualization with UMAP (Uniform Manifold Approximation and Projection), a nonlinear dimensionality reduction technique. For cell population annotation, we used “singleR” package (version 1.2).40 Lastly, we utilized CellChat software (version 1.6.1)41 to infer potential signaling interactions between cells, based on a predefined ligand-receptor pair database, which helped elucidate their roles and interactions in biological processes.
Molecular Docking and MD Simulations
In this study, molecular structures of the required compounds were retrieved from the PubChem database (https://pubchem.ncbi.nlm.nih.gov/), while three-dimensional structures of key proteins were obtained from the Protein Data Bank (PDB, https://www.rcsb.org/). Molecular docking was conducted using AutoDock Vina software to predict the likelihood and strength of interactions by evaluating binding modes of various ligands with the target protein. A lower docking score indicates a higher binding affinity and greater stability between ligand and protein, essential for screening effective drug candidates. To validate the molecular docking results, PyMOL software was used for 3D visualization, providing a detailed view of ligand-protein binding interactions. Additionally, molecular dynamics simulations were performed using Gromacs software to analyze the dynamic behavior and stability of molecular structures under physiological conditions. These simulations revealed structural changes over time, enhancing our understanding of molecular interactions and their mechanical and dynamic properties, which are crucial for predicting bioactivity and function. By integrating these computational approaches, we conducted a comprehensive assessment of candidate molecule efficacy and safety, laying a scientific foundation for further drug development.
Animals
The control group consisted of 10 male C57BL/6J mice, 8 weeks old, maintained under specific pathogen-free (SPF) conditions. The experimental group comprised 10 male APOE knockout mice (C57BL/6J strain), also 8 weeks old. AS was induced in the experimental group by feeding the mice a high-fat diet for 12 weeks. All mice weighed approximately 20 grams and were purchased from Spaf-Bio (Beijing) Biotechnology Co., Ltd. (License No. SCXK (Beijing) 2024–0001). The animals were housed in an SPF facility with a 12-hour light/dark cycle and were acclimatized for at least one week before the experiments. Mice were anaesthetised with intraperitoneal injection of 5% sodium pentobarbital solution at 1.0 mL/kg. For humane endpoints, animals were euthanised with an overdose of 5% sodium pentobarbital at 3.0 mL/kg, in accordance with the AVMA Guidelines for the Euthanasia of Animals (2020 edition). All mice were housed in the SPF laboratory at Jiangxi University of Chinese Medicine, and the experimental procedures were approved by the Ethics Committee of Jiangxi University of Chinese Medicine (Ethics Approval No. 20240312025). Regarding the animal experiment sample size, the sample size was set a priori with reference to prior atherosclerosis studies and study feasibility, in accordance with the ARRIVE guidelines.
RT-qPCR
Total RNA was extracted using the Molpure® Cell/Tissue Total RNA Kit (YEASEN, 19221ES50, China). The extracted RNA was then converted into complementary DNA (cDNA) using the PrimeScript RT Reagent Kit (Bioray Biotechnology Co., Ltd., RR047A, China). PCR amplification was conducted on a QuantStudio TM3 Real-Time PCR System (ThermoFisher, USA), using TB Green™ Premix Ex Taq™ II (Tli RNaseH Plus) (Bioray Biotechnology Co., Ltd., RR820A, China) as the PCR reaction mixture. The real-time quantitative PCR results were analyzed using the 2^-ΔΔCT method, with β-actin as the internal reference gene to normalize gene expression levels across all samples. The specific primers used in these RT-qPCR assays are listed in Supplementary Material 2.
Western Blotting
First, the target tissue was washed with PBS and minced. The tissue was then homogenized in a lysis buffer containing protease inhibitors. After incubating on ice for 30 minutes, the lysed samples were centrifuged at high speed to remove cell debris, and the supernatant was collected for protein concentration determination. Protein concentration was measured using the BCA assay, where absorbance at 562 nm was recorded, and a standard curve was plotted to calculate the protein concentration of the samples. The protein samples were subsequently denatured at 95°C to ensure consistent protein concentrations across experimental groups. During Western blotting, PVDF membranes (Sigma-Aldrich, ISEQ00010) were equilibrated and transferred using transfer buffer, with transfer conditions set at 200 mA for 1–2 hours. The membranes were then blocked to reduce background interference and incubated with primary antibodies (ITGB7, Proteintech, 11328-1-AP) and the internal control antibody β-actin (Abclonal, AC026) for detection. Finally, ECL chemiluminescent substrate was used for detection, and bands were imaged using the Tanon chemiluminescence imaging system. The results were analyzed by measuring the optical density of the bands with Gel-Pro Analyzer software.
Immunofluorescence Staining
Immunofluorescence staining was performed on paraffin-embedded sections in this experiment. First, the sections were deparaffinized and rehydrated through a series of xylene and graded alcohol washes. Antigen retrieval was then carried out in a microwave using a retrieval solution for 20 minutes, followed by washing the sections with PBS buffer. To block endogenous peroxidase activity, the sections were incubated in 3% hydrogen peroxide solution in the dark for 25 minutes, then washed three times with PBS. Next, serum blocking was performed using bovine serum albumin (BSA), and the sections were incubated at room temperature for at least 30 minutes. The primary antibody (ITGB7, Proteintech, 11328-1-AP) was applied, and the sections were incubated overnight at 4°C. After washing the sections, the secondary antibody (FITC-conjugated goat anti-rabbit or goat anti-mouse) was added and incubated for 30 minutes at 37°C, followed by PBS washing. Finally, nuclear counterstaining was performed using DAPI, with incubation at room temperature for 10 minutes, and the sections were washed three times with PBS. All sections were mounted with anti-fade mounting medium. Images were captured using an Olympus VS200 scanner, and data analysis was performed using Olympus digital scanning software (OlyVIA) and the image analysis system (Image-Pro Plus) from Media Cybernetics.
Statistical Analysis
Statistical analysis was conducted using GraphPad Prism 10 software. Since the data were normally distributed and met the assumption of homogeneity of variance, independent sample t-tests were performed to compare the differences in continuous variables between the two groups. The correlation between different molecules was assessed using Spearman’s rank correlation analysis. All statistical tests were two-tailed, with a significance level set at a p-value of less than 0.05.
Results
AS Gene Expression Differential Analysis and GO & KEGG Enrichment Results
After merging the GSE100927 and GSE43292 datasets, we normalized the resulting gene expression matrix. The gene expression matrices before and after processing were visualized using two-dimensional PCA plots (Figure 2A and B), demonstrating the reliability of the resultant sample data. A differential analysis on the merged dataset identified 134 DEGs, comprising 101 upregulated and 33 downregulated DEGs. We illustrated the expression patterns of these DEGs using a volcano plot and displayed the top 50 DEGs in a heatmap (Figure 2C and D). Subsequently, we conducted GO and KEGG enrichment analyses on these DEGs. The GO enrichment analysis Biological Process(BP) highlighted significant involvement in the regulation of leukocyte-mediated immunity and immune effector processes. Cellular Component (CC) enrichment was notable in the secretory granule membrane, the outer side of the cell membrane, and tertiary granules. The Molecular Function (MF) results indicated significant enrichment in G protein-coupled receptor binding, cargo receptor activity, and integrin binding (Figure 2E). Finally, KEGG analysis revealed that the primary pathways involved included osteoclast differentiation, chemokine signaling pathway, cytokine receptor interaction, and multiple infectious disease pathways (Figure 2F).
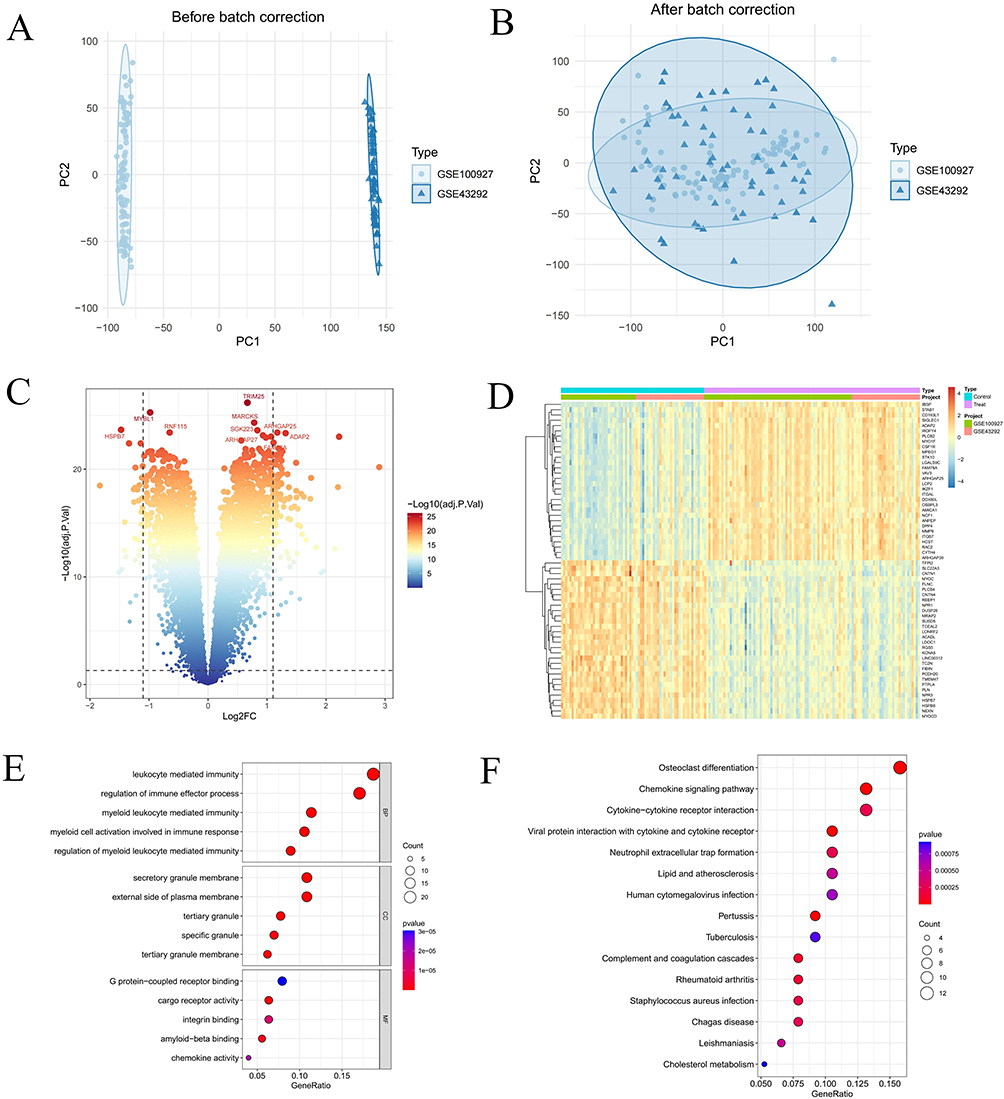 |
Figure 2 Integration of GEO datasets and identification of differentially expressed genes (DEGs). (A and B) Two-dimensional PCA cluster plot of GSE100927 and GSE43292 datasets before and after normalization. (C) Volcano plot of DEGs. Red spots represent upregulated genes and blue spots represent downregulated genes. (D) Heatmap of DEGs. (E) Shows enriched Gene Ontology (GO) analysis items. (F) Shows enriched items from the Kyoto encyclopedia of genes and genomes (KEGG) pathway analysis items; “BP”, biological processes; “MF”, molecular functions; “CC”, cellular component. |
Expression Patterns of MRGs in AS and Analysis of Their Roles in AS Development
To further explore the expression patterns of MRGs in AS, we identified 31 MRGs from previous publications. Our analysis revealed that, within the merged dataset, 18 MRGs exhibited significant expression differences between the control and AS groups (Figure 3A). Specifically, SIRT3, SIRT7, MRPS5, UCP2, ATF5, EP300, and HDAC1 were highly expressed in the AS group, while CLPP, CLPX, PINK1, SSBP1, LRPPRC, TFAM, ATF4, DDIT3, FOXO3, and HSF1 showed higher expression in the control group. Furthermore, we performed a correlation analysis on the MRGs to investigate their roles in the progression of AS (Figure 3B and C).
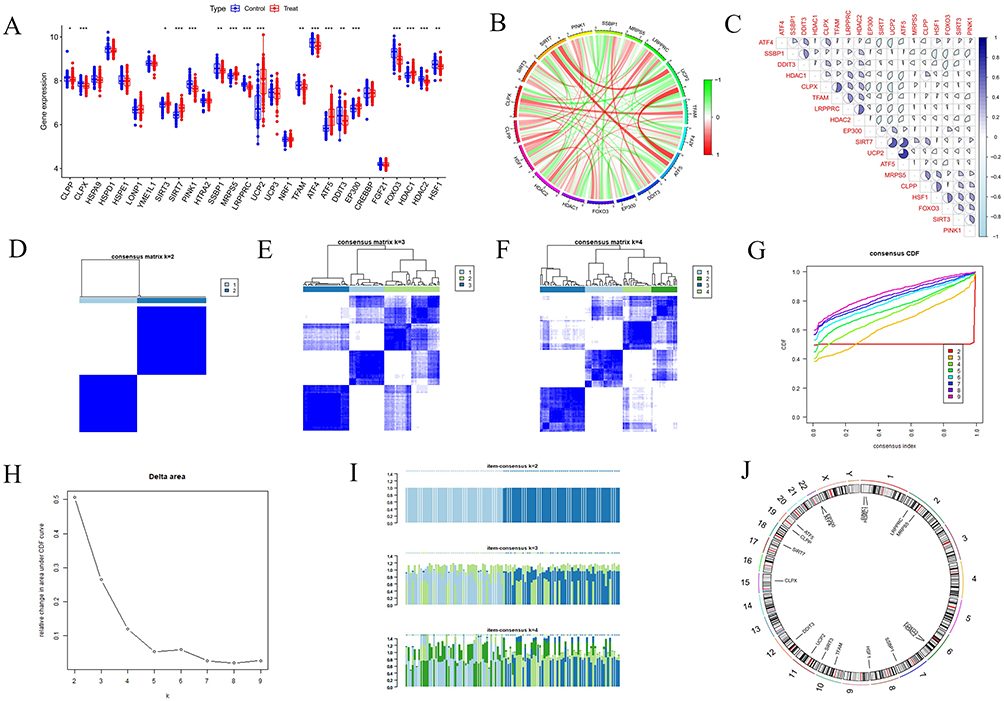 |
Figure 3 Identifying differentially expressed MRGs and establishing consensus clustering analysis. (A) Overall expression landscape of MRGs in AS. *P < 0.05; **P < 0.01; ***P < 0. 001. Treat represents the AS group and Control represents the normal control group. (B and C) Correlation analysis diagram of 18 differentially expressed MRGs. (D–F) Consensus clustering matrixes were generated for values of k ranging from 2 to 4. (G) CDF curves displayed consensus distributions from k=2 to k=9. (H) Illustrates the relative change in area under the cumulative distribution function curve for consensus clustering, with k values ranging from 2 to 9. (I) Depicts the variation in item consensus values for k=2, k=3, and k=4. (J) Displays the expression of 18 differentially expressed MRGs at various positions on human chromosomes, with each position marked by a specific gene. |
Consensus Clustering of AS Based on MRG Expression
In this study, we employed a consensus clustering approach to explore the modulatory patterns of UPRmt in AS, focusing on MRGs expression differences. The analysis indicated that at k=2, the distinction between the two sample clusters was significantly enhanced, establishing two distinct subgroups (Figure 3D–I). Additionally, we visualized the chromosomal distribution of these 18 differentially expressed MRGs (Figure 3J). We then validated these findings using PCA, which confirmed the significant differences in MRGs expression profiles within the merged dataset. Further analysis revealed that 12 genes exhibited significant differential expression between the subgroups (Figure 4A–C). These genes included CLPX, SIRT3, PINK1, LRPPRC, ATF4, FOXO3, HDAC1, HDAC2, and HSF1 with higher expression levels in Group 1, whereas SIRT7, UCP2, and ATF5 were more highly expressed in Group 2. Given that ATF5 significantly enhances UPRmt regulation while SIRT3 inhibits it,42–44 it is hypothesized that patients in Group 2 with high ATF5 expression may experience enhanced UPRmt regulation, whereas those in Group 1 with high SIRT3 expression may experience inhibitory effects.
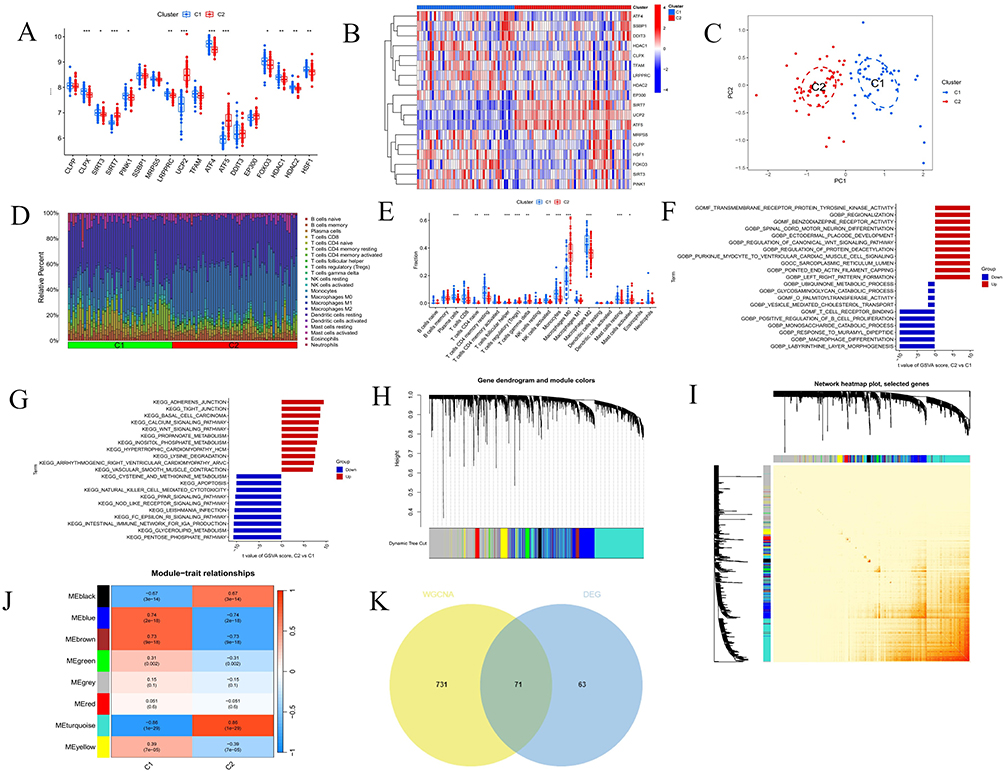 |
Figure 4 Analysis of immune infiltration, enrichment analysis and weighted correlation network analysis (WGCNA) between clusters. (A) The box plot displays the expression patterns of MRGs across two AS clusters *P < 0.05; **P < 0.01; ***P < 0. 001. (B) The heatmap illustrates the differences in expression levels of various genes across C1 and C2. (C) This principal component analysis plot shows the distribution of samples based on C1 and C2. (D) Histogram of proportion of immune cells. (E) Comparison of immune cell proportion between C1 and C2. (F and G) Displays the t-values of GSVA scores from C2 versus C1 based on GO and KEGG enrichment. (H) This gene dendrogram illustrates the hierarchical clustering of genes and their corresponding module colors. (I) Heatmap displays the interactions among selected genes in a network. (J) Heatmap illustrates the module-trait relationship. (K) Venn plot of common genes between DEGs and key modules genes. |
Analysis of Gene Set Expression Activity and Immune Infiltration Between Clusters
To investigate gene set activities in two sample clusters, we conducted GSVA, followed by GO and KEGG enrichment analyses based on the GSVA results. These analyses aimed to identify significantly activated biological processes and signaling pathways in each cluster. Initially, we calculated t-values of the GSVA scores to pinpoint the processes and pathways with the most significant expression differences between Cluster 1 and Cluster 2. We visually presented these differences using bar charts, with the bar length representing the significance of the activity difference. In the GO enrichment analysis, significantly activated biological processes in Cluster 1 included ubiquinone metabolic process, glycosaminoglycan degradation, and O-palmitoyltransferase activity. In contrast, Cluster 2 primarily showed activation in processes such as transmembrane receptor protein tyrosine kinase activity, regionalization, and benzodiazepine receptor activity. The KEGG enrichment analysis revealed that pathways like cysteine and methionine metabolism, apoptosis, and natural killer cell-mediated cytotoxicity were significantly activated in Cluster 1. Conversely, Cluster 2 exhibited significant activation in pathways including propionate metabolism, myo-inositol phosphate metabolism, and the calcium and Wnt signaling pathways (Figure 4F and G).
To accurately depict the distribution of immune cells and their dynamic changes across different immune states, this study employed the CIBERSORT algorithm for a compositional analysis of two immune cell subgroups (cluster C1 and C2). The analysis results are displayed in bar graphs (Figure 4D) and box plots (Figure 4E). The results show that cluster C1 is significantly enriched with plasma cells, naive CD4 T cells, resting CD4 memory T cells, activated NK cells, monocytes, M2 macrophages, and resting mast cells compared to cluster C2. Conversely, cluster C2 has a higher proportion of follicular helper T cells, Tregs, gamma delta T cells, M0 macrophages, and activated mast cells.
Construction of a Diagnostic Feature Model
We conducted WGCNA to identify the modules with the highest connectivity in Clusters 1 and 2. Initially, we excluded three significant outliers from the merged dataset. Using the scale independence and mean connectivity metrics, we determined an appropriate “soft” threshold (b = 13) (Supplementary Material 3). This analysis revealed eight modules. Through clinical correlation analysis, the MEturquoise module exhibited the highest correlation with clinical features (MEturquoise: r = 0.86, p = 1e−29) (Figure 4H–J). Based on this result, we focused further analysis on the MEturquoise module. By intersecting the genes in this module with differentially expressed genes in AS, we identified 71 candidate genes with potential diagnostic value (Figure 4K).
In this study, we developed a comprehensive analytical framework based on machine learning, designed to precisely filter gene expression features closely related to disease states from high-dimensional biomarker data. To achieve this, we employed various machine learning techniques, including RF, GBM and multivariate logistic regression, using merged datasets (training set) and GSE28829, GSE41571 datasets (validation set) for model construction and evaluation. During the model training phase, we implemented 12 machine learning algorithms and conducted 10-fold cross-validation, constructing a total of 113 models. We also calculated the AUC for each model on both training and validation datasets (Figure 5A). The glmBoost+GBM model emerged as the optimal performer across all combinations, achieving an average AUC of 0.975, with AUCs of 0.989, 0.942, and 1.0 in the training and validation sets, respectively (Figure 5B–D). This demonstrates the model’s excellent predictive precision and robust generalization capabilities. Building on the glmBoost+GBM model’s superior performance, we created a confusion matrix to validate the model’s accuracy and practicality (Figure 6A–C). Furthermore, through the glmBoost+GBM model, we identified pivotal genes with the best diagnostic potential, namely ARHGAP25, CYTH4, ITGB7, APOC1, WDFY4, MARCO, and PLCB2, and displayed these findings in a volcano chart (Figure 6D).
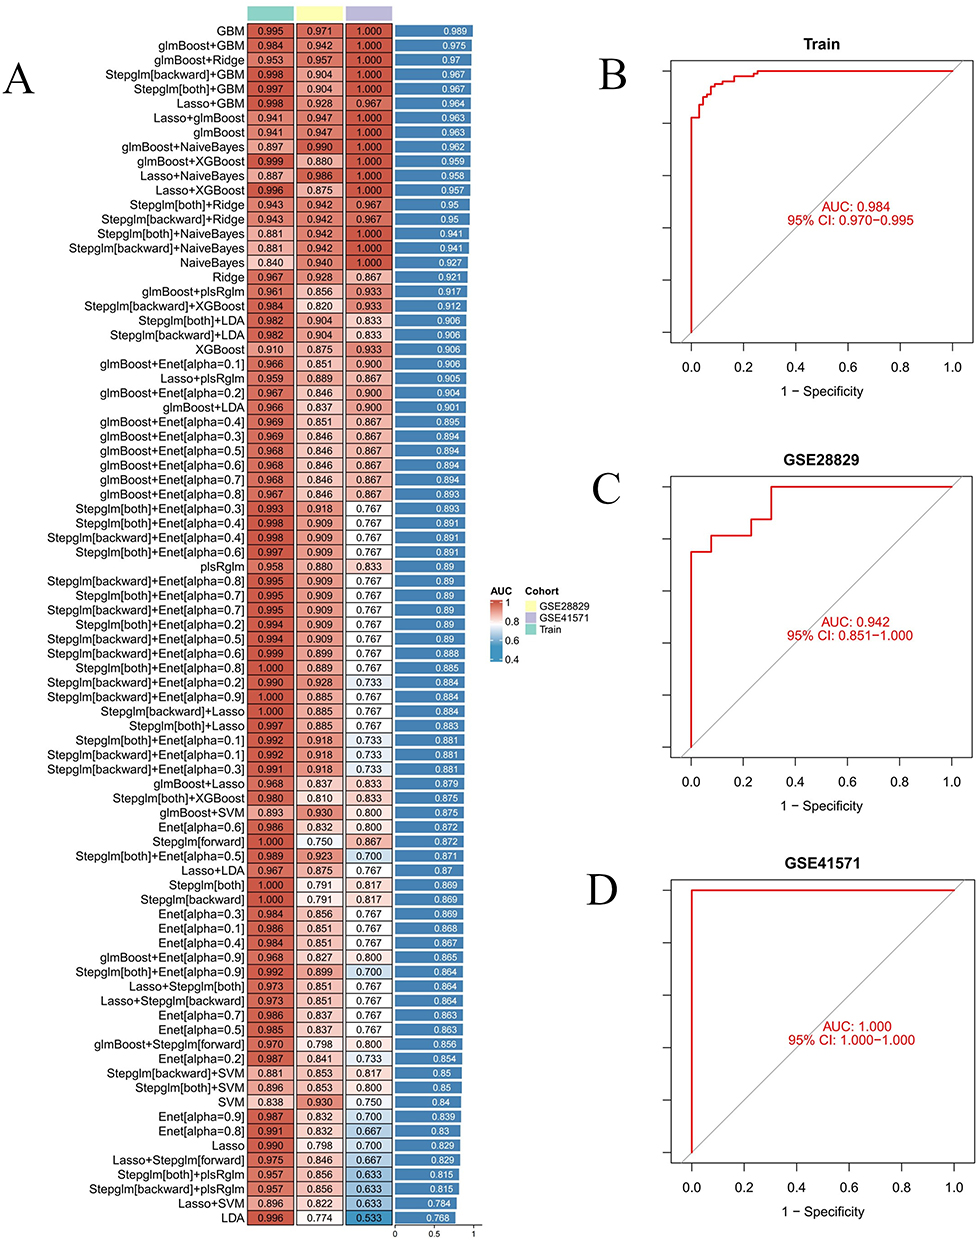 |
Figure 5 Identify hub genes associated with MRGs in two AS groups using a machine learning diagnostic model. (A) Heatmap shows the performance of various machine learning diagnostic models on the training set and two distinct datasets (GSE28829 and GSE41571), evaluated by AUC values. (B–D) ROC curves illustrate the model’s performance on the training set, GSE28829 and GSE41571. |
 |
Figure 6 Acquisition and validation of hub genes, along with the construction of line plots. (A–C) Confusion matrices display the model’s prediction results on the training set, GSE28829 and GSE41571. (D) The volcano plot displays seven hub genes. (E) ROC curve graph illustrates the diagnostic performance of seven hub genes on the training set. (F) Box plot displays the expression differences of seven hub genes between the control and treatment groups. (G and H) Nomogram construction for clinical application, enabling accurate prediction of AS risk based on hub genes expression. (I) Pearson correlation heatmap for the seven hub genes; each cell shows the correlation coefficient. Asterisks indicate statistical significance and are used where shown (F and I): *P < 0.05; **P < 0.01; ***P < 0.001. |
Expression Differences of Hub Genes in AS and Their Diagnostic Applications
In the merged dataset, we compared controls with AS across seven key genes (ARHGAP25, CYTH4, ITGB7, APOC1, WDFY4, MARCO, PLCB2). Density plots showed clear expression shifts for all genes, and box plots confirmed higher expression in AS, indicating significant upregulation (Figure 6F). Additionally, we assessed the diagnostic efficacy of these seven genes for AS, finding that most had AUC values above 0.85, with specific values being ARHGAP25 (0.910), CYTH4 (0.906), ITGB7 (0.884), APOC1 (0.754), WDFY4 (0.894), MARCO (0.744), and PLCB2 (0.900), demonstrating their high diagnostic potential (Figure 6E). Applying the glmBoost+GBM model, we achieved an even higher AUC value of 0.975, indicating superior diagnostic efficacy compared to single biomarkers. Further validation on the GSE28829 and GSE41571 datasets showed that the AUC values for these biomarkers generally exceeded 0.8 (Supplementary Material 4). These results suggest that ARHGAP25, CYTH4, ITGB7, APOC1, WDFY4, MARCO and PLCB2 are all effective potential biomarkers for AS. Subsequently, we plotted density distributions of the pivotal genes to demonstrate the expression variability and statistical significance in the study dataset (Figure 6I).
Additionally, we constructed a nomogram based on the expression levels of these pivotal genes to predict the disease risk for AS. We converted the expression level of each gene into corresponding points (ranging from 5 to 10) and weighted these based on their respective roles in the disease. By aggregating the points from all genes, we calculated a total score, which we then transformed into specific disease risk predictions. This approach clearly illustrates the direct relationship between gene expression levels and disease risk (Figure 6G and H).
Enrichment of Hub Genes in Signaling Pathways
In our GSVA, we observed significant pathway activations associated with the expression of several key genes. High expression of ARHGAP25 significantly upregulated pathways including sphingolipid metabolism, Toll-like receptor signalling, NOD-like receptor signalling, and apoptosis (Figure 7A). Similarly, elevated levels of CYTH4 were notably enriched in pathways such as lysosomes, sulphur metabolism, sphingolipid metabolism, and Toll-like receptor signalling (Figure 7B). ITGB7 expression prominently enriched the Toll-like receptor signalling pathway, as well as fructose and mannose metabolism, and NOD-like receptor signalling (Figure 7C). High expression of APOC1 activated pathways like lysosomes, glycerolipid metabolism, and galactose metabolism (Figure 7D). Elevated expression of WDFY4 activated pathways including lysosomes, sphingolipid metabolism, and Toll-like receptor signalling (Figure 7E). MARCO activation was linked to pathways involved in Vibrio cholerae infection, sulphur metabolism, lysosomes, and galactose metabolism (Figure 7F). PLCB2 expression activated pathways such as the Toll-like receptor signalling pathway, FcγR-mediated phagocytosis, and signalling pathways of B-cell and T-cell receptors (Figure 7G). We also performed single-gene GSEA for these genes and visualised the top five upregulated pathways (Figure 7H–N). Collectively, these results indicate that the pivotal genes are primarily enriched in pathways including cytokine–cytokine receptor interaction, lysosomes, and NOD-like receptor signalling, which are closely related to the onset and progression of AS.
 |
Figure 7 GSVA and GSEA of hub genes. (A–G) GSVA analysis of hub genes (ARHGAP25, CYTH4, ITGB7, APOC1, WDFY4, MARCO and PLCB2). (H–N) GSEA analysis of hub genes (ARHGAP25, CYTH4, ITGB7, APOC1, WDFY4, MARCO and PLCB2). |
Immune Infiltration Analysis
To elucidate the immunological profile of AS and investigate potential immune mechanisms, we utilized the CIBERSORT algorithm to determine the prevalence of 22 immune cell types in a combined dataset. Our findings, depicted in bar graphs and heatmaps (Figure 8A and C), indicate elevated levels of memory B cells, gamma delta T cells, M0 macrophages, and activated mast cells in the AS cohort. In contrast, levels of naive B cells, CD8 T cells, activated CD4 memory T cells, activated NK cells, monocytes, and resting mast cells were decreased (Figure 8B). We assessed the correlations between seven critical genes and immune cells through Spearman correlation analysis, visualized in heatmap and cell association graph (Figure 8D and E). Our analysis showed significant correlations between these genes and various immune cells, with M0 macrophages and regulatory T cells demonstrating strong positive correlations with all critical genes. Conversely, M2 macrophages and resting CD4 memory T cells exhibited significant negative correlations, particularly with ITGB7. These results underscore the pivotal roles of macrophages and T cells in AS pathogenesis.
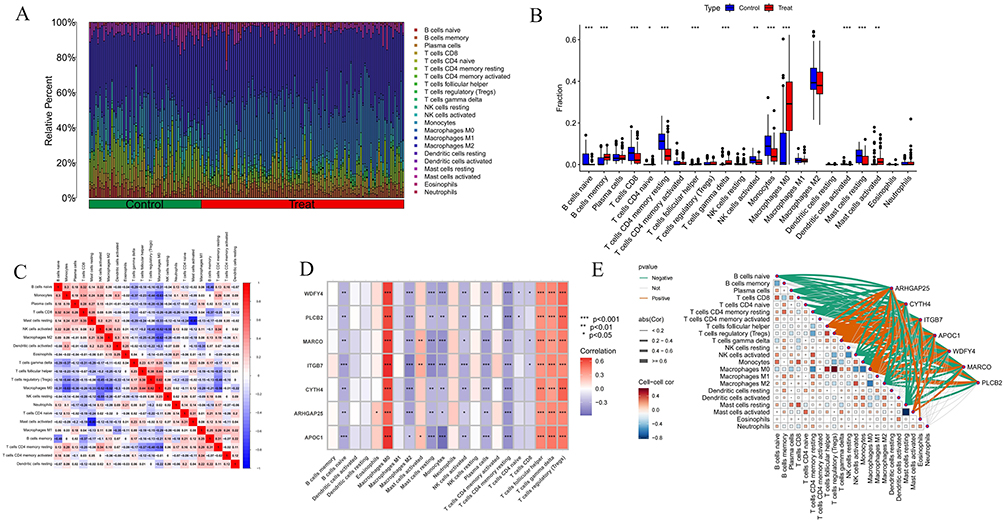 |
Figure 8 Immune infiltration analysis of AS. (A) Histogram of proportion of immune cells. (B) Comparison of immune cell proportion between AS and controls. (C) Heatmap represents a correlation analysis between various immune cell subtypes. (D and E) Correlation analysis between 22 types of immune cells in AS and the expression of hub genes through heatmap and cell association graph. Significance levels are indicated as *P < 0.05; **P < 0.01; ***P < 0.001. |
Construction of Gene-Drug Interactions and TFs-mRNA-miRNA Networks
This study established a gene-drug interaction network, identifying 33 potential drugs that target pivotal genes, thereby providing substantial evidence for personalized treatment and the development of new drugs (Figure 9A). Furthermore, we constructed a TF-mRNA-miRNA regulatory network, consisting of 96 nodes and 104 edges (Figure 9B). This network elucidates the mechanisms of gene expression regulation and their potential implications in disease, offering novel insights for refining diagnostic and therapeutic strategies. Notably, the interactions involving SMARCE1, PPARG, and hsa-miR-148b with various pivotal genes indicate their critical regulatory roles. Nonetheless, these observations require further experimental validation to ascertain their specific functions.
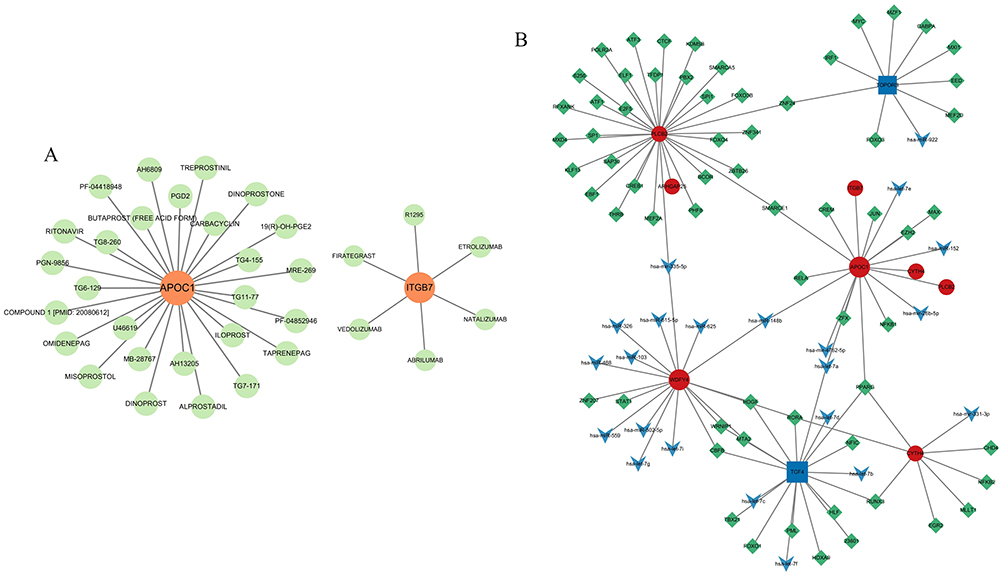 |
Figure 9 Gene-drug interactions and TFs-mRNA-miRNA networks with hub genes. (A) Gene-drug interactions with 2 hub genes (APOC1 and ITGB7). (B) TFs-mRNA-miRNA networks with 7 hub genes (ARHGAP25, CYTH4, ITGB7, APOC1, WDFY4, MARCO and PLCB2). |
Validation of MR Analysis
MR supports a putative causal association between genetically proxied expression of ARHGAP25 and AS. The forest and scatter plots (Figure 10A and B) show concordant effect directions across instruments, with consistent slopes, indicating that higher ARHGAP25 expression is associated with increased AS risk. The funnel plot (Figure 10C) is approximately symmetrical and the IVW and MR-Egger estimates are closely aligned, suggesting limited small-study effects and no strong directional pleiotropy. Leave-one-out analysis (Figure 10D) shows that removal of any single SNP does not materially change the IVW estimate, supporting robustness. Full pleiotropy and heterogeneity diagnostics—including MR-Egger intercept, MR-PRESSO global/outlier tests, and Cochran’s Q—are reported in Supplementary Materials 5–8 and do not indicate substantial violation of MR assumptions. Collectively, these findings implicate ARHGAP25 as a candidate contributor to the aetiology and progression of AS. Taken together, these findings nominate ARHGAP25 as a candidate key gene involved in the aetiology and progression of AS.
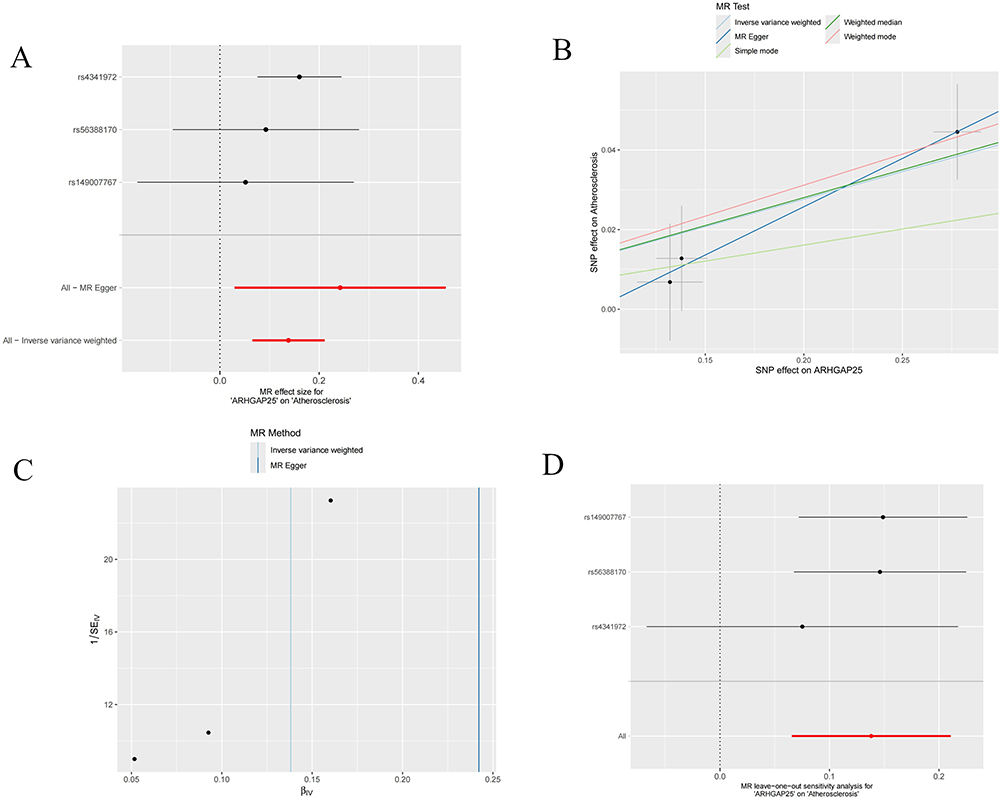 |
Figure 10 Mendelian randomization analysis of hub genes. (A) The forest plot of the causal effects of each SNP in ARHGAP25 on the risk of AS. (B) Scatter plot of the causal effect of ARHGAP25 on the risk of AS. (C) Funnel plot of ARHGAP25 on AS. (D) Leave-one-out plot of ARHGAP25 on AS risk when leaving one SNP out. |
Single-Cell Sequencing Analysis
ScRNA-seq data from three AS plaque samples were analyzed from the GSE155512 dataset using the Seurat package. Employing the UMAP algorithm for clustering, initial quality control selected 2000 genes with the highest expression variability for further analysis (Figure 11A). PCA then reduced data dimensionality, identifying 14 distinct cell clusters. Heatmap was generated to display the genes with significant expression differences across these clusters (Figure 11B). Annotation of these clusters using the SingleR package revealed nine major subpopulations: chondrocytes, macrophages, endothelial cells, T cells, monocytes, common myeloid progenitors (CMP), tissue stem cells, B cells and CD34- pre-B cells (Figure 11C and D). Subsequent analysis highlighted that hub genes were predominantly expressed in macrophages and monocytes, with significant upregulation also observed in T cells for ARHGAP25, CYTH4, ITGB7 and PLCB2 (Figure 11E and F). Additionally, intercellular communication was explored using the CellChat tool, focusing on differentially expressed ligands and receptors to assess potential communication pathways, with results visualized in various formats (Figure 12A–C). Bubble charts illustrated a comprehensive communication network, indicating the likelihood and intensity of specific ligand-receptor interactions (Figure 12D). Heatmap analysis revealed notable differences in the MIF signaling pathway across cell types. Further network analysis assessed communication probabilities among cell populations, defining their roles as signal senders and receivers. Additionally, analysis of ligand-receptor pairs combined with gene expression data underscored the critical molecular interactions and genes in the MIF signaling pathway, emphasizing the complexity and diversity of intercellular signaling (Figure 12E and F). Figure 12G illustrates the relative contributions of MIF ligand-receptor pairs, with the MIF-(CD74+CXCR4) interaction being the most significant. Figure 12H shows the expression of key genes in the MIF signaling pathway across different cell types, revealing high expression levels of MIF and CXCR4 in B cells, T cells and monocytes. Finally, Figure 12I visualizes the cellular communication network, demonstrating that endothelial cells, macrophages, and chondrocytes are the primary signal senders and receivers in the MIF signaling pathway.
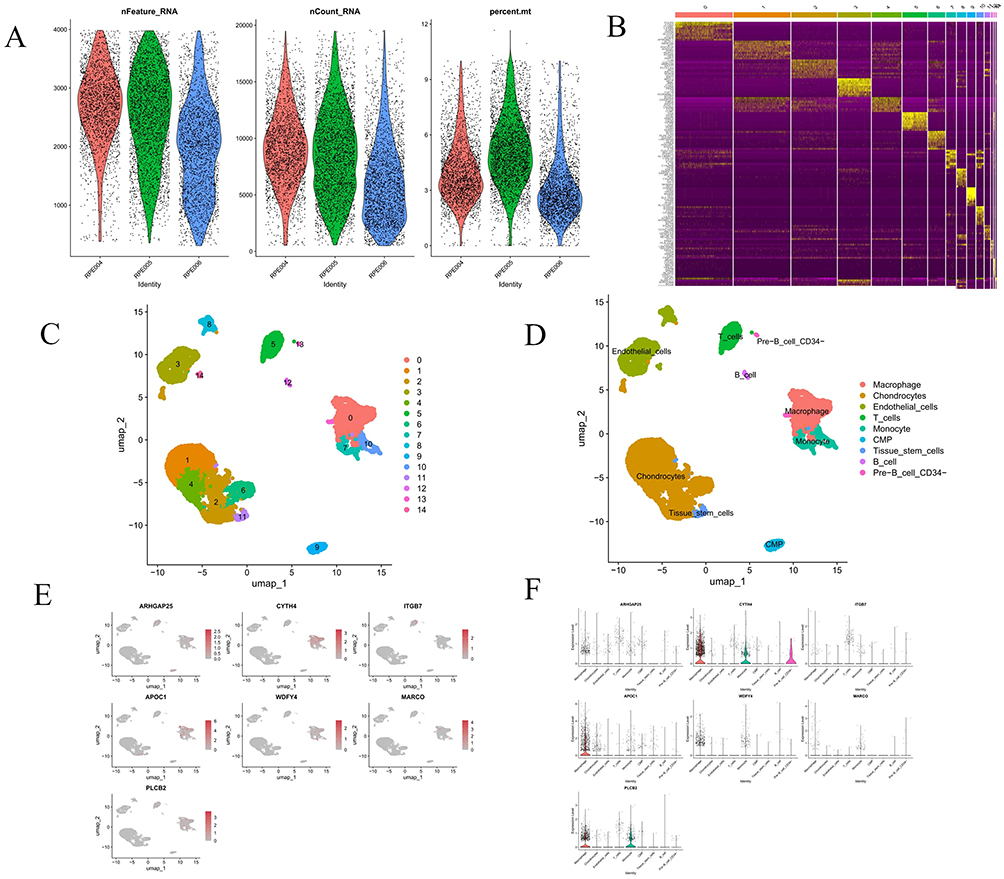 |
Figure 11 Analysis of single-cell RNA sequencing data from three AS samples. (A) Violin plot displays single-cell RNA sequencing data for three sample groups, including the number of RNA features (nFeature_RNA), RNA counts (nCount_RNA), and the percentage of mitochondrial genes (percent.mt). (B) Heatmap depicts the expression levels of the top 10 marker genes among 14 detected cell clusters. (C and D) UMAP plots display the distribution of various cell types, each represented by a different color, revealing the spatial relationships and clustering patterns among cell subtypes. (E and F) The UMAP plot and violin plot show the expression distribution of selected hub genes across different cell types. |
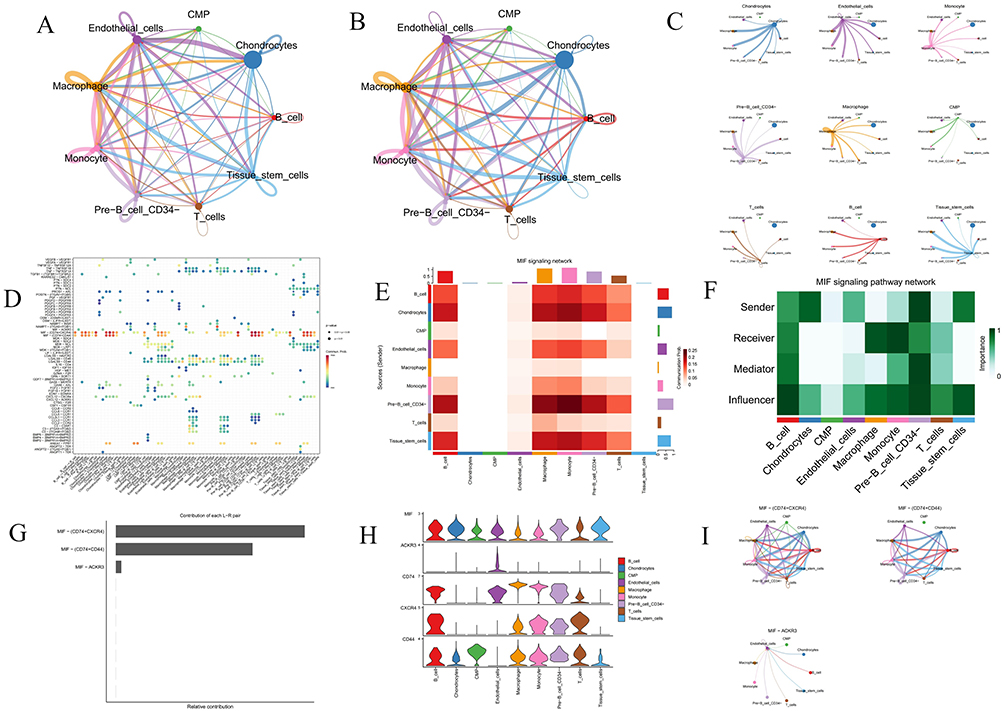 |
Figure 12 Cell-cell communication analysis. (A) Interaction net count plot of AS cells. The thicker the line, the greater the number of interactions. (B) Interaction weight plot of AS cells. The thicker the line, the stronger the interaction weights/strength between the two cell types. (C) Detailed network of cell–cell interactions among 9 cell subsets. (D) Bubble chart displays the differential expression of signaling pathway factors across various cell types, with the color and size of the dots indicating the p-values and commonality probabilities. (E) Heatmap illustrates the activity levels of the MIF signaling pathway across various cell types. (F) Heatmap depicts the roles and relative importance of different cell types within the MIF signaling network. (G) Bar chart displays the relative contributions of different ligand-receptor pairs in the MIF signaling pathway. (H and I) An illustration of MIF signaling pathways, including a violin plot (left) depicting ligand and receptor gene expression levels and circle plots (right) showing interaction strengths. |
Molecular Docking and MD Simulation Between Iloprost and APOC1
Through an extensive literature review, we identified that iloprost, within the gene-drug interaction network, is most closely associated with cardiovascular disease. Iloprost, a prostacyclin analog, acts by dilating blood vessels and inhibiting platelet aggregation, thereby improving blood flow and reducing vascular resistance, which may aid in preventing and treating atherosclerosis.45,46 Among the hub genes identified in this study, APOC1 accelerates the deposition of LDL in the vascular wall and, by enhancing the inflammatory response, contributes to the formation and progression of atherosclerosis.47 Additionally, APOC1 indirectly influences mitochondrial function by affecting lipid metabolism pathways, with potential activation of the mtUPR. Although a direct link between APOC1 and mtUPR remains unconfirmed, it is plausible that APOC1 may exert an impact, given the central role of mitochondria in lipid metabolism and energy balance. Mitochondrial dysfunction and mtUPR activation can trigger cellular stress responses, promoting oxidative stress and vascular endothelial injury, and thus accelerate atherosclerosis progression.48
In this study, molecular docking results revealed that Iloprost exhibited high compatibility with the APOC1 protein’s receptor binding pocket, achieving a binding energy of −6.7 kcal/mol, which suggests strong binding activity under physiological conditions. Visualization of the docking results showed that Iloprost formed four hydrogen bonds with amino acid residues SER27A, ARG28A, GLN31A, and SER32A in APOC1. Additionally, hydrophobic interactions were observed between Iloprost and residues ARG28A, LEU34B, LYS37B, and TRP41B in APOC1. These findings indicate that Iloprost has the potential to establish multiple interactions with APOC1 (Figure 13A).
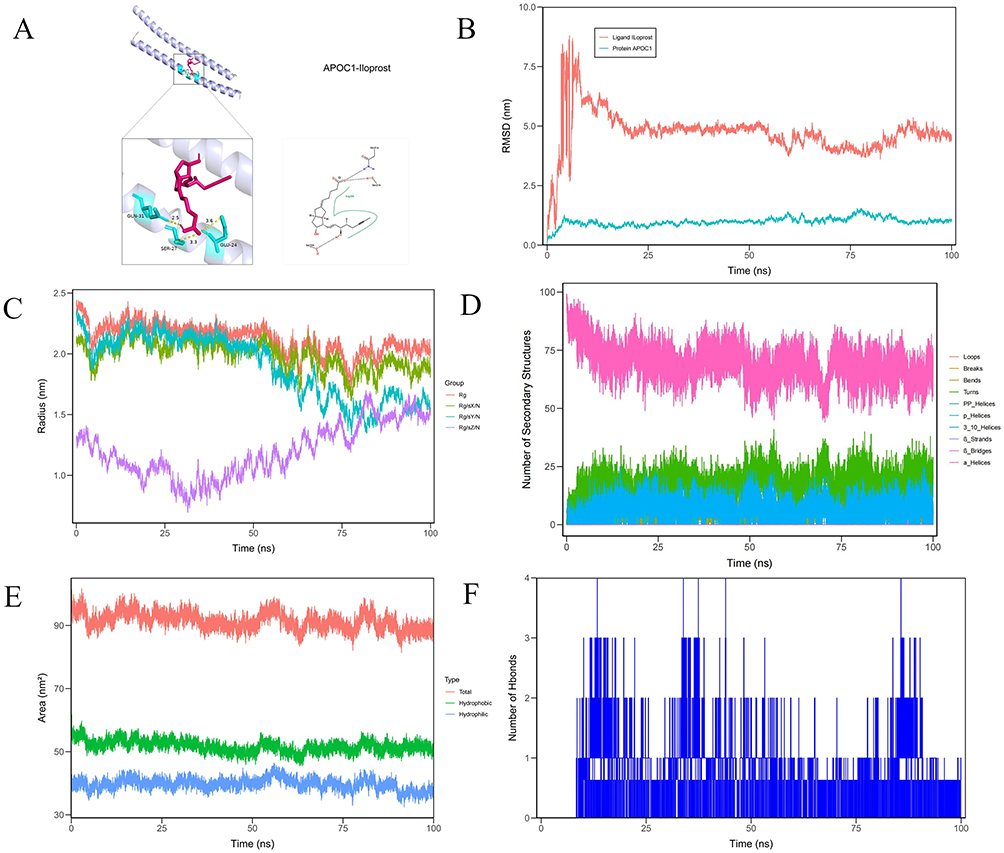 |
Figure 13 Molecular docking analysis and molecule dynamics. (A) A stable interaction between the APOC1 protein and Iloprost was identified. Iloprost engages in hydrogen bonding with the amino acid residues SER27A, ARG28A, GLN31A, SER32A of APOC1, and forms hydrophobic interactions with ARG28A, LEU34B, LYS37B, and TRP41B, thereby contributing to the binding stability. (B) Presents the RMSD (Root Mean Square Deviation) variations of the protein APOC1 and ligand Iloprost over 100 nanoseconds during molecular dynamics simulations. (C) Illustrates the variations in the radius of gyration of proteins across different experimental groups during molecular dynamics simulations. The x-axis denotes the simulation time in nanoseconds, while the y-axis measures the radius of gyration in nanometers. The red curve corresponds to the Rg group, the green curve to Rg/S/X, the purple to Rg/S/Y, and the blue to Rg/S/Z. Each color traces distinct trajectories, reflecting the dynamic structural changes in each protein group over time. (D) Illustrates the changes in the number of secondary structural elements in a protein during molecular dynamics simulations. (E) Depicts the changes in solvent-accessible surface area (SASA) of a protein during a molecular dynamics simulation. (F) Shows the fluctuation in the number of hydrogen bonds during a molecular dynamics simulation. The x-axis represents time in nanoseconds, while the y-axis shows the number of hydrogen bonds. |
Subsequently, we performed 100-ns MD simulations to characterise the binding, stability and flexibility of Iloprost–APOC1. The protein RMSD stayed low (<1.5 nm) throughout, indicating a stable APOC1 fold, whereas Iloprost RMSD rose rapidly to ~7.5 nm, fluctuated, then stabilised near ~5.0 nm, consistent with substantial ligand rearrangement (Figure 13B). RMSF values were <0.5 nm for most residues, while regions around residues 1 and 50 approached ~1.0 nm, indicating local flexibility (Supplementary Material 9). The radius of gyration varied over time; in the “Rg/sZ/N” group it fell from ~1.5 nm to ~0.5 nm, suggesting compaction (Figure 13C). Secondary-structure content showed minimal fluctuations and remained largely stable (Figure 13D). SASA stayed ~100 nm2 overall, with hydrophobic area ~55 nm2 and a more variable hydrophilic component averaging ~40 nm2, consistent with dynamic solvent exposure (Figure 13E). Hydrogen bonds between Iloprost and APOC1 oscillated between one and three, indicating transient contacts and ongoing adjustment of the binding interface (Figure 13F).
Validation in Animal Experiments
The expression of seven core genes was validated using RT-qPCR. The results indicated that the expression levels of ARHGAP25, CYTH4, ITGB7, and PLCB2 exhibited significant differences, which were statistically significant. Although the expression differences of APOC1 and MARCO did not reach statistical significance, they were still notably apparent. In contrast, no significant differences were observed in the expression level of WDFY4 (Figure 14A–G). Based on these findings, we selected the ITGB7 gene, which showed strong PCR results, for further validation through WB and immunofluorescence staining experiments, confirming the differences in its expression at the protein level (Figure 14H–J). Finally, the ITGB7-positive cell counts were visualized using bar charts, further supporting its significance in this study (Figure 14K).
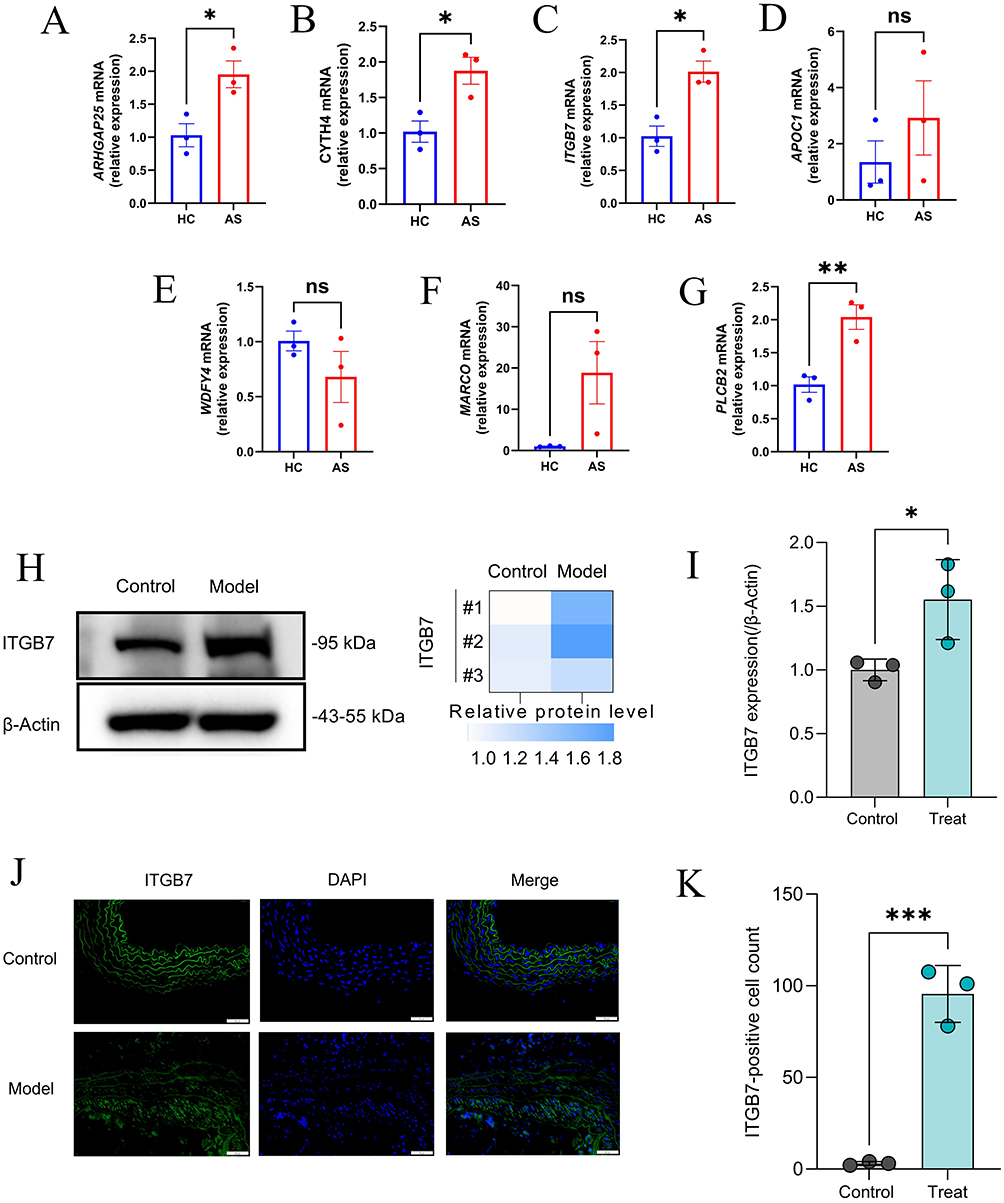 |
Figure 14 Verification of core genes. (A–G) The relative mRNA levels of ARHGAP25, CYTH4, ITGB7, APOC1, WDFY4, MARCO, and PLCB2 in AS and control mice, normalized to β-actin. (H and I) The relative protein levels of ITGB7 in AS and control mice, normalized to β-actin. (J) Immunofluorescence staining of ITGB7 in AS mice and control mice. (K) Immunofluorescence positive cell counting of ITGB7 in AS mice and control mice. Significance levels are indicated as *P < 0.05; **P < 0.01; ***P < 0.001. |
Discussion
In this study, we utilized bioinformatics and machine learning techniques to analyze integrated datasets for investigating AS subtypes associated with the UPRmt. This analysis delineated two predominant AS subtypes, demonstrating significant correlations with the expression of MRGs. Employing machine learning approaches, we developed a predictive model, pinpointed critical hub genes, and corroborated these genes through Mendelian randomization analysis. Furthermore, the study explored the potential interactions between these UPRmt-associated hub genes and immune infiltration. This comprehensive bioinformatics investigation not only deepens our understanding of AS pathogenesis and progression but also establishes a theoretical basis for devising precision therapeutic strategies targeting AS.
AS is a chronic inflammatory vascular disease that significantly threatens global cardiovascular health.49 This disease ranks as a primary contributor to cardiovascular and cerebrovascular events, particularly in its early stages when minimal clinical manifestations often result in delayed diagnosis and missed opportunities for early intervention.50 The pathogenesis of AS includes endothelial dysfunction, lipid and calcium salt accumulation in the vessel walls, and fibrosis, which collectively promote plaque formation and increase the risk of unstable ruptures, potentially leading to severe complications such as acute myocardial infarction or stroke. Despite the availability of advanced diagnostic and therapeutic modalities, including nanomedicine, gene editing and mRNA therapies, AS management continues to face significant challenges, with limited improvements in long-term patient survival rates.51–53 Consequently, current research emphasizes the development of novel biomarkers to enhance early disease detection and monitoring, and the identification of new therapeutic targets to optimize treatment strategies. These initiatives strive to improve patient prognosis comprehensively, from molecular mechanisms to therapeutic applications.
Mounting evidence links the mitochondrial unfolded protein response (UPRmt) to atherosclerosis. In mammals, UPRmt is a mitonuclear stress programme mediated by ATF5, with crosstalk to the integrated stress response via ATF4, which induces mitochondrial chaperones and proteases (HSP60/10, LONP1, CLPP) to restore proteostasis.54,55 In atherosclerosis, mitochondrial dysfunction and mitochondrial DNA (mtDNA) damage are abundant in human and murine plaques and are sufficient to drive lesion growth and features of vulnerability independent of bulk reactive oxygen species, placing mitochondrial quality control as causal rather than correlative.56,57 Mitochondrial injury also provides pro-inflammatory cues: leaked mtDNA activates cGAS–STING signalling in vascular cells and macrophages, and genetic or pharmacological inhibition of STING reduces atherogenesis in ApoE-deficient mice.58 Components of the UPRmt intersect with these processes; for example, macrophage LONP1 is upregulated by lipid stress through PERK–eIF2α–ATF4 signalling, which impairs mitophagy and amplifies mitochondrial ROS and IL-1β, implicating maladaptive UPRmt–ISR signalling in plaque progression.59 Finally, experimental boosting of UPRmt confers cardio-cerebral protection in ischaemia–reperfusion models in an ATF5-dependent manner, supporting the premise that calibrated activation of UPRmt could dampen vascular inflammation and stabilise plaques.60
However, the specific effects of the UPRmt in AS remain incompletely understood. Consequently, this study conducted a comprehensive bioinformatics analysis using consensus clustering based on the expression of MRGs to categorize AS into two distinct subtypes for further exploration. Subsequently, we developed a machine learning-based predictive model that identified seven key genes. GSEA and GSVA revealed that high expression of these key genes is closely associated with interactions among various cytokines and multiple receptor signaling pathways. Additionally, our immune infiltration analysis of these key genes indicated a significant association with macrophages and T cells. Further validation through single-cell sequencing analysis confirmed this association, showing that the expression of these key genes is significantly elevated in macrophages, monocytes, and T cells compared to other cell types. Moreover, based on the immune infiltration characteristics of different AS subtypes, we observed notable differences in macrophage and T cell expression between the subtypes. Therefore, we hypothesize that UPRmt may regulate the immune response and inflammatory processes by influencing the function and distribution of macrophages and T cells across different AS subtypes.
In the pathophysiological process of AS, macrophages play a central role, intricately linked to several key pathological activities. AS is fundamentally an inflammatory disease where macrophages recognize and ingest ox-LDL via specific scavenger receptors, such as CD36 and LOX-1. This action is a crucial step in the disease’s progression, leading to the transformation of macrophages into foam cells. These cells accumulate in arterial plaques, forming typical lipid cores that significantly promote plaque thickening and instability. The activation of macrophages and the formation of foam cells are governed by a complex signaling network, including the activation of the NLRP3 inflammasome and regulation of SLAMF7. Abnormal regulation of these signaling pathways not only intensifies the inflammatory response but also significantly drives AS progression.61,62 Moreover, macrophages amplify the local inflammatory response by secreting a range of cytokines, such as TNF-α, ILs, and chemokines like CXCL1, CXCL2, and CCL5, thereby attracting more inflammatory cells to the site.63,64 Additionally, macrophages contribute to the disease by secreting metalloproteinases, such as MMP-9, which degrade collagen and other extracellular matrix components in plaques, weakening the fibrous cap and increasing the risk of plaque rupture.65 Concurrently, oxidative stress responses and abnormalities in autophagic mechanisms within macrophages complicate the disease’s progression. Specifically, oxidative stress can damage lysosomal membranes, impairing the fusion of lysosomes with autophagosomes and leading to cellular damage and death, while abnormal autophagic activity may cause excessive accumulation of ox-LDL, further destabilizing plaques and exacerbating the inflammatory response.66
The activation and functional differentiation of T cells are critical in the immunopathological process of AS. These cells respond to various stimuli, such as oxidized low-density lipoprotein, hyperglycemia, and hypertension, and interact with vascular endothelial cell adhesion molecules, including VCAM-1 and ICAM-1, to traverse the endothelium and infiltrate the arterial wall. Within the plaque microenvironment, T cells are categorized as pro-inflammatory (Th1 and Th17) or anti-inflammatory (Treg) based on the cytokines they secrete. Specifically, Th1 cells amplify the pro-inflammatory activity of macrophages by secreting interferon gamma (IFN-γ), while Th17 cells intensify plaque inflammation and progression by recruiting more inflammatory cells through the release of interleukin 17 (IL-17). Conversely, Treg cells mitigate the local inflammatory response and enhance plaque stability by secreting anti-inflammatory cytokines such as transforming growth factor beta (TGF-β) and interleukin 10 (IL-10).67,68 Regarding plaque stability in AS, different T cell subgroups play pivotal roles by influencing the behavior of other immune cells within the plaque and the phenotypic transformation of smooth muscle cells. Th1 and Th17 cells, through their pro-inflammatory factors, may contribute to the destruction of plaque structure, thus increasing the risk of plaque rupture. In contrast, Treg cells can promote the integrity of the fibrous cap, potentially reducing this risk.69,70 This dynamic interplay of T cell interactions underscores their complex and essential role in the progression of AS.
The UPRmt is critical in modulating the functions of macrophages and T cells, particularly in the pathophysiological processes of cardiovascular diseases such as AS. As a protective mechanism that responds to mitochondrial protein accumulation and damage, UPRmt bolsters antioxidant defenses, improves protein quality control, and enhances mitochondrial DNA repair, thereby maintaining immune cell function stability.16 In AS, macrophages and T cells encounter oxidative stress and metabolic pressure, common stressors in plaque formation and progression. The activation of UPRmt is essential for macrophages to engage in extensive metabolic activities that produce inflammatory mediators and also influences the polarization of macrophages toward the M1 or M2 phenotype. Similarly, T cells rely on UPRmt to enhance their pro-inflammatory or anti-inflammatory functions, adapting to metabolic stress and oxidative pressure in this environment, which directly impacts plaque stability and disease progression.66,71,72 Therefore, in-depth research into the UPRmt pathway can improve our understanding of the pathophysiological mechanisms of cardiovascular diseases and may provide a scientific basis for designing new therapeutic strategies for AS and related conditions. By optimizing UPRmt activity, we can effectively regulate inflammatory responses in cardiovascular diseases, offering new therapeutic directions. This approach will also unveil the complexity of mitochondrial function regulation in cardiovascular diseases and underscore its potential importance in disease management.
ARHGAP25 (Rho GTPase activating protein 25) belongs to the RhoGAP protein family and regulates the activity of Rho family GTPases through its RhoGAP domain, significantly influencing various physiological and pathological processes in cells. Studies have shown that the expression of ARHGAP25 in human neutrophils is crucial for maintaining cell migration and adhesion, which are key in ensuring positional accuracy during immune responses and inflammatory processes. Moreover, ARHGAP25 might also regulate cell polarity and migration capabilities, contributing to broader cellular signaling pathways that could significantly affect immune regulation and disease progression.73 In the cardiovascular system, ARHGAP25 is thought to play a pivotal role in cardiovascular diseases, particularly in the progression of AS, by regulating the contraction of vascular smooth muscle cells and maintaining endothelial cell functions.74 These findings suggest that ARHGAP25 is integral in linking changes in cellular behavior with the mechanisms underlying cardiovascular disease development.
CYTH4, also known as PSCD4, is crucial in cellular signal transduction, facilitated by its Sec7 and PH domains. The Sec7 domain functions as a guanine nucleotide exchange factor (GEF), essential for activating the Arf family of GTPases which are critical for processes such as membrane trafficking and cytoskeletal reorganization. Additionally, the PH domain of CYTH4 is involved in cellular localization and membrane binding, specifically through interactions with phosphatidylinositol, crucial for the accurate propagation of signaling pathways. The synergy of these domains positions CYTH4 as a pivotal regulator in cellular responses within key signaling pathways like AKT/PI3K, which are central to regulating cell survival, proliferation, and differentiation.75,76 The Gene Set Variation Analysis (GSVA) in this study reveals significant enrichment of CYTH4 in pathways such as lysosomal, Toll-like receptor signaling, sulfur metabolism, and sphingolipid metabolism, suggesting that the gene may influence the UPRmt and AS by regulating immune defense mechanisms and inflammatory responses. These findings may offer some new perspectives for future research.
ITGB7 (integrin β7) partners with α chains to form heterodimers such as α4β7 and αEβ7, which are pivotal in regulating the migration and localization of immune cells. Integrin α4β7 is particularly vital for linking the gastrointestinal mucosa with lymphocytes, primarily through its interaction with MAdCAM-1, facilitating the homing of T cells and B cells to the intestine. Conversely, integrin αEβ7, predominantly expressed in mucosa-associated cells like intestinal epithelial T cells, stabilizes the position of immune cells in specific tissues by binding to E-cadherin. Research has demonstrated that dysfunction in ITGB7 is closely associated with various immune-mediated diseases, including inflammatory bowel disease and multiple sclerosis.77,78 Further research by Zheng et al highlights ITGB7 as a significant biomarker related to the immune system in carotid atherosclerotic plaques, while other integrin family members such as ITGB1 and ITGB3 are involved in angiogenesis, platelet aggregation, and cardiac function.79,80 Currently, therapeutic strategies targeting ITGB7, such as the monoclonal antibody vedolizumab against integrin α4β7, have proven effective in treating autoimmune diseases.81 Therefore, in-depth exploration of the biological functions of ITGB7 and its disease associations is crucial for developing novel therapeutic approaches.
APOC1 is a crucial member of the apolipoprotein family, primarily involved in regulating lipid transport and metabolism, particularly in the metabolic processes of HDL and very low-density lipoproteins (VLDL). APOC1 inhibits the activity of LPL, which slows the clearance of triglycerides and increases the risk of lipid deposition in the arterial walls, closely linking it to the progression of AS. At the cellular level, APOC1 regulates lipid levels by inhibiting the receptor-mediated binding of VLDL and LDL, which is facilitated by apolipoprotein E.82,83 Additionally, APOC1 influences the activity of various enzymes, such as hepatic lipase and phospholipase A2, further modulating lipid metabolism and transport. APOC1’s impact on HDL metabolism may disrupt the efficiency of reverse cholesterol transport (RCT), as it regulates the activity of various plasma proteins and cellular receptors involved in HDL remodeling. Notably, in vitro studies have shown that APOC1 can partially activate lecithin-cholesterol acyltransferase (LCAT), a key enzyme in the maturation process of HDL. Simultaneously, APOC1’s inhibitory effects extend to hepatic lipase, directly affecting the hydrolysis of triglycerides in cholesterol-rich lipoproteins, including HDL.82,84 Consequently, these mechanisms of APOC1 may lead to the accumulation of cholesterol in arterial walls, elevating the risk of cardiovascular diseases.
WDFY4 (WD repeat and FYVE domain-containing protein 4) is crucial for immune system regulation, especially in modulating autoimmune responses. This protein’s complex structure includes a pleckstrin homology (PH) domain, BEACH domain, and multiple WD40 repeats, which are pivotal in cellular signaling and vesicular transport—key processes for immune system functionality.85 WDFY4 is instrumental in determining B cell fate by engaging in both canonical and non-canonical autophagy pathways, essential for the cells’ viability and function in various health states. It also plays a pivotal role in dendritic cell-mediated antigen cross-presentation, essential for eliciting strong CD8+ T cell responses against viral and tumor antigens.86,87 Animal model studies have underscored WDFY4’s critical involvement in developing effective immune surveillance and response strategies. Additionally, WDFY4 interacts with molecules crucial for intracellular antigen processing and presentation, potentially offering therapeutic targets to boost immunotherapy outcomes. While direct associations between WDFY4 and mitochondria are sparse, its involvement in autophagic processes, particularly mitophagy linked to neurodegenerative diseases, implies an indirect impact on mitochondrial function (Supplementary Material 10). Similarly, WDFY3, from the same family, is vital in neuronal mitophagy, hinting at possible significant roles for WDFY4 in related cellular processes.88
MARCO (Macrophage Receptor with Collagenous Structure), a pivotal receptor within the SRCR (Scavenger Receptor Cysteine-Rich) superfamily, is primarily expressed on macrophages. It plays a critical role in the innate immune system by mediating the phagocytosis of pathogens and other potentially harmful particles, essential for immune defense. MARCO recognizes a wide array of ligands, including bacteria, viruses, and apoptotic cells, attributed largely to its unique structure, notably the combination of collagenous and SRCR domains that confer versatile binding properties. Furthermore, MARCO activates various signaling pathways, such as NF-κB, enhancing the production of inflammatory mediators and promoting inflammatory responses. It also influences the activation of immune cells and their antigen-presenting capabilities.89,90 In the context of respiratory diseases, MARCO’s expression correlates with disease severity, and its dysfunction is linked to heightened inflammatory responses in lung infection models. Additionally, in AS, MARCO facilitates the transformation of macrophages into foam cells and exacerbates plaque formation and arterial thickening by internalizing modified lipoproteins like oxidized low-density lipoprotein (oxLDL).62,91 Changes in mitochondrial function, especially through the mtUPR mechanism under stress conditions, are crucial for macrophage survival and stress responses. The regulation of MARCO thus influences metabolic pathways and inflammatory responses, potentially affecting mitochondrial function and overall cell health.92,93 These insights not only underscore the complexity of MARCO’s role in immune regulation but also highlight its potential as a therapeutic target for disease management.
Phospholipase Cβ2 (PLCB2) is instrumental in immune cells such as B cells and natural killer cells, where it hydrolyzes phosphatidylinositol 4,5-bisphosphate (PIP2) into diacylglycerol (DAG) and inositol trisphosphate (IP3). This reaction initiates downstream signaling pathways, including protein kinase C (PKC) and calcium signaling, which are vital for regulating immune and inflammatory responses, especially in the context of chronic cardiovascular inflammation like atherosclerotic plaque formation and rupture.94,95 Activation of immune cell receptors enhances PLCB2 activity, leading to significant increases in intracellular calcium levels that are essential for cardiac contraction and the modulation of vascular smooth muscle cell activity, potentially impacting blood pressure, heart rhythm, and myocardial contractile function.96,97 Research by Yamada et al has identified a robust association between PLCB2 and conditions such as early-onset myocardial infarction and hypertension, underscoring its critical role in linking cellular signal transduction with immune regulation and highlighting its potential as a therapeutic target for treating immune-related and cardiovascular diseases.98
In this study, we employed a comprehensive bioinformatics approach to investigate biomarkers associated with the UPRmt in AS. Compared with previous bioinformatics analyses that broadly targeted “mitochondrial dysfunction” or “oxidative stress” in atherosclerosis, our study differs in three principal ways: (i) we centre specifically on the UPRmt—a defined and relatively overlooked stress axis—rather than generic oxidative-stress signatures; (ii) we pair a machine-learning diagnostic model with orthogonal validation at single-cell resolution, two-sample Mendelian randomisation, and protein-level assays (PCR, Western blotting and immunofluorescence), thereby moving beyond correlation towards stronger causal inference and cell-type specificity; and (iii) we extend biomarker discovery to therapeutic inference by integrating molecular docking and molecular-dynamics simulations to prioritise potentially druggable interactions, providing an actionable shortlist for mechanistic and translational follow-up. Clinically, the seven-gene panel may aid risk stratification and earlier detection and could be adapted into a peripheral blood assay pending prospective validation. Single-cell localisation supports its use in monitoring plaque inflammation and treatment response. Translationally, the docking and molecular-dynamics results nominate actionable protein–ligand interfaces (eg, APOC1) for drug repurposing and lead optimisation. However, several limitations warrant consideration. First, the data used in this research were sourced from the GEO database, and the methods of data collection and processing may affect the accuracy of the analysis and the reliability of the results. Variations in the technical platforms and protocols employed by different laboratories could introduce biases. Although gene expression changes were validated at the protein level, the functional experiments in animal models still have some constraints. While animal models were employed, limitations in experimental conditions and the choice of species may hinder the models’ ability to fully replicate the complexity of human diseases. Differences in physiology and immune responses across animal models may also influence the generalizability and clinical relevance of the findings. Additionally, molecular docking and molecular dynamics simulations have provided valuable insights into predicting molecular interactions, though they have inherent limitations. Molecular docking relies on known molecular structures and may not fully capture the dynamic changes of molecules within complex biological environments. Moreover, although molecular dynamics simulations model the motion of molecular systems, limitations in force field accuracy, computational resources, and simulation time may prevent these simulations from completely reflecting the true behavior of biomolecules inside the cell. Thus, future research should focus on refining molecular simulation methods and incorporating additional experimental data for validation. Expanding the range of animal models and experimental conditions, increasing the sample size, and integrating diverse clinical data will be essential for validating the biomarkers proposed in this study and for developing more effective strategies for the prevention and treatment of AS. These efforts will provide a foundation for future clinical applications and contribute to advancing early diagnosis and precision treatment of AS-related diseases.
Conclusion
This study identifies seven UPRmt-associated hub genes—ARHGAP25, CYTH4, ITGB7, APOC1, WDFY4, MARCO and PLCB2—linked to immune modulation in atherosclerosis, offering promising diagnostic and therapeutic targets. These genes likely contribute to AS pathogenesis and immune-cell infiltration, with activities closely connected to the mitochondrial unfolded protein response, and may inform clinical management. Next steps include validation in independent clinical cohorts, expanded sample sizes with protein-level and longitudinal assessments, and mechanistic studies in relevant cellular and animal models to establish causality and evaluate therapeutic potential.
Abbreviations
AS, Atherosclerosis; UPRmt, mitochondrial unfolded protein response; MRG, UPRmt-related gene; GO, Gene ontology; KEGG, Kyoto Encyclopedia of Genes and Genomes; GEO, Gene Expression Omnibus; DEGs, Differentially expressed genes; WGCNA, weighted gene coexpression network; GSEA, Gene Set Enrichment Analysis; GSVA, Gene Set Variation Analysis; ScRNA-seq, Single-cell RNA sequencing; MD, molecular dynamics; NES, normalized enrichment score; FDR, false discovery rate; TOM, topological overlap matrix; MAD, median absolute deviation; ROC, Receiver Operating Characteristic; AUC, Area Under the Curve; UMAP, Uniform Manifold Approximation and Projection; DGIdb, Drug-Gene Interaction Database.
Data Sharing Statement
The datasets GSE100927, GSE43292, GSE28829, GSE41571 and GSE155512 for this study can be found in the https://www.ncbi.nlm.nih.gov/geo/. The data supporting the conclusions of this study are publicly available in FinnGen. The data supporting the findings of this study are available from the corresponding author upon a reasonable request.
Ethics Approval and Consent to Participate
Human data. This study conducted secondary analyses only of legally obtained, publicly available datasets comprising anonymised human data. In accordance with the Measures for Ethical Review of Life Science and Medical Research Involving Human Subjects (China; promulgated 18 February 2023), Article 32(1)(2), research using legally obtained publicly available data or anonymised information may be exempt from ethics review when it causes no harm and does not involve sensitive personal information or commercial interests. No new data were collected from human participants, no re-identification was attempted, and all analyses complied with the source repositories’ terms of use. The analyses were conducted in line with the principles of the Declaration of Helsinki. Consent to participate was not required because only anonymised data were analysed.
Animal experiments. All animal procedures were approved by the Laboratory Animal Ethics Committee of Jiangxi University of Chinese Medicine (Approval No. 20240312025; approval date 13 March 2024). Animal care and experimental procedures complied with institutional and national guidelines for the care and use of laboratory animals. This study was conducted and reported in accordance with the ARRIVE (Animal Research: Reporting of In Vivo Experiments) guidelines. All experimental procedures involving animals were designed, performed, and described following the ARRIVE checklist to ensure transparency, reproducibility, and animal welfare.
Acknowledgments
We acknowledge the participants and investigators of GEO and FinnGen studies.
Author Contributions
Yirong Ma: Data curation, Formal analysis, Methodology, Software, Visualization, Writing – original draft, Writing – review & editing, Conceptualization
Yanhong Liu: Methodology, Writing – original draft, Conceptualization, Formal analysis
Yu Li: Writing – original draft, Conceptualization, Methodology, Data Curation
Junyu Lai: Methodology, Writing – review & editing, Data Curation
Qiang Wan: Data curation, Formal analysis, Writing – review & editing, Writing – Original Draft
Dr. Jianguang Wu: Formal analysis, Funding acquisition, Project administration, Supervision, Writing – review & editing, Writing – Original Draft
Shuguang Wu: Data curation, Funding acquisition, Project administration, Supervision, Writing – review & editing, Writing – Original Draft
All authors have agreed on the journal to which the article will be submitted; reviewed and agreed on all versions of the article before submission, during revision, the final version accepted for publication, and any significant changes introduced at the proofing stage; agree to take responsibility and be accountable for the contents of the article.
Funding
This work was supported by NATCM’s Project of High-level Construction of Key TCM Disciplines (zyyzdxk-2023113); National Natural Science Foundation of China (82374367); National Construction Project for Traditional Chinese Medicine Specialties with Advantages (Gan Cai She Zhi [2024] No. 39) (Translated name); Jiangxi Province Key Laboratory of Traditional Chinese Medicine for Cardiovascular Diseases (2024SSY06301); Natural Science Foundation of Jiangxi Province (20242BAB26163, 20232BAB206144); Jiangxi Province Science Education Association (2025KXJYS438) (Translated name); and the Nanchang Municipal Key Speciality Project Fund for Neurological Disorders.
Disclosure
The authors declare that they have no competing interests related to this work.
References
1. Wolf D, Ley K. Immunity and inflammation in atherosclerosis. Circ Res. 2019;124(2):315–327. doi:10.1161/CIRCRESAHA.118.313591
2. Kong P, Cui ZY, Huang XF, Zhang DD, Guo RJ, Han M. Inflammation and atherosclerosis: signaling pathways and therapeutic intervention. Signal Transduct Target Ther. 2022;7(1):131. doi:10.1038/s41392-022-00955-7
3. Roy P, Orecchioni M, Ley K. How the immune system shapes atherosclerosis: roles of innate and adaptive immunity. Nat Rev Immunol. 2022;22(4):251–265. doi:10.1038/s41577-021-00584-1
4. Song P, Fang Z, Wang H, et al. Global and regional prevalence, burden, and risk factors for carotid atherosclerosis: a systematic review, meta-analysis, and modelling study. Lancet Glob Health. 2020;8(5):e721–e729. doi:10.1016/S2214-109X(20)30117-0
5. Roth GA, Mensah GA, Johnson CO, et al. Global burden of cardiovascular diseases and risk factors, 1990-2019: update from the GBD 2019 study. J Am Coll Cardiol. 2020;76(25):2982–3021. doi:10.1016/j.jacc.2020.11.010
6. Kattoor AJ, Goel A, Mehta JL. LOX-1: regulation, signaling and Its Role in Atherosclerosis. Antioxidants. 2019;8(7). doi:10.3390/antiox8070218
7. Xu S, Ogura S, Chen J, Little PJ, Moss J, Liu P. LOX-1 in atherosclerosis: biological functions and pharmacological modifiers. Cell Mol Life Sci. 2013;70(16):2859–2872. doi:10.1007/s00018-012-1194-z
8. Akhmedov A, Sawamura T, Chen CH, Kraler S, Vdovenko D, Lüscher TF. Lectin-like oxidized low-density lipoprotein receptor-1 (LOX-1): a crucial driver of atherosclerotic cardiovascular disease. Eur Heart J. 2021;42(18):1797–1807. doi:10.1093/eurheartj/ehaa770
9. Jin M, Fang J, Wang JJ, et al. Regulation of toll-like receptor (TLR) signaling pathways in atherosclerosis: from mechanisms to targeted therapeutics. Acta Pharmacol Sin. 2023;44(12):2358–2375. doi:10.1038/s41401-023-01123-5
10. Gong T, Liu L, Jiang W, Zhou R. DAMP-sensing receptors in sterile inflammation and inflammatory diseases. Nat Rev Immunol. 2020;20(2):95–112. doi:10.1038/s41577-019-0215-7
11. Sabatine MS. PCSK9 inhibitors: clinical evidence and implementation. Nat Rev Cardiol. 2019;16(3):155–165. doi:10.1038/s41569-018-0107-8
12. Katzmann JL, Gouni-Berthold I, Laufs U. PCSK9 inhibition: insights from clinical trials and future prospects. Front Physiol. 2020;11:595819. doi:10.3389/fphys.2020.595819
13. Chen W, Zhao H, Li Y. Mitochondrial dynamics in health and disease: mechanisms and potential targets. Signal Transduct Target Ther. 2023;8(1):333. doi:10.1038/s41392-023-01547-9
14. Casanova A, Wevers A, Navarro-Ledesma S, Pruimboom L. Mitochondria: it is all about energy. Front Physiol. 2023;14:1114231. doi:10.3389/fphys.2023.1114231
15. Shpilka T, Haynes CM. The mitochondrial UPR: mechanisms, physiological functions and implications in ageing. Nat Rev Mol Cell Biol. 2018;19(2):109–120. doi:10.1038/nrm.2017.110
16. Inigo JR, Chandra D. The mitochondrial unfolded protein response (UPR(mt)): shielding against toxicity to mitochondria in cancer. J Hematol Oncol. 2022;15(1):98. doi:10.1186/s13045-022-01317-0
17. Zhou Z, Lu J, Yang M, et al. The mitochondrial unfolded protein response (UPR(mt)) protects against osteoarthritis. Exp Mol Med. 2022;54(11):1979–1990. doi:10.1038/s12276-022-00885-y
18. Keerthiga R, Pei DS, Fu A. Mitochondrial dysfunction, UPR(mt) signaling, and targeted therapy in metastasis tumor. Cell Biosci. 2021;11(1):186. doi:10.1186/s13578-021-00696-0
19. Kenny TC, Gomez ML, Germain D. Mitohormesis, UPR(mt), and the complexity of mitochondrial DNA landscapes in cancer. Cancer Res. 2019;79(24):6057–6066. doi:10.1158/0008-5472.CAN-19-1395
20. Arnould T, Michel S, Renard P. Mitochondria retrograde signaling and the UPR mt: where are we in mammals? Int J Mol Sci. 2015;16(8):18224–18251. doi:10.3390/ijms160818224
21. Rocca C, Soda T, De Francesco EM, et al. Mitochondrial dysfunction at the crossroad of cardiovascular diseases and cancer. J Transl Med. 2023;21(1):635. doi:10.1186/s12967-023-04498-5
22. Xu S, Liu H, Wang C, et al. Dual roles of UPR(er) and UPR(mt) in neurodegenerative diseases. J Mol Med. 2023;101(12):1499–1512. doi:10.1007/s00109-023-02382-9
23. Kumar M, Sharma S, Mazumder S. Role of UPR(mt) and mitochondrial dynamics in host immunity: it takes two to tango. Front Cell Infect Microbiol. 2023;13:1135203. doi:10.3389/fcimb.2023.1135203
24. Zhu J, Lee MJ, An JH, Oh E, Chung W, Heo JY. ATF5 attenuates the secretion of pro-inflammatory cytokines in activated microglia. Int J Mol Sci. 2023;24(4):3322.
25. Liu Q, Yan X, Yuan Y, et al. HTRA2/OMI-mediated mitochondrial quality control alters macrophage polarization affecting systemic chronic inflammation. Int J Mol Sci. 2024;25(3):1577.
26. Cheng J, Cai W, Zong S, Yu Y, Wei F. Metabolite transporters as regulators of macrophage polarization. Naunyn Schmiedebergs Arch Pharmacol. 2022;395(1):13–25. doi:10.1007/s00210-021-02173-4
27. Chen S, Saeed A, Liu Q, et al. Macrophages in immunoregulation and therapeutics. Signal Transduct Target Ther. 2023;8(1):207. doi:10.1038/s41392-023-01452-1
28. Chakraborty S, Datta S, Datta S. Surrogate variable analysis using partial least squares (SVA-PLS) in gene expression studies. Bioinformatics. 2012;28(6):799–806. doi:10.1093/bioinformatics/bts022
29. Liu J, He X, Zheng S, Zhu A, Wang J. The mitochondrial unfolded protein response: a novel protective pathway targeting cardiomyocytes. Oxid Med Cell Longev. 2022;2022(1):6430342. doi:10.1155/2022/6430342
30. Naresh NU, Haynes CM. Signaling and regulation of the mitochondrial unfolded protein response. Cold Spring Harb Perspect Biol. 2019;11(6):a033944. doi:10.1101/cshperspect.a033944
31. Zhou Z, Fan Y, Zong R, Tan K. The mitochondrial unfolded protein response: a multitasking giant in the fight against human diseases. Ageing Res Rev. 2022;81:101702. doi:10.1016/j.arr.2022.101702
32. Ritchie ME, Phipson B, Wu D, et al. limma powers differential expression analyses for RNA-sequencing and microarray studies. Nucleic Acids Res. 2015;43(7):e47. doi:10.1093/nar/gkv007
33. Yu G, Wang LG, Han Y, He QY. clusterProfiler: an R package for comparing biological themes among gene clusters. Omics. 2012;16(5):284–287. doi:10.1089/omi.2011.0118
34. Walter W, Sánchez-Cabo F, Ricote M. GOplot: an R package for visually combining expression data with functional analysis. Bioinformatics. 2015;31(17):2912–2914. doi:10.1093/bioinformatics/btv300
35. Wilkerson MD, Hayes DN. ConsensusClusterPlus: a class discovery tool with confidence assessments and item tracking. Bioinformatics. 2010;26(12):1572–1573. doi:10.1093/bioinformatics/btq170
36. Langfelder P, Horvath S. WGCNA: an R package for weighted correlation network analysis. BMC Bioinf. 2008;9(1):559. doi:10.1186/1471-2105-9-559
37. Bindea G, Mlecnik B, Tosolini M, et al. Spatiotemporal dynamics of intratumoral immune cells reveal the immune landscape in human cancer. Immunity. 2013;39(4):782–795. doi:10.1016/j.immuni.2013.10.003
38. Freshour SL, Kiwala S, Cotto KC, et al. Integration of the drug-gene interaction database (DGIdb 4.0) with open crowdsource efforts. Nucleic Acids Res. 2021;49(D1):D1144–d1151. doi:10.1093/nar/gkaa1084
39. Stuart T, Butler A, Hoffman P, et al. Comprehensive integration of single-cell data. Cell. 2019;177(7):1888–1902.e1821. doi:10.1016/j.cell.2019.05.031
40. Aran D, Looney AP, Liu L, et al. Reference-based analysis of lung single-cell sequencing reveals a transitional profibrotic macrophage. Nat Immunol. 2019;20(2):163–172. doi:10.1038/s41590-018-0276-y
41. Jin S, Guerrero-Juarez CF, Zhang L, et al. Inference and analysis of cell-cell communication using CellChat. Nat Commun. 2021;12(1):1088. doi:10.1038/s41467-021-21246-9
42. Yu X, Wang X, Xie Y, et al. Activating transcription factor 4-mediated mitochondrial unfolded protein response alleviates hippocampal neuronal damage in an in vitro model of epileptiform discharges. Neurochem Res. 2023;48(7):2253–2264. doi:10.1007/s11064-023-03910-2
43. Lian X, Wang X, Xie Y, et al. ATF5-regulated mitochondrial unfolded protein response attenuates neuronal damage in epileptic rat by reducing endoplasmic reticulum stress through mitochondrial ROS. Neurochem Res. 2024;49(2):388–401. doi:10.1007/s11064-023-04042-3
44. Chen H, Zhang DM, Zhang ZP, Li MZ, Wu HF. SIRT3-mediated mitochondrial unfolded protein response weakens breast cancer sensitivity to cisplatin. Genes Genomics. 2021;43(12):1433–1444. doi:10.1007/s13258-021-01145-5
45. Badesch DB, McLaughlin VV, Delcroix M, et al. Prostanoid therapy for pulmonary arterial hypertension. J Am Coll Cardiol. 2004;43(12 Suppl S):56s–61s. doi:10.1016/j.jacc.2004.02.036
46. Jourdi G, Lordkipanidzé M, Philippe A, Bachelot-Loza C, Gaussem P. Current and novel antiplatelet therapies for the treatment of cardiovascular diseases. Int J Mol Sci. 2021;22(23):13079. doi:10.3390/ijms222313079
47. Malekmohammad K, Bezsonov EE, Rafieian-Kopaei M. Role of lipid accumulation and inflammation in atherosclerosis: focus on molecular and cellular mechanisms. Front Cardiovasc Med. 2021;8:707529. doi:10.3389/fcvm.2021.707529
48. Cilleros-Holgado P, Gómez-Fernández D, Piñero-Pérez R, et al. mtUPR modulation as a therapeutic target for primary and secondary mitochondrial diseases. Int J Mol Sci. 2023;24(2):1482. doi:10.3390/ijms24021482
49. Weber C, Habenicht AJR, von Hundelshausen P. Novel mechanisms and therapeutic targets in atherosclerosis: inflammation and beyond. Eur Heart J. 2023;44(29):2672–2681. doi:10.1093/eurheartj/ehad304
50. Meng H, Ruan J, Yan Z, et al. New progress in early diagnosis of atherosclerosis. Int J Mol Sci. 2022;23(16):8939. doi:10.3390/ijms23168939
51. Herrington W, Lacey B, Sherliker P, Armitage J, Lewington S. Epidemiology of atherosclerosis and the potential to reduce the global burden of atherothrombotic disease. Circ Res. 2016;118(4):535–546. doi:10.1161/CIRCRESAHA.115.307611
52. Hetherington I, Totary-Jain H. Anti-atherosclerotic therapies: milestones, challenges, and emerging innovations. Mol Ther. 2022;30(10):3106–3117. doi:10.1016/j.ymthe.2022.08.024
53. Ma Y, Gu T, He S, He S, Jiang Z. Development of stem cell therapy for atherosclerosis. Mol Cell Biochem. 2024;479(4):779–791. doi:10.1007/s11010-023-04762-8
54. Fiorese CJ, Schulz AM, Lin YF, Rosin N, Pellegrino MW, Haynes CM. The transcription factor ATF5 mediates a mammalian mitochondrial UPR. Curr Biol. 2016;26(15):2037–2043. doi:10.1016/j.cub.2016.06.002
55. Quirós PM, Prado MA, Zamboni N, et al. Multi-omics analysis identifies ATF4 as a key regulator of the mitochondrial stress response in mammals. J Cell Biol. 2017;216(7):2027–2045. doi:10.1083/jcb.201702058
56. Yu E, Calvert PA, Mercer JR, et al. Mitochondrial DNA damage can promote atherosclerosis independently of reactive oxygen species through effects on smooth muscle cells and monocytes and correlates with higher-risk plaques in humans. Circulation. 2013;128(7):702–712. doi:10.1161/CIRCULATIONAHA.113.002271
57. EPK Y, Reinhold J, Yu H, et al. Mitochondrial respiration is reduced in atherosclerosis, promoting necrotic core formation and reducing relative fibrous cap thickness. Arterioscler Thromb Vasc Biol. 2017;37(12):2322–2332. doi:10.1161/ATVBAHA.117.310042
58. Pham PT, Fukuda D, Nishimoto S, et al. STING, a cytosolic DNA sensor, plays a critical role in atherogenesis: a link between innate immunity and chronic inflammation caused by lifestyle-related diseases. Eur Heart J. 2021;42(42):4336–4348. doi:10.1093/eurheartj/ehab249
59. Zanini G, Selleri V, Malerba M, et al. The role of lonp1 on mitochondrial functions during cardiovascular and muscular diseases. Antioxidants. 2023;12(3). doi:10.3390/antiox12030598
60. Wang YT, Lim Y, McCall MN, et al. Cardioprotection by the mitochondrial unfolded protein response requires ATF5. Am J Physiol Heart Circ Physiol. 2019;317(2):H472–h478. doi:10.1152/ajpheart.00244.2019
61. Yuan F, Wei J, Cheng Y, et al. SLAMF7 promotes foam cell formation of macrophage by suppressing NR4A1 expression during carotid atherosclerosis. Inflammation. 2024;47(2):530–542. doi:10.1007/s10753-023-01926-y
62. Chistiakov DA, Melnichenko AA, Myasoedova VA, Grechko AV, Orekhov AN. Mechanisms of foam cell formation in atherosclerosis. J Mol Med. 2017;95(11):1153–1165. doi:10.1007/s00109-017-1575-8
63. Murray RZ, Stow JL. Cytokine secretion in macrophages: sNAREs, Rabs, and membrane trafficking. Front Immunol. 2014;5:538. doi:10.3389/fimmu.2014.00538
64. Arango Duque G, Descoteaux A. Macrophage cytokines: involvement in immunity and infectious diseases. Front Immunol. 2014;5:491. doi:10.3389/fimmu.2014.00491
65. Shah PK, Falk E, Badimon JJ, et al. Human monocyte-derived macrophages induce collagen breakdown in fibrous caps of atherosclerotic plaques. Potential role of matrix-degrading metalloproteinases and implications for plaque rupture. Circulation. 1995;92(6):1565–1569.
66. Hassanpour M, Rahbarghazi R, Nouri M, Aghamohammadzadeh N, Safaei N, Ahmadi M. Role of autophagy in atherosclerosis: foe or friend? J Inflamm. 2019;16(1):8. doi:10.1186/s12950-019-0212-4
67. Liuzzo G, Trotta F, Pedicino D. Interleukin-17 in atherosclerosis and cardiovascular disease: the good, the bad, and the unknown. Eur Heart J. 2013;34(8):556–559. doi:10.1093/eurheartj/ehs399
68. Raphael I, Nalawade S, Eagar TN, Forsthuber TG. T cell subsets and their signature cytokines in autoimmune and inflammatory diseases. Cytokine. 2015;74(1):5–17. doi:10.1016/j.cyto.2014.09.011
69. Hinkley H, Counts DA, VonCanon E, Lacy M. T cells in atherosclerosis: key players in the pathogenesis of vascular disease. Cells. 2023;12(17):2152. doi:10.3390/cells12172152
70. Chen J, Xiang X, Nie L, et al. The emerging role of Th1 cells in atherosclerosis and its implications for therapy. Front Immunol. 2022;13:1079668. doi:10.3389/fimmu.2022.1079668
71. Gianopoulos I, Daskalopoulou SS. Macrophage profiling in atherosclerosis: understanding the unstable plaque. Basic Res Cardiol. 2024;119(1):35–56.
72. Wang N, Liang H, Zen K. Molecular mechanisms that influence the macrophage m1-m2 polarization balance. Front Immunol. 2014;5:614. doi:10.3389/fimmu.2014.00614
73. Yang C, Wu S, Mou Z, et al. Transcriptomic analysis identified ARHGAP family as a novel biomarker associated with tumor-promoting immune infiltration and nanomechanical characteristics in bladder cancer. Front Cell Dev Biol. 2021;9:657219. doi:10.3389/fcell.2021.657219
74. Jiang YZ, Manduchi E, Stoeckert CJ, Davies PF. Arterial endothelial methylome: differential DNA methylation in athero-susceptible disturbed flow regions in vivo. BMC Genomics. 2015;16(1):506. doi:10.1186/s12864-015-1656-4
75. Wang H, Xiao Y, Zhou W, Li Y. Integrated analysis and validation reveal CYTH4 as a potential prognostic biomarker in acute myeloid leukemia. Oncol Lett. 2024;27(3):103. doi:10.3892/ol.2024.14236
76. Müller R, Herr C, Sukumaran SK, et al. The cytohesin paralog Sec7 of Dictyostelium discoideum is required for phagocytosis and cell motility. Cell Commun Signal. 2013;11:54. doi:10.1186/1478-811X-11-54
77. Keir ME, Fuh F, Ichikawa R, et al. Regulation and role of αE integrin and gut homing integrins in migration and retention of intestinal lymphocytes during inflammatory bowel disease. J Immunol. 2021;207(9):2245–2254. doi:10.4049/jimmunol.2100220
78. Kempster SL, Kaser A. α4β7 integrin: beyond T cell trafficking. Gut. 2014;63(9):1377–1379. doi:10.1136/gutjnl-2013-305967
79. Zheng K, Yang W, Wang S, et al. Identification of immune infiltration-related biomarkers in carotid atherosclerotic plaques. Sci Rep. 2023;13(1):14153. doi:10.1038/s41598-023-40530-w
80. Su C, Mo J, Dong S, Liao Z, Zhang B, Zhu P. Integrinβ-1 in disorders and cancers: molecular mechanisms and therapeutic targets. Cell Commun Signal. 2024;22(1):71. doi:10.1186/s12964-023-01338-3
81. Veny M, Garrido-Trigo A, Corraliza AM, et al. Dissecting common and unique effects of Anti-α4β7 and anti-tumor necrosis factor treatment in ulcerative colitis. J Crohns Colitis. 2021;15(3):441–452. doi:10.1093/ecco-jcc/jjaa178
82. Rouland A, Masson D, Lagrost L, Vergès B, Gautier T, Bouillet B. Role of apolipoprotein C1 in lipoprotein metabolism, atherosclerosis and diabetes: a systematic review. Cardiovasc Diabetol. 2022;21(1):272. doi:10.1186/s12933-022-01703-5
83. Cui Y, Miao C, Hou C, Wang Z, Liu B. Apolipoprotein C1 (APOC1): a novel diagnostic and prognostic biomarker for clear cell renal cell carcinoma. Front Oncol. 2020;10:1436. doi:10.3389/fonc.2020.01436
84. Pownall HJ, Rosales C, Gillard BK, Gotto AM. High-density lipoproteins, reverse cholesterol transport and atherogenesis. Nat Rev Cardiol. 2021;18(10):712–723. doi:10.1038/s41569-021-00538-z
85. Lyu X, Lamb JA, Chinoy H. The clinical relevance of WDFY4 in autoimmune diseases in diverse ancestral populations. Rheumatology. 2024;63(12):3255–3262. doi:10.1093/rheumatology/keae183
86. Yuan Q, Li Y, Li J, et al. WDFY4 is involved in symptoms of systemic lupus erythematosus by modulating b cell fate via noncanonical autophagy. J Immunol. 2018;201(9):2570–2578. doi:10.4049/jimmunol.1800399
87. Theisen DJ, Davidson JT, Briseño CG, et al. WDFY4 is required for cross-presentation in response to viral and tumor antigens. Science. 2018;362(6415):694–699. doi:10.1126/science.aat5030
88. Napoli E, Song G, Panoutsopoulos A, et al. Beyond autophagy: a novel role for autism-linked Wdfy3 in brain mitophagy. Sci Rep. 2018;8(1):11348. doi:10.1038/s41598-018-29421-7
89. Zhou G, Zhang L, Shao S. The application of MARCO for immune regulation and treatment. Mol Biol Rep. 2024;51(1):246. doi:10.1007/s11033-023-09201-x
90. Barnabei L, Laplantine E, Mbongo W, Rieux-Laucat F, Weil R. NF-κB: at the Borders Of Autoimmunity And Inflammation. Front Immunol. 2021;12:716469. doi:10.3389/fimmu.2021.716469
91. Malainou C, Abdin SM, Lachmann N, Matt U, Herold S. Alveolar macrophages in tissue homeostasis, inflammation, and infection: evolving concepts of therapeutic targeting. J Clin Invest. 2023;133(19). doi:10.1172/JCI170501
92. Qing J, Zhang Z, Novák P, Zhao G, Yin K. Mitochondrial metabolism in regulating macrophage polarization: an emerging regulator of metabolic inflammatory diseases. Acta Biochim Biophys Sin. 2020;52(9):917–926. doi:10.1093/abbs/gmaa081
93. Ramond E, Jamet A, Coureuil M, Charbit A. Pivotal role of mitochondria in macrophage response to bacterial pathogens. Front Immunol. 2019;10:2461. doi:10.3389/fimmu.2019.02461
94. Caraux A, Kim N, Bell SE, et al. Phospholipase C-gamma2 is essential for NK cell cytotoxicity and innate immunity to malignant and virally infected cells. Blood. 2006;107(3):994–1002. doi:10.1182/blood-2005-06-2428
95. Baba Y, Kurosaki T. Role of calcium signaling in B cell activation and biology. Curr Top Microbiol Immunol. 2016;393:143–174. doi:10.1007/82_2015_477
96. Sage AP, Tsiantoulas D, Binder CJ, Mallat Z. The role of B cells in atherosclerosis. Nat Rev Cardiol. 2019;16(3):180–196. doi:10.1038/s41569-018-0106-9
97. Palano MT, Cucchiara M, Gallazzi M, et al. When a friend becomes your enemy: natural killer cells in atherosclerosis and atherosclerosis-associated risk factors. Front Immunol. 2021;12:798155. doi:10.3389/fimmu.2021.798155
98. Yamada Y, Kato K, Oguri M, et al. Identification of 13 novel susceptibility loci for early-onset myocardial infarction, hypertension, or chronic kidney disease. Int J Mol Med. 2018;42(5):2415–2436. doi:10.3892/ijmm.2018.3852
 © 2025 The Author(s). This work is published and licensed by Dove Medical Press Limited. The
full terms of this license are available at https://www.dovepress.com/terms
and incorporate the Creative Commons Attribution
- Non Commercial (unported, 4.0) License.
By accessing the work you hereby accept the Terms. Non-commercial uses of the work are permitted
without any further permission from Dove Medical Press Limited, provided the work is properly
attributed. For permission for commercial use of this work, please see paragraphs 4.2 and 5 of our Terms.
© 2025 The Author(s). This work is published and licensed by Dove Medical Press Limited. The
full terms of this license are available at https://www.dovepress.com/terms
and incorporate the Creative Commons Attribution
- Non Commercial (unported, 4.0) License.
By accessing the work you hereby accept the Terms. Non-commercial uses of the work are permitted
without any further permission from Dove Medical Press Limited, provided the work is properly
attributed. For permission for commercial use of this work, please see paragraphs 4.2 and 5 of our Terms.