")
Back to Journals » Journal of Inflammation Research » Volume 17
Identification of m6A-Related Biomarkers in Systemic Lupus Erythematosus: A Bioinformation-Based Analysis
Authors Tian Y, Tao K, Li S, Chen X, Wang R, Zhang M, Zhai Z
Received 5 November 2023
Accepted for publication 18 January 2024
Published 27 January 2024 Volume 2024:17 Pages 507—526
DOI https://doi.org/10.2147/JIR.S439779
Checked for plagiarism Yes
Review by Single anonymous peer review
Peer reviewer comments 2
Editor who approved publication: Professor Ning Quan
Yuan Tian,1 Kang Tao,1 Shifei Li,1 Xiaoqiang Chen,2 Rupeng Wang,3 Mingwang Zhang,1 Zhifang Zhai1
1Department of Dermatology, The First Affiliated Hospital, Army Medical University, Chongqing, People’s Republic of China; 2Department of Dermatology, General Hospital of Central Theater Command, Wuhan, People’s Republic of China; 3Department of Dermatology, Xinqiao Hospital, Army Medical University, Chongqing, 400037, People’s Republic of China
Correspondence: Mingwang Zhang; Zhifang Zhai, Department of Dermatology, The First Affiliated Hospital, Army Medical University, No. 29 Gaotanyan Street, Shapingba District, Chongqing, 400038, People’s Republic of China, Email [email protected]; [email protected]
Background: Systemic Lupus Erythematosus (SLE), a prototypical autoimmune disorder, presents a challenge due to the absence of reliable biomarkers for discerning organ-specific damage within SLE. A growing body of evidence underscores the pivotal involvement of N6-methyladenosine (m6A) in the etiology of autoimmune conditions.
Methods: The datasets, which primarily encompassed the expression profiles of m6A regulatory genes, were retrieved from the Gene Expression Omnibus (GEO) repository. The optimal model, selected from either Random Forest (RF) or Support Vector Machine (SVM), was employed for the development of a predictive nomogram model. To identify pivotal genes associated with SLE, a comprehensive screening process was conducted utilizing LASSO, SVM-RFE, and RF techniques. Within the realm of SLE susceptibility, Weighted Gene Co-expression Network Analysis (WGCNA) was harnessed to delineate relevant modules and hub genes. Additionally, MeRIP-qPCR assays were performed to elucidate key genes correlated with m6A targets. Furthermore, a Mendelian randomization study was conducted based on genome-wide association studies to assess the causative influence of MMP9 on ischemic stroke (IS), which is not only a severe cerebrovascular event but also a common complication of SLE.
Results: Twelve m6A regulatory genes was identified, demonstrating statistical significance (p < 0.05) and utilized for constructing a nomogram model using the RF algorithm. EPSTI1, USP18, HP, and MMP9, as the hub genes, were identified. MMP9 uniquely correlates with m6A modification and was causally linked to an increased risk of IS, as indicated by our inverse variance weighting analysis showing an odds ratio of 1.0134 (95% CI=1.0004– 1.0266, p = 0.0440).
Conclusion: Our study identified twelve m6A regulators, shedding light on the molecular mechanisms underlying SLE risk genes. Importantly, our analysis established a causal relationship between MMP9, a key m6A-related gene, and ischemic stroke, a common complication of SLE, thereby providing critical insights for presymptomatic diagnostic approaches.
Keywords: systemic lupus erythematosus, N6-methyladenosine, m6A regulatory genes, MMP9, Mendelian randomization, bioinformatic analysis
Introduction
Systemic lupus erythematosus (SLE) is characterized as a multifaceted and chronic autoimmune inflammatory disorder, showcasing a wide range of manifestations and presenting challenges in terms of treatment options.1,2 Hence, the discovery of potential biomarkers in SLE via bioinformatics analysis holds immense clinical significance.
m6A, denoting methylation at the adenine base’s sixth position within RNA molecules, epitomizes the predominant modification in both coding and non-coding RNAs. As a pivotal post-transcriptional modulator, it significantly influences numerous physiological and pathological processes.3 Current studies suggest that m6A could substantially impact the progression of autoimmune diseases,4 indicating that m6A influences gene expression by regulating RNA metabolic processes such as splicing, stability, and translation, thereby playing a role in the pathogenesis of SLE.5–8 METTL3 plays a key role in regulating the activation and differentiation of CD4+ T cells, and its downregulation in SLE patients may impact T cell-mediated immune responses.9 Conversely, the upregulation of circGARS, acting as a sponge for miR-19a, affects the expression of the m6A reader YTHDF2 and A20, consequently modulating the NF-κB pathway, potentially exacerbating SLE pathology.10 Additionally, the differential expression of m6A-modified long non-coding RNAs (lncRNAs) and circular RNAs (circRNAs) in SLE patients suggests their potential roles in the disease, possibly serving as new therapeutic targets for SLE.11,12
Given the pervasive occurrence and significant influence of SLE, our research seeks to decipher the fundamental molecular mechanisms and formulate an accurate diagnostic model through merging transcriptome sequencing and machine learning algorithms. Furthermore, we investigated the causative link between MMP9 and IS utilizing an MR study. The insights garnered are anticipated to provide solid academic backing for the crafting of personalized SLE treatment and management plans, aiming ultimately at enhancing patient outcomes.
Materials and Methods
Data Collection and Processing
The workflow is illustrated in Figure 1. All the utilized data was sourced from the GEO database (https://www.ncbi.nlm.nih.gov/geo/). We utilized microarray gene expression data from GSE50772, GSE61635, GSE72509 and GSE81622 to pinpoint key m6A regulators.13 The basic information of the above GEO datasets is shown in Supplementary Table S1. We applied limma-voom normalization to GSE72509 and then processed the datasets.14 The RobustRankAggreg package15 was preliminarily employed to identify differentially expressed genes. Before and after batch correction with sva package,16 an analysis using MsigDB C8 was conducted to screen and process the presence of non-PBMC cells and the correlated marker genes.17,18
 |
Figure 1 Flow chart of research design and analysis. |
Identification of DEGs and Enrichment Analysis
In this study, the R limma package19 was utilized to pinpoint differentially expressed genes (DEGs) within the processed microarray data, with the filtering criteria established as: |log2 Fold Change (FC)| > 1 and Adjusted p value < 0.05. Genes that satisfied these conditions were designated as DEGs. Following this, Gene Ontology (GO) analysis and Kyoto Encyclopedia of Genes and Genomes (KEGG) analysis were undertaken to delve deeper into the functional annotations and pathways correlated with the pinpointed DEGs.20
Identification of Potential m6A Regulators
To explore the influence of m6A regulatory genes in SLE, we performed a comprehensive analysis encompassing all samples from the combined dataset. Employing the linear modeling technique available in the R limma package, we discerned significant m6A regulatory genes showcasing statistically noteworthy disparities in expression levels between SLE samples and healthy controls (HCs) (p < 0.05). For a visual representation of these discrepancies, boxplots were crafted using the ggpubr package, and heatmaps were generated with the pheatmap package.
Formulation of RF, SVM, and Nomogram Models Related to m6A Regulators
Classifiers utilizing RF and SVM were developed to pinpoint characteristic m6A regulatory genes among significant genes and to project the occurrence of SLE. m6A regulatory genes exhibiting differential expression were discerned from datasets GSE50772, GS61635, GSE72509, and GSE81622. The precision of the models was evaluated through “boxplots of residual”, “reverse cumulative distribution of residual”, and “receiver operating characteristic (ROC)” curves. The RF model, crafted with the randomForest package21 in R, gauged the importance of pivotal m6A regulatory genes using the chosen optimal ntree. To forecast SLE incidence utilizing feature m6A regulatory genes, a nomogram model was devised utilizing the rms package22 in R. A calibration chart facilitated a comparison of predicted and actual values. Additionally, we executed a decision curve analysis (DCA) and plotted a clinical impact curve to evaluate the benefits of the model for patients.
Construction of Weighted Gene Co-Expression Network Analysis
In our research, the R “WGCNA” package23,24 was utilized to craft a co-expression network focusing on DEGs. To structure this network, a weighted adjacency matrix was formulated, ensuring the soft thresholding parameter accentuated strong gene associations and minimized weak ones. This matrix was subsequently converted into a topological overlap matrix (TOM) to gauge gene network connectivity. The TOM was instrumental in determining dissimilarity among neighboring genes, recognizing those with analogous expression patterns through average linkage hierarchical clustering. The ensuing clusters, distinguished by varied colors in the cluster tree, signified gene modules. By examining module interconnections and evaluating the interplay between gene modules and phenotypes, modules linked to clinical attributes were pinpointed.
Screening of Candidate Hub Genes
To predict SLE status, three machine learning methodologies were utilized: RF, LASSO, and SVM-RFE, denoting Random Forest, amalgamates multiple decision trees, providing predictions as an ensemble learning strategy, and notably manages classification and regression issues while showcasing resistance to noise and overfitting. Moreover, it provides a ranking of feature importance and adeptly manages absent data. LASSO, a regularization approach, introduces a penalty component to the linear regression’s loss function. It executes variable selection and coefficient shrinkage, effectively nullifying the coefficients of irrelevant variables to circumvent overfitting. SVM-RFE amalgamates SVM with backward elimination, training an SVM model with a comprehensive feature set, then iteratively discarding the feature with minimal weight until the desired feature quantity is attained. This strategy enables SVM-RFE to meticulously select the most pertinent features for classification, thereby enhancing the precision and efficacy of SVM.
Human Blood Specimen Collection
This study recruited SLE patients aged 18–65 years, including both newly diagnosed individuals in outpatient or inpatient settings and existing patients with exacerbations requiring hospitalization. Peripheral blood samples were collected from 32 diagnosed SLE patients and compared with samples from 20 healthy volunteers, who were enlisted from the Dermatology Departments of the First and Second hospital of Army Medical University. Disease activity was assessed using the SLEDAI score. Exclusion criteria included patients with controlled SLE after prolonged treatment (over 3 months), those currently on targeted medications such as rituximab, individuals with a lack of legal capacity, an inability to understand study risks and follow-up requirements, a history of substance abuse, and complex medical conditions like malignancies or blood disorders. All participants provided informed consent, in accordance with ethical standards. The separation of peripheral blood mononuclear cells (PBMCs) from peripheral blood was accomplished through Ficoll-Paque density gradient separation, with both PBMCs and serum subsequently being cryopreserved for future use. Compliance with the Declaration of Helsinki was ensured for all procedures involving human participants. Moreover, all experimental protocols received approval from the Ethics Committee at the First Affiliated Hospital of Army Medical University, Chongqing, China (approval no. KY2020317).
Real-Time Quantitative PCR Assay
RNA isolation was performed utilizing RNAiso Plus reagent (Takara, Shiga, Japan), and the generation of mRNA first-strand cDNA was executed with a PrimeScript™ RT Reagent Kit with gDNA Eraser (Takara). Subsequent real-time PCR analysis was conducted employing TB Green Premix Ex Taq II (Takara) on a Bio-Rad real-time PCR apparatus (California, USA). GAPDH housekeeping gene primers (Sangon Biotech, Shanghai, China) were employed to assure normalization of expression data. Relative gene expression was evaluated through relative quantification, with the primer sequences being detailed in Table 1.
 |
Table 1 Sequence of PCR Primers |
MeRIP-qPCR
All procedures were conducted following the guidelines outlined in the EpiGentek MeRIP kit manual (EpiGentek, P-9018). Total RNA was extracted from cells or tissues and DNase I treatment was performed to remove any DNA contamination. The RNA concentration and quality were assessed using NanoDrop. Around 400 ng of total RNA was subjected to cleavage and removal of non-target m6A sequences using the Cleavage Enzyme Mix and Cleavage Buffer, incubated at 37 °C for 30 min. The cleaved RNA fragments were subsequently immunoprecipitated with 5 µg of anti-m6A antibody and Immunoprecipitation Buffer, with incubation at 25 °C for 1 h. Immunoprecipitation with Affinity Beads followed at 4 °C for 5 h. Affinity Beads were washed thoroughly with Wash Buffer to remove non-specifically bound RNA fragments and impurities. The bound m6A RNA fragments were eluted from the Affinity Beads using Elution Buffer, incubated at 55 °C for 15 min. The eluted m6A RNA fragments were then purified with RNA Binding Beads and RNA Purification Solution, incubated at room temperature for 10 min, followed by elution from the RNA Binding Beads with Elution Solution at room temperature for 2 min. The concentration and quality of the purified m6A RNA fragments were measured using NanoDrop to ensure there was no degradation or contamination. The expression levels of genes of interest within the m6A RNA fragments were analyzed using RT-qPCR and compared with input RNA or non-immunoprecipitated (IgG) controls.
Functional Enrichment Analysis of MMP9
GSVA analysis, a variant of the GSEA algorithms, explored variations in biological pathways between different pattern clusters based on enrichment scores. The GSVA R Package25 was utilized to conduct functional enrichment analysis on SLE samples within the merged dataset, yielding enrichment pathways. Analysis was performed using “c2.cp.kegg.Hs.symbols.gmt”, with an adjusted p value < 0.05 indicating a statistical difference between distinct clusters. For immune function exploration, samples from the control group were excluded, and repetitive samples underwent average processing, discarding rows with an average expression value of zero. Immune function gene sets were sourced from the “immune.gmt file”, and samples were analyzed using the ssGSEA method to determine the enrichment level of immune function gene sets in each one. Raw scores for immune function were normalized between 0 and 1 for subsequent analysis. Samples were bifurcated into two groups based on MMP9 expression level, categorizing samples above the median as “High” and those below as “Low”. Box plots illustrated the score distribution of various immune functions in the two sample groups, with each plot representing a specific immune function, the box delineating the interquartile range, and the lines depicting the full score range.
Mendelian Randomization
All the Data were sourced from an accessible database, and a two-sample Mendelian Randomization (MR) was deployed to explore any causal links between the hub gene and the susceptibility to SLE, defining SNPs as instrumental variables (IVs). The data for the hub gene was extracted from publicly accessible Genome-Wide Association Study (GWAS) resources. We focused on the m6A-related gene, MMP9, and IS as an illustrative complication of SLE for MR analysis. And specific datasets were employed for both the exposure and outcome variables. The detailed information on the MMP9 exposure dataset is accessible at the GWAS catalog with the dataset ID ebi-a-GCST90010240, available at https://gwas.mrcieu.ac.uk/datasets/ebi-a-GCST90010240/. Correspondingly, the dataset for the outcome variable, Ischemic Stroke, is listed under the ID ebi-a-GCST006908, which can be found at https://gwas.mrcieu.ac.uk/datasets/ebi-a-GCST006908/. These datasets were meticulously chosen to enhance the precision and relevance of our MR analysis. The analysis of MR was facilitated using the TwoSampleMR package26 in R. Data IDs for the designated exposure factor and outcome were pinpointed. Considering the limited number of SNPs associated with the specific gene at the standard GWAS threshold (5e-08), we opted for a p value threshold of 5e-05 to ensure an adequate number of SNPs as IVs. All selected SNPs had an R² greater than 0.01 and an F-statistic greater than 10, indicating their sufficient strength as effective IVs. Furthermore, the robustness of the results was validated through MR Egger regression analysis. The corresponding SNP information from the GWAS data for the outcome was retrieved using the list of instrumental SNPs for the exposure factor. The next step involved merging the GWAS data for the exposure factor and outcome, aligning effect alleles to ensure a uniform direction of effect for the same SNP in both datasets. MR analysis was then performed using various methods including “IVW” (Inverse Variance Weighting), “MR Egger”, “Weighted”, “Weighted Median”, and “Simple Mode” to gauge the causal effect between the exposure factor and the outcome, producing confidence intervals and p values in the process. We proceeded with heterogeneity analysis and pleiotropy tests and created scatter plots, forest plots, and funnel plots for visual representation of the MR results. To conclude, a leave-one-out sensitivity analysis was executed to evaluate the stability of the findings.
Statistical Analysis
Disparities in gene expression between individuals with SLE and HCs were analyzed using Student’s t-test. The discriminative power of key genes was assessed through ROC curve analysis and AUC computation using the pROC package27 in R. Statistical evaluations were performed employing R software (version 4.2.1) and GraphPad Prism (version 9.0.0).
Results
Identification of DEGs Between SLE Patients and HCs
In a retrospective analysis of four microarrays - GSE50772, GSE61635, GSE72509, and GSE81622 - a collective total of 289 SLE patient samples and 93 HC samples were evaluated. Utilizing the limma R software package post batch-effect mitigation, 171 DEGs were pinpointed from the metadata: with 86 genes being notably up-regulated and 85 genes distinctly down-regulated in SLE patient samples relative to HCs (Figure 2A and B).
 |
Figure 2 Genes differentially expressed between the two cohorts. (A) Heat map illustrating the differential gene expression analysis from the amalgamated dataset following the mitigation of batch effects. (B) Volcano plot depicting the differential analysis results of the data set. (C) GO enrichment analysis of potential hub genes. (D) KEGG pathways related to candidate hub genes. |
Functional Enrichment Analysis
The clusterProfiler package28 in R was utilized to execute GO and KEGG analyses on the 171 identified DEGs. The findings revealed that the DEGs primarily participated in the response to virus, vesicle lumen, and olfactory receptor activity (Figure 2C). Moreover, KEGG analysis unveiled several notable signaling pathways, including Olfactory transduction, Coronavirus disease (COVID-19), and Influenza A (Figure 2D).
Identification of m6A Regulators in SLE
Seventeen m6A regulatory genes were identified, encompassing six writers, nine readers, and two erasers. Disparities in the expression levels of these seventeen genes between SLE patients and HCs are showcased (Figure 3A). Twelve genes exhibited statistically significant expression deviations (p < 0.05). Specifically, YTHDF3, IGFBP2, and IGFBP3 were upregulated in SLE, while METTL14, ZC3H13, RBM15B, YTHDF1, YTHDF2, HNRNPC, IGF2BP1, FTO, and ALKBH5 were downregulated. The heatmap for these twelve pivotal genes is depicted (Figure 3B).
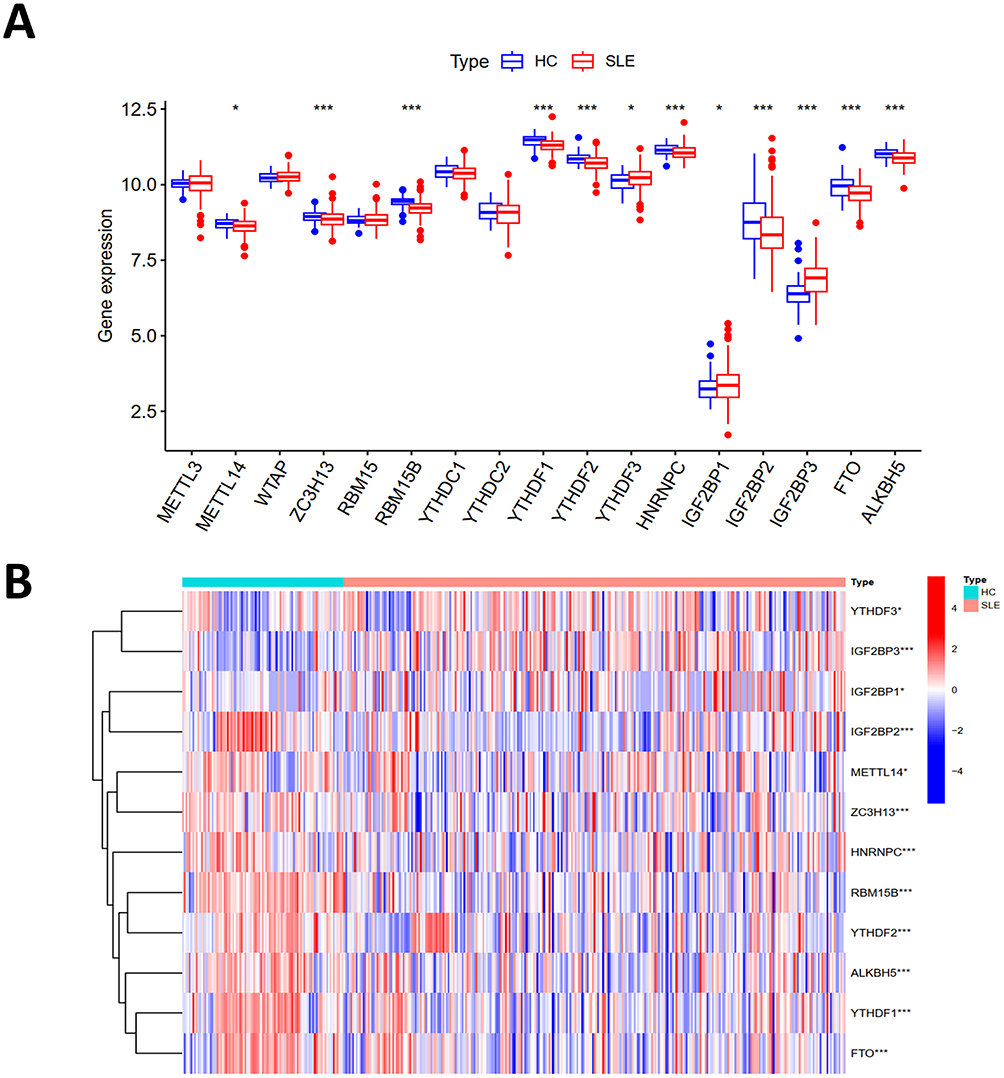 |
Figure 3 The m6A regulatory genes in samples from SLE and HC. (A) The boxplot illustrating differential expression of 17 m6A regulatory genes between SLE patients and HC. (B) Heat map displaying differential expression analysis of the combined dataset following the removal of batch effects. (*p < 0.05, ***p < 0.001). |
Construction of RF, SVM and Nomogram Models
The RF model showcased commendable performance, highlighted by a diminished residual value in comparison to the Support Vector Machine (SVM) model (Figure 4A and B). This superior performance of the RF model can be ascribed to its proficiency in managing intricate interactions and non-linear associations among variables, as well as its adeptness at mitigating overfitting and bias by averaging outcomes across decision trees. Thus, we opted for the RF model for ensuing analyses (Figure 4C). Upon ranking the notable m6A regulatory genes based on their importance scores, it was observed that all genes held scores exceeding 5 (Figure 4G), making them eligible for inclusion within the nomogram model (Figure 4H). In the nomogram, each gene was scored individually, and the comprehensive score to predict SLE incidence was computed by tallying these scores. The calibration curves (Figure 4D) illustrated a tight congruence between the solid and dotted lines, signaling the model was well-calibrated. Moreover, the decision curve analysis (DCA) (Figure 4E), demonstrated a notable divergence of the red line, representative of the m6A genes, from the baseline gray and black lines. This divergence underscores the potential utility of m6A genes in contributing to the prognostic assessment of SLE. Complementing this, the clinical impact curve (Figure 4F) provided additional support for the relevance of these genes, indicating their significance in the broader context of SLE pathophysiology.
 |
Figure 4 The RF model and SVM model. (A) Boxplots of residuals for the RF model. (B) Residual distribution for RF and SVM models. (C) Error levels for SLE groups, HC groups, and all samples. (D) Calibration curves for the nomogram model. (E) Decision curve showing feasibility of the model. (F) Clinical impact curve demonstrating model’s potential clinical benefit. (G) Bubble plot illustrating gene importance. (H) Nomogram model predicting incidence based on m6A regulatory genes. |
Identification and Validation of Potential Biomarkers
The LASSO was employed to scrutinize the 171 DEGs for potential biomarkers of SLE, revealing 34 genes of potential diagnostic relevance (Figure 5A). The SVM-RFE algorithm also analyzed the 171 DEGs and yielded 39 genes (Figure 5B–D). Moreover, Random Forrest identified 31 feature genes (Figure 5E and F). The WGCNA was constructed based on the DEGs. A total of 19 modules containing 348 hub genes were identified (Figure 6A–C). Only four genes, EPSTI1, USP18, HP, MMP9 were common to all approaches (Figure 6D), suggesting their importance in SLE diagnosis. We executed ROC analysis of the four crucial genes and the results showed that EPSTI1 (AUC=0.888), USP18 (AUC=0.870), HP (AUC=0.817), MMP9 (AUC=0.753) (Figure 6E).
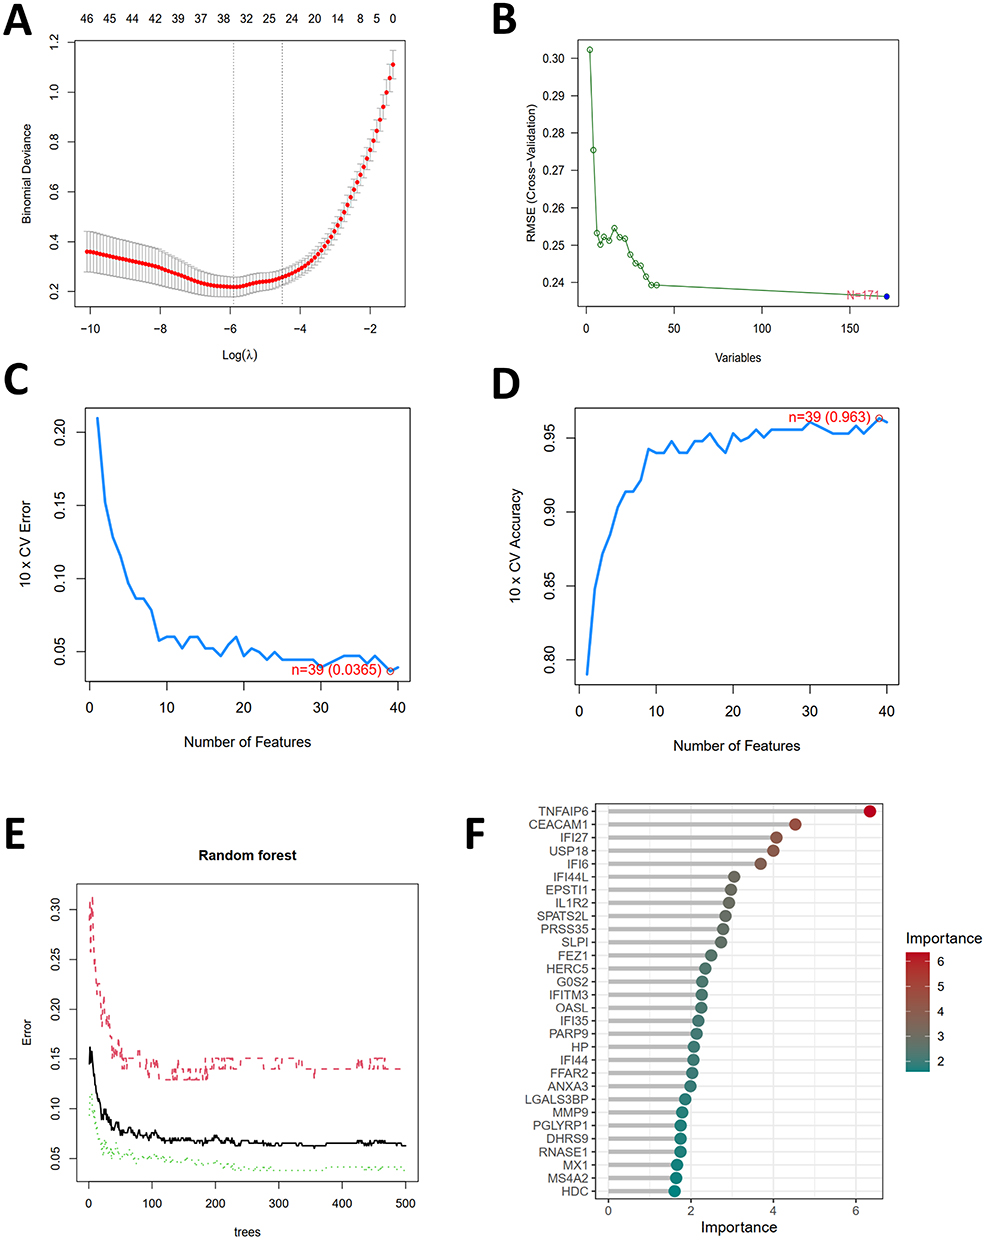 |
Figure 5 Selection of potential biomarkers for SLE. (A) Screening the tuning feature in LASSO model. (B) RMSE (Root Mean Squared Error) is a metric used for evaluating the performance of the SVM-RFE model. A smaller RMSE value indicates a better predictive capability of the model. (C and D) The feature selection in SVM-RFE model aims to identify the optimal subset of features to enhance the model’s generalization capability and prediction accuracy. (E) The performance of the random forest model varies with the number of trees, enabling the optimization of model settings to improve prediction accuracy while avoiding overfitting or underfitting. (F) Bubble plot of gene importance obtained from the random forest tree model. |
 |
Figure 6 Selection of diagnosis marker candidates for SLE. (A) Gene modules associated with SLE. (B) Clustering of all genes in the merged dataset based on a topological overlap matrix (1-TOM), yielding co-expression modules depicted in various colors. (C) A scatter plot highlighted the yellow module’s robust positive correlation with SLE in the merged dataset. (D) A Venn diagram showcased four diagnostic biomarkers shared among LASSO, SVM-RFE, RF, and WGCNA. (E) ROC curves were employed to assess the diagnostic relevance of hub genes in SLE. |
MMP9 Associated with m6A Modification in SLE
The expression levels of EPSTI1, USP18, HP and MMP9 were all significantly up-regulated in SLE compared to HCs (Figure 7A and B). The increased methylation level of MMP9 RNA was confirmed by MeRIP qPCR while the others showed no significance (Figure 7C).
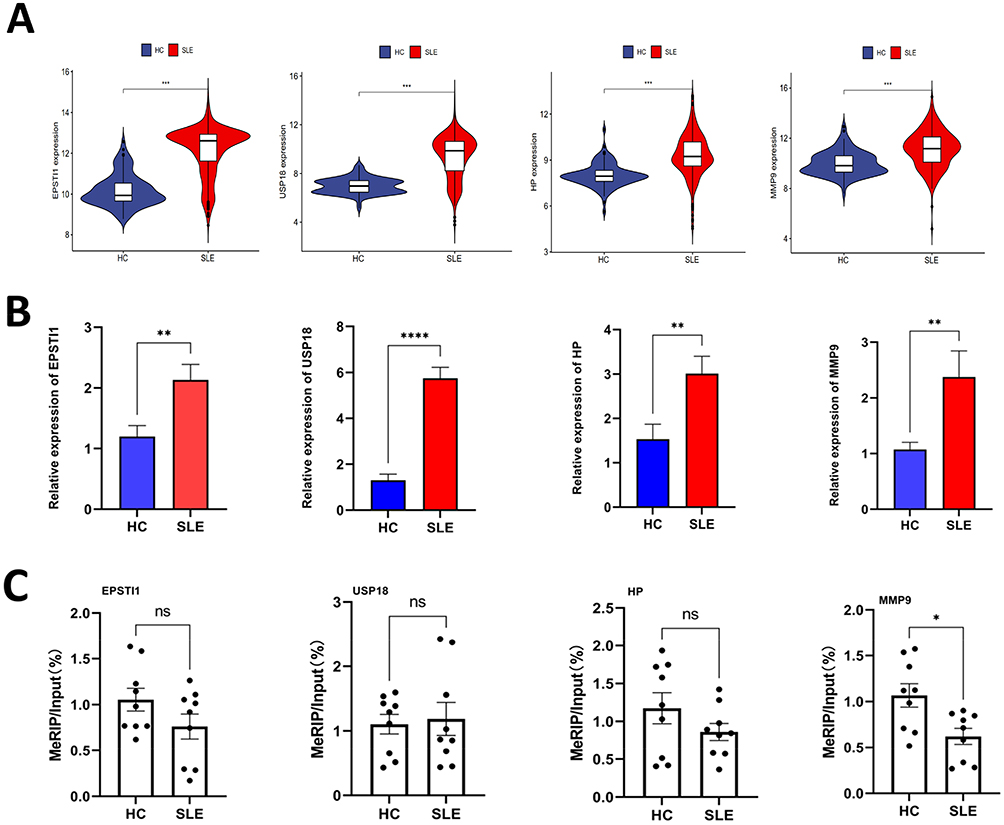 |
Figure 7 The m6A modification level and gene expression level of hub genes. (A) Violin plots illustrating the expression profiles of four hub genes. (B) Validation of the expression levels of four hub genes in SLE using RT-qPCR. (C) Verification of the m6A modification levels of four crucial genes in SLE through MeRIP-qPCR. (*p < 0.05, **p < 0.01, ***p < 0.001, **** p < 0.0001). Abbreviation: ns, no significance. |
To characterize the immune cell composition of the two cohorts, CIBERSORT was employed, revealing statistically significant differences in macrophages and CD8+ T cells (Figure 8A and B). This finding suggests a correlation between MMP9 expression and immune cell infiltration, implying that MMP9 may play a role in regulating immune cells in SLE patients (Figure 8A–C).
 |
Figure 8 MMP9 is related to immunocyte infiltration levels. (A) Correlation map illustrating the relationship between MMP9 expression and macrophages. (B) Correlation map illustrating the relationship between MMP9 expression and CD8+ T cells. (C) Lollipop plot visualizing the correlation between MMP9 and immune cells. Text highlighted in red indicates p values that are less than 0.05, denoting statistical significance. |
Functional Analysis of Different Molecular Subtypes
GSVA enrichment analysis found that gene sets pertaining to MMP9 grouping predominantly encompass pathways of immunological significance and metabolic relevance (Figure 9A). In addition, the immunological functional analysis boxplot reveals that in various immune cell types or functions, such as aDCs (activated dendritic cells). A significant difference in scores is evident between the high and low gene expression groups. (Figure 9B).
 |
Figure 9 Functional enrichment analysis of MMP9. (A) Pathway enrichment analysis and a bar graph representation of DEGs in different subtypes were performed using GSVA. (B) Box plot analysis of immune functions illustrates the distribution of scores for various immune functions, based on the grouping of samples by the expression levels (high and low) of the target gene MMP9. Each box plot represents a specific immune function, with the box itself depicting the interquartile range of the scores and the whiskers extending to show the full range of the scores. (*p < 0.05, **p < 0.01, ***p < 0.001). |
MMP9 is Causally Associated with Ischemic Stroke
Ischemic stroke is one of the significant complications associated with SLE.7,8 Recent studies on MMP9 and ischemic stroke has provided valuable insights into the complex interplay between MMP9 and various aspects of ischemic stroke, including blood brain barrier (BBB) dysfunction, cognitive impairment, therapeutic targets and pathophysiological changes.9–11 The SNPs characteristics of MMP9 and Ischemic stroke were considered robust instrumental variables (Supplementary Table S2). Figures 10A and C illustrate the individual genetic variations’ causal effects on SLE. Utilizing the IVW method, we identified a significant association between MMP9 and IS, with an odds ratio (OR) of 1.0134 (95% CI = 1.0004–1.0266, p = 0.0440). However, the MR-Egger method did not reveal a statistically significant effect (OR = 1.0173, 95% CI = 0.9951–1.0400, p =0.1314) (Supplementary Table S3). The funnel plot representing the causal effect displayed approximate symmetry (Figure 10B), and the MR Egger regression’s intercept indicated no horizontal pleiotropy (p = 0.6725), further affirming the absence of biased causal effects (Supplementary Table S4). The heterogeneity tests yielded a Q statistic of 72.8263 with 70 degrees of freedom (p = 0.3852) for MR Egger and a Q statistic of 73.0138 with 71 degrees of freedom (p = 0.4117) for the IVW method, indicating no significant heterogeneity in the causal effects (Supplementary Table S5). Figure 10D presents the systematic MR analysis conducted on the remaining SNPs after each SNP was excluded. The consistent results suggest that the causal significance remains intact for all SNPs, indicating the absence of a dominant SNP influencing MMP9 levels and IS. These findings validate the previous MR results.
 |
Figure 10 Two sample Mendelian randomization study results. (A) Scatter plot depicting the causal impact of MMP9 on the susceptibility to ischemic stroke. (B) Funnel plots utilized to assess the overall heterogeneity of MR estimates for the influence of MMP9 on ischemic stroke. (C) Forest plot showcasing the causal effect of individual SNPs on the risk of ischemic stroke. (D) Leave-one-out plot employed to visualize the causal effect of MMP9 on ischemic stroke risk when excluding one SNP at a time. |
Discussion
SLE is a multifaceted autoimmune disease characterized by a wide array of clinical manifestations and constrained therapeutic strategies.1,2 The exploration of alternative mechanisms contributing to SLE is of paramount importance. Recent investigations have underscored the profound influence of epigenetics, specifically m6A RNA modification, in the etiology of SLE.7,8,12
Within the immune system’s framework, m6A plays an indispensable role in orchestrating the activation, differentiation and function of both innate and adaptive immune cells, including T cells,29–31 B cells32 and dendritic cells,33,34 etc. Moreover, m6A is implicated in DNA repair and immune tolerance, processes intrinsically linked to the genesis of autoantigens and autoimmune responses.35 With the advent of cutting-edge molecular biology techniques, the scrutiny of m6A-associated genes in SLE’s pathogenesis has emerged as a focal research domain, targeting the discovery of innovative and efficacious therapeutic interventions.
Diagnostic biomarkers serve as vital instruments for discerning pathological alterations in patients. Contemporary research is concentrated on authenticating biomarkers explicitly correlated to SLE.36 Zhao et al indicated that the methylation status of the IFI44L promoter serves as a potent discriminator between patients with SLE, healthy individuals and those with other autoimmune disorders.37 Recent studies employed bioinformatics to pinpoint DEGs and appraise their diagnostic accuracy through ROC curve analysis, accentuating IFI44 as a propitious diagnostic biomarker.38–41 Concurrently, other inquiries utilizing DEG and WGCNA analyses have identified immune-related pathways associated with SLE, with IFI27 manifesting potential diagnostic capabilities.38 Subsequent research has unveiled a positive association between TNFSF13B and OAS1 in SLE and metabolic syndrome, elucidating insights into comorbidity and prospective combined treatments for SLE with metabolic syndrome.42 Additional studies have laid the foundation for probing key genes (SPI1, MMP9, C1QA, CX3CR1, MNDA) linked to atherosclerosis in SLE patients.43 Furthermore, bioinformatics explorations have discerned DEGs predominantly connected to diverse viral infections, with HMGB1, ITGB2 and CREB5 as central genes.44
Our findings denote significant enrichment of DEGs in the olfactory transduction pathway, while the majority of other genes are affiliated with viral infections. The olfactory transduction pathway encompasses odor molecule binding, ion channel opening, neuron depolarization and signal transmission, coupled with sensitivity to environmental fluctuations. Recent research has correlated olfactory transduction with SLE, including alterations in olfactory function in SLE patients and its association with olfactory dysfunction.45 Integrative models of N6-methyladenosine immunity in SLE have demonstrated a positive correlation between olfactory transduction and the pathway involving neuroactive ligand-receptor interactions.5 Additionally, longitudinal studies on SLE and systemic sclerosis have associated olfactory dysfunction in SLE with variables such as age, disease activity, heightened anxiety and depression symptoms, suggesting potential diagnostic and therapeutic implications.46 Nevertheless, comprehensive research is requisite to fully comprehend the exact relationship and underlying mechanisms between the olfactory transduction pathway and SLE.
In the pursuit of potential biomarkers, we intersected key genes derived from Random Forest, SVM-RFE, LASSO and WGCNA analyses. MeRIP-qPCR validation corroborated the association of m6A modification with MMP9 among these genes. Additionally, the RM2target database predicts interactions between MMP9 and ALKBH5, FTO, METTL3, METTL14 and YTHDF2, substantiated by in vitro experimental evidence.47
MMP9, an enzyme proficient in degrading extracellular matrix and immune complexes, is augmented in SLE patients and intimately associated with disease activity and organ damage.48 The pathogenesis of MMP9 encompasses multifarious mechanisms, including self-antigen degradation, immune complex clearance, cell apoptosis regulation, cell adhesion and migration modulation, angiogenesis participation and inflammatory responses.49–51 MMP9 also facilitates the release of NETs, which can instigate autoimmunity and tissue impairment.51 Additionally, the escalation of MMP9 expression in the kidneys of SLE patients is correlated with lupus nephritis development and progression.52,53 Moreover, MMP9 is connected to atherosclerosis and myocardial injury in the cardiovascular system of SLE patients.43 MMP9’s ramifications extend to the nervous system, with associations to neuro-psychiatric symptoms through blood-brain barrier degradation and immune cell infiltration.54–56 These multifaceted impacts accentuate MMP9’s significance as a prospective therapeutic target for managing immune dysregulation, tissue damage and organ complications in SLE.
Recent investigations have elucidated the multifaceted connection between SLE and Ischemic Stroke. These studies encompass the correlation between the genetic predisposition to SLE and the concomitant risk of IS, the manifestation of neurological complications within the SLE patient population and the methodologies employed in the therapeutic intervention of IS in the context of SLE.57–60 MMP9’s activation during the acute phase can precipitate blood-brain barrier disruption, brain edema formation and hemorrhagic transformation.56,61,62 Studies intimate a correlation between MMP9 levels and the risk of severe brain edema, hemorrhagic transformation and adverse functional outcomes.63 SNPs in the MMP9 gene may also influence the occurrence and prognosis of IS. Some studies have found that the genetic polymorphism of MMP9 is related to the risk and prognosis of IS.64–66 For example, the MMP9 rs17576 polymorphism is associated with an increased risk of IS in the Han Hakka population and interacts with the MMP12 rs660599 polymorphism, further increasing the risk of IS.67 In addition to the genetic level, MMP9 is also closely related to IS at the protein level. Some studies have found that the level of MMP9 in the serum or plasma of IS patients is elevated and is related to the severity and adverse outcomes of IS.68–70 Other studies have found that there is an elevation of MMP9 in choroid plexus epithelial cells (CPECs) of IS patients, leading to the degradation of tight junction proteins (TJs) and disruption of the blood-cerebrospinal fluid barrier, thus promotes the infiltration of immune cells and neuronal death.71 In summary, MMP9 has a complex and important relationship with IS and can affect the occurrence and development of IS from multiple aspects. Some therapeutic strategies targeting MMP9 have been validated in animal models or clinical trials, such as using MMP inhibitors or neutralizing antibodies to reduce the activity or expression of MMP9.62 However, these strategies still have some limitations and uncertainties and need further optimization and validation. In our study, a two-sample MR analysis employing GWAS data of MMP9 and IS identified a causal association between MMP9 expression levels and an augmented risk of IS, furnishing more reliable outcomes compared to conventional observational studies.72,73
In our exploration of the connections between MMP9, m6A modifications, IS, and SLE, we have unveiled a complex web of interrelated factors and influences among these elements. The role of MMP9 in SLE is particularly crucial, as it is not only involved in immune cell migration and inflammatory responses but is also closely related to the prognosis of ischemic stroke. Furthermore, specific genetic variations in MMP9 have been linked to an increased risk of IS, a common complication in SLE, underscoring a potential connection between MMP9 and the co-occurrence of these two conditions.
m6A modifications are pivotal in SLE, particularly through their impact on the expression of hub genes, including MMP9. The m6A modification of MMP9 plays a critical role, indirectly influencing the occurrence of IS in patients with SLE. Changes in this epigenetic mechanism might modulate inflammatory responses and vascular stability, thereby impacting the risk of IS.
Our research suggests that alterations in m6A modifications and the upregulation of MMP9 within the context of SLE could jointly affect inflammatory processes, and the upregulation of MMP9 might be associated with the risk of IS in SLE patients. These insights provide a new perspective on understanding SLE and its complications, offering valuable guidance for future therapeutic strategies. By considering these factors collectively, our analysis not only deepens the understanding of the links between SLE and IS but also directs future research and clinical practice.
Despite the significant discoveries made in our study, there are several limitations. Firstly, there is a scarcity of GSE datasets directly relevant to the pathogenic mechanisms of m6A modification in SLE. This limits our ability to deeply explore the role of m6A modification in SLE. Secondly, the relatively small sample size used in our study may impact the generalizability and reliability of our findings. Additionally, potential biases in sample selection suggest that our results might not be fully applicable to a wider population. Moreover, our machine learning models were mainly used for feature selection and preliminary biomarker screening, rather than for complex predictive or classification tasks. Finally, while advanced bioinformatics techniques and statistical methods were employed, our analysis was confined to gene expression data. Future studies incorporating other types of data, such as protein expression and clinical data, could provide more comprehensive insights.
Conclusion
In conclusion, the m6A regulatory genes may exert a significant influence on the pathogenesis of SLE. In the context of SLE, the expression of MMP9 is subject to regulation by m6A modification and exhibits a significant correlation with ischemic stroke associated with SLE. This observation may contribute to the advancement of pre-symptomatic diagnostic methodologies and furnish additional insights into the underlying molecular mechanisms, thereby enhancing the comprehension of risk genes pertinent to SLE.
Data Sharing Statement
Publicly available datasets were analyzed in this study. This data can be found here: https://www.ncbi.nlm.nih.gov/, GSE50772, GSE61635, GSE72509 and GSE81622.
Ethics Statement
The studies involving human participants were reviewed and approved by the Ethics Committee of the First Affiliated Hospital of Army Medical University. It is noted that informed consent was obtained from the patients and individuals involved in the original studies.
Acknowledgments
We thank the authors who provided the GEO public datasets. All claims expressed in this article are solely those of the authors and do not necessarily represent those of their affiliated organizations, or those of the publisher, the editors and the reviewers. Any product that may be evaluated in this article, or claim that may be made by its manufacturer, is not guaranteed or endorsed by the publisher.
Author Contributions
All authors made a significant contribution to the work reported, whether that is in the conception, study design, execution, acquisition of data, analysis and interpretation, or in all these areas; took part in drafting, revising or critically reviewing the article; gave final approval of the version to be published; have agreed on the journal to which the article has been submitted; and agree to be accountable for all aspects of the work.
Funding
This study received the support of the National Natural Science Foundation of China (No.81773316).
Disclosure
The authors declare that the research was conducted in the absence of any commercial or financial relationships that could be construed as a potential conflict of interest.
References
1. Tsokos GC, Lo MS, Costa Reis P, et al. New insights into the immunopathogenesis of systemic lupus erythematosus. Nat Rev Rheumatol. 2016;12(12):716–730. doi:10.1038/nrrheum.2016.186
2. Crow MK. Pathogenesis of systemic lupus erythematosus: risks, mechanisms and therapeutic targets. Ann Rheum Dis. 2023;82(8):999–1014. doi:10.1136/ard-2022-223741
3. Roundtree IA, Evans ME, Pan T, et al. Dynamic RNA modifications in gene expression regulation. Cell. 2017;169(7):1187–1200. doi:10.1016/j.cell.2017.05.045
4. Cui L, Ma R, Cai J, et al. RNA modifications: importance in immune cell biology and related diseases. Signal Transduct Target Ther. 2022;7(1):334. doi:10.1038/s41392-022-01175-9
5. Zhao X, Ge L, Wang J, et al. Exploration of potential integrated models of N6-methyladenosine immunity in systemic lupus erythematosus by bioinformatic analyses. Front Immunol. 2021;12:752736. doi:10.3389/fimmu.2021.752736
6. Huang Y, Xue Q, Chang J, et al. M6A methylation modification in autoimmune diseases, a promising treatment strategy based on epigenetics. Arthritis Res Ther. 2023;25(1):189. doi:10.1186/s13075-023-03149-w
7. Li LJ, Fan YG, Leng RX, et al. Potential link between m(6)A modification and systemic lupus erythematosus. Mol Immunol. 2018;93:55–63. doi:10.1016/j.molimm.2017.11.009
8. Lv X, Liu X, Zhao M, et al. RNA methylation in systemic lupus erythematosus. Front Cell Dev Biol. 2021;9:696559. doi:10.3389/fcell.2021.696559
9. Lu S, Wei X, Zhu H, et al. m(6)A methyltransferase METTL3 programs CD4(+) T-cell activation and effector T-cell differentiation in systemic lupus erythematosus. Mol Med. 2023;29(1):46. doi:10.1186/s10020-023-00643-4
10. Zhao X, Dong R, Zhang L, et al. N6-methyladenosine-dependent modification of circGARS acts as a new player that promotes SLE progression through the NF-κB/A20 axis. Arthritis Res Ther. 2022;24(1):37. doi:10.1186/s13075-022-02732-x
11. Wu J, Deng L-J, Xia Y-R, et al. Involvement of N6-methyladenosine modifications of long noncoding RNAs in systemic lupus erythematosus. Mol Immunol. 2022;143:77–84. doi:10.1016/j.molimm.2022.01.006
12. Zhou W, Wang X, Chang J, et al. The molecular structure and biological functions of RNA methylation, with special emphasis on the roles of RNA methylation in autoimmune diseases. Crit Rev Clin Lab Sci. 2022;59(3):203–218. doi:10.1080/10408363.2021.2002256
13. Barrett T, Wilhite SE, Ledoux P, et al. NCBI GEO: archive for functional genomics data sets--update. Nucleic Acids Res. 2013;41(Database issue):D991–D995. doi:10.1093/nar/gks1193
14. Law CW, Chen Y, Shi W, et al. voom: precision weights unlock linear model analysis tools for RNA-seq read counts. Genome Biol. 2014;15(2):R29. doi:10.1186/gb-2014-15-2-r29
15. Kolde R, Laur S, Adler P, et al. Robust rank aggregation for gene list integration and meta-analysis. Bioinformatics. 2012;28(4):573–580. doi:10.1093/bioinformatics/btr709
16. Leek JT, Johnson WE, Parker HS, et al. The sva package for removing batch effects and other unwanted variation in high-throughput experiments. Bioinformatics. 2012;28(6):882–883. doi:10.1093/bioinformatics/bts034
17. Subramanian A, Tamayo P, Mootha VK, et al. Gene set enrichment analysis: a knowledge-based approach for interpreting genome-wide expression profiles. Proc Natl Acad Sci U S A. 2005;102(43):15545–15550. doi:10.1073/pnas.0506580102
18. Liberzon A, Birger C, Thorvaldsdóttir H, et al. The Molecular Signatures Database (MSigDB) hallmark gene set collection. Cell Systems. 2015;1(6):417–425. doi:10.1016/j.cels.2015.12.004
19. Ritchie ME, Phipson B, Wu D, et al. limma powers differential expression analyses for RNA-sequencing and microarray studies. Nucleic Acids Res. 2015;43(7):e47. doi:10.1093/nar/gkv007
20. Kanehisa M, Goto S. KEGG: Kyoto Encyclopedia of Genes and Genomes. Nucleic Acids Res. 2000;28(1):27–30. doi:10.1093/nar/28.1.27
21. Liaw A, Wiener MC. Classification and regression by randomforest. R News. 2002;2(3):18–22.
22. Harrell JFE. Regression Modeling Strategies: With Applications to Linear Models, Logistic Regression, and Survival Analysis. New York: Springer; 2001.
23. Langfelder P, Horvath S. WGCNA: an R package for weighted correlation network analysis. BMC Bioinf. 2008;9(1):559. doi:10.1186/1471-2105-9-559
24. Langfelder P, Horvath S. Fast R functions for robust correlations and hierarchical clustering. J Stat Softw. 2012;46(11). doi:10.18637/jss.v046.i11
25. Hänzelmann S, Castelo R, Guinney J. GSVA: gene set variation analysis for microarray and RNA-seq data. BMC Bioinf. 2013;14(1):7. doi:10.1186/1471-2105-14-7
26. Hemani G, Zheng J, Elsworth B, et al. The MR-Base platform supports systematic causal inference across the human phenome. Elife. 2018;7:e34408.
27. Robin X, Turck N, Hainard A, et al. pROC: an open-source package for R and S+ to analyze and compare ROC curves. BMC Bioinf. 2011;12(1):77. doi:10.1186/1471-2105-12-77
28. Wu T, Hu E, Xu S, et al. clusterProfiler 4.0: a universal enrichment tool for interpreting omics data. Innovation. 2021;2(3):100141. doi:10.1016/j.xinn.2021.100141
29. Li HB, Tong J, Zhu S, et al. m(6)A mRNA methylation controls T cell homeostasis by targeting the IL-7/STAT5/SOCS pathways. Nature. 2017;548(7667):338–342. doi:10.1038/nature23450
30. Dong L, Chen C, Zhang Y, et al. The loss of RNA N(6)-adenosine methyltransferase Mettl14 in tumor-associated macrophages promotes CD8(+) T cell dysfunction and tumor growth. Cancer Cell. 2021;39(7):945–57.e10. doi:10.1016/j.ccell.2021.04.016
31. Ito-Kureha T, Leoni C, Borland K, et al. The function of Wtap in N(6)-adenosine methylation of mRNAs controls T cell receptor signaling and survival of T cells. Nat Immunol. 2022;23(8):1208–1221. doi:10.1038/s41590-022-01268-1
32. Zheng Z, Zhang L, Cui XL, et al. Control of early B cell development by the RNA N(6)-methyladenosine methylation. Cell Rep. 2020;31(13):107819. doi:10.1016/j.celrep.2020.107819
33. Han D, Liu J, Chen C, et al. Anti-tumour immunity controlled through mRNA m(6)A methylation and YTHDF1 in dendritic cells. Nature. 2019;566(7743):270–274. doi:10.1038/s41586-019-0916-x
34. Wang H, Hu X, Huang M, et al. Mettl3-mediated mRNA m(6)A methylation promotes dendritic cell activation. Nat Commun. 2019;10(1):1898. doi:10.1038/s41467-019-09903-6
35. Zhou MJ, Liu W, Zhang JY, et al. RNA m(6)A modification in immunocytes and DNA repair: the biological functions and prospects in clinical application. Front Cell Develop Biol. 2021;9:13. doi:10.3389/fcell.2021.794754
36. Sciascia S, Roccatello D, Radin M, et al. Differentiating between UCTD and early-stage SLE: from definitions to clinical approach. Nat Rev Rheumatol. 2022;18(1):9–21. doi:10.1038/s41584-021-00710-2
37. Zhao M, Zhou Y, Zhu B, et al. IFI44L promoter methylation as a blood biomarker for systemic lupus erythematosus. Ann Rheum Dis. 2016;75(11):1998–2006. doi:10.1136/annrheumdis-2015-208410
38. Zhao X, Zhang L, Wang J, et al. Identification of key biomarkers and immune infiltration in systemic lupus erythematosus by integrated bioinformatics analysis. J Transl Med. 2021;19(1):35. doi:10.1186/s12967-020-02698-x
39. Shen L, Lan L, Zhu T, et al. Identification and validation of IFI44 as key biomarker in lupus nephritis. Front Med Lausanne. 2021;8:762848. doi:10.3389/fmed.2021.762848
40. Zheng Q, Wang D, Lin R, et al. IFI44 is an immune evasion biomarker for SARS-CoV-2 and Staphylococcus aureus infection in patients with RA. Front Immunol. 2022;13:1013322. doi:10.3389/fimmu.2022.1013322
41. Jiang Z, Shao M, Dai X, et al. Identification of diagnostic biomarkers in systemic lupus erythematosus based on bioinformatics analysis and machine learning. Front Genet. 2022;13:865559. doi:10.3389/fgene.2022.865559
42. Wang Y, Huang Z, Xiao Y, et al. The shared biomarkers and pathways of systemic lupus erythematosus and metabolic syndrome analyzed by bioinformatics combining machine learning algorithm and single-cell sequencing analysis. Front Immunol. 2022;13:1015882. doi:10.3389/fimmu.2022.1015882
43. Liu C, Zhou Y, Zhou Y, et al. Identification of crucial genes for predicting the risk of atherosclerosis with system lupus erythematosus based on comprehensive bioinformatics analysis and machine learning. Comput Biol Med. 2023;152:106388. doi:10.1016/j.compbiomed.2022.106388
44. Li H, Zhang X, Shang J, et al. Identification of NETs-related biomarkers and molecular clusters in systemic lupus erythematosus. Front Immunol. 2023;14:1150828. doi:10.3389/fimmu.2023.1150828
45. Kapadia M, Zhao H, Ma D, et al. Sustained immunosuppression alters olfactory function in the MRL model of CNS lupus. J Neuroimmune Pharmacol. 2017;12(3):555–564. doi:10.1007/s11481-017-9745-6
46. Bombini MF, Peres FA, Lapa AT, et al. Olfactory function in systemic lupus erythematosus and systemic sclerosis. A longitudinal study and review of the literature. Autoimmun Rev. 2018;17(4):405–412. doi:10.1016/j.autrev.2018.02.002
47. Bao X, Zhang Y, Li H, et al. RM2Target: a comprehensive database for targets of writers, erasers and readers of RNA modifications. Nucleic Acids Res. 2023;51(D1):D269–D279. doi:10.1093/nar/gkac945
48. Faber-Elmann A, Sthoeger Z, Tcherniack A, et al. Activity of matrix metalloproteinase-9 is elevated in sera of patients with systemic lupus erythematosus. Clin Exp Immunol. 2002;127(2):393–398. doi:10.1046/j.1365-2249.2002.01758.x
49. de Almeida LGN, Thode H, Eslambolchi Y, et al. Matrix metalloproteinases: from molecular mechanisms to physiology, pathophysiology, and pharmacology. Pharmacol Rev. 2022;74(3):712–768. doi:10.1124/pharmrev.121.000349
50. Ugarte-Berzal E, Boon L, Martens E, et al. MMP-9/gelatinase B degrades immune complexes in systemic lupus erythematosus. Front Immunol. 2019;10:538. doi:10.3389/fimmu.2019.00538
51. Carmona-Rivera C, Zhao W, Yalavarthi S, et al. Neutrophil extracellular traps induce endothelial dysfunction in systemic lupus erythematosus through the activation of matrix metalloproteinase-2. Ann Rheum Dis. 2015;74(7):1417–1424. doi:10.1136/annrheumdis-2013-204837
52. Phillips TM, Fadia M, Lea-Henry TN, et al. MMP2 and MMP9 associate with crescentic glomerulonephritis. Clin Kidney J. 2017;10(2):215–220. doi:10.1093/ckj/sfw111
53. Jiang Z, Sui T, Wang B. Relationships between MMP-2, MMP-9, TIMP-1 and TIMP-2 levels and their pathogenesis in patients with lupus nephritis. Rheumatol Int. 2010;30(9):1219–1226. doi:10.1007/s00296-009-1135-9
54. Beroun A, Mitra S, Michaluk P, et al. MMPs in learning and memory and neuropsychiatric disorders. Cell Mol Life Sci. 2019;76(16):3207–3228. doi:10.1007/s00018-019-03180-8
55. Vafadari B, Salamian A, Kaczmarek L. MMP-9 in translation: from molecule to brain physiology, pathology, and therapy. J Neurochem. 2016;139(Suppl 2):91–114. doi:10.1111/jnc.13415
56. Turner RJ, Sharp FR. Implications of MMP9 for blood brain barrier disruption and hemorrhagic transformation following ischemic stroke. Front Cell Neurosci. 2016;10:56. doi:10.3389/fncel.2016.00056
57. Yafasova A, Fosbøl EL, Schou M, et al. Long-term cardiovascular outcomes in systemic lupus erythematosus. J Am Coll Cardiol. 2021;77(14):1717–1727. doi:10.1016/j.jacc.2021.02.029
58. Gao N, Kong M, Li X, et al. Systemic lupus erythematosus and cardiovascular disease: a Mendelian randomization study. Front Immunol. 2022;13:908831. doi:10.3389/fimmu.2022.908831
59. Tektonidou MG, Wang Z, Ward MM. Brief report: trends in hospitalizations due to acute coronary syndromes and stroke in patients with systemic lupus erythematosus, 1996 to 2012. Arthritis Rheumatol. 2016;68(11):2680–2685. doi:10.1002/art.39758
60. Shaban A, Leira EC. Neurological complications in patients with systemic lupus erythematosus. Curr Neurol Neurosci Rep. 2019;19(12):97. doi:10.1007/s11910-019-1012-1
61. Di Biase L, Bonura A, Pecoraro PM, et al. Unlocking the potential of stroke blood biomarkers: early diagnosis, ischemic vs. haemorrhagic differentiation and haemorrhagic transformation risk: a comprehensive review. Int J Mol Sci. 2023;24(14):11545. doi:10.3390/ijms241411545
62. Chaturvedi M, Kaczmarek L. MMP-9 inhibition: a therapeutic strategy in ischemic stroke. Mol Neurobiol. 2014;49(1):563–573. doi:10.1007/s12035-013-8538-z
63. Jickling GC, Liu D, Stamova B, et al. Hemorrhagic transformation after ischemic stroke in animals and humans. J Cereb Blood Flow Metab. 2014;34(2):185–199. doi:10.1038/jcbfm.2013.203
64. Wen D, Du X, Nie S-P, et al. Association between matrix metalloproteinase family gene polymorphisms and ischemic stroke: a meta-analysis. Mol Neurobiol. 2014;50(3):979–985. doi:10.1007/s12035-014-8687-8
65. Misra S, Talwar P, Kumar A, et al. Association between matrix metalloproteinase family gene polymorphisms and risk of ischemic stroke: a systematic review and meta-analysis of 29 studies. Gene. 2018;672:180–194. doi:10.1016/j.gene.2018.06.027
66. Buraczynska K, Kurzepa J, Ksiazek A, et al. Matrix Metalloproteinase-9 (MMP-9) gene polymorphism in stroke patients. Neuromolecular Med. 2015;17(4):385–390. doi:10.1007/s12017-015-8367-5
67. Fan D, Zheng C, Wu W, et al. MMP9 SNP and MMP SNP-SNP interactions increase the risk for ischemic stroke in the Han Hakka population. Brain Behav. 2022;12(2):e2473.
68. Zhong C, Yang J, Xu T, et al. Serum matrix metalloproteinase-9 levels and prognosis of acute ischemic stroke. Neurology. 2017;89(8):805–812. doi:10.1212/WNL.0000000000004257
69. Zhong C, Bu X, Xu T, et al. Serum matrix metalloproteinase-9 and cognitive impairment after acute ischemic stroke. J Am Heart Assoc. 2018;7(1):e007776.
70. Zhang M, Meng X, Pan Y, et al. Predictive values of baseline matrix metalloproteinase 9 levels in peripheral blood on 3-month outcomes of high-risk patients with minor stroke or transient ischemic attack. Eur J Neurol. 2022;29(10):2976–2986. doi:10.1111/ene.15342
71. Wang J, Liu R, Hasan MN, et al. Role of SPAK-NKCC1 signaling cascade in the choroid plexus blood-CSF barrier damage after stroke. J Neuroinflammation. 2022;19(1):91. doi:10.1186/s12974-022-02456-4
72. Emdin CA, Khera AV, Kathiresan S. Mendelian randomization. JAMA. 2017;318(19):1925–1926. doi:10.1001/jama.2017.17219
73. Hartwig FP, Davies NM, Hemani G, et al. Two-sample Mendelian randomization: avoiding the downsides of a powerful, widely applicable but potentially fallible technique. Int J Epidemiol. 2016;45(6):1717–1726. doi:10.1093/ije/dyx028
 © 2024 The Author(s). This work is published and licensed by Dove Medical Press Limited. The full terms of this license are available at https://www.dovepress.com/terms.php and incorporate the Creative Commons Attribution - Non Commercial (unported, v3.0) License.
By accessing the work you hereby accept the Terms. Non-commercial uses of the work are permitted without any further permission from Dove Medical Press Limited, provided the work is properly attributed. For permission for commercial use of this work, please see paragraphs 4.2 and 5 of our Terms.
© 2024 The Author(s). This work is published and licensed by Dove Medical Press Limited. The full terms of this license are available at https://www.dovepress.com/terms.php and incorporate the Creative Commons Attribution - Non Commercial (unported, v3.0) License.
By accessing the work you hereby accept the Terms. Non-commercial uses of the work are permitted without any further permission from Dove Medical Press Limited, provided the work is properly attributed. For permission for commercial use of this work, please see paragraphs 4.2 and 5 of our Terms.