Back to Journals » Pharmacogenomics and Personalized Medicine » Volume 17
Identification of Lower Grade Glioma Antigens Based on Ferroptosis Status for mRNA Vaccine Development
Authors Zhao Z ![]() , Xing N
, Xing N ![]() , Guo H
, Guo H ![]() , Li J
, Li J ![]() , Sun G
, Sun G ![]()
Received 10 November 2023
Accepted for publication 16 March 2024
Published 11 April 2024 Volume 2024:17 Pages 105—123
DOI https://doi.org/10.2147/PGPM.S449230
Checked for plagiarism Yes
Review by Single anonymous peer review
Peer reviewer comments 2
Editor who approved publication: Dr Martin H Bluth
Zhenxiang Zhao,1 Na Xing,2 Hao Guo,3 Jianfeng Li,1 Guozhu Sun4
1Department of Neurosurgery, The Fourth Hospital of Hebei Medical University, Shijiazhuang, 050000, People’s Republic of China; 2Department of Endocrinology, The Fourth Hospital of Hebei Medical University, Shijiazhuang, 050000, People’s Republic of China; 3Department of Hepatobiliary Surgery, The Fourth Hospital of Hebei Medical University, Shijiazhuang, 050000, People’s Republic of China; 4Department of Neurosurgery, The Second Hospital of Hebei Medical University, Shijiazhuang, 050000, People’s Republic of China
Correspondence: Na Xing, Email [email protected]
Purpose: mRNA vaccines represent a promising and innovative strategy within the realm of cancer immunotherapy. However, their efficacy in treating lower-grade glioma (LGG) requires evaluation. Ferroptosis exhibits close associations with the initiation, evolution, and suppression of cancer. In this study, we explored the landscape of the ferroptosis-associated tumor microenvironment to facilitate the development of mRNA vaccines for LGG patients.
Patients and Methods: Genomic and clinical data of the LGG patients was obtained from the Cancer Genome Atlas (TCGA) and Chinese Glioma Genome Atlas (CGGA) databases. Ferroptosis-related tumor antigens were identified based on differential expression, mutation status, correlation with antigen-presenting cells, and prognosis, relevance to immunogenic cell death (ICD). Antigen expression levels in LGG specimens and cell lines were validated using real time-polymerase chain reaction (RT-PCR). Consensus clustering was employed for patient classification. The immune landscapes of ferroptosis subtypes were further characterized, including immune responses, prognostic ability, tumor microenvironment, and tumor-related signatures.
Results: Five tumor antigens, namely, HOTAIR, IDO1, KIF20A, NR5A2, and RRM2 were identified in LGG. RT-PCR demonstrated higher expression of these genes in LGG compared to the control. Twelve gene modules and four ferroptosis subtypes (FS1-FS4) of LGG were defined. FS2 and FS4, characterized as “cold” tumors due to their decreased tumor mutation burden (TMB) and immune checkpoint proteins (ICPs), were deemed appropriate candidates for the mRNA vaccine.
Conclusion: HOTAIR, IDO1, KIF20A, NR5A2, and RRM2 were identified as promising candidate antigens for the development of an LGG mRNA vaccine, particularly offering potential benefits to FS2 and FS4 patients.
Keywords: ferroptosis, lower grade glioma, mRNA vaccine, immunotherapy
Introduction
Glioma ranks as one of the most prevalent intracranial tumors with poor prognosis. Lower grade glioma (LGG), including the World Health Organization grades II and III, comprises the largest glioma subgroup.1,2 Currently, the first choice of LGG treatment is surgical resection, together with radiotherapy and chemotherapy3. However, this treatment still encounters a significant risk of developing acquired resistance.4 Hence, innovative approaches are imperative to enhance the treatment of LGG.5 The central nervous system and the immune system are not isolated but exhibit intricate connections.6 Studies have confirmed the effectiveness of immunotherapy for glioma.7 Glioma immunotherapies include immune checkpoint (ICP) inhibitors, oncolytic viral therapies, chimeric antigen receptor T cell therapy (CAR-T), and vaccines.8 Cancer vaccines can be categorized into three types according to their format and content, namely, nucleic acid vaccines, cell vaccines, and protein or peptide vaccines.9 The clinical trials of heat shock protein vaccines in patients with recurrent glioma indicated that they were both safe and well-tolerated.10 Another peptide vaccine that targets mutant IDH1 in glioma was found to be effective.11 However, there are still various challenges with these vaccines, such as the limited repertoire of defined antigens, tumor antigen escape, and physicochemical variations.12,13 One promising alternative approach involves nucleic acid vaccines, which facilitate the expression of peptide and protein antigens with the correct cellular protein modifications, and these vaccines come in two types: DNA and mRNA.14,15 mRNA vaccines are considered safer and more effective in comparison to DNA vaccines, primarily because the former do not alter the genome.16 The effectiveness of mRNA vaccines has been assessed within various malignancies. In gastrointestinal cancers, specific responses by T cells against neoepitopes resulting from mutations were observed, and after administration of the mRNA vaccine, T cell receptors that targeted the KRASG12D mutation could be isolated.17 In prostate cancer patients, the use of two mRNA vaccines have revealed significant tolerability and favorable immune response.18
Here, LGG antigens were investigated to identify novel candidates for the development of an mRNA vaccine. Ferroptosis, a unique type of cell death, is currently a hotspot in research.19 Facilitating ferroptosis in tumor cells holds promise as a therapeutic strategy, specifically for drug-resistant malignancies. In glioma samples, iron-associated genes, such as the transferring receptors TfR1 and TfR2, have been found to be upregulated compared with other brain tumors, which may be linked with high iron concentrations. Furthermore, increased TfR2 expression stimulates glioma cell growth.20 Poly(C)-binding protein-2 is an essential component of iron metabolism and possibly modulates ferroptosis. It is elevated in glioma tissues and its silencing inhibits the growth of glioma.21 Research has indicated that GPX4 knockdown or inhibition activates ferroptosis and mediates glioma cell death by lipid peroxidation.22 Studies have found that ferroptosis induces cell death as well as influences the tumor immune microenvironment (TIME).23,24 Thus, ferroptosis-linked tumor antigens are a potential option for mRNA vaccines. According to a recent study, six efficient ferroptosis-associated modulators were recognized for the purpose of developing mRNA vaccines against bladder cancer. Moreover, a lncRNA signature was also developed to assist in the evaluation of the immunotherapy response and the identification of suitable patients for vaccine administration.25 To our knowledge, there have been no ferroptosis-associated antigens identified for the development of mRNA vaccines aimed at treating glioma. Therefore, the primary objective of this study was to identify potential ferroptosis-associated antigens in LGG and discern patients who would benefit from mRNA vaccines based on their immune landscape.
Materials and Methods
LGG Dataset Source and Preprocessing
Clinical and gene expression data on 508 and 409 patients with LGG were downloaded from the Cancer Genome Atlas (TCGA) and Chinese Glioma Genome Atlas (CGGA) databases, respectively. Furthermore, the mRNA data of 1664 healthy brain tissue samples were obtained from the Genotype-Tissue Expression (GTEx) project. Simple nucleotide mutation data, such as somatic mutations based on the VarScan2 platform, were also obtained from TCGA. Additionally, information on 424 ferroptosis-related genes (FRGs), including both driver and suppressor genes, was extracted from FerrDB (www.zhounan.org/ferrdb/).26 Moreover, genes associated with immunogenic cell death (ICD) and ICP were obtained from the literature.27
Identification of Tumor Antigens
Gene Expression Profiling Interactive Analysis (GEPIA) and cBio Cancer Genology Portal (cBioPortal) Assessment
GEPIA28 (http://gepia2.cancer-pku.cn) was used for the identification of differentially expressed genes (DEGs) and their association with LGG prognosis. DEGs were identified using variance analysis with the criteria of |log2FC| >1 and Q <0.01. Progression-free survival (PFS) and overall survival (OS) were analyzed by the Kaplan-Meier method with a median cut-off and compared by a Log rank test. Each analysis had consistent parameters and was not adjusted for p-value. For incorporation of raw TCGA RNA-seq data, cBioPortal (http://www.cbioportal.org)29 was used to compare data on genetic differentiation, extract microsatellite instability (MSI), and tumor mutation burden (TMB).
Tumor Immune Estimation Resource (TIMER) Analysis
TIMER (https://cistrome.shinyapps.io/timer/) was used to determine the associations of tumor immune infiltrating cell abundance with LGG-linked genes30. Modules were acquired through analysis of somatic copy number alterations, gene expression, clinical regression, and somatic mutations. Data were refined by adjustments based on Spearman correlations.
Patients and Specimens
Patient specimens were collected at the Fourth Hospital of Hebei Medical University from January 2023 to June 2023. These specimens were promptly frozen and preserved in liquid nitrogen. A total of three non-tumor brain samples from individuals undergoing traumatic brain injury internal decompression, along with six samples from LGG cases (comprising three grade II and three grade III cases), were obtained for the SYBR Green I real time-polymerase chain reaction (RT-PCR) assay. The histological diagnosis of these specimens was confirmed by two neuropathologists. All specimens were collected and used with the informed consent of the patients and approved by the Ethics Committee of the Ethics Committee of the Fourth Hospital of Hebei Medical University (2020KY303).
Cell Lines and Cell Cultures
The LGG cell line SW1088 and human normal astrocytes cell line HA1800 were obtained from TONGPAI Biotechnology Co., Ltd (Shanghai, China). SW1088 cells were cultured in Leibovitz’s (L)- 15 medium supplemented with 10% fetal bovine serum (FBS, iCell Bioscience Inc, Shanghai, China). HA1800 cells were cultured in Dulbecco’s modified Eagle’s medium (DMEM, iCell Bioscience Inc, Shanghai, China) supplemented with 10% FBS.
RNA Extraction and RT-PCR
Total RNA from cells and tissues was extracted using Trizol reagent (Ambion) following the provided instructions. A 1 μL RNA sample was taken, and its quality and concentration were assessed using an ultraviolet spectrophotometer to evaluate RNA integrity. In HA1800 cell line, the OD260/OD280 absorbance ratio and OD260/OD230 absorbance ratio were 1.9 and 2.1, respectively. In SW1088 cell line, the OD260/OD280 and OD260/OD230 were both 2.0. The amplification curve and melt curve analysis did not reveal non-specific amplification or primer dimers, confirming the primer specificity. Complementary DNA for reverse transcription was synthesized using the HiFiScript gDNA Removal cDNA Synthesis Kit (Conway Century). All reactions were performed in triplicates. The expression levels of genes were calculated using the 2−ΔΔCt method, with β-actin serving as the internal reference. The primer sequence was shown in Table 1.
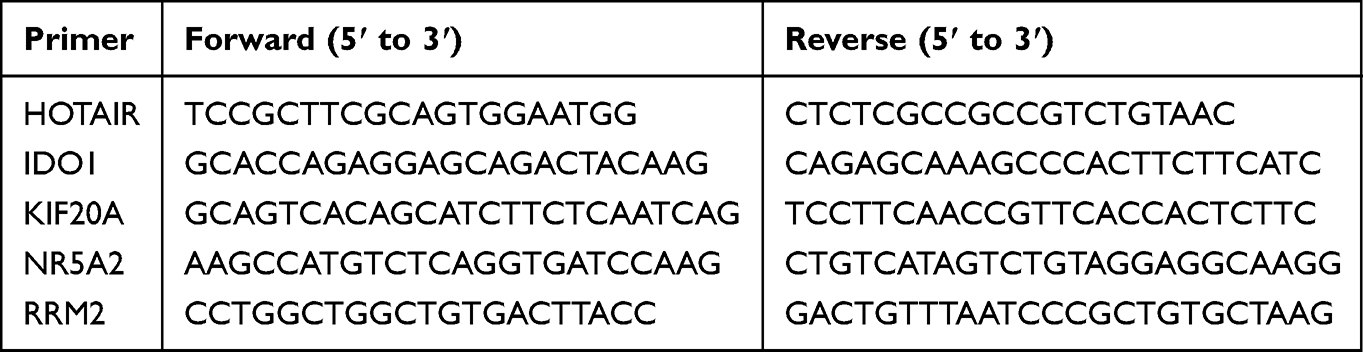 |
Table 1 Primers of HOTAIR, IDO1, KIF20A, NR5A2, and RRM2 |
Establishment of the Immune Landscape
Identification and Verification of the Ferroptosis-Subtypes (F-Subtypes)
“Consensus Cluster Plus” is an R package used for consensus clustering. It generates a consensus matrix through multiple random resampling and clustering iterations. The consensus matrix reflects the similarity of samples under different numbers of clusters, aiding in the identification of the most representative and stable number of clusters. Clustering of FRGs was performed based on their expression using “Consensus Cluster Plus”.31 To define appropriate gene modules and F-subtypes, a consensus matrix was established. A segmentation algorithm around Medoid by the “1-Pearson correlation” distance metric was applied with 1000 guided sessions, including 70% of patients in the training cohort. The clusters ranged from 2 to 9, and the best partition was elucidated via cumulative distribution function (CDF) assessment. Besides, F-subtypes were validated in standalone CGGA cohorts. Consistency of the F-subtype classification was determined by Pearson correlations.
Prognosis of F-Subtypes and Immune Infiltration Analysis
The prognoses of F-subtypes were assessed through Log rank tests. Their associations with different ferroptosis-associated molecular and cellular features were analyzed by ANOVA. The R package “X cell”32 was used to characterize 38 types of infiltrating immune cells. The X-cell score of each LGG sample was quantified and then compared with those of the different F-subtypes. The overall quantification of infiltrating immune cells in different F-subtypes was performed utilizing ESTIMATE algorithm.
Weight Gene Co-Expression Network Analysis (WGCNA)
The co-expression FRG modules were assessed using the R package “WGCNA”,33 followed by an investigation into the correlation between module genes and F-subtypes. Gene ontology (GO) and Kyoto Encyclopedia of Genes and Genomes (KEGG) pathway enrichment analyses were carried out with the Metascape database (www.metascape.org/).34
Creation of the Ferroptosis-Related Immune Landscape
“Monocle” is a software package designed for the analysis of single-cell RNA sequencing data. It models the dynamic changes in cell states as a developmental trajectory, relying on the topological structure inherent in single-cell data. Immune landscapes were established using graphical learning for dimensionality reduction analysis with a normally distributed “Monocle” package.35 The components’ maximum number was 2. Dimensional reduction was achieved using “DDR Tree”. The functional graph cell trajectories were utilized for analysis of the immune landscape. Different F-subtypes were represented by different colors.
Statistical Analysis
The data were sorted and analyzed using R 4.2.1. The Wilcoxon rank-sum test and Kruskal–Wallis test are both non-parametric statistical testing methods. Intergroup differences between 2 or ≥3 groups were compared by the Wilcoxon rank-sum and Kruskal–Wallis test, respectively. Associations between variables were analyzed by Pearson correlation coefficients. The significance level of 0.05 is commonly used to control the probability of Type I error. P<0.05 was considered statistically important.
Results
Identification of Candidate Ferroptosis-Associated Antigens
The analytical approach’s flowsheet was demonstrated in Figure 1. To assess possible LGG antigens, aberrantly expressed genes were first identified. Overall, 5756 DEGs were found, of which 3982 were upregulated, suggesting that they encoded tumor-associated proteins (Figure 2A). Furthermore, 10,548 genes were found to have mutations, identified by the assessment of altered gene fragments and mutation counts per sample (Figure 2B and C). According to the mutation analysis, EGFR and TTN were highly mutated genes based on mutated genomic fragments and mutation counts (Figure 2D and E). Additionally, EGFR, EGFR-AS1, ELDR, CDKN2A, CDKN2B-AS, as well as other genes also showed significant mutations in LGG, both in terms of mutation numbers and frequencies. These mutations are essential for the occurrence and progression of LGG. Finally, 167 highly expressed and frequently mutated genes were recognized as possible neoantigen. Then, focusing on the chances of FRGs being mRNA antigens, six FRGs were identified from 167 potential tumor antigens (Table S1). After OS and PFS analyses, the final five selected potential antigenic genes were HOTAIR, IDO1, KIF20A, NR5A2, and RRM2 (Figure 3A). As shown in Figure 3B–K, elevated expression of them was linked to poorer OS and PFS. TIMER online analysis indicated that these genes were closely related to antigen-presenting cells (APCs) (Figure 4A–E) implying that certain ferroptosis-linked tumor antigens may represent potential vaccine candidates.
 |
Figure 1 Flow chart of the analytical approach. |
 |
Figure 2 Screening for LGG tumor antigens. (A). Chromosomal locations of the overexpressed genes. (B and C). Samples overlapping in altered genome fraction (B) and mutation count groups (C). (D and E) Genes that possess the highest frequency within the altered genome fraction (D) and mutational arrays (E). *P<0.05. |
 |
Figure 3 Identification of tumor antigens associated with the prognosis of LGG. (A). Screening process for LGG tumor-associated genes. (B-K). Kaplan-Meier survival curve analysis for IDO1 (B and C), KIF20A (D and E), HOTAIR (F and G), RRM2 (H and I), and NR5A2 (J and K) in LGG patients. |
 |
Figure 4 Association of the five potential LGG antigens with APCs. (A-E). The link between the tumor purity, APCs (dendritic cells, macrophages, and B cells) infiltration, and the expression levels of HOTAIR (A), IDO1 (B), KIF20A (C), NR5A2 (D), and RRM2 (E). |
Verification of Antigenic Gene Expression Levels Using RT-PCR
The results showed that the mRNA expression levels of HOTAIR, IDO1, KIF20A, NR5A2 and RRM2 in LGG cells were significantly higher when compared to those in human astrocyte cells (Figure 5A). The mRNA expression levels of them in LGG patients were markedly elevated compared with patients suffering traumatic brain injuries (Figure 5B).
 |
Figure 5 mRNA expression levels of antigens between different groups. (A). Relative mRNA expression levels of HOTAIR, IDO1, KIF20A, NR5A2, and RRM2 between SW1088 and HA1800. (B). Relative mRNA expression levels of HOTAIR, IDO1, KIF20A, NR5A2, and RRM2 between LGG specimens and control. ** P < 0.01. |
Establishment of LGG F-Subtypes
The F-subtypes can reflect the ferroptosis status of the TIME, allowing the identification of individuals who may derive advantages from vaccines. Therefore, 424 FRGs from TCGA-LGG were investigated to establish consensus clusters. Based on their CDFs and functional incremental areas, k=4 was selected for stable FRG clustering, resulting in the identification of four F-subtypes (FS1, FS2, FS3, and FS4) (Figure 6A–D). Principal Component Analysis (PCA) revealed marked differences between the four F-subtypes (Figure 6E). Consistent with the TCGA-LGG cohort, CGGA-LGG was also classified into four subtypes (FS1, FS2, FS3, and FS4) (Figure 6F). Furthermore, the prognosis of TCGA cohort F-subtypes was assessed, indicating that FS2 tended to have favorable prognosis while FS1 showed the most unfavorable prognosis (Figure 6G). Meanwhile, the F-subtypes of the CGGA cohort showed greater prognostic differences (Figure 6H). The four subtypes in the different datasets showed similar distribution patterns, manifested by a larger proportion of G3 (WHO III) patients in the FS1 subtype (Figure 6I–J). These data suggest that F-subtypes can predict LGG prognosis.
 |
Figure 6 Establishment of LGG F-subtypes. (A and B). CDF plot (A) and delta area (B) of FRGs in the TCGA-LGG cohort. (C). Cluster-tracing heatmap of the TCGA-LGG samples. (D). Heatmap of sample clustering in the TCGA cohorts. (E). PCA of F-subtypes in the TCGA-LGG cohort. (F). Heatmap of sample clustering in the CGGA cohorts. (G and H). Kaplan-Meier curves indicating the OS of the F-subtypes in the TCGA (G) and CGGA (H) cohorts. (I and J). Distribution ratio of WHO grades across F-subtypes in the TCGA (I) and CGGA (J) cohorts. |
Relationship Between F-Subtypes and Mutational Status
Immune response is intricately correlated with both TMB and somatic mutation frequency. Therefore, mutation count, TMB, and MSI of per patient in TCGA-LGG dataset were calculated. Significant differences were found in both the mutation count and TMB between the four F-subtypes. FS1 had the highest mutation count and TMB score. However, the MSI status did not show noteworthy distinctions among the subtypes (Figure 7A–C). Furthermore, 30 genes, including IDH1, TP53, ATRX, CIC, and TTN, also had variable mutations in different subtypes. Specifically, although IDH1 showed the highest mutational frequency in all specimens, it was not observed in the FS1 subtype (Figure 7D).
 |
Figure 7 Relationship between F-subtypes and mutational status. (A-C). Comparison of mutation count (A), TMB (B), and MSI sensor score (C) among different F-subtypes. (D). Waterfall diagram showing highly mutated genes in different F-subtypes. |
Associations Between F-Subtypes and Immune Modulators
ICD modulators and ICPs are critically involved in anti-cancer immunity and might affect the effectiveness of mRNA vaccines. Thus, the ICP and ICD modulator levels in different F-subtype were evaluated. In the TCGA dataset, 25 ICD modulators were assessed and 21 (84%) were found to be differentially expressed across the F-subtypes. ANXA1, MET, IFNE, HGF, P2RY2, FPR1, TLR3, and CXCL10 were strongly expressed in FS1. In the CGGA cohort, 24 of 25 (96%) ICD modulators exhibited significant differential expression among the F-subtypes. In both cohorts, most of the ICD modulators, such as ANXA1, MET, EIF2A, HGF, P2RY2, FPR1, TLR3, and HMGB1, were highly expressed in FS1 and FS3 (Figure 8A and B). The ICP expression also varied across the F-subtypes. In the TCGA cohort, 40 of 46 (86.9%) ICPs showed distinct expression between the F-subtypes (Figure 8C), whereas in the CGGA cohort, 46 analyzed ICPs were all differentially expressed across the F-subtypes (Figure 8D). Most ICPs, such as CTLA4, CD27, CD28, NRP1, CD44, and BTLA, showed similar expression in both cohorts, with stronger expression in FS1 and FS3. Altogether, the data indicate that the F-subtypes are linked with most ICD modulators and ICPs. FS2 and FS4, with lower expression of ICD modulators and ICPs, may exhibit a stronger response to mRNA vaccines.
 |
Figure 8 Association of F-subtypes with ICD modulators and ICPs. (A and B). Differential levels of ICD modulators among F-subtypes in the TCGA-LGG (A) and CGGA-LGG (B) cohorts. (C and D). Differential levels of ICPs among F-subtypes in the TCGA-LGG (C) and CGGA-LGG (D) cohorts. * P < 0.05, ** P < 0.01, *** P < 0.001. |
Immune Characteristics of the F-Subtypes
The mRNA vaccine response relies on the tumor immune status. Therefore, by using “X cell” to score previously reported 38 signature genes, we further evaluated the immune cell component of the F-subtypes (Figure 9A and B). The analysis showed that the FS1 and FS3 subtypes had higher numbers of infiltrating immune cells than the FS2 and FS4 subtypes. Box plots indicated that the subtypes varied markedly in terms of immune cell numbers, which were generally more abundant in FS1 and FS3 and less abundant in FS2 and FS4, similar to the results of the previous ICP analysis (Figure 9C and D). Finally, the immune scores of each subtype were assessed, showing that the ESTIMATE score was elevated in FS1 and FS3 compared with the other two subtypes (Figure 9E and F). Therefore, FS2 and FS4 were classified as immunologically “cold” whereas FS1 and FS3 were immunologically “hot” phenotypes, suggesting that the F-subtype could reflect LGG immune status for identifying suitable patients for mRNA vaccination and patients in the FS2 and FS4 categories might benefit.
 |
Figure 9 Molecular and cellular features of F-subtypes. (A and B). Differential enrichment scores of 38 immune cell markers among F-subtypes in TCGA (A) and CGGA (B) cohorts. (C and D). Boxplot of immune cell fraction among F-subtypes in the TCGA (C) and CGGA (D) cohorts. (E and F). Differential ESTIMATE scores among the four F-subtypes in the TCGA (E) and CGGA (F) cohorts. * P < 0.05, ** P < 0.01, *** P < 0.001, ns P>0.05. |
Ferroptosis-Related Immune Landscape in LGG
The expression profiles of the FRGs were used for the construction of an immune landscape (Figure 10A and B). The horizontal axis (PCA1) was positively relevant to multiple immune cells, such as activated B and CD4 T cells, type 17 helper T cells, mast cells, and neutrophils (Figure 10C). However, the vertical axis (PCA2) was negatively linked with most infiltrating immune cells. The sample was then divided further into eight states using the trajectory position. States 1, 5, 7, 8, and 9 were extracted at the endpoints, and their respective proportions in various F-subtypes were illustrated in Figure 10D. According to the survival analysis, these states showed markedly differed OS, with state 8 showing the worst prognosis (Figure 10E). In summary, the ferroptosis-related immune landscape accurately identified the ferroptosis state of each LGG patient and predicted their prognosis. This could aid in the selection of patients who are probable candidates to benefit from mRNA vaccines.
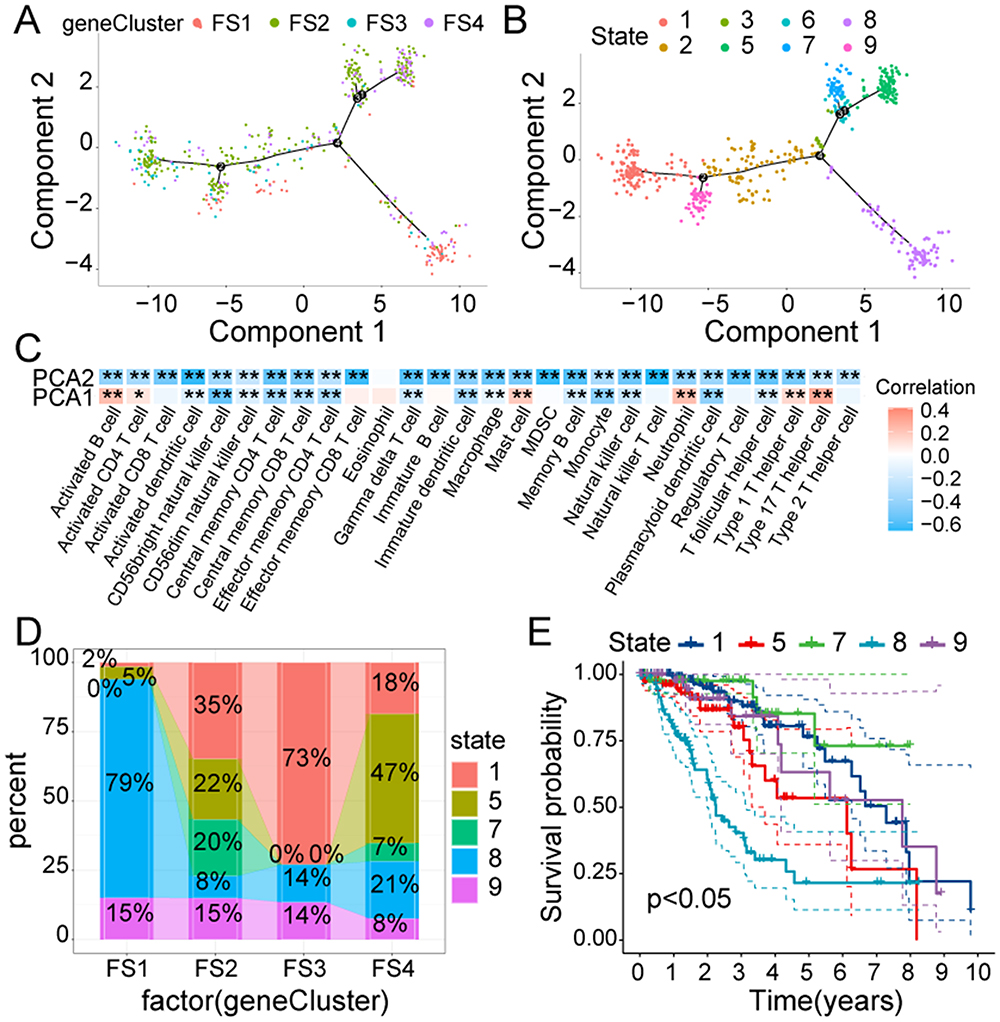 |
Figure 10 The ferroptosis-related immune landscape of LGG. (A). Every point represents a LGG patients; four F-subtypes are indicated by different colors. (B). Immune landscapes associated with the eight states are shown on branches. (C). A heatmap displaying the two principal components with 28 immune cells. (D). The proportion of different states in various F-subtypes. (E). Survival analysis of different states. * P < 0.05, ** P < 0.01. |
Validation of the FRGs Co-Expression Module and Hub Genes
Using the WGCNA, sample clustering was conducted with a soft threshold of four in a scale-free network (Figure 11A), and the β value-based proximity and topology matrix were assessed. Furthermore, a topology matrix was clustered based on gene dissimilarities. The gene dendrogram was constructed using mean linkage hierarchical clustering. The minimum module size set at 20. (Figure 11B). Finally, the genes were categorized into 12 modules (Figure 11C). Multivariate Cox regression analysis revealed that the green, green-yellow, magenta, purple, red, and yellow modules were specific for LGG prognosis (Figure 11D). The relationship between the F-subtypes and the characteristic genes of the modules was evaluated, revealing significant differences in the eigengenes of all 12 modules (Figure 11E). In the survival analysis, enhanced gene expression in the yellow module was markedly associated with worse prognosis (Figure 11F). Moreover, the results of GO and KEGG pathway enrichment analyses showed that yellow module genes were markedly enriched in immune-linked functions and pathways, including cytokine signaling in the immune system, and cytokine-cytokine receptor interactions (Figure S1). The hub genes, including GLP1R, SLPI, NR1I3, CDK4, PRKCQ, IL9 (Table S2) from the yellow module were identified, which might act as indices for identifying individuals for mRNA vaccine treatment.
 |
Figure 11 Characterization of the FRGs co-expression modules of LGG. (A). Scale-free fit index and mean connectivity for different soft-thresholding powers (β). (B). Dendrogram of all FRGs clustered based on the TOM matrix. (C). Relationship analysis between traits and modules. (D). Multivariate Cox regression analysis of principal modules. (E). Differential distribution of module eigengenes in LGG F-subtypes. (F). Prognosis analysis in yellow module with high and low mean. *P < 0.05, ** P < 0.01, *** P < 0.001. |
Discussion
Tumor vaccines have recently been reported to be an essential part of tumor immunotherapy against various solid cancers and have become a research hotspot.36 Furthermore, many studies have shown a significant association of ferroptosis with tumor immune reactions. For example, a recent study revealed that IFNγ release inhibits SLC7A11 expression, thereby stimulating ferroptosis in cancer cells.37 Gui recognized six ferroptosis-associated modulators in bladder cancer patients as potential antigens for mRNA vaccine development.25 Therefore, FRG-based mRNA vaccines are a promising treatment strategy.
This appears to be the first investigation identifying FRG-based LGG antigens for developing mRNA vaccines. A LGG landscape based on abnormal gene expression and mutation was established and multiple candidate antigens were identified, of which HOTAIR, IDO1, KIF20A, NR5A2, and RRM2 appeared to be promising mRNA vaccine candidates. Upregulated levels of them were closely related to worse OS and PFS, increased APCs, and infiltration of B cells. Thus, these antigens play crucial roles in the progression of LGG as well as may be presented to CD8+ T cells to trigger an immune response. SW1088 and HA1800 are the most commonly used cell lines for LGG and normal astrocyte cell lines, respectively.38 RT-PCR showed that the mRNA expression levels of HOTAIR, IDO1, KIF20A, NR5A2 and RRM2 in SW1088 cells were significantly higher when compared to those in HA1800 cells. This disparity in gene expression is likewise evident in clinical specimens. The roles of these genes in glioma have also been confirmed by other studies. For instance, Guo observed that downregulated HOTAIR expression inhibited growth and invasion in glioma cells.39 Du suggested that IDO1/TDO-Kyn-AhR-AQP4 is a novel signaling pathway underlying malignant transformation of glioma and that IDO1 serves as an efficient glioma therapeutic target.40 Tang showed that overexpressed KIF20A reversed miR-876-3p-induced suppression of glioma cell proliferation.41 Li found that inhibiting NR5A2 increased glioma’ chemosensitivity to cisplatin.42 Jiang found that pectolinarigenin promoted autophagic flux through RRM2 suppression, consequently inhibiting the invasion of glioma cells.43 However, whether tumor antigens can elicit an immune response also depends on the TIME. Due to the high heterogeneity of glioma, only a subset of LGG patients may benefit from mRNA vaccines. In this study, LGG was categorized into four F-subtypes to clarify the eligible population for vaccination. Each F-subtype had distinct molecular and cellular features. Patients from the four subtypes have markedly distinct prognoses, indicating that the F-subtypes could predict outcomes in LGG patients. Furthermore, the F-subtypes were also associated with clinical characteristics, including IDH mutation and tumor grade. IDH1 genetic mutations have been recently identified as critical molecular indices and are significantly associated with glioma progression. Individuals with IDH1 mutations had better outcomes than those without.44 Consistent with this, we observed that the FS1 patients, who experienced the worst prognosis, did not exhibit any IDH1 mutations.
Next, the assessment of the relationship between F-subtypes and TIME was performed. In comparison to the other subtypes, FS1 showed a significant increase in TMB, ICD modulators, and the quantity of mutated genes. FS1 and FS3 exhibited marked elevations in ICP levels, indicating that the use of mRNA vaccines alone may not be suitable for them. However, a combination of mRNA vaccines and ICP inhibitors might offer potential benefits. Additionally, “X cell” was employed to characterize the immune cell components. With the highest scoring cells including activated CD8 T, CD4 T, and B cells, FS1 and FS3 were designated as “hot” whereas FS2 and FS4 with lower immune cell scores were classified as “cold”. Since mRNA vaccines can trigger immune responses in patients with cancer, it might benefit “cold”-type individuals more. In summary, the F-subtypes could predict survival outcomes and assist in the identification of suitable candidates for mRNA vaccines. Specifically, the “cold”-type FS2 and FS4 are considered appropriate candidates.
Using the ferroptosis-linked immune landscape, the ferroptosis status in LGG patients was assessed, showing that patients in the same F-subtype clustered together, whereas those in different subtypes were more widely distributed, indicating the reliability of the F-subtype classification. Nevertheless, the same subtype still showed minor heterogeneity. Therefore, the subtypes were further classified into eight states. Of these, states 1, 5, 7, 8, and 9 were at the endpoints. The survival analysis showed that state 8, which occupies the largest proportion of the FS1 subtype, had worse prognosis compared with the other states, indicating that this further categorization was reasonable. State 5 showed greater immune infiltration than state 1, suggesting that the former was immune-“hot” while the latter was immune-“cold”. Therefore, state 1 might have a better mRNA vaccine response. In terms of the survival analysis, state 1 was associated with better prognosis than state 5, suggesting that individuals with increased immune cell infiltration had shorter OS, consistent with the above results. This could be attributed to the influence of the TIME on survival, with immunosuppressive conditions potentially leading to reduced survival.45 Altogether, the use of the immune landscape demonstrated the reliability of the F-subtype classification, allowing more precise patient grouping. Due to F-subtype and immune landscape may not be stable among different patients, an effective auxiliary method was carried out to predict the vaccine response. Twelve co-expression modules of FRGs were constructed using WGCNA. The results indicated that the yellow module was closely related to survival and was markedly enriched in immune-related functions and mechanisms. Therefore, hub genes including GLP1R, SLPI, NR1I3, CDK4, PRKCQ, and IL9 were chosen from the yellow module with MM > 0.90 and might act as potent indices for assessing the mRNA vaccine response.
This study has several limitations that warrant consideration. Firstly, the effectiveness of mRNA vaccines in treating LGG needs to be confirmed through large-scale clinical trials. Additionally, the limited sample size has prevented further stratification of patients, such as by factors like age, gender, more detailed pathological classification, etc. This limitation may contribute to the observed heterogeneity within the same subtype. In the experimental validation of clinical samples, although the sample size meets statistical requirements, there may still be potential selection bias. Furthermore, the potential confounding factors should be considered. The hub genes as indices for assessing vaccine response need further validation.
Conclusion
In conclusion, HOTAIR, IDO1, KIF20A, NR5A2, and RRM2 were found to be potential LGG mRNA vaccine antigens, which could benefit patients in the FS2 and FS4 subtypes. This investigation provides evidence for the application of mRNA vaccines for the treatment of LGG and identified patient types suitable for cancer vaccination.
Abbreviations
FBS, fetal bovine serum; OS, Overall survival; ICP, immune checkpoint; CAR-T, chimeric antigen receptor T cell therapy; PCA, Principal Component Analysis; CGGA, Chinese Glioma Genome Atlas; GO, Gene ontology; FRGs, ferroptosis-related genes; ICD, immunogenic cell death; GEPIA, Gene Expression Profiling Interactive Analysis; PFS, Progression-free survival; TIME, tumor immune microenvironment; TMB, Tumor mutation burden; TIMER, Tumor Immune Estimation Resource; F-subtypes, Ferroptosis-subtypes; CDF, Cumulative distribution function; LGG, Lower grade glioma; WGCNA, Weight gene co-expression network analysis; APCs, antigen-presenting cells; TCGA, The Cancer Genome Atlas; MSI, Microsatellite instability; RT-PCR, real time-polymerase chain reaction; cBioPortal, cBio Cancer Genology Portal; DEGs, differentially expressed genes; DMEM, Dulbecco’s modified Eagle’s medium; KEGG, Kyoto Encyclopedia of Genes and Genomes.
Data Sharing Statement
The datasets generated and analyzed during the current study are available from the corresponding author upon reasonable request.
Ethics Approval and Consent to Participate
This study was performed in line with the principles of the Declaration of Helsinki. Approval was granted by the Ethics Committee of The Fourth Hospital of Hebei Medical University (2020KY303).
Consent for Publication
All authors have given consent for publication.
Acknowledgments
The authors gratefully acknowledge contributions from the CGGA and TCGA databases.
Author Contributions
All authors made a significant contribution to the work reported, whether in study conception, design, and execution; data acquisition, analysis, and interpretation; or all these areas. All authors were involved in drafting, revising, or critically reviewing the article; gave final approval for the version to be published; have agreed on the journal to which the article has been submitted; and agree to be accountable for all aspects of the work.
Funding
This work was supported by the Hebei Provincial Health Commission Key Scientific Research Plan (20240302 and 20210974).
Disclosure
The authors declare that they have no competing interests in this work.
References
1. Liu D, Gao SX, Liao HF, Xu JM, Wen M. A Comparative Study of 2 Different Segmentation Methods of ADC Histogram for Differentiation Genetic Subtypes in Lower-Grade Diffuse Gliomas. Biomed Res Int. 2020;2020:9549361. doi:10.1155/2020/9549361
2. Yaqub M, Jinchao F, Zia MS, et al. State-of-The-Art CNN Optimizer for Brain Tumor Segmentation in Magnetic Resonance Images. Brain Sci. 2020;10(7):427. doi:10.3390/brainsci10070427
3. Gao P, Wang H, Li H, et al. miR-21-5p Inhibits the Proliferation, Migration, and Invasion of Glioma by Targeting S100A10. J Cancer. 2023;14(10):1781–1793. doi:10.7150/jca.84030
4. Han X, Xue X, Zhou H, Zhang G. A molecular view of the radioresistance of gliomas. Oncotarget. 2017;8(59):100931–100941. doi:10.18632/oncotarget.21753
5. Wang H, Yin M, Ye L, et al. S100A11 Promotes Glioma Cell Proliferation and Predicts Grade-Correlated Unfavorable Prognosis. Technol Cancer Res Treat. 2021;20:15330338211011961. doi:10.1177/15330338211011961
6. Wang H, Mao X, Ye L, Cheng H, Dai X. The Role of the S100 Protein Family in Glioma. J Cancer. 2022;13(10):3022–3030. doi:10.7150/jca.73365
7. Xu S, Tang L, Li X, Fan F, Liu Z. Immunotherapy for glioma: current management and future application. Cancer Lett. 2020;476:1–12. doi:10.1016/j.canlet.2020.02.002
8. Lim M, Xia Y, Bettegowda C, Weller M. Current state of immunotherapy for glioblastoma. Nat Rev Clin Oncol. 2018;15(7):422–442. doi:10.1038/s41571-018-0003-5
9. Igarashi Y, Sasada T. Cancer Vaccines: toward the Next Breakthrough in Cancer Immunotherapy. J Immunol Res. 2020;2020:5825401. doi:10.1155/2020/5825401
10. Crane CA, Han SJ, Ahn B, et al. Individual patient-specific immunity against high-grade glioma after vaccination with autologous tumor derived peptides bound to the 96 KD chaperone protein. Clin Cancer Res. 2013;19(1):205–214. doi:10.1158/1078-0432.CCR-11-3358
11. Platten M, Bunse L, Wick A, et al. A vaccine targeting mutant IDH1 in newly diagnosed glioma. Nature. 2021;592(7854):463–468. doi:10.1038/s41586-021-03363-z
12. Bezu L, Kepp O, Cerrato G, et al. Trial watch: peptide-based vaccines in anticancer therapy. Oncoimmunology. 2018;7(12):e1511506. doi:10.1080/2162402X.2018.1511506
13. Knutson KL, Disis ML. Tumor antigen-specific T helper cells in cancer immunity and immunotherapy. Cancer Immunol Immunother. 2005;54(8):721–728. doi:10.1007/s00262-004-0653-2
14. Faghfuri E, Pourfarzi F, Faghfouri AH, Abdoli Shadbad M, Hajiasgharzadeh K, Baradaran B. Recent developments of RNA-based vaccines in cancer immunotherapy. Expert Opin Biol Ther. 2021;21(2):201–218. doi:10.1080/14712598.2020.1815704
15. Ulmer JB, Mason PW, Geall A, Mandl CW. RNA-based vaccines. Vaccine. 2012;30(30):4414–4418. doi:10.1016/j.vaccine.2012.04.060
16. Grunwitz C, Kranz LM. mRNA Cancer Vaccines-Messages that Prevail. Curr Top Microbiol Immunol. 2017;405:145–164. doi:10.1007/82_2017_509
17. Cafri G, Gartner JJ, Zaks T, et al. mRNA vaccine-induced neoantigen-specific T cell immunity in patients with gastrointestinal cancer. J Clin Invest. 2020;130(11):5976–5988. doi:10.1172/JCI134915
18. Rausch S, Schwentner C, Stenzl A, Bedke J. mRNA vaccine CV9103 and CV9104 for the treatment of prostate cancer. Hum Vaccin Immunother. 2014;10(11):3146–3152. doi:10.4161/hv.29553
19. Tang D, Chen X, Kang R, Kroemer G. Ferroptosis: molecular mechanisms and health implications. Cell Res. 2021;31(2):107–125. doi:10.1038/s41422-020-00441-1
20. Recht L, Torres CO, Smith TW, Raso V, Griffin TW. Transferrin receptor in normal and neoplastic brain tissue: implications for brain-tumor immunotherapy. J Neurosurg. 1990;72(6):941–945. doi:10.3171/jns.1990.72.6.0941
21. Han W, Xin Z, Zhao Z, et al. RNA-binding protein PCBP2 modulates glioma growth by regulating FHL3. J Clin Invest. 2013;123(5):2103–2118. doi:10.1172/JCI61820
22. Forcina GC, Dixon SJ. GPX4 at the Crossroads of Lipid Homeostasis and Ferroptosis. Proteomics. 2019;19(18):e1800311. doi:10.1002/pmic.201800311
23. Liu T, Zhu C, Chen X, et al. Ferroptosis, as the most enriched programmed cell death process in glioma, induces immunosuppression and immunotherapy resistance. Neuro Oncol. 2022;24(7):1113–1125. doi:10.1093/neuonc/noac033
24. Stockwell BR, Jiang X. A Physiological Function for Ferroptosis in Tumor Suppression by the Immune System. Cell Metab. 2019;30(1):14–15. doi:10.1016/j.cmet.2019.06.012
25. Gui CP, Li JY, Fu LM, et al. Identification of mRNA vaccines and conserved ferroptosis related immune landscape for individual precision treatment in bladder cancer. J Big Data. 2022;9(1):88. doi:10.1186/s40537-022-00641-z
26. Zhou N, Bao J. FerrDb: a manually curated resource for regulators and markers of ferroptosis and ferroptosis-disease associations. Database. 2020;2020. doi:10.1093/database/baaa021
27. Huang X, Tang T, Zhang G, Liang T. Identification of tumor antigens and immune subtypes of cholangiocarcinoma for mRNA vaccine development. Mol Cancer. 2021;20(1):50. doi:10.1186/s12943-021-01342-6
28. Tang Z, Li C, Kang B, Gao G, Li C, Zhang Z. GEPIA: a web server for cancer and normal gene expression profiling and interactive analyses. Nucleic Acids Res. 2017;45(W1):W98–W102. doi:10.1093/nar/gkx247
29. Gao J, Aksoy BA, Dogrusoz U, et al. Integrative analysis of complex cancer genomics and clinical profiles using the cBioPortal. Sci Signal. 2013;6(269):l1. doi:10.1126/scisignal.2004088
30. Tran TO, Vo TH, Lam L, Le N. ALDH2 as a potential stem cell-related biomarker in lung adenocarcinoma: comprehensive multi-omics analysis. Comput Struct Biotechnol J. 2023;21:1921–1929. doi:10.1016/j.csbj.2023.02.045
31. Wilkerson MD, Hayes DN. ConsensusClusterPlus: a class discovery tool with confidence assessments and item tracking. Bioinformatics. 2010;26(12):1572–1573. doi:10.1093/bioinformatics/btq170
32. Aran D, Hu Z, Butte AJ. xCell: digitally portraying the tissue cellular heterogeneity landscape. Genome Biol. 2017;18(1):220. doi:10.1186/s13059-017-1349-1
33. Wang T, Dai L, Shen S, et al. Comprehensive Molecular Analyses of a Macrophage-Related Gene Signature With Regard to Prognosis, Immune Features, and Biomarkers for Immunotherapy in Hepatocellular Carcinoma Based on WGCNA and the LASSO Algorithm. Front Immunol. 2022;13:843408. doi:10.3389/fimmu.2022.843408
34. Dang HH, Ta H, Nguyen T, et al. Prospective role and immunotherapeutic targets of sideroflexin protein family in lung adenocarcinoma: evidence from bioinformatics validation. Funct Integr Genomics. 2022;22(5):1057–1072. doi:10.1007/s10142-022-00883-3
35. Wang D, Burns R, Khalil M, Mei A, Hashemi E, Malarkannan S. Methods to Analyze the Developmental Trajectory of Human Primary NK Cells Using Monocle and SCENIC Analyses. Methods Mol Biol. 2022;2463:81–102.
36. Zhang X, Zhang Y, Zhao L, et al. Exploitation of tumor antigens and construction of immune subtype classifier for mRNA vaccine development in bladder cancer. Front Immunol. 2022;13:1014638. doi:10.3389/fimmu.2022.1014638
37. Wang W, Green M, Choi JE, et al. CD8(+) T cells regulate tumour ferroptosis during cancer immunotherapy. Nature. 2019;569(7755):270–274. doi:10.1038/s41586-019-1170-y
38. Majercikova Z, Dibdiakova K, Gala M, et al. Different Approaches for the Profiling of Cancer Pathway-Related Genes in Glioblastoma Cells. Int J Mol Sci. 2022;23(18):10883. doi:10.3390/ijms231810883
39. Guo S, King P, Liang E, Guo AA, Liu M. LncRNA HOTAIR sponges miR-301a-3p to promote glioblastoma proliferation and invasion through upregulating FOSL1. Cell Signal. 2022;94:110306. doi:10.1016/j.cellsig.2022.110306
40. Du L, Xing Z, Tao B, et al. Both IDO1 and TDO contribute to the malignancy of gliomas via the Kyn-AhR-AQP4 signaling pathway. Signal Transduct Target Ther. 2020;5(1):10. doi:10.1038/s41392-019-0103-4
41. Tang J, Xu J, Zhi Z, et al. MiR-876-3p targets KIF20A to block JAK2/STAT3 pathway in glioma. Am J Transl Res. 2019;11(8):4957–4966.
42. Li J, Gu J, Wang J, et al. MicroRNA-433-3p enhances chemosensitivity of glioma to cisplatin by downregulating NR5A2. Brain Behav. 2022;12(12):e2632. doi:10.1002/brb3.2632
43. Jiang H, Zhang D, Aleksandrovich KD, et al. RRM2 Mediates the Anti-Tumor Effect of the Natural Product Pectolinarigenin on Glioblastoma Through Promoting CDK1 Protein Degradation by Increasing Autophagic Flux. Front Oncol. 2022;12:887294. doi:10.3389/fonc.2022.887294
44. Priambada D, Thohar Arifin M, Saputro A, et al. Immunohistochemical Expression of IDH1, ATRX, Ki67, GFAP, and Prognosis in Indonesian Glioma Patients. Int J Gen Med. 2023;16:393–403. doi:10.2147/IJGM.S397550
45. Chen Z, Wang X, Yan Z, Zhang M. Identification of tumor antigens and immune subtypes of glioma for mRNA vaccine development. Cancer Med. 2022;11(13):2711–2726. doi:10.1002/cam4.4633
 © 2024 The Author(s). This work is published and licensed by Dove Medical Press Limited. The
full terms of this license are available at https://www.dovepress.com/terms
and incorporate the Creative Commons Attribution
- Non Commercial (unported, 3.0) License.
By accessing the work you hereby accept the Terms. Non-commercial uses of the work are permitted
without any further permission from Dove Medical Press Limited, provided the work is properly
attributed. For permission for commercial use of this work, please see paragraphs 4.2 and 5 of our Terms.
© 2024 The Author(s). This work is published and licensed by Dove Medical Press Limited. The
full terms of this license are available at https://www.dovepress.com/terms
and incorporate the Creative Commons Attribution
- Non Commercial (unported, 3.0) License.
By accessing the work you hereby accept the Terms. Non-commercial uses of the work are permitted
without any further permission from Dove Medical Press Limited, provided the work is properly
attributed. For permission for commercial use of this work, please see paragraphs 4.2 and 5 of our Terms.
Recommended articles
Identification of a Novel Ferroptosis-Related Gene Signature for Predicting Prognosis and Responsiveness to Immunotherapy in Hepatocellular Carcinoma
Wang Q, Wang B, Ma X, Zhuang H, Xie Z, Tang C, Tan W, Yang L, Shang C, Chen Y
Journal of Hepatocellular Carcinoma 2023, 10:1-16
Published Date: 10 January 2023
Identification and Validation of Ferroptosis-Related Subtypes and a Predictive Signature in Hepatocellular Carcinoma
Zheng C, Peng Y, Wang H, Wang Y, Liu L, Zhao Q
Pharmacogenomics and Personalized Medicine 2023, 16:39-58
Published Date: 26 January 2023
Comprehensive Analysis of Angiogenesis and Ferroptosis Genes for Predicting the Survival Outcome and Immunotherapy Response of Hepatocellular Carcinoma
Wang P, Kong G
Journal of Hepatocellular Carcinoma 2024, 11:1845-1859
Published Date: 29 September 2024
Exploring the Therapeutic Potential of Ferroptosis in Gastric Cancer
Chen R, Ju Q, Feng L, Zhang L
Cancer Management and Research 2025, 17:3211-3225
Published Date: 19 December 2025