Back to Journals » Stem Cells and Cloning: Advances and Applications » Volume 14
Identification of Liver Cancer Stem Cell Stemness Markers Using a Comparative Analysis of Public Data Sets
Authors Borziak K ![]() , Finkelstein J
, Finkelstein J ![]()
Received 8 March 2021
Accepted for publication 28 May 2021
Published 16 June 2021 Volume 2021:14 Pages 9—17
DOI https://doi.org/10.2147/SCCAA.S307043
Checked for plagiarism Yes
Review by Single anonymous peer review
Peer reviewer comments 2
Editor who approved publication: Dr Bernard Binetruy
Kirill Borziak, Joseph Finkelstein
Center for Biomedical and Population Health Informatics, Icahn School of Medicine at Mount Sinai, New York, NY, 10029, USA
Correspondence: Kirill Borziak
Center for Biomedical and Population Health Informatics, Icahn School of Medicine at Mount Sinai, One Gustave L. Levy Place, New York, NY, 10029, USA
, Tel +1 212 659 9567
Fax +1 212 423 2998
Email [email protected]
Purpose: Comparative reanalysis of single-cell transcriptomics data to gain useful novel insights into cancer stem cells (CSCs), which are a rare subset of cells within tumors, characterized by their capability to self-renew and differentiate, and their role in tumorigenicity.
Patients and Methods: This project utilized publically available liver single-cell RNA-seq datasets of liver cancer and liver progenitor cell types to demonstrate how shared large amounts of data can generate new and valuable information. The data were analyzed using EdgeR differential expression analysis, with focus on a set of 34 known stemness markers.
Results: We showed that the expression of stemness markers SOX9, KRT19, KRT7, and CD24, and Yamanaka factors Oct4 and SOX2 in CSCs was significantly elevated relative to progenitor cell types, potentially explaining their increased differentiation and replication potential.
Conclusion: These results help to further document the complementary expression changes that give CSCs their distinct phenotypic profile. Our findings have potential significance to advance our knowledge of the important genes relevant to CSCs.
Keywords: Yamanaka factors, single cell sequencing, CSCs, RNA-seq; cancer
Introduction
National Institutes of Health and other agencies are funding high-throughput genomics and transcriptomics (‘omics) experiments that deposit digital samples of data into the public domain at a rapidly increasing scale.1,2 The importance of these digital samples of data is further illustrated by the growing number of linked peer-reviewed publications that demonstrate its scientific value.3,4 Investigations of cancer stem cells (CSC) is a promising research avenue, which leads to the generation of large volumes of unique data. There is growing evidence implicating CSCs in causing therapeutic resistance, tumor recurrence, and metastasis. It is known that these cells possess stem-like properties/functions and represent a critical subset within the tumor mass that is responsible for perpetuating the tumor, even in post-therapy patients. CSCs share similar properties with normal stem cells, including the ability to self-renew and differentiate that gives rise to heterogeneous cancer cells, making up the bulk of the tumor.5
Recently, much work has been done on identifying the specific cell markers and gene expression profiles that can be used to identify and distinguish CSCs, but it is still not entirely understood how CSCs compare to naturally occurring progenitor cells.5 It has been previously shown that there are multiple transcription factors that are currently known to be expressed in normal stem cells. Many of these factors have been found in multiple human cancers.6 Further, stemness factors are an important medical target for cancer therapy.7 We expanded on this question of the importance of stemness factors for CSCs, by undertaking a reanalysis of publically available single-cell RNA-seq datasets, which characterize primary liver cancer samples8 and fetal and adult healthy liver samples.9 The importance of the study is based on the fact that liver cancer is the sixth deadliest cancer in the world.10 Using this cost-effective publically available data source, we compared expression levels of differentiation stemness markers and factors across different cell types present in these liver samples to identify similarities between liver CSCs, liver pluripotent stem cells (hepatobiliary hybrid progenitors), and hepatic progenitor cells. The liver cancer dataset samples contain both hepatocellular carcinoma (HCC) and intrahepatic cholangiocarcinoma (ICC). CSCs have been shown to be important factors in the development of both cancers.11 Further, since the liver contains bi-potential progenitor cells, which can potentially develop into both HCC and ICC,12 it is of great interest to understand the similarities and differences in expression between these fetal progenitors and the CSCs.
We focused on the expression of 34 known stemness transcription factors and cell markers,13,14 to better understand the CSC classification of malignant cells and further delineate key liver CSC factors. Next, we compared the broader expression of genes to identify potential novel stemness factors. Here we showed that liver CSCs show higher expression levels of specific differentiation markers (SOX9, KRT19, KRT7, and CD24) and Yamanaka factors15 (SOX2 and Oct4) relative to expression levels in fetal and adult progenitors cell types, suggesting that they potentially explain the differentiation potential of CSCs. We further identified CXCL10 as a potential marker of CSCs. Expanding our knowledge of CSCs’ properties, using publically available data repositories, could lead to new therapeutic pathways for CSC-targeted cancer therapies.
Materials and Methods
Expression data from the liver cancer8 and fetal and adult healthy liver9 studies were retrieved from the NCBI Gene Expression Omnibus (GEO)16 repository. GEO is a public functional genomics data repository that employs MIAME (Minimum Information About a Microarray Experiment) and MINSEQE (Minimum Information About a Next-generation Sequencing Experiment) data standards. This ensures that the stored data are properly formatted to promote data sharing and re-analysis for further knowledge discovery. The data stored in GEO include both raw data in FASTQ format and final processed (normalized) data in the form of gene expression data count matrices, which allows for reanalysis from multiple starting points ensuring both fidelity to the previous results and the speed of data analysis. For our reanalysis study, we started from gene expression data count matrices for the two studies. This decision was based on the unavailability of the raw data from the liver cancer study which is under restriction from the database of Genotypes and Phenotypes (dbGaP).17 However, given the similarity of sequencing, assembly, and gene calling approaches across the studies, we did not expect any systematic issues in the gene expression profiles to come from using the gene expression data count matrices that could not be accounted for by stringent normalization, which would make our results qualitatively different from a reanalysis starting from raw data.
The liver cancer study consists of 9946 single-cell RNA-seq profiles from 19 patients, totaling over 56 million reads and 4.2 billion base pairs (GSE125449).8 The fetal and adult liver study consists of 1467 single-cell RNA-seq profiles, totaling 283 million reads and 21 billion base pairs (GSE130473).9 To account for the effects of low coverage samples, low coverage genes, and differences in reads per single-cell sample, we performed stringent filtering steps and normalization to account for sample-specific effects. To filter out low coverage samples, samples with fewer than 1000 total reads were excluded from further analysis. This resulted in 9505 liver cancer samples and 1260 healthy liver samples submitted for differential expression analysis.
Additionally, genes with 0 reads in all samples were excluded, resulting in a final set of 42,684 genes included in the analysis. In addition to protein coding genes, the gene set includes pseudogenes and lncRNAs.
The normalization and differential expression analysis was performed using the edgeR18 R package, using the standard methodology. First, the library sizes where normalized by finding scaling factors for the library sizes that minimize the log-fold changes between the samples. This was done using a trimmed mean of M-values (TMM) between each pair of samples,19 to calculate the effective library size scaling factor. Next, the Cox-Reid profile-adjusted likelihood (CR) method was used to estimate dispersions by fitting generalized linear models (GLM) with a design matrix.20 We calculated the common dispersion for all genes, trended dispersion depending on gene abundance, and individual gene dispersion. After fitting the negative binomial GLM for each gene, differential expression was assessed using the quasi-likelihood F-test,21 which takes into account the uncertainty in estimating the dispersion for each gene and as a result provides a more robust and reliable error rate control. To account for differences in mRNA detection between the two datasets, we implemented a batch effect correction into the analysis for differential expression. Study type was included as in the design matrix as an additional variable. False discovery rate was further controlled using Bonferroni multiple testing correction.
Gene Ontology analysis was performed using DAVID 6.822 Functional Annotation Tool. The Benjamini multiple testing correction was employed on the p-values from the GO analysis results. The enrichment analysis was performed on the three sub-ontologies: Biological Process, Molecular Function, and Cellular Component. The full Homo sapiens gene set was used as the background gene set.
Clustering of all 10,865 single-cell samples was performed using a t-distributed stochastic neighbor embedding (t-SNE) analysis. Filtered gene count data were normalized using the EdgeR approach and log2 transformed to counts per million (CPM), to account for differences in read count between samples without altering the gene composition of the samples, allowing for a more accurate comparison across samples. The t-SNE analysis was performed using the Scikit-learn Python package.23 The data were visualized in two dimension of the embedded space. A perplexity value, related to the number of nearest neighbors, was set to 30 to account for the large dataset size. We employed 300 optimization iteration to refine the clustering analysis. The early exaggeration factor, which controls how tight natural clusters are in the embedded space, was kept at the default 12.0. Similarly the learning rate was kept at the default value of 200.0. The resultant embedded space was plotted using the matplotlib24 and seaborn25 python packages as a scatter plot using a paired color palette.
Box plot and violin plots were generated using ggplots2,26 with the log2 CPM values.
Results
Using previously published single-cell RNA-seq data for liver cancer8 and fetal and adult healthy liver,9 we reanalyzed 10,865 samples across 42,684 genes. This combined dataset represents a sequencing library of over 25.2 billion base pairs. Given that the data from the two experiments were sequenced and assembled using slightly different platforms and programs, we performed stringent filtering and normalization steps to ensure that the gene expression profiles were directly comparable across the studies. This step included filtering out cells with fewer than 1000 reads, genes with zero reads in all samples. Next, we performed library size normalization factors and calculated the common dispersion for all genes, trended dispersion depending on gene abundance, and individual gene dispersion, using the edgeR18 R package. Since the cDNA library preparation was performed using two different approaches, 10x Genomics Single Cell 3ʹ for Ma et al8 versus SmartSeq2 for Segal et al,9 we first confirmed the validity of our normalization approach on a set of housekeeping genes.27 Our analysis of the expression of a set of genes useful as references in gene expression studies, showed no significant differences in expression between the liver cancer8 and the fetal and adult healthy liver9 datasets (Figure 1). Of the 7 housekeeping genes examined to validate the normalization of expression (MB, FAM96B, NDUFB4, NOP10, SNRPD2, RPSA, RPLP0), SNRPD2 showed the biggest fold difference with 0.20 fold higher expression in the Ma et al dataset. These results confirmed the validity of our normalization approaches, by highlighting the similarity in expression levels across the studies, given the potential for expression differences induced by differences in library preparation methodology.
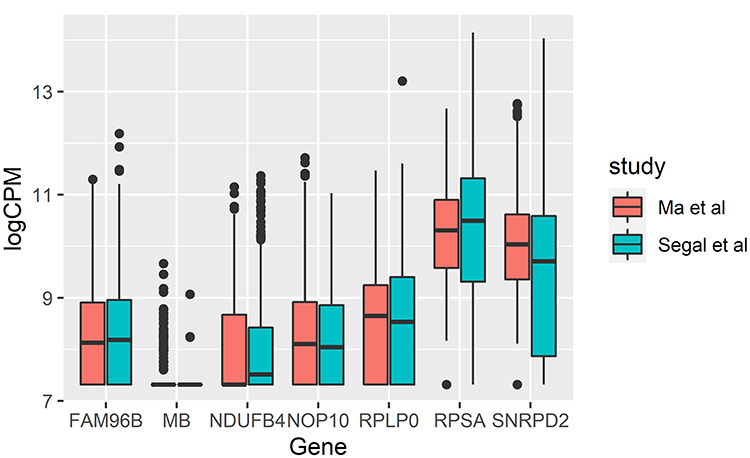 |
Figure 1 Expression comparison of housekeeping genes MB, FAM96B, NDUFB4, NOP10, SNRPD2, RPSA, RPLP0 between Ma et al8 and Segal et al.9 |
To further increase the confidence in our normalization results, we performed a tSNE analysis of the raw count data from both studies in comparison to normalized, log 2 transformed CPM values. The raw count tSNE figure demonstrated that there was a distinct separation between the samples from Ma et al and those from Segal et al, which is potentially due to the differences in cDNA library preparation (Figure 2). Following our normalization approach however, the t-SNE graph showed much more intermixing of the Ma et al and Segal et al samples (Figure 3). This is indicative of the samples’ clustering based on their gene expression profiles, and by extension their cell type profiles. Given the intermixing of the samples, we were confident that differential expression analysis would reflect real differences between the cell types.
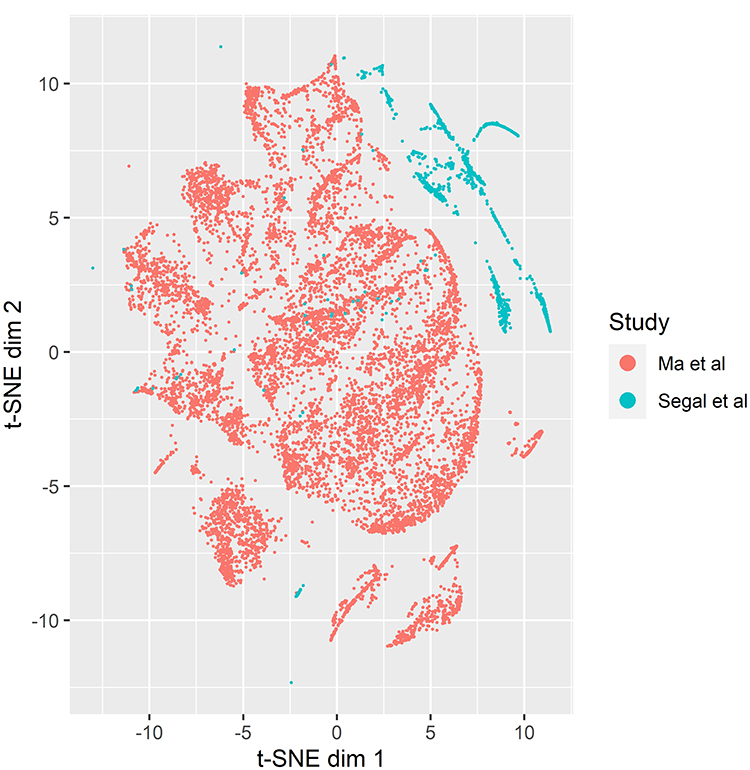 |
Figure 2 t-SNE analysis of the raw counts from the liver cancer and fetal/adult liver single cell RNA-seq samples, colored by study. |
 |
Figure 3 t-SNE analysis of the normalized log2 CPM values from the liver cancer and fetal/adult liver single cell RNA-seq samples, colored by study. |
Following normalization, our first aim was to identify expression changes responsible for pluripotency in malignant cells, and gauge the appropriateness of their classification as CSCs. To address this aim, we compared the expression of liver CSCs (malignant cells) and fetal progenitor cell types (CD235a-/CD45-/EpCAM+/NCAM+ FETAL) to adult and fetal differentiated cell types (Figure 4). This control set included normal adult differentiated liver cells (CD235a-/EpCAM-/ASOPR1+ ADULT and CD235a-/EpCAM+ ADULT), fetal differentiated liver cells (CD235a-/CD45+/EpCAM- FETAL, T cells, B cells), cancer-associated fibroblasts (CAFs), tumor-associated macrophages (TAMs), and tumor-associated endothelial cells (TECs). We found that 76 genes were significantly upregulated vs the normal differentiated liver cells (>5 fold over-expression and Bonferroni corrected p-value < 0.001) (Supplementary Table 1). We then focused on 34 known stemness markers important for the CSC phenotype (Supplementary Table 2).13,14 This set included cell surface markers as well as transcription factors, including the Yamanaka factors.15 Among the upregulated genes, the following genes were implicated as stem cell markers: SOX9, KRT19, KRT7, and CD24. These results support the assertion that liver cancer stem cells mimic the expression profiles of fetal hepatobiliary progenitor cells, as well as the proper classification of these cells as CSCs.
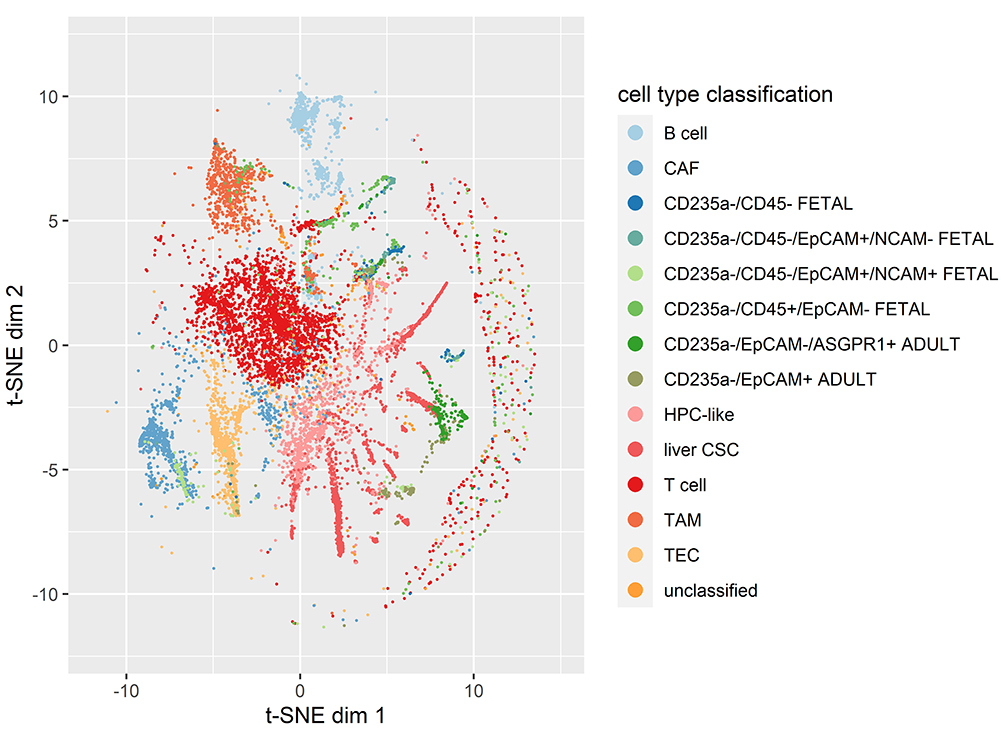 |
Figure 4 t-SNE analysis of the normalized log2 CPM expression values for the liver cancer and fetal/adult liver single cell RNA-seq samples, colored by cell type classification. |
Of potential interest, when we looked at over-expressed genes overall, we found that they were significantly enriched of extracellular matrix genes (GO:0031012, p-value = 4.3E-9), given the importance of the extracellular matrix in modulating proliferation of stem cells28 and promotion of CSC renewal.29 Conversely, only two genes showed significant (>5 fold) underexpression among liver CSCs and fetal progenitors: serglycin and HLA Class II Histocompatibility Antigen, DR Alpha Chain (HLA-DRA). Given that HLA-DRA is expressed in mature immune cells, which made up a large part our control set of cell types, this result gives us confidence that our set of liver CSCs and fetal progenitor cell types formed a distinct undifferentiated set from our differentiated control set of cell types.
To further support our results, we next included the subset of adult cells expressing hepatic progenitor cell markers (HPC-like) with liver CSCs and fetal progenitor cell types. We found that 46 genes were significantly overexpressed (> 5 fold over-expression and Bonferroni corrected p-value < 0.001) in this set vs the control cell types (Supplementary Table 3). Confirming our previous results, we again found that SOX9, KRT19, KRT7, and CD24 stemness markers were overexpressed in this set.
Finally, we analyzed the differences in expression between liver CSCs and fetal progenitor cell types. We found that 248 genes were at least 5 fold overexpressed in liver CSCs (p-value < 0.001) (Supplementary Table 4). Interestingly, liver CSCs had a significant enrichment of overexpressed genes functioning in SRP-dependent cotranslational protein targeting to membrane (GO:0006614, p-value = 5.5E-14), structural constituent of ribosome (GO:0003735, p-value = 4.0E-12) and translational initiation (GO:0006413, p-value = 1.9E-11). This potentially speaks to the dysregulation of translation in cancer and increased growth rate of CSCs relative to fetal progenitor cells. Interestingly, 2 Yamanaka factors15 were significantly overexpressed in liver CSCs relative to fetal progenitor cells: Oct4/POU5F1 (2.14 fold, p-value = 8.28E-48) and SOX2 (1.13 fold, p-value = 0.0392) (Figure 5). Additionally, liver CSCs had significantly higher expression of 3 additional stemness factors: CD44 (3.25 fold, p-value = 4.24E-21), KRT7 (2.2 fold, p-value = 1.27E-15), and SOX9 (1.71 fold, p-value = 1.08E-7). Further supporting the importance of CD44 in cancer development and progression,30 CD44 was also significantly over-expressed in liver CSCs relative to HPC-like (2.45 fold, p-value = 7.01E-29).
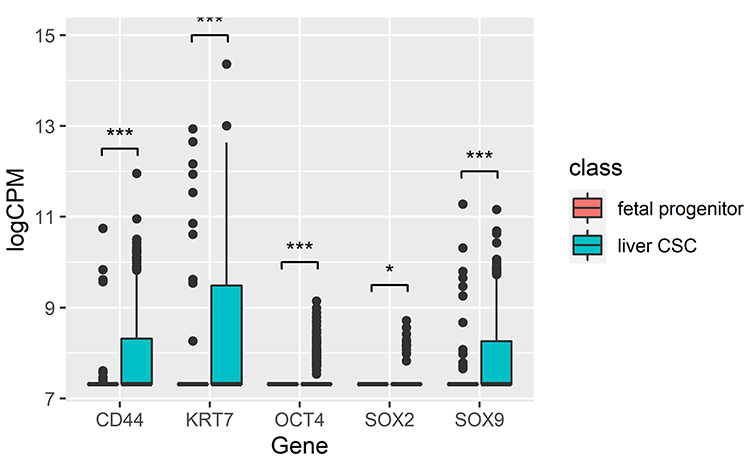 |
Figure 5 Box plots of expression of stemness factors (OCT4, SOX2, CD44, KRT7, SOX9) that distinguish liver CSCs from fetal progenitor cell types. Notes: *p-value < 0.05; ***p-value < 0.0001. |
To further delineate the malignant liver cancer cells from liver CSCs, we performed t-SNE analysis using all 10,865 sample cells across all 42,684 genes. Malignant cells showed mostly distinct clustering apart from the other cell types, replicating previously observed results of Ma et al.8 However, of particular interest was a large cluster which contained the majority of HPC-like cells (526/988) which also contained a small subset of malignant cells (155/1990). Given the overall similarity in expression between these malignant cells and HPC-like cells, it suggests that these could be a more accurate delineation of liver CSCs. Although no significant differences between these two groups were observed, CSCs within this cluster had lower levels of CXCL10 than the HPC-like cells (0.749 fold, p-value = 0.145). This decrease in expression could potentially promote CSC proliferation, given the anti-tumor activity of CXCL10.31
Discussion
With the diversity of cancer studies now being carried out with single-cell next generation sequencing, the abundance of data allows us to begin asking additional questions beyond the original scope of the researchers. Cell expression profiles are important tools for understanding the transformation of non-cancerous to cancerous cells and understanding the stemness of CSCs. Using big datasets is critical for these types of analyses. This study built on previous studies, and expands on previously established methods for gene expression meta-analyses to tackle even larger datasets.32 This allows us to reach new levels in the size of our comparative analyses to generate novel knowledge discovery. Specifically, we aimed to understand how the expression profiles of CSCs compare to adult and fetal progenitor cells in order to better understand the self-renewal and differentiation capabilities of CSCs. To achieve our aim we undertook a reanalysis of two publically available single-cell RNA-seq datasets which characterize liver cancer and adult and fetal healthy liver samples.
We first examined the expression profiles of 34 known stemness markers13,14 to ensure the accuracy of the previous study’s characterization of cells as CSCs. Examining the expression of a set of stemness factors across the different cell types of cancerous and healthy adult and fetal liver samples, we observed that CSCs fall into a distinct expression profile that is much more similar to that of progenitor cell types in contrast to terminally differentiated cell types. Specifically, we observed significantly higher expression of SOX9, KRT19, KRT7, and CD24 stem cell markers in CSCs compared to terminally differentiated cell types. Additionally, CSCs had significantly higher expression levels Oct4 and SOX2 than progenitor cell types. Based on this, we suggest the importance of these two Yamanaka factors15 in promoting the self-renewal and differentiation capabilities of CSCs.
Our results also revealed a significant enrichment of GO terms, SRP-dependent cotranslational protein targeting to membrane, structural constituent of ribosome, and translational initiation, in liver CSCs relative to hepatobiliary hybrid progenitors. It is interesting that all three GO terms function in the increased production of proteins, particularly those that are membrane targeted. Recent research has previously implicated the importance of SRP-dependent cotranslational protein targeting to membrane in lung cancer.33 Further, proteins belonging to these GO categories have been shown to activate tumor growth and metastasis in breast cancer cells.34 These results further illustrate the similarities in gene expression across cancer types, and provide additional potential avenues for novel liver cancer treatments, as inhibitors of protein translocation across membranes have been recently implicated as anticancer agents.35
These results provide novel insight into cancer biology that was made possible by harmoniously utilizing publically available datasets. While many of the stemness factors have been previously identified as important in cancer, our results provide unique insight into how cancer stem cells differ in expression from liver progenitor cell types. We believe this provides a better understanding of how these markers function in providing the increased proliferation and differentiation potential seen in cancer stem cells. Specifically, while CD44 and SOX9 have been previously implicated in promoting proliferation of cancer stem cells,36 we believe our work is the first to implicate KRT7 in the proliferation of liver cancer stem cells. Our study demonstrates the potential power of harnessing shared large amounts of data for driving novel knowledge discovery and hypothesis generation.
Acknowledgments
This work was in part funded by NIH grant UL1TR001433.
Disclosure
The authors report no conflicts of interest in this work.
References
1. Bourne PE, Bonazzi V, Dunn M, et al. The NIH Big Data to Knowledge (BD2K) initiative. J Am Med Inform Assoc. 2015;22(6):1114. doi:10.1093/jamia/ocv136
2. Paten B, Diekhans M, Druker BJ, et al. The NIH BD2K center for big data in translational genomics. J Am Med Inform Assoc. 2015;22(6):1143–1147. doi:10.1093/jamia/ocv047
3. Toga AW, Foster I, Kesselman C, et al. Big biomedical data as the key resource for discovery science. J Am Med Inform Assoc. 2015;22(6):1126–1131. doi:10.1093/jamia/ocv077
4. Jagodnik KM, Koplev S, Jenkins SL, et al. Developing a framework for digital objects in the Big Data to Knowledge (BD2K) commons: report from the Commons Framework Pilots workshop. J Biomed Inform. 2017;71:49–57. doi:10.1016/j.jbi.2017.05.006
5. Batlle E, Clevers H. Cancer stem cells revisited. Nat Med. 2017;23(10):1124–1134. doi:10.1038/nm.4409
6. Beck B, Blanpain C. Unravelling cancer stem cell potential. Nat Rev Cancer. 2013;13(10):727–738. doi:10.1038/nrc3597
7. Yang L, Shi P, Zhao G, et al. Targeting cancer stem cell pathways for cancer therapy. Signal Transduct Target Ther. 2020;5(1):8.
8. Ma L, Hernandez MO, Zhao Y, et al. Tumor cell biodiversity drives microenvironmental reprogramming in liver cancer. Cancer Cell. 2019;36(4):418–430.e416. doi:10.1016/j.ccell.2019.08.007
9. Segal JM, Kent D, Wesche DJ, et al. Single cell analysis of human foetal liver captures the transcriptional profile of hepatobiliary hybrid progenitors. Nat Commun. 2019;10(1):3350. doi:10.1038/s41467-019-11266-x
10. IARC. Fact sheets by population-globocan-IARC; 2019. Available from: http://gco.iarc.fr/today/fact-sheets-cancers.
11. Kumar M, Zhao X, Wang XW. Molecular carcinogenesis of hepatocellular carcinoma and intrahepatic cholangiocarcinoma: one step closer to personalized medicine? Cell Biosci. 2011;1(1):5. doi:10.1186/2045-3701-1-5
12. Wu PC, Lai VC, Fang JW, Gerber MA, Lai CL, Lau JY. Hepatocellular carcinoma expressing both hepatocellular and biliary markers also expresses cytokeratin 14, a marker of bipotential progenitor cells. J Hepatol. 1999;31(5):965–966.
13. Zhao W, Li Y, Zhang X. Stemness-related markers in cancer. Cancer Transl Med. 2017;3(3):87–95. doi:10.4103/ctm.ctm_69_16
14. Puram SV, Tirosh I, Parikh AS, et al. Single-cell transcriptomic analysis of primary and metastatic tumor ecosystems in head and neck cancer. Cell. 2017;171(7):1611–1624.e1624. doi:10.1016/j.cell.2017.10.044
15. Liu X, Huang J, Chen T, et al. Yamanaka factors critically regulate the developmental signaling network in mouse embryonic stem cells. Cell Res. 2008;18(12):1177–1189. doi:10.1038/cr.2008.309
16. Edgar R, Barrett T. NCBI GEO standards and services for microarray data. Nat Biotechnol. 2006;24(12):1471–1472. doi:10.1038/nbt1206-1471
17. Tryka KA, Hao L, Sturcke A, et al. NCBI’s database of genotypes and phenotypes: dbGaP. Nucleic Acids Res. 2014;42(D1):D975–979. doi:10.1093/nar/gkt1211
18. Robinson MD, McCarthy DJ, Smyth GK. edgeR: a Bioconductor package for differential expression analysis of digital gene expression data. Bioinformatics. 2010;26(1):139–140. doi:10.1093/bioinformatics/btp616
19. Robinson MD, Oshlack A. A scaling normalization method for differential expression analysis of RNA-seq data. Genome Biol. 2010;11(3):R25. doi:10.1186/gb-2010-11-3-r25
20. McCarthy DJ, Chen Y, Smyth GK. Differential expression analysis of multifactor RNA-Seq experiments with respect to biological variation. Nucleic Acids Res. 2012;40(10):4288–4297. doi:10.1093/nar/gks042
21. Lun AT, Chen Y, Smyth GK. It’s DE-licious: a recipe for differential expression analyses of RNA-seq experiments using quasi-likelihood methods in edgeR. Methods Mol Biol. 2016;1418:391–416.
22. Huang da W, Sherman BT, Lempicki RA. Systematic and integrative analysis of large gene lists using DAVID bioinformatics resources. Nat Protoc. 2009;4(1):44–57. doi:10.1038/nprot.2008.211
23. Pedregosa F, Varoquaux G, Gramfort A, et al. Scikit-learn: machine learning in Python. J Mach Learn Res. 2012;12:2825–2830.
24. Hunter JD. Matplotlib: a 2D graphics environment. Comput Sci Eng. 2007;9(3):90–95. doi:10.1109/MCSE.2007.55
25. Waskom M, Botvinnik O, Ostblom J, et al. mwaskom/seaborn: v0.10.1 (April 2020). zenodo. 2020.
26. Wickham H. Ggplot2: Elegant Graphics for Data Analysis. New York: Springer-Verlag; 2016.
27. Caracausi M, Piovesan A, Antonaros F, Strippoli P, Vitale L, Pelleri MC. Systematic identification of human housekeeping genes possibly useful as references in gene expression studies. Mol Med Rep. 2017;16(3):2397–2410. doi:10.3892/mmr.2017.6944
28. Gattazzo F, Urciuolo A, Bonaldo P. Extracellular matrix: a dynamic microenvironment for stem cell niche. Biochim Biophys Acta. 2014;1840(8):2506–2519. doi:10.1016/j.bbagen.2014.01.010
29. Nallanthighal S, Heiserman JP, Cheon DJ. The role of the extracellular matrix in cancer stemness. Front Cell Dev Biol. 2019;7:86. doi:10.3389/fcell.2019.00086
30. Chen C, Zhao S, Karnad A, Freeman JW. The biology and role of CD44 in cancer progression: therapeutic implications. J Hematol Oncol. 2018;11(1):64. doi:10.1186/s13045-018-0605-5
31. Liu M, Guo S, Stiles JK. The emerging role of CXCL10 in cancer (Review). Oncol Lett. 2011;2(4):583–589. doi:10.3892/ol.2011.300
32. Rau A, Marot G, Jaffrézic F. Differential meta-analysis of RNA-seq data from multiple studies. BMC Bioinform. 2014;15:91. doi:10.1186/1471-2105-15-91
33. Nakamura H, Fujii K, Gupta V, et al. Identification of key modules and hub genes for small-cell lung carcinoma and large-cell neuroendocrine lung carcinoma by weighted gene co-expression network analysis of clinical tissue-proteomes. PLoS One. 2019;14(6):e0217105. doi:10.1371/journal.pone.0217105
34. Nabet BY, Qiu Y, Shabason JE, et al. Exosome RNA unshielding couples stromal activation to pattern recognition receptor signaling in cancer. Cell. 2017;170(2):352–366.e313. doi:10.1016/j.cell.2017.06.031
35. Van Puyenbroeck V, Vermeire K. Inhibitors of protein translocation across membranes of the secretory pathway: novel antimicrobial and anticancer agents. Cell Mol Life Sci. 2018;75(9):1541–1558. doi:10.1007/s00018-017-2743-2
36. Nio K, Yamashita T, Kaneko S. The evolving concept of liver cancer stem cells. Mol Cancer. 2017;16(1):4. doi:10.1186/s12943-016-0572-9
 © 2021 The Author(s). This work is published and licensed by Dove Medical Press Limited. The
full terms of this license are available at https://www.dovepress.com/terms
and incorporate the Creative Commons Attribution
- Non Commercial (unported, 3.0) License.
By accessing the work you hereby accept the Terms. Non-commercial uses of the work are permitted
without any further permission from Dove Medical Press Limited, provided the work is properly
attributed. For permission for commercial use of this work, please see paragraphs 4.2 and 5 of our Terms.
© 2021 The Author(s). This work is published and licensed by Dove Medical Press Limited. The
full terms of this license are available at https://www.dovepress.com/terms
and incorporate the Creative Commons Attribution
- Non Commercial (unported, 3.0) License.
By accessing the work you hereby accept the Terms. Non-commercial uses of the work are permitted
without any further permission from Dove Medical Press Limited, provided the work is properly
attributed. For permission for commercial use of this work, please see paragraphs 4.2 and 5 of our Terms.