")
Back to Journals » OncoTargets and Therapy » Volume 12
Identification of key pathways and hub genes in basal-like breast cancer using bioinformatics analysis
Received 1 December 2017
Accepted for publication 7 February 2018
Published 18 February 2019 Volume 2019:12 Pages 1319—1331
DOI https://doi.org/10.2147/OTT.S158619
Checked for plagiarism Yes
Review by Single anonymous peer review
Peer reviewer comments 3
Editor who approved publication: Dr Ingrid Espinoza
Kaidi Yang,1,2 Jian Gao,3 Mao Luo1,4,5
1Key Laboratory of Medical Electrophysiology of Ministry of Education, Collaborative Innovation Center for Prevention and Treatment of Cardiovascular Disease of Sichuan Province, Southwest Medical University, Luzhou, China; 2Key Laboratory of Tumor Immunology, The First Affiliated Hospital, Army Medical University, Chongqing, China; 3Department of Life Sciences and Technology, Yangtze Normal University, Chongqing, China; 4Drug Discovery Research Center, Southwest Medical University, Luzhou, Sichuan, China; 5Laboratory for Cardiovascular Pharmacology, Department of Pharmacology, School of Pharmacy, Southwest Medical University, Luzhou, Sichuan, China
Background: Basal-like breast cancer (BLBC) is the most aggressive subtype of breast cancer (BC) and links to poor outcomes. As the molecular mechanism of BLBC has not yet been completely discovered, identification of key pathways and hub genes of this disease is an important way for providing new insights into exploring the mechanisms of BLBC initiation and progression.
Objective: The aim of this study was to identify potential gene signatures of the development and progression of the BLBC via bioinformatics analysis.
Methods and results: The differential expressed genes (DEGs) including 40 up-regulated and 21 down-regulated DEGs were identified between GSE25066 and GSE21422 microarrays, and these DEGs were significantly enriched in the terms related to oncogenic or suppressive roles in BLBC progression. In addition, KEGG pathway and GSEA (Gene Set Enrichment Analysis) enrichment analyses were performed for DEGs between the basal type and non-basal-type breast cancer from GSE25066 microarray. These DEGs were enriched in pathways such as cell cycle, cytokine-cytokine receptor interaction, chemokine signaling pathway, central carbon metabolism signaling and TNF signaling pathway. Moreover, the protein-protein interaction (PPI) network was constructed with those 61 DEGs using the Cytoscape software, and the biological significance of putative modules was established using MCODE. The module 1 was found to be closely related with a term of mitosis regulation and enriched in cell cycle pathway, and thus confirmed the pathological characteristic of BLBC with a high mitotic index. Furthermore, prediction values of the top 10 hub genes such as CCNB2, BUB1, NDC80, CENPE, KIF2C, TOP2A, MELK, TPX2, CKS2 and KIF20A were validated using Oncomine and Kaplan-Meier plotter.
Conclusion: Our results suggest the intriguing possibility that the hub genes and modules in the PPI network contributed to in-depth knowledge about the molecular mechanism of BLBC, paving a way for more accurate discovery of potential treatment targets for BLBC patients.
Keywords: basal-like breast cancer, bioinformatics, differentially expressed genes, hub genes, molecular mechanism
Introduction
Breast cancer (BC), the most frequent malignant tumor among females, remains one of the most deadly carcinoma worldwide with a high recurrence rate. Tumor heterogeneity of BC has an insufficient therapeutic response with a quarter of patients going through relapse and metastasis. In 2000, five molecular subtypes of BC were proposed based on the differential gene expression profiles, including estrogen receptor-positive luminal A and B, normal breast-like, HER2 overexpressing and basal-like.1 This new taxonomy became rapidly prevalent for several years until other research studies found an immunohistochemistry technology to replace the chip-based technology completely, thereby acting as an important step for a routine diagnosis. Various subtypes of BC represent different biological entities and highly correlate with clinical outcomes.2 Among such subtypes, basal-like breast cancer (BLBC) comprises approximately 19% of the invasive ductal BC and displays a distinct molecular feature and an unique pattern of metastasis relapse.2,3 But until recently, non specific basal-like biomarkers have been proposed in the early detection of BLBC, and most immunohistochemical markers for BLBC diagnosis appear to be too obscure. Hereby, such a phenomenon motivates us to study the molecular mechanism and core pathways in the evolution and progression of BLBC.
Presently, the Cancer Genome Atlas (TCGA) data sets and various BC databases are available online for download. The high-throughput platforms for analysis of DEGs, such as microarrays, are increasingly valued as promising tools in medical oncology with great clinical applications. The evolutionary computation and data mining in bioinformatics were used for drawing the characteristics of BLBC. To date, despite the high number of studies, only very few biomarkers for the diagnosis of BLBC progression have been assessed in different cohorts or using different techniques including microarrays in bioinformatics, yet none of them has been translated into clinical practice.4,5 Moreover, the interactions among DEGs, particularly the hub genes in the interaction network of BLBC occurrence and progression, remain unclarified.
In this study, we complied a large number of BC samples deposited in Gene Expression Omnibus (GEO, http://www.ncbi.nlm.nih.gov/geo/), and then DEGs, particularly the hub genes, and core pathways between BC (comparing the basal subtype and the non basal subtype) and matched normal controls were identified by the bioinformatics approach. Additionally, other methods, including Oncomine and Kaplan–Meier plotter analysis, gene ontology (GO)/ Kyoto Encyclopedia of Genes and Genomes (KEGG) and Gene Set Enrichment Analysis (GSEA) pathway analysis, construction of protein–protein interaction (PPI) network and identification of putative molecules, were used to analyze these data and to gain key genes and pathways. The aim of this study was to identify hub genes and core pathways and to show potential candidate biomarkers for diagnosis, survival prediction and drug targets of BLBC.
Materials and methods
Microarray data processing
Microarray raw data were downloaded from the GEO database. The GSE25066 based on GPL96 platform (Affymetrix Human Genome U133A Array) contains 508 BC samples, and the gene expression profiles of GSE21422 containing five healthy breast tissues and five invasive ductal breast carcinoma (IDC) samples were deposited in the GPL6244 platform (Affymetrix Human Gene 1.0 ST Array). The original data were obtained from R, a free software environment for statistical computing and graphics. The raw data files were read with the affy package, and then normalized with the GC Robust Multi-array Average method (gcrma package). The limma method was adopted to identify differentially expressed genes (DEGs) with a fold change of >2 fold, and a P-value cutoff of 0.05 was considered as statistically significant. Subsequently, 508 samples were categorized into five groups using the hierarchical clustering analysis. To screen the intersectional genes significantly expressed in basal subtype, online tool venny2.1 (http://bioinfogp.cnb.csic.es/tools/venny/) was used, and R package Venn diagram was utilized to plot Venn diagrams.
GO and pathway enrichment analysis of DEGs
To generally describe the biological characteristics and functional annotation of candidate DEGs, GO and KEGG pathway enrichment analyses were performed online. For investigating the similarity in function and characteristics of DEGs, the online tool DAVID (https://david.ncifcrf.gov/) was used to obtain the enriched KEGG terms.6 The genes in modules were also analyzed in the same way for enriched KEGG and GO terms related to cancer development and progression. In addition, GSEA was selected to determine whether DEGs show statistical significance in one phenotype or pathway based on the expression profiles.7 For GSEA analysis, the R package humanid contributed by jimmy was used to process the expression profile and produce the format of .gct and .gmt files. Then, these files were imported into the GSEA software (http://software.broadinstitute.org/gsea/index.jsp), and the process was run.
PPI network construction and module analysis
To get the PPI network information among the DEGs, we used the Search Tool for Retrieval of the Interacting proteins database (STRINGdb), an R package, which provided an R interface to the STRING PPIs database (http://www.string-db.org) and covered 5,214,234 proteins from 1,133 organisms.8 Subsequently, the output interaction files were uploaded to the Cytoscape software. The plug-in Molecular Complex Detection (MCODE) was performed to screen the functional modules within the PPI network. Moreover, hub genes were determined based on the interaction edges in the network. Also, GO and KEGG enrichment analyses were performed in module genes as mentioned earlier.
Verification and survival analysis of putative hub genes
Oncomine is an integrated data-mining platform containing a large cancer microarray database.9 Farmer’s Breast dataset was based on the Human Genome U133A Array and contained 49 samples with various subtypes. The expression profile was used to verify the expression level of hub genes in luminal and basal-like subtypes, and P<0.05 and fold change >2 were considered as statistically significant. The online tool Kaplan–Meier plotter (http://kmplot.com/analysis/) was used to identify whether the hub genes could predict patients’ survival. The Kaplan–Meier plotter database integrated gene expression data with relapse-free and overall survival information from GEO, European Genome-phenome Archive and TCGA, respectively. In all tests, P<0.001 was considered statistically significant.
Real-time quantitative PCR (RT-qPCR)
Total RNA was extracted from BC cell lines or human BC specimens using TRIzol reagent (Thermo Fisher Scientific, Waltham, MA, USA). Then, 5 μg of total RNA was reverse transcribed in a 20 μL reaction system, and while completion, it was diluted 10-fold. RT-qPCR was carried out with 20 μL of the reaction mixture (100 ng of cDNA, 2× SYBR green [Takara, Takara Biotechnology Co., Dalian, China], 10 μM of forward and reverse primers, ddH2O) using CFX96 Touch™ (Bio-Rad Laboratories Inc., Hercules, CA, USA) at 95°C for 30 seconds followed by 40 cycles at 95°C for 5 seconds and at 60°C for 60 seconds.
Results
Identification of DEGs in two BC microarrays
A total of 508 BC samples were analyzed to identify DEGs comparing the basal subtype and the non-basal subtype, among which 199 upregulated and 242 downregulated DEGs were identified using P<0.01 and fold change >2 as the criteria. Similarly, by comparing five healthy breast samples with five IDCs, a total of 2,533 DEGs (including 1,148 upregulated and 1,385 downregulated DEGs) related to the development and progression of IDC were identified. After that, those candidate genes were set as a background list to get intersection list of DEGs in BLBC using Venn diagrams; a total of 61 DEGs were commonly shared in those samples, which may take oncogenic or suppressive roles in BLBC progression (Figure 1A), and the 61 DEGs are displayed in Table S1. Meanwhile, the heatmap was plotted to represent the differentially expressed profiles of DEGs within four subtypes (Figure 1B).
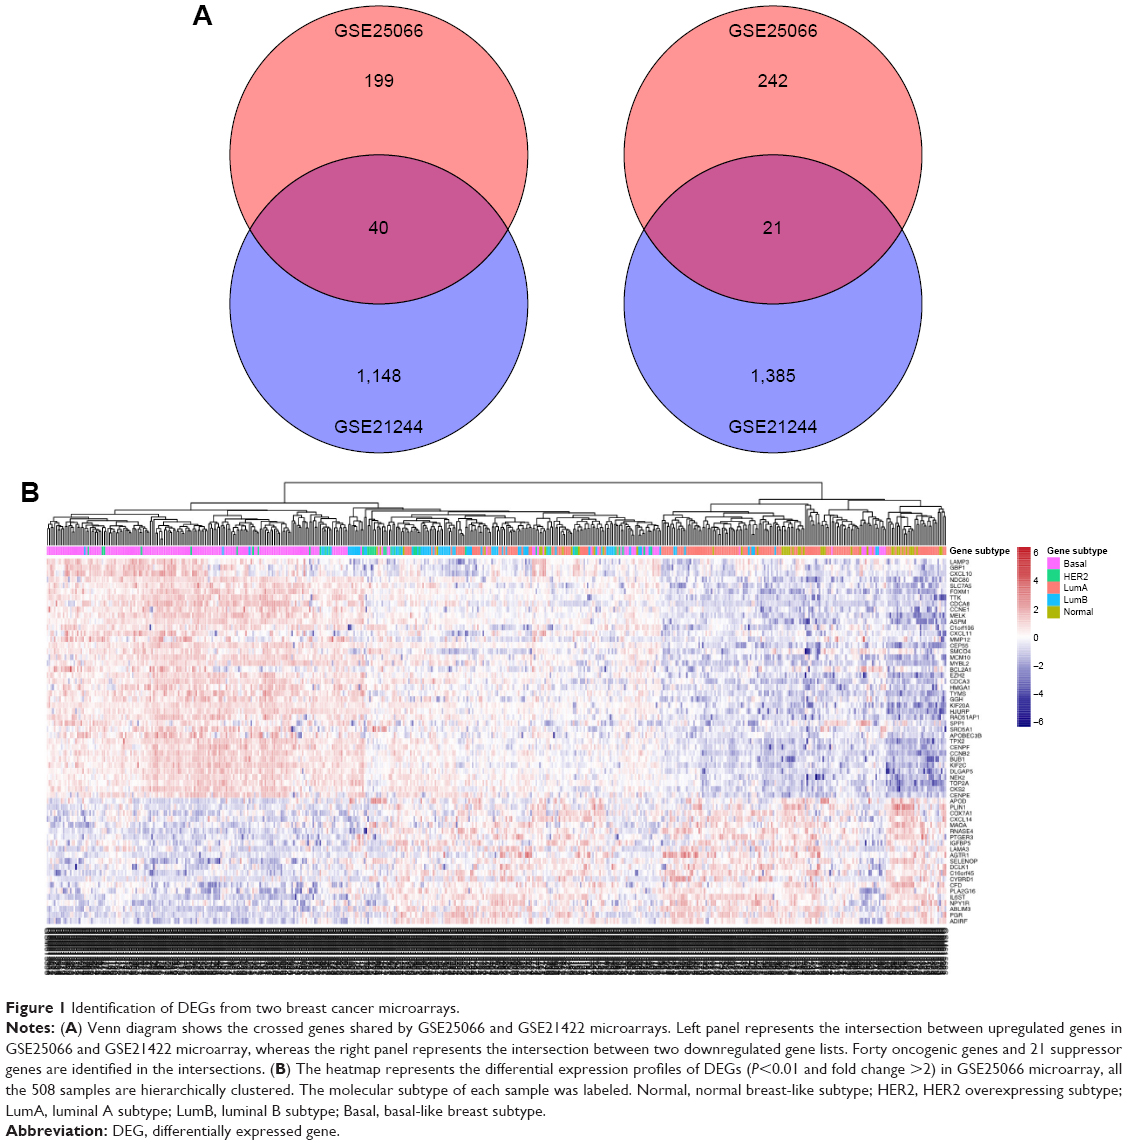 | Figure 1 Identification of DEGs from two breast cancer microarrays. |
KEGG pathway and GSEA analyses of the candidate DEGs
To gain further insights into the function of DEGs, the candidate DEGs between the basal subtype and the non-basal subtype in GSE25066 were uploaded to identify enriched KEGG pathways related to BC. According to the enrichment results, the upregulated DEGs in BLBC were enriched in pathways such as cell cycle, cytokine–cytokine receptor interaction, chemokine signaling pathway, central carbon metabolism signaling and TNF signaling pathway. Besides, the downregulated DEGs were enriched in focal adhesion, metabolism pathway, PI3K-Akt signaling pathway, ECM–receptor interaction and proteoglycans in cancer (Figure 2A). Furthermore, stratified GSEA revealed that enrichment of cell cycle, P53 signaling pathway and DNA replication were observed with basal phenotype (Figure 2B). Moreover, KEGG analysis of 61 genes with oncogenic or suppressive roles in BLBC was performed, and the results indicated that these pathways and terms were enriched in cell cycle, small cell lung cancer, cytokine–cytokine receptor interaction, toll-like receptor signaling pathway and pathways in cancer significantly (Figure 2C). The details of the enriched pathways are shown with the enriched genes listed (Table 1).
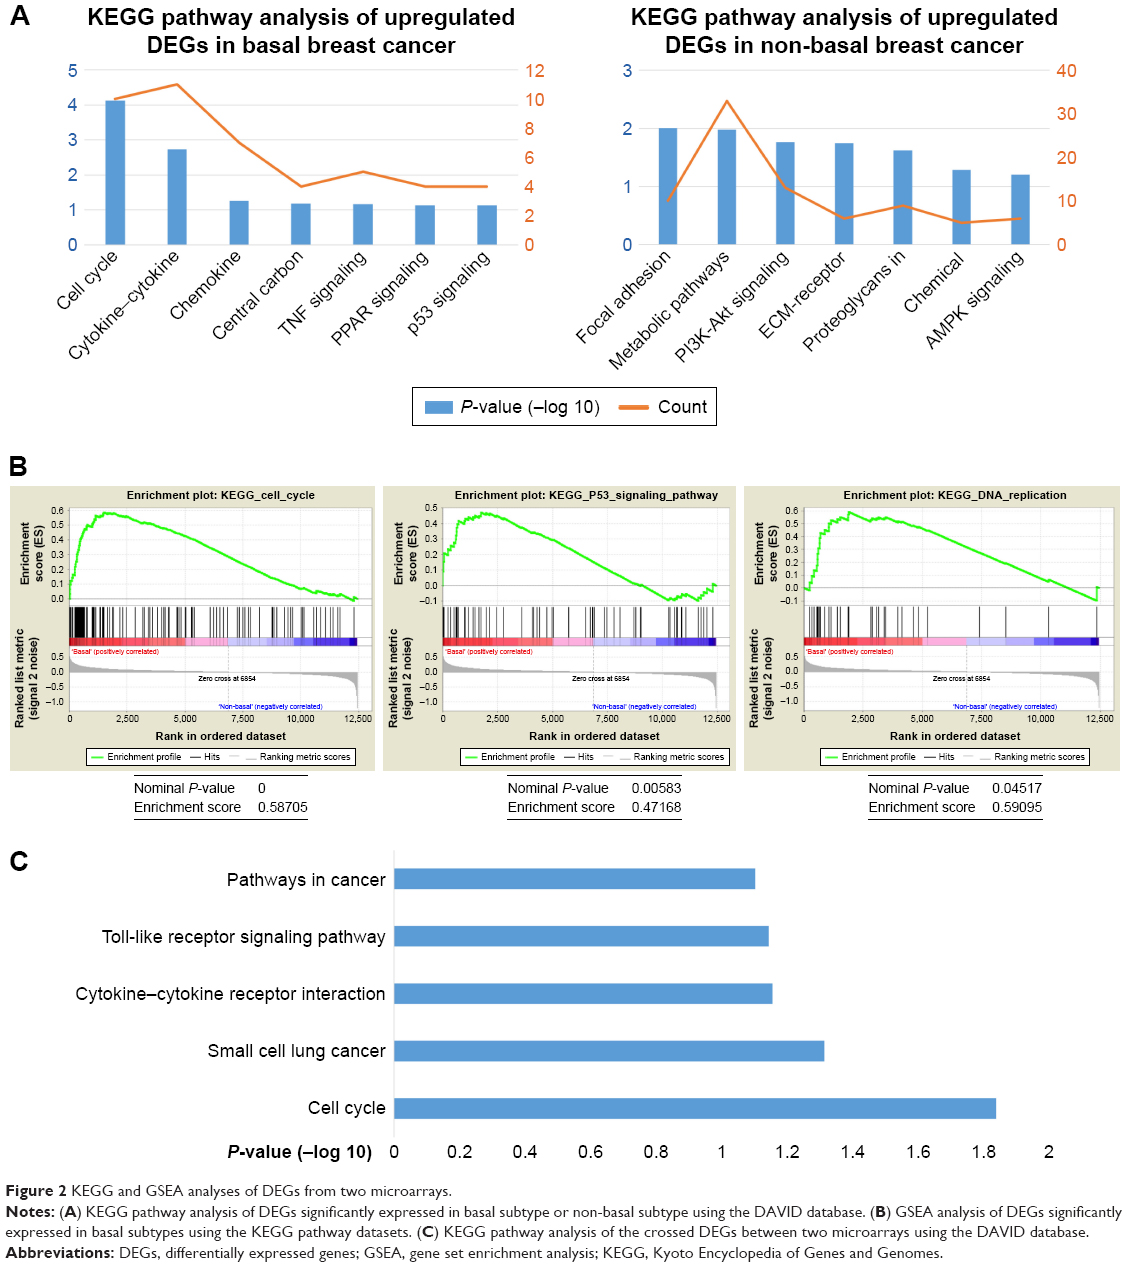 | Figure 2 KEGG and GSEA analyses of DEGs from two microarrays. |
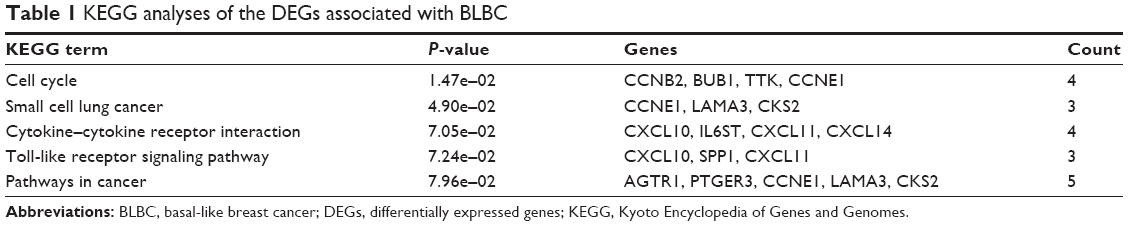 | Table 1 KEGG analyses of the DEGs associated with BLBC |
Modules screening from the PPI network
Based on the interaction information of the 61 DEGs, the top 10 hub genes with higher degrees were identified from the PPI network, including CCNB2, BUB1, NDC80, CENPE, KIF2C, TOP2A, MELK, TPX2, CKS2 and KIF20A (Figure 3A). The PPI network containing 354 edges was displayed with Cytoscape software, and then two significant modules were obtained from the PPI network using MCODE (Figure 3B). The larger module consisted of 24 nodes and 252 edges. Functional annotation of genes in this module was also mainly enriched in the cell cycle pathway according to GO and KEGG analyses, suggesting that genes in this module formed interactive network to control the mitotic process and cell division that might play a crucial role in BLBC progression (Table 2). In the most significant enrichments module 1, BUB1, CCNB2, CDCA8, CENPE, KIF20A, KIF2C, MELK, NDC80, TPX2 and TTK showed the highest degree (Figure 3B). Most of the hub genes in module 1 were also hub genes from the whole PPI network, and all the abovementioned identified hub genes and their biological functions are listed in Table S2.
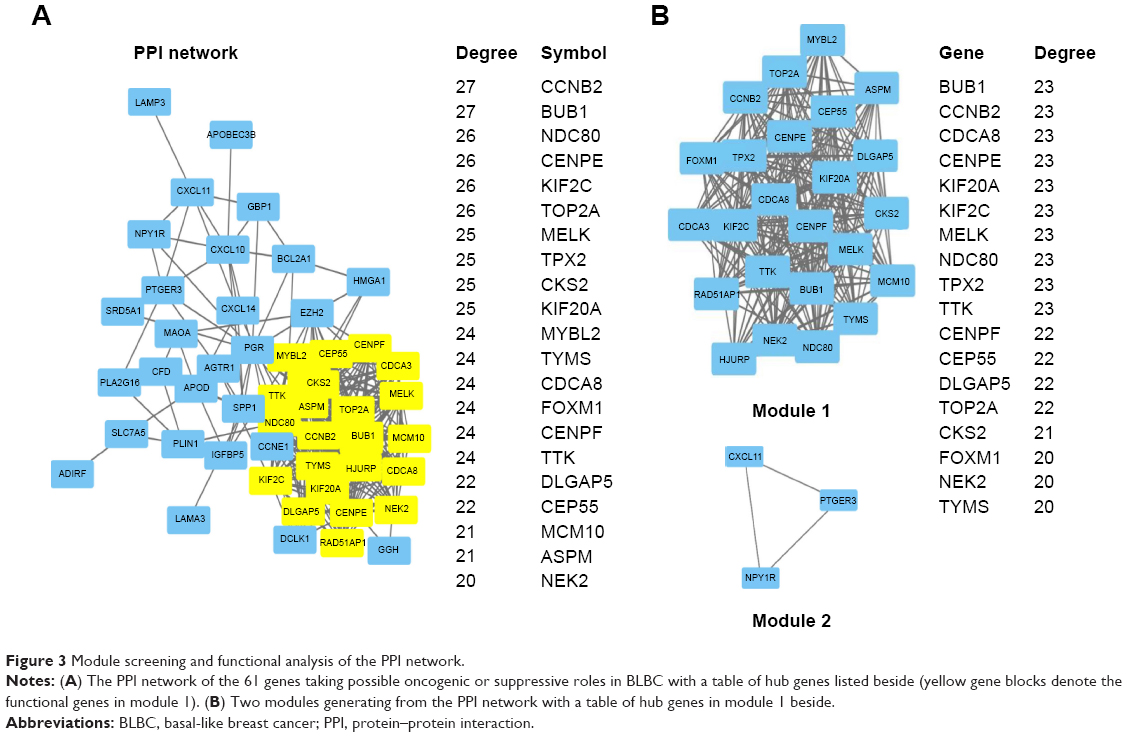 | Figure 3 Module screening and functional analysis of the PPI network. |
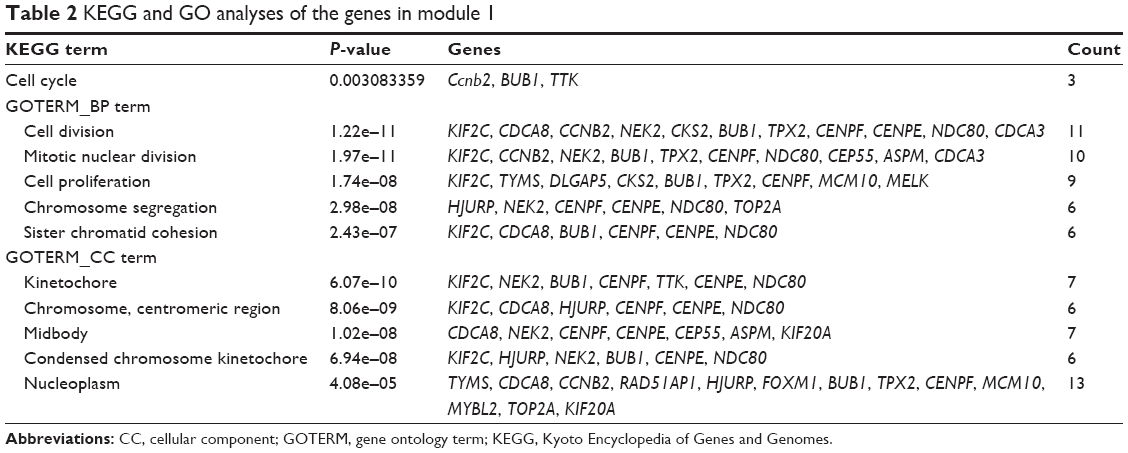 | Table 2 KEGG and GO analyses of the genes in module 1 |
Verification and survival analysis of putative hub genes
Upon comparing the expression of hub genes in the Oncomine database, it showed that all hub genes were higher in basal-like subtype than in luminal subtype, which confirms our model’s reliability. Among them, only BUB1, NDC80, TPX2 and TTK met the criterion (fold change >2 and P<0.001) (Figure 4). Besides, a large amount of BC samples (n=1,113) into survival analysis were incorporated in the online database. Then, the prognostic value of these was analyzed using the Kaplan–Meier plotter. It showed that the expression of each hub gene was significantly associated with overall survival (P<0.001) (Figure 5A). All BC samples were divided into two groups based on the expression levels of whole hub genes, a further indication that the BC patients with higher expression of hub genes were predicted to have a worse prognosis (P=8.3e–5) (Figure 5B).
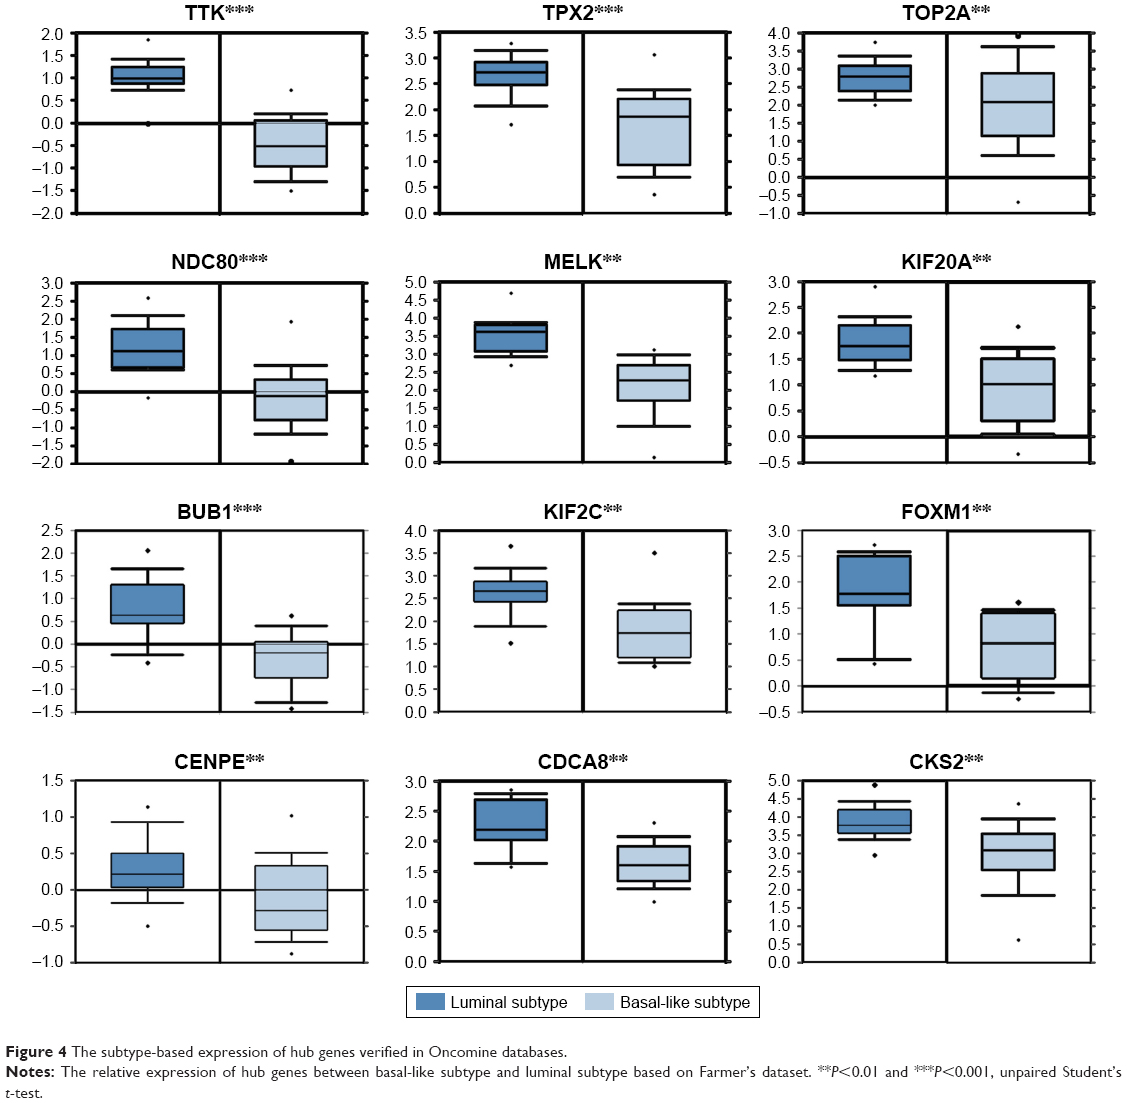 | Figure 4 The subtype-based expression of hub genes verified in Oncomine databases. |
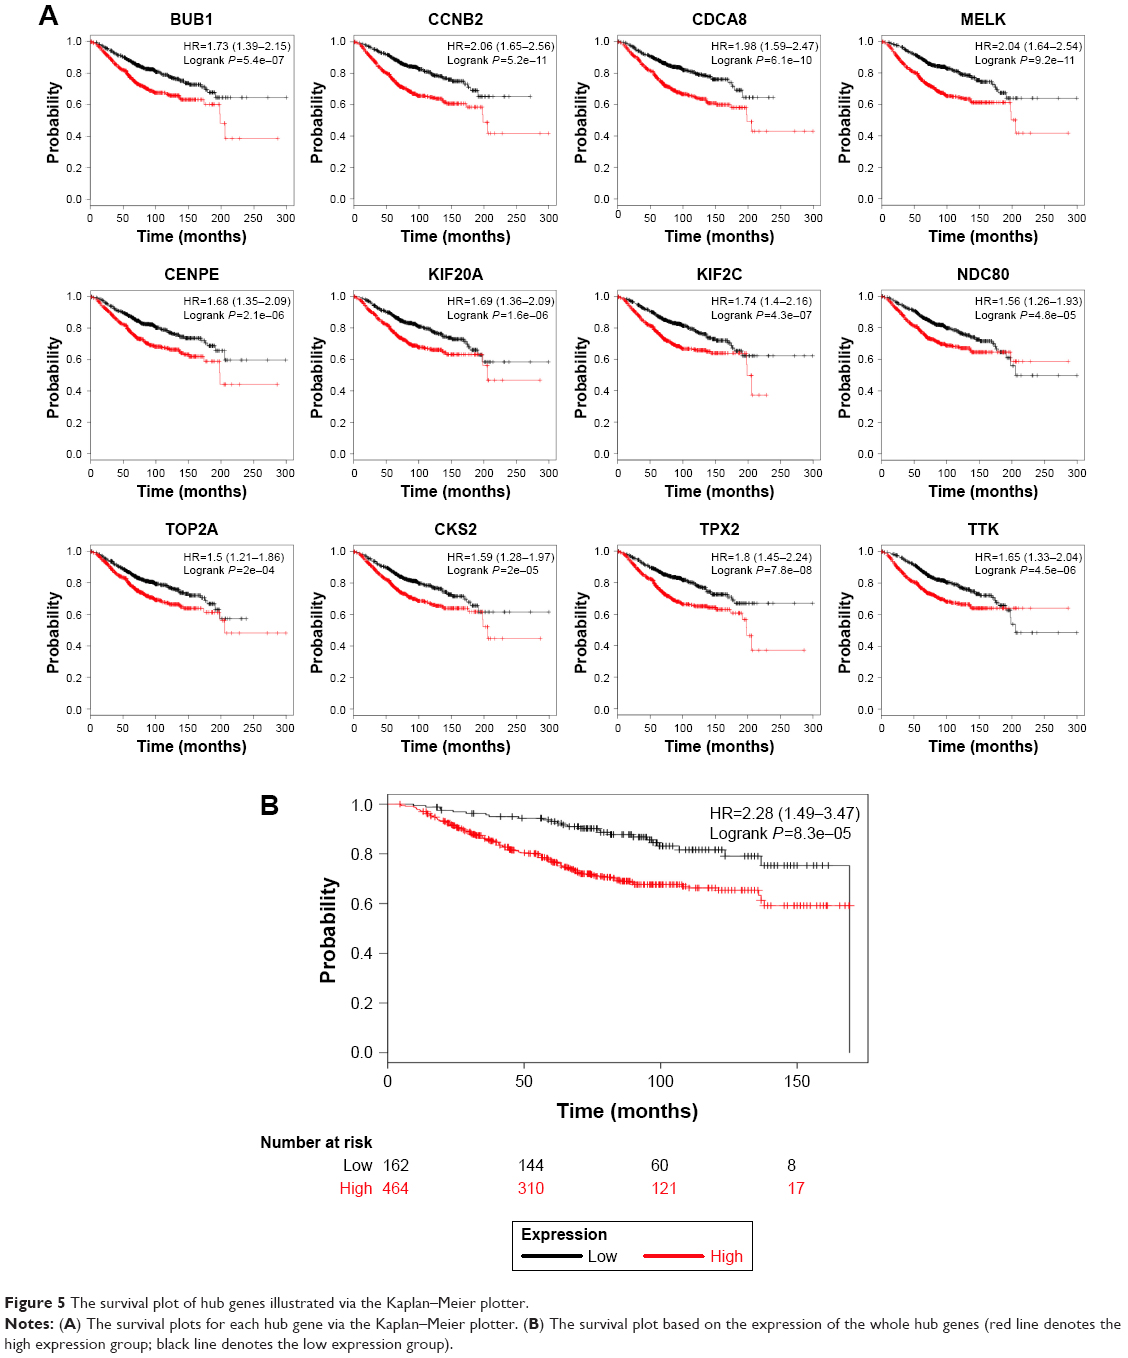 | Figure 5 The survival plot of hub genes illustrated via the Kaplan–Meier plotter. |
Transcriptional expression of hub genes in BC cell lines and specimens
In order to make the study more convincing, three luminal subtypes of BC cell lines (MCF-7, T47D and BT474) and three basal subtypes of BC cell lines (MDA231, MDA157 and SUM159) were prepared to investigate whether the expression of hub genes were specifically expressed in BLBC. Four hub genes, BUB1, CCNB2, KIF2C and CDCA8, were confirmed to be higher in basal subtype by RT-qPCR (Figure 6A). Moreover, fresh frozen BC specimens from three cases of luminal and three cases of triple-negative breast cancer (TNBC) (sometimes employed as a surrogate for BLBC) were collected to verify the results in clinical samples. Consistently, the expressions of the four hub genes were elevated in triple-negative BC compared with luminal subtype (Figure 6B).
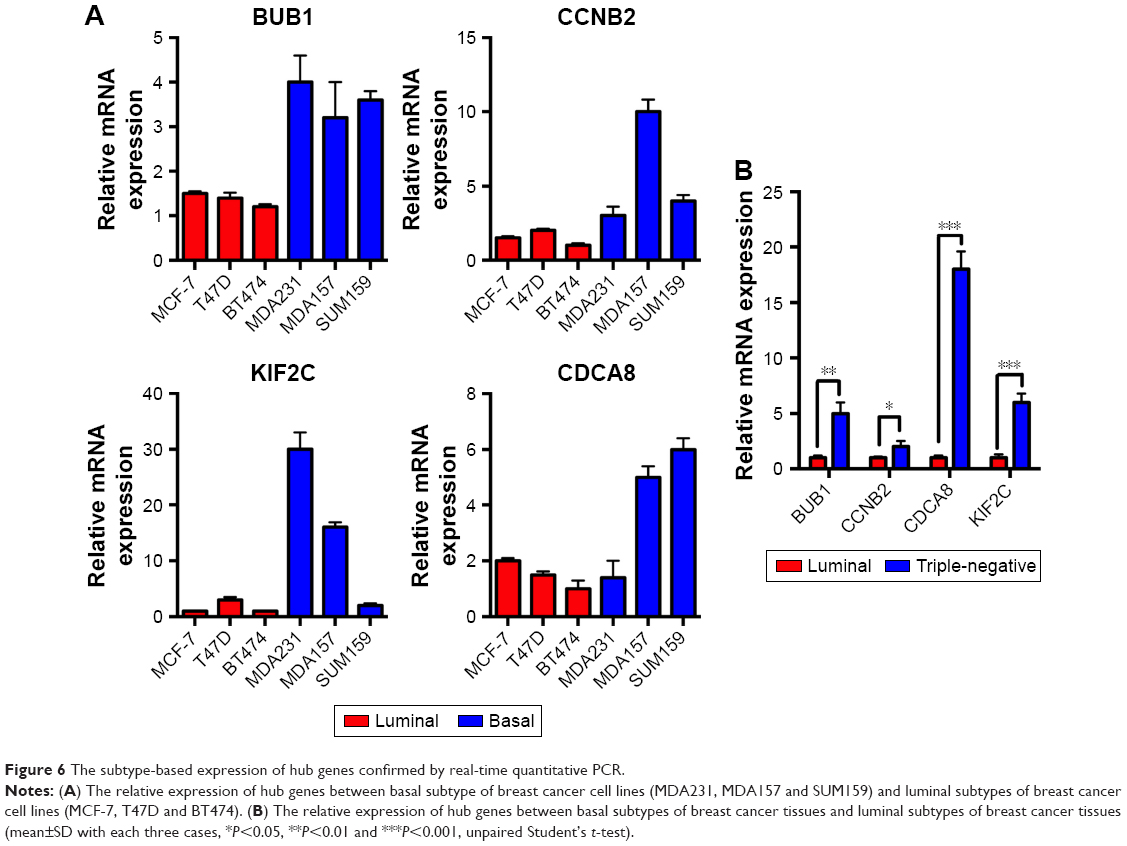 | Figure 6 The subtype-based expression of hub genes confirmed by real-time quantitative PCR. |
Discussion
BC represents a heterogeneous disease with various clinical presentations, treatment responses and subtype-related therapeutic measures. Molecular classification method for BC was achieved a long time ago and recognized worldwide. Meanwhile, we gradually found that various molecular subtypes were associated with distinct metastasis traits and treatment responses, which are useful to predict the survival and guide the administration of clinical drugs.10 BLBC, similar to the triple-negative BC, represents the most aggressive subtype, which was traditionally distinguished via histopathological observation and immunohistochemistry.3 Therapies targeting the ER or HER2 would be expected to be failure on BLBC because this subtype typically expresses low or neither of these oncogenes. Some sophisticated definitions for BLBC have been proposed, eg, it expresses some normal myoepithelial cell makers such as cytokeratins (CK5/6, CK14 and CK17), HER1 and c-KIT.3,11–13 However, those markers are not specific and could not represent the total characteristics of BLBC. In this regard, making use of bioinformatics methods to characterize the BLBC is in urgent need. In the present research, we gained the gene expression profile from the GEO dataset and identified the DEGs in BLBC using bioinformatics analysis. Functional annotation showed that these DEGs were mainly involved in several internal interactions and similar functional patterns in BLBC. Upon comparing with other subtypes, most of these upregulated DEGs in basal-like subtype were mainly enriched in pathways of cell cycle, cytokine–cytokine receptor interaction, chemokine signaling pathway, central carbon metabolism signaling and TNF signaling pathway. Cell cycle disturbance is one of the main hallmarks in BLBC, which have been reported to show histological features of high mitotic index, active mitosis-related molecules.12,14 As BC niche contains complex cell components, such as tumor-associated macrophages and cancer associated fibroblasts (CAF), stromal cells in the tumor microenvironment exhibit promoter or suppressor activity on the cancer cell.15 Many cytokines are involved in this crosstalk. For example, IL-4 and IL-13, pro-inflammatory cytokines, are known to support M2 macrophage polarization, whereas TGF-β recruits and retains macrophages at the tumor site and promotes tumor angiogenesis.16,17 Besides, a disturbance in central carbon metabolism indicates an increased carbon flux through the pentose phosphate pathway (PPP), the tricarboxylic acid cycle (TCA) cycle, as well as an increased pyrimidine biosynthesis, which have been recently reported to desensitize pancreatic ductal adenocarcinoma (PDAC) tumors to gemcitabine and promote cancer progression.18 TNF pathway-related genes are overexpressed in BLBC, indicating that this subtype was conferred to be a phenotype of inflammatory response, like the characteristic of the NF-κb pathway reported previously.12 In contrast to basal-like type, luminal and HER2 subtypes displayed features of disturbances in focal adhesion, metabolism pathway and PI3K-Akt signaling pathway. In GSEA analysis, cell cycle and DNA replication were significantly enriched as well. Moreover, p53 signaling enlisted, like the previous report, regarding P53 mutation as the main molecule feature of BLBC and triple-negative BC.11
STRING PPIs database is an open database for visualization of protein interactions, by which an interactive network was constructed among the DEGs. Based on how many nodes one protein interacts with, the top 10 hub genes, CCNB2, BUB1, NDC80, CENPE, KIF2C, TOP2A, MELK, TPX2, CKS2 and KIF20A, were identified. Among the hub genes, BUB1 ranked first and exhibited the highest degree of connectivity. BUB1 is a mitotic checkpoint kinase, which accurately regulates the chromosome segregation, its turbulence results in the malignant transformation. Han et al19 reported that BUB1 maintained the stemness of BC and served to be a target for treatment. Takagi et al20 also reported that the nuclear BUB1 expression level correlated with Ki67 status and could predict the overall survival of BC patients. Several BUB family genes were key kinases in low-grade luminal BC and were associated with longer-term survival.21 Our research scope contained only high-grade samples, which indicated that BUB1 might take different roles in diverse phases. Another hub gene, CCNB2, was reported as a BC biomarker with an unfavorable prognosis. The Cox proportional hazards regression analysis in that investigation strongly revealed that cytoplasmic CCNB2 expression was significantly associated with disease-free survival in 80 IBC samples.22 Nam and van Deursen reported that CCNB2 was overexpressed in human cancers and disturbed the process of cell mitosis and centrosome separation.23 CDCA8 has been shown to be correlated closely with FOXM1, an oncogenic transcriptional factor involved in BC’s progression and invasion, which was also shown in our DEG list.24 Recently, growing evidence has shown that CDCA8 participates in many physiological processes of triple-negative cancer, verifying our speculation that CDCA8 is a biomarker for BLBC. NDC80, a kinetochore complex component, was reported to serve as a culprit for aneuploidy and involved in early BC.25 In the survival plot (Figure 5), we found that patients with low expression of NDC80 were more likely to survive in the initial stage, confirming NDC80’s role in early stage of BC, whereas in the late stage, patients with low expression of NDC80 are more likely to die. Therefore, further investigation seems to be necessary to clarify underlying links between NDC80 and the initiation and progression of BC. Moreover, gene expression analyses using a large amount of samples indicated that elevated CENPE expression was evident in the basal subtype relative to other subtypes. Kung et al26 reported that CENPE inhibition hampered the proliferation of cells in vitro and in vivo, providing solid evidence for the role of CENPE in BLBC. Besides, KIF2C, a kinesin family member, is significantly expressed in basal subtype and integrated with PRC1 to form a functional complex promoting the growth of BC.27 All the abovementioned hub genes are involved in the process of mitosis and the regulation of spindle checkpoint. Much evidence has demonstrated that the abnormal chromosome separation is the reason for the aneuploidy and chromosomal instability, which may be involved in the progress of cancer.28 Interestingly, Pihan et al29 reported that cancer cell lines had an abnormal mitotic spindle organization and centrosome defects, resulting in abnormal chromosome numbers, whereas the mitotic spindle functioned properly in normal cell lines. As our investigation has shown, defect in mitosis is the major property of BLBC, and a further in-depth understanding of the molecular mechanisms leading to aneuploidy holds promise for the development of cancer drugs that target this process.
Kinesins are a superfamily of motor proteins regulating the mitosis process through an intracellular transport of molecules or organelles. Abnormal expression of kinesins mediates growth defection and drug resistance of BC, partly because of mitotic defects. KIF20A, another kinesin family member in DEG list, was found to be associated with BC patients’ survival.30 TTK is still in dispute. It appears to be associated with a good prognosis in Xu’s results and Kaplan–Meier’s plot (Figure 6).31 However, many investigations indicated that TTK was overexpressed in cancer tissue and associated with a poor prognosis.25,32,33 Maire et al34 indicated that TTK depletion in TNBC cells induces apoptosis and pointed out TTK as a protein kinase overexpressed in TNBC and an attractive therapeutic target. The abovementioned studies used different research methods and varying scale of specimens, along with different conclusions. Our investigation based on a large amount of cases and bioinformatics methods can help researchers reexamine the data in a new perspective. In the end, the prognostic significance and subtype-based expression of hub genes were evaluated in databases and experiments, verifying that these hub genes from bioinformatics analysis assume a carcinogenic role in progression of BLBC.
Conclusion
The aim of this study was to identify DEGs with comprehensive bioinformatics analysis, provide molecular mechanisms and the potential biomarkers and predict progression of BLBC. Our data may be helpful to more accurately classify patients’ subtype and distinguish an aggressive basal-like subtype for clinicians and pathologists. Moreover, this study also indicated that cell cycle dysfunction was the main feature of BLBC and that most of the hub genes were enriched in this pathway, and they were predicted target genes of prognosis in BLBC, especially pointing out that the hub genes could be putative therapeutic targets to treat BLBC. However, further experimental study is required to confirm the function of the identified genes in BLBC.
Acknowledgments
This work was supported by grants from National Natural Science Foundation of China (81602606 and 81800434), Foundation of Department of Education of Sichuan Province (16ZA0178) and Foundation of Luzhou Municipal Science and Technology Bureau (2017LZXNYD-T05 and 2016LZXNYD-J24).
Disclosure
The authors report no conflicts of interest in this work.
References
Perou CM, Sørlie T, Eisen MB, et al. Molecular portraits of human breast tumours. Nature. 2000;406(6797):747–752. | ||
Sørlie T, Perou CM, Tibshirani R, et al. Gene expression patterns of breast carcinomas distinguish tumor subclasses with clinical implications. Proc Natl Acad Sci U S A. 2001;98(19):10869–10874. | ||
Nielsen TO, Hsu FD, Jensen K, et al. Immunohistochemical and clinical characterization of the basal-like subtype of invasive breast carcinoma. Clin Cancer Res. 2004;10(16):5367–5374. | ||
Chen J, Xu J, Li Y, et al. Competing endogenous RNA network analysis identifies critical genes among the different breast cancer subtypes. Oncotarget. 2017;8(6):10171–10184. | ||
Tell RW, Horvath CM. Bioinformatic analysis reveals a pattern of STAT3-associated gene expression specific to basal-like breast cancers in human tumors. Proc Natl Acad Sci U S A. 2014;111(35):12787–12792. | ||
Dennis G, Sherman BT, Hosack DA, et al. DAVID: Database for Annotation, Visualization, and Integrated Discovery. Genome Biol. 2003;4(5):P3. | ||
Subramanian A, Kuehn H, Gould J, Tamayo P, Mesirov JP. GSEA-P: a desktop application for Gene Set Enrichment Analysis. Bioinformatics. 2007;23(23):3251–3253. | ||
Szklarczyk D, Franceschini A, Wyder S, et al. STRING v10: protein-protein interaction networks, integrated over the tree of life. Nucleic Acids Res. 2015;43(Database issue):D447–D452. | ||
Rhodes DR, Yu J, Shanker K, et al. ONCOMINE: a cancer microarray database and integrated data-mining platform. Neoplasia. 2004;6(1):1–6. | ||
Lehmann BD, Bauer JA, Chen X, et al. Identification of human triple-negative breast cancer subtypes and preclinical models for selection of targeted therapies. J Clin Invest. 2011;121(7):2750–2767. | ||
Carey LA, Perou CM, Livasy CA, et al. Race, breast cancer subtypes, and survival in the Carolina Breast Cancer Study. JAMA. 2006;295(21):2492–2502. | ||
Bertucci F, Finetti P, Birnbaum D. Basal breast cancer: a complex and deadly molecular subtype. Curr Mol Med. 2012;12(1):96–110. | ||
Badowska-Kozakiewicz AM, Budzik MP. Immunohistochemical characteristics of basal-like breast cancer. Contemp Oncol. 2016;20(6):436–443. | ||
Bertucci F, Finetti P, Cervera N, et al. How different are luminal A and basal breast cancers? Int J Cancer. 2009;124(6):1338–1348. | ||
Su S, Liu Q, Chen J, et al. A positive feedback loop between mesenchymal-like cancer cells and macrophages is essential to breast cancer metastasis. Cancer Cell. 2014;25(5):605–620. | ||
Hao NB, Lü MH, Fan YH, Cao YL, Zhang ZR, Yang SM. Macrophages in tumor microenvironments and the progression of tumors. Clin Dev Immunol. 2012;2012:948098. | ||
Kim JS, Kim JG, Moon MY, et al. Transforming growth factor-beta1 regulates macrophage migration via RhoA. Blood. 2006;108(6):1821–1829. | ||
Shukla SK, Purohit V, Mehla K, et al. MUC1 and HIF-1alpha signaling crosstalk induces anabolic glucose metabolism to impart gemcitabine resistance to pancreatic cancer. Cancer Cell. 2017;32(1):71–87. | ||
Han JY, Han YK, Park GY, Kim SD, Lee CG, Geun Lee C. Bub1 is required for maintaining cancer stem cells in breast cancer cell lines. Sci Rep. 2015;5(1):15993. | ||
Takagi K, Miki Y, Shibahara Y, et al. BUB1 immunolocalization in breast carcinoma: its nuclear localization as a potent prognostic factor of the patients. Horm Cancer. 2013;4(2):92–102. | ||
Mukherjee A, Joseph C, Craze M, Chrysanthou E, Ellis IO. The role of BUB and CDC proteins in low-grade breast cancers. Lancet. 2015;385 Suppl 1:S72. | ||
Shubbar E, Kovács A, Hajizadeh S, et al. Elevated cyclin B2 expression in invasive breast carcinoma is associated with unfavorable clinical outcome. BMC Cancer. 2013;13:1. | ||
Nam HJ, van Deursen JM. Cyclin B2 and p53 control proper timing of centrosome separation. Nat Cell Biol. 2014;16(6):535–546. | ||
Jiao DC, Lu ZD, Qiao JH, Yan M, Cui SD, Liu ZZ. Expression of CDCA8 correlates closely with FOXM1 in breast cancer: public microarray data analysis and immunohistochemical study. Neoplasma. 2015;62(3):464–469. | ||
Bièche I, Vacher S, Lallemand F, et al. Expression analysis of mitotic spindle checkpoint genes in breast carcinoma: role of NDC80/HEC1 in early breast tumorigenicity, and a two-gene signature for aneuploidy. Mol Cancer. 2011;10:23. | ||
Kung PP, Martinez R, Zhu Z, et al. Chemogenetic evaluation of the mitotic kinesin CENP-E reveals a critical role in triple-negative breast cancer. Mol Cancer Ther. 2014;13(8):2104–2115. | ||
Shimo A, Nishidate T, Ohta T, Fukuda M, Nakamura Y, Katagiri T. Elevated expression of protein regulator of cytokinesis 1, involved in the growth of breast cancer cells. Cancer Sci. 2007;98(2):174–181. | ||
Rajagopalan H, Lengauer C. Aneuploidy and Cancer. Nature. 2004;432:38–341. | ||
Pihan GA, Purohit A, Wallace J, et al. Centrosome defects and genetic instability in malignant tumors. Cancer Res. 1998;58(17):3974–3985. | ||
Duan J, Huang W, Shi H. Positive expression of KIF20A indicates poor prognosis of glioma patients. Onco Targets Ther. 2016;9:6741–6749. | ||
Xu Q1, Xu Y1, Pan B, et al. TTK is a favorable prognostic biomarker for triple-negative breast cancer survival. Oncotarget. 2016;7(49):81815–81829. | ||
Al-Ejeh F, Simpson PT, Saunus JM, et al. Meta-analysis of the global gene expression profile of triple-negative breast cancer identifies genes for the prognostication and treatment of aggressive breast cancer. Oncogenesis. 2014;3:e124. | ||
Yuan B, Xu Y, Woo JH, et al. Increased expression of mitotic checkpoint genes in breast cancer cells with chromosomal instability. Clin Cancer Res. 2006;12(2):405–410. | ||
Maire V, Baldeyron C, Richardson M, et al. TTK/hMPS1 is an attractive therapeutic target for triple-negative breast cancer. PLoS One. 2013;8(5):e63712. |
Supplementary materials
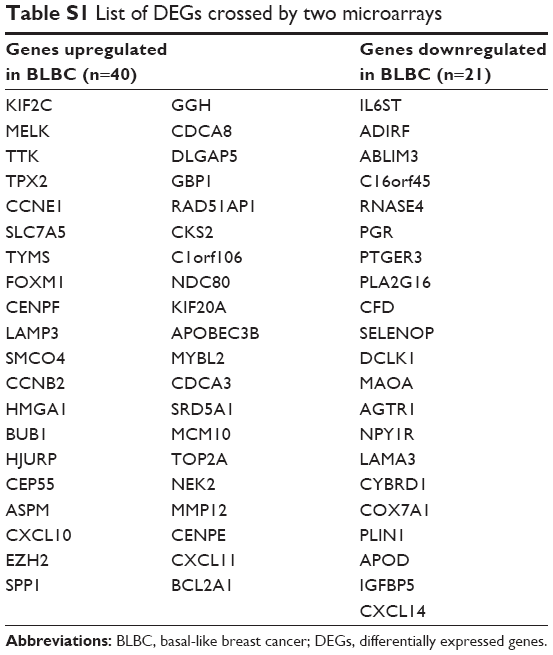 | Table S1 List of DEGs crossed by two microarrays |
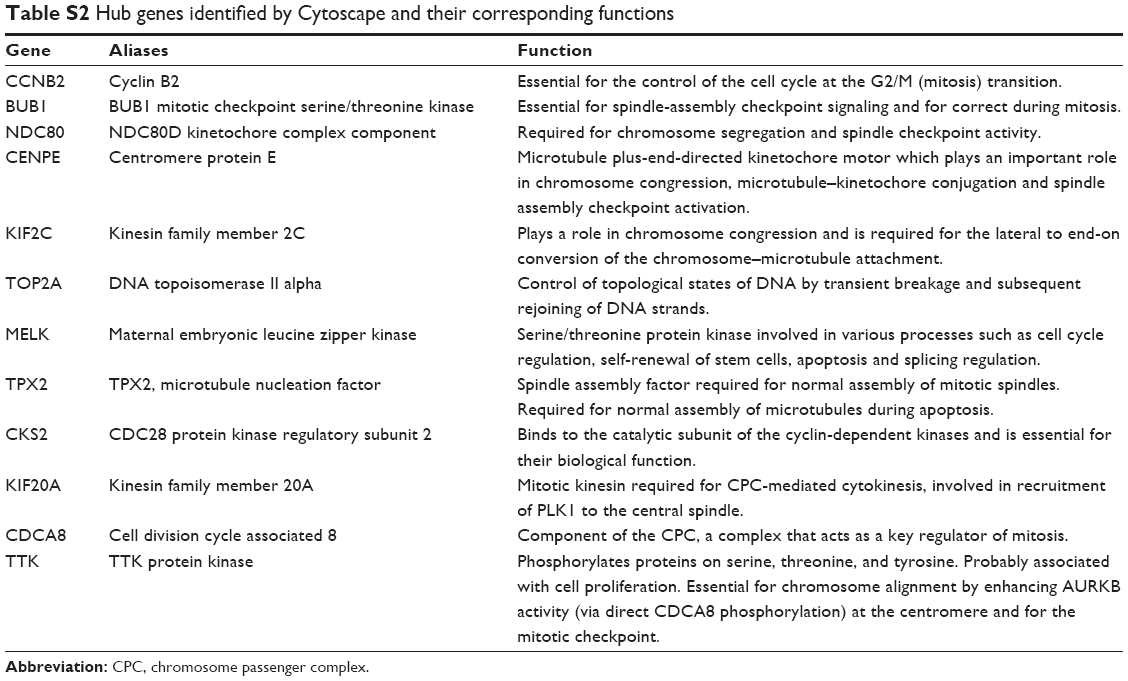 | Table S2 Hub genes identified by Cytoscape and their corresponding functions |
 © 2019 The Author(s). This work is published and licensed by Dove Medical Press Limited. The full terms of this license are available at https://www.dovepress.com/terms.php and incorporate the Creative Commons Attribution - Non Commercial (unported, v3.0) License.
By accessing the work you hereby accept the Terms. Non-commercial uses of the work are permitted without any further permission from Dove Medical Press Limited, provided the work is properly attributed. For permission for commercial use of this work, please see paragraphs 4.2 and 5 of our Terms.
© 2019 The Author(s). This work is published and licensed by Dove Medical Press Limited. The full terms of this license are available at https://www.dovepress.com/terms.php and incorporate the Creative Commons Attribution - Non Commercial (unported, v3.0) License.
By accessing the work you hereby accept the Terms. Non-commercial uses of the work are permitted without any further permission from Dove Medical Press Limited, provided the work is properly attributed. For permission for commercial use of this work, please see paragraphs 4.2 and 5 of our Terms.