")
Back to Journals » International Journal of General Medicine » Volume 14
Identification of Key Molecules and lncRNA-miRNA-mRNA ceRNA Network in Preeclampsia
Authors Luo S, Wang L, Li S, Wang H, Huang S, Zhang Z, Wang R, Guan H, Huang Y
Received 4 February 2021
Accepted for publication 28 September 2021
Published 2 November 2021 Volume 2021:14 Pages 7579—7590
DOI https://doi.org/10.2147/IJGM.S305337
Checked for plagiarism Yes
Review by Single anonymous peer review
Peer reviewer comments 2
Editor who approved publication: Dr Scott Fraser
Shu Luo,1,3 Lina Wang,3 Shuming Li,3 Hongwei Wang,2 Sujing Huang,2 Zhongxia Zhang,2 Ru Wang,2 Hongqiong Guan,3 Yuanhua Huang1,4
1Nanjing Medical University, Nanjing, Jiangsu, 211166, People’s Republic of China; 2Department of Obstetrics, the Second Affiliated Hospital of Hainan Medical University, Haikou, Hainan, 570311, People’s Republic of China; 3College of Second Clinical, Hainan Medical University, Haikou, Hainan, 570311, People’s Republic of China; 4Hainan Medical University, Haikou, Hainan, 571199, People’s Republic of China
Correspondence: Yuanhua Huang
Nanjing Medical University, No. 101, Longmian Avenue, Nanjing, Jiangsu, 211166, People’s Republic of China
Tel +86-13036095796
Email [email protected]
Hongqiong Guan
College of Second Clinical, Hainan Medical University, No. 368, Yehai Avenue, Haikou, Hainan, 570311, People’s Republic of China
Tel +86-13078900121
Email [email protected]
Background: Preeclampsia (PE) is an idiopathic hypertensive disorder of pregnancy and is the leading cause of maternal death, fetal malformation, and premature birth. The purpose of this study is to identify the key molecules and lncRNA-related competitive endogenous (ceRNA) regulatory network in PE.
Methods: The differentially expressed mRNAs (DEGs), lncRNAs (DELs), and miRNAs (DEMs) were identified between PE and control using the Deseq R package. In addition, we performed Geno ontology (GO) and Kyoto encyclopedia of genes and genomes (KEGG) on DEGs and DELs-target genes to explore their function. The ceRNA network was established based on lncRNA-miRNA and miRNA-mRNA interactions and visualized using Cytoscape software. LINCO2532, SLCO4A1-AS1, miR23a-5p, and DYNLRB1 were selected for qRT-PCR assay.
Results: Using microarray analysis, we screened 726 DELs (456 upregulated and 370 downregulated), 49 DEMs (37 upregulated and 12 downregulated), and 318 DEGs (230 upregulated and 88 downregulated) between PE patients and control. Based on lncRNA-miRNA pairs and miRNA-mRNA pairs, the ceRNA network was constructed, which contained 16 lncRNA, 1 miRNA (miR-23a-5p), and 1 mRNA (DYNLRB1). LncRNA (LINCO2532 and SLCO4A1-AS1) and DYNLRB1 were downregulated and the expression of miR23a-5p was upregulated in PE patients compared with healthy controls.
Conclusion: In this study, the novel ceRNA network was established in the placentas of PE patients. It elucidated the regulatory mechanism of PE, and identified novel PE biomarkers, which have important guiding significance for clinical treatment and further scientific research of PE.
Keywords: preeclampsia, lncRNA, miRNA, ceRNA network
Introduction
Preeclampsia (PE) is an idiopathic hypertensive disorder of pregnancy, which refers to the occurrence of hypertension and proteinuria occurring in patients after the 20th week of gestation.1 The incidence of PE is reported to be 4%-5% and is the leading cause of maternal death, fetal malformation, fetal intrauterine growth restriction, and premature birth.2 In addition, PE may cause long-term cardiovascular and metabolic diseases in the mother.3 Nevertheless, the etiology and pathogenesis of PE have not been completely elucidated. Therefore, exploring key genes for PE is essential to revealing the underlying molecular mechanisms and investigating possible diagnostic and therapeutic targets.
Long non-coding RNAs (lncRNAs), a subclass of non-coding RNAs (ncRNAs) with a length of more than 200 nucleotides, play essential roles in regulating various biological functions.3,4 LncRNAs may act as competing endogenous RNAs (ceRNAs) to sponge miRNAs, thus influencing the regulatory function of miRNAs and imposing posttranscriptional regulation of gene expression.5 Recently, the abnormal expression of lncRNAs has been reported to contribute to the pathogenesis of PE. For example, Xu et al have demonstrated that lncRNA TUG1 was significantly reduced in the placental tissue of PE patients, and knockdown of TUG1 affected cell proliferation, apoptosis, and migration.6 A previous study by Li et al uncovered that lncRNA CCAT1 was overexpressed in PE patients and promoted the progression of PE via suppressing CDK4 expression.7 The lncRNA-H19 increased in PE patients and promoted invasion and autophagy via activating PI3K/AKT/mTOR pathways in trophoblast cells.8
miRNAs are a class of endogenous single-stranded ncRNAs with a length of about 22 nucleotides. Accumulating evidence has shown that miRNAs are involved in PE. Qian and Liu indicated that miR-30b may facilitate the development of PE via MAPK pathway by targeting matrix-remodeling associated 5 (MXRA5).9 Moreover, miR-134 suppressed the invasion of trophoblast cells in the placenta of PE patients by decreasing ITGB1 expression.10 Besides, miR-200a, miR-141, miR-144 could affect the proliferation and invasion of trophoblast cells by targeting VEGF, PTEN, and other angiogenic factors, thus participating in the maintenance of pregnancy and the occurrence and development of PE.11–13 These results demonstrated that lncRNAs and miRNAs played a pivotal role in the development and occurrence of PE. However, previous studies mainly focused on the effect of a single lncRNA, miRNA, and gene on PE development, and there were few reports on the lncRNA-miRNA-mRNA regulatory network in PE.
In the present study, we aimed to identify the key genes and construct a pivotal lncRNA-related ceRNA regulatory network in PE. We analyzed lncRNA, miRNA and mRNA expression profiles in the PE and healthy controls based on microarray technology. Then, GO and KEGG enrichment analyses were conducted to examine the biological function of differentially expressed genes (DEGs) and lncRNAs (DELs). This finding may provide a new target for the diagnosis and treatment of PE.
Materials and Methods
Participants
Placental tissues from PE patients (n=3) and healthy controls (n=3) were collected from the Second Affiliated Hospital of Hainan Medical College. Placental samples were taken from a representative block of the central portion of tissue below one-third of the placenta, near the maternal side. All samples were taken from the same region. This region was enriched for cytotrophoblast, syncytiotrophoblast, and villous interstitium. Samples were stored at −80°C until use. The exclusion criteria included multiple gestations, gestational diabetes mellitus, chronic hypertension, thyroid dysfunctions, and kidney disease. According to the American College of Obstetricians and Gynecologists (ACOG), PE is defined as systolic blood pressure of ≥ 140 mmHg and diastolic blood pressure of ≥ 90 mmHg with proteinuria of ≥ 300 mg/day (or a protein/ creatinine ratio of ≥ 0.3 mg/dl or proteinuria of ≥ 1+) or without proteinuria but with severe clinical features after 20 weeks of gestation in a woman with previously normal blood pressure.14
The research protocol complied with the Declaration of Helsinki and was approved by the Ethics Committee of the Second Affiliated Hospital of Hainan Medical College (NO.2018R005-F01). All samples were collected with patients’ informed consent.
RNA Extraction and Amplification
Total RNA of placental tissue was extracted by TRIzol Reagent (Thermo Fisher Scientific, USA). RNA concentration was measured using the Qubit RNA Assay Kit in the Qubit 3.0 Spectrophotometer (Thermo Fisher Scientific, USA). RNA purity was checked using the NanoDrop 2000 (Thermo Fisher Scientific, USA). The RNA integrity was assessed using the RNA Nano 6000 Assay Kit of the Agilent 2100 Bioanalyzer system (Agilent Technologies, USA). RNA was amplified and labeled by a Low Input Quick Amp WT Labeling Kit (Agilent Technologies, USA) following the manufacturer’s instructions. Labeled cRNA was purified by the RNeasy mini kit.
Microarray Analysis
To prepare RNA samples, 3μg RNA per sample was used. First of all, ribosomal RNA was eliminated using the Epicentre Ribo-zero rRNA Removal Kit (Epicentre, USA). Next, ethanol precipitation was done to clean up rRNA-free residue. Successively, sequencing libraries were created using NEBNext Ultra Directional RNA Library Prep Kit for Illumina (NEB) as per the supplier’s instructions. Concisely, fragmentation was done by divalent cations under raised temperature in NEBNext First Strand Synthesis Reaction Buffer (5×). First-strand cDNA was created by random hexamer primer as well as M-MuLV Reverse Transcriptase (RNase H). Second strand cDNA was successively created by DNA Polymerase I plus RNase H. In the reaction buffer, dNTPs with dTTP were substituted by dUTP. Outstanding extensions were transformed into blunted ends by exonuclease/polymerase actions. Following the adenylation of 3ʹ ends of DNA fragments, NEBNext Adaptor with hairpin loop structure was ligated to get ready for hybridization. With the intention of the selection of cDNA fragments of favorably around 150~200 bp in length, the library fragments were cleaned with the AMPure XP system (Beckman Coulter). At that stage, 3μL USER Enzyme (NEB) was used with appropriate adaptor-ligated cDNA at 37°C for 15 minutes trailed by 5 minutes at 95°C. Next, PCR was done with Phusion High-Fidelity DNA. The clustering of the index-coded samples was accomplished on a cBot Cluster Generation System by TruSeq PE Cluster Kit v3-cBot-HS (Illumia) as per the supplier’s protocol. After cluster generation, the libraries were sequenced on an Illumina Hiseq. 2500 platform.
Quality Control of Raw Sequencing
For lncRNA, raw data was obtained by removing rRNA through an Epicentre ribo-0rRNA removal kit (Epicentre, USA) and removing free rRNA residue through ethanol precipitation. Subsequently, sequencing libraries were generated by the rRNA-depleted RNA by NEBNext Ultra Directional RNA Library Prep Kit for Illumina (NEB, USA) following the manufacturer’s recommendations. For miRNAs, raw data of fastq format was first processed through custom Perl and Python scripts. In this step, clean data was obtained by removing reads containing ploy-N, with 5ʹ adapter contaminants, without 3ʹ adapter or the insert tag, reads containing ploy-A, ploy-T, ploy-G, or ploy-C, and low-quality reads from raw data. At the same time, Q20, Q30, and GC-content of all the raw data were calculated. Taken together, all the downstream analyses were based on clean data.
Differentially Expressed Analysis
The Differentially expressed mRNA (DEGs), lncRNAs (DELs), and miRNAs (DEMs) were identified between PE and control using the Deseq R package. A threshold value of |log2FC| >1 with p value <0.05 was determined. The ggplot2 in the R package was used to draw heat maps of the DERNAs.
Functional Enrichment Analysis
We performed Geno ontology (GO) and Kyoto encyclopedia of genes and genomes (KEGG) on DEGs and DELs-target genes to explore their functions using Cluster Profiler in R package. GO analysis included biological processes (BP), cellular components (CC), and molecular functions (MF). KEGG analysis mainly focused on enrichment analysis of the signaling pathways of DEGs and DELs-target genes. P < 0.05 as the threshold for statistical significance. The ggplot2 in R package was used to draw the GO and KEGG analysis results.
CeRNA Regulatory Network Construction
The LncTar software was used to predict the lncRNA-miRNA interactions and then combined with the identified DEMs to build the DELs-DEMs network. Similarly, we utilized miRanda and RNAhybrid to predict the target genes of the selected DEMs in this study. And a miRNA-mRNA network was constructed by combining DEGs. By integrating the lncRNA-miRNA, miRNA-mRNA pairs, the lncRNA-miRNA-mRNA ceRNA network was established and visualized by Cytoscape software.
qRT-PCR for the Expression Examination
Based on the results of lncRNA-miRNA-mRNA ceRNA network, LINCO2532, SLCO4A1-AS1, miR23a-5p, and DYNLRB1 were selected for expression verification. Placental tissues from 27 PE patients (30.04 ± 4.37 years) and 30 healthy controls (29.97 ± 4.26 years) were collected from the Second Affiliated Hospital of Hainan Medical College for qRT-PCR assay. Total RNA of placental tissue was extracted by TRIzol Reagent (Thermo Fisher Scientific, USA). The reverse transcription (RT) reactions for the expression of LINCO2532, SLCO4A1-AS1, DYNLRB1 and GAPDH were performed by Takara-PrimeScript™ RT Master Mix (Perfect Real Time). SYBR Green-based qPCR profiling was performed using Takara-TB Green™ Premix Ex Taq™ II (Tli RNaseH Plus). The primers sequences were designed as following, forward primer: LINC02532-F: GCAGATCAAGATGTGGCAACC, LINC02532-R:TGCCCTCAGCTCAGAGTTCT, SLCO4A1-AS1-F: AGACATTGGGGCTGAACGTG, SLCO4A1-AS1-R:GTTCAAGTCAGCGACACTCTG, DYNLRB1-F: GACCCCCAGAACGATCTCAC, DYNLRB1-R: AGGAAATAGTCTTTATCTGGTGCAA, GAPDH –F: GGAGCGAGATCCCTCCAAAAT, and reverse primer: GAPDH –R: GGCTGTTGTCATACTTCTCATGG for GAPDH. The levels of miRNAs were normalized using GAPDH as reference RNA. The relative expression quantity (RQ) of mRNA was calculated as RQ = 2−ΔΔCt. ΔΔCt = mean value of the study group (Ct target − CtGAPDH) – mean value of the control group (Ct target− CtGAPDH).
The reverse transcription (RT) reactions of U6 and miR23a-5p were performed by the miRcute Plus miRNA First-Strand cDNA Synthesis Kit (cat. no. KR211; Tiangen) with Oligo (dT)-Universal Tag primer. SYBR Green-based qPCR profiling was performed using miRcute Plus miRNA qPCR Detection Kit (cat. no. FP411; Tiangen) in ABI 7500 Real-Time PCR System (Applied Biosystems) according to the manufacturer’s instructions. The miR23a-5p specific forward primer sequences (GCGCAGTTCCTGGGGATG) were designed based on the miRNA sequences obtained from the miRBase database. The levels of miRNAs were normalized using U6 as reference RNA. The relative expression quantity (RQ) of miRNA was calculated as RQ = 2−ΔΔCt. ΔΔCt = mean value of the study group (Ct miR23a-5p − Ct U6) – mean value of the control group (Ct miR23a-5p − Ct U6).
Results
Subjects
Three patients with PE and three healthy controls were enrolled in the study. The average age of PE and control was 31.33 ± 4.99 years and 28.67 ± 4.99 years, respectively. The clinical features of subjects are shown in Table 1.
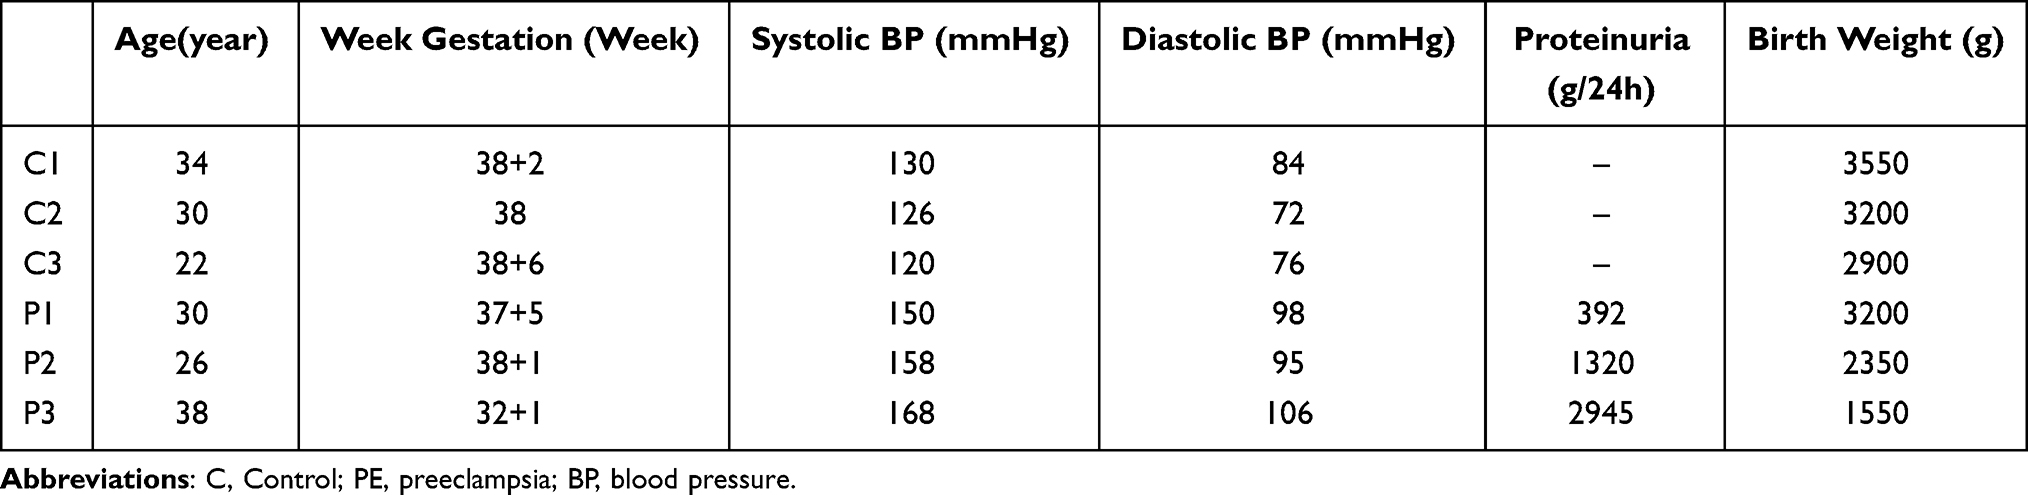 |
Table 1 Clinical Characteristics of PE and Control for Microarray |
Differential Expression Analysis
Based on the given threshold with p < 0.05 and |logFC| > 1), we screened 726 DELs (456 upregulated and 370 downregulated), 49 DEMs (37 upregulated and 12 downregulated), and 318 DEGs (230 upregulated and 88 downregulated) between PE patients and control. The heat map indicated that these DELs (Figure 1A), DEMs (Figure 1B), and DEGs (Figure 1C) distinguished the PE from the control samples. In addition, the top 10 DELs, DEMs, and DEGs are exhibited in Table 2.
 |
Table 2 Top 10 Upregulated and Downregulated Differentially Expressed lncRNAs, miRNAs and mRNAs |
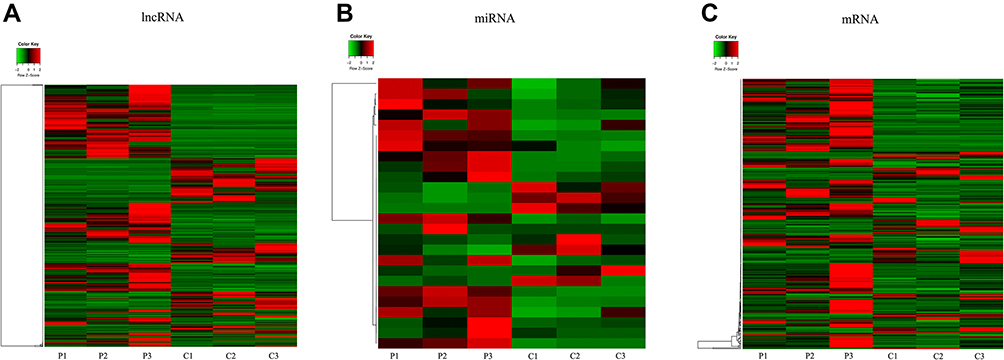 |
Figure 1 The expressions of differentially expressed lncRNAs, miRNAs and mRNAs. Heat maps of (A) lncRNA, (B) miRNA, and (C) mRNA (|log2FC| >1 and p<0.05). Red and green indicate up- and downregulation, respectively. Abbreviations: P, preeclampsia; C, control. |
Functional Enrichment Analysis
To better understand the major biological function of DEGs and DELs-target genes in PE, we conducted GO enrichment and KEGG pathway analysis. The enriched GO terms of BP, CC, and MF are exhibited in Figure 2A and Table 3. Our results revealed that DEGs were mainly enriched in leukocyte migration, cytosolic ribosome, and cytokine activity. The KEGG analysis enriched these DEGs in pathways of cytokine-cytokine receptor interaction, and metabolism of xenobiotics by cytochrome P450 (Figure 2B and Table 4).
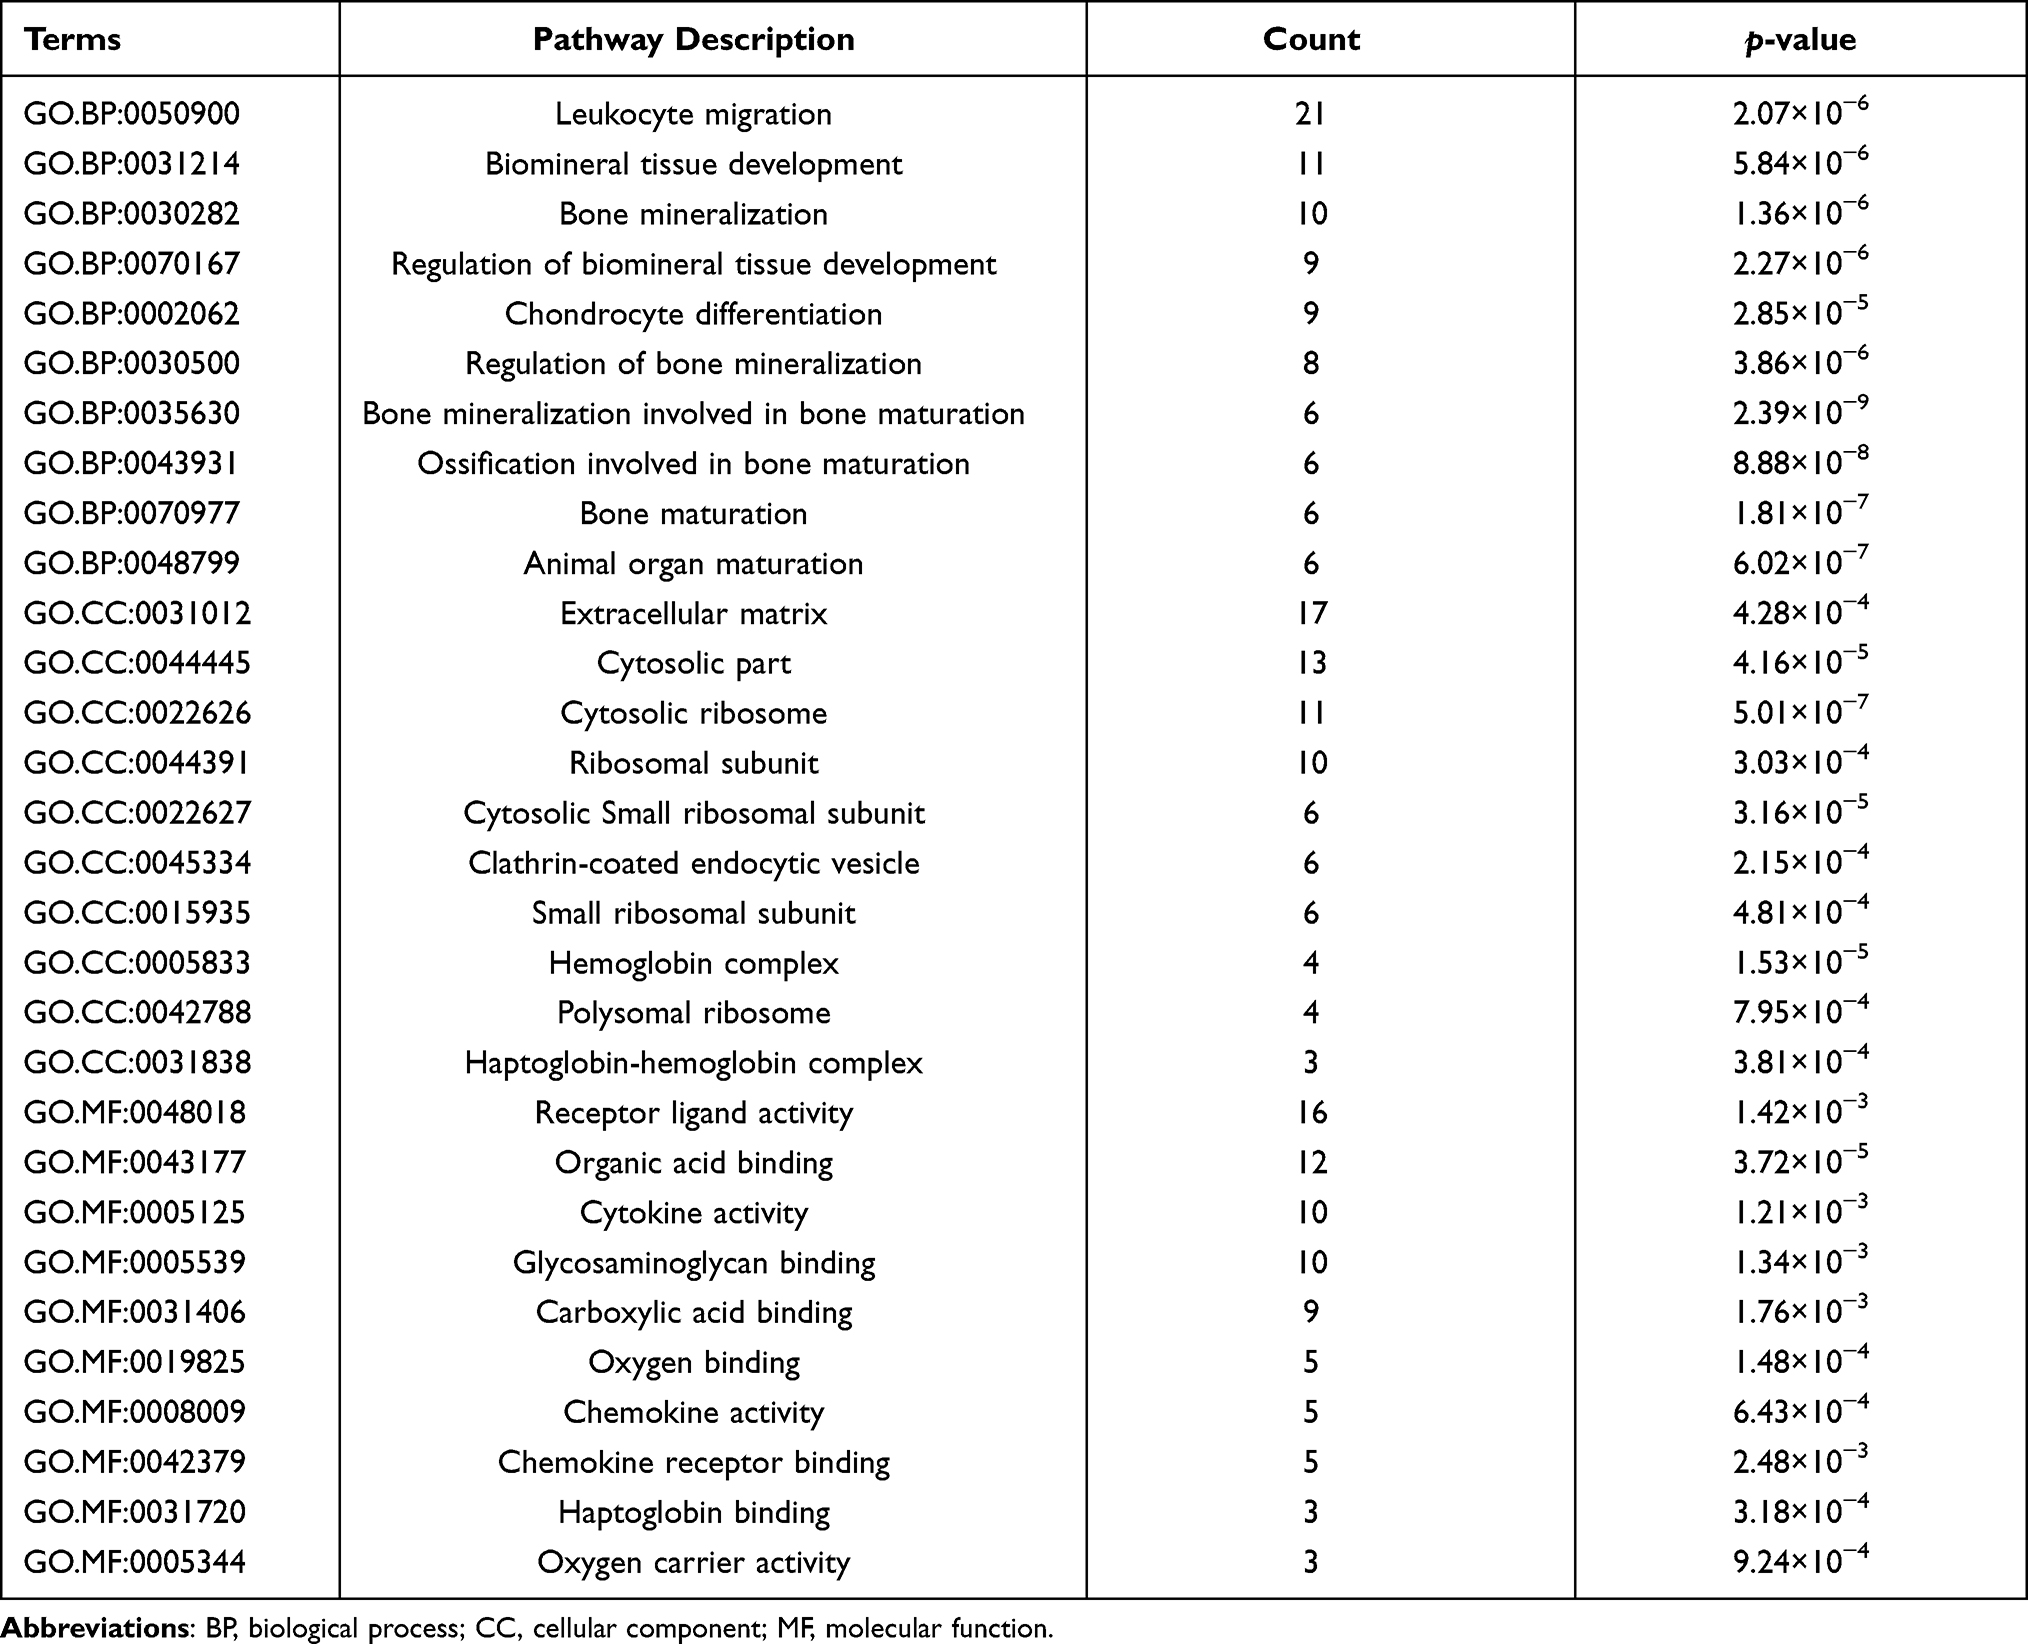 |
Table 3 Top 10 Enriched GO Terms of the DEGs |
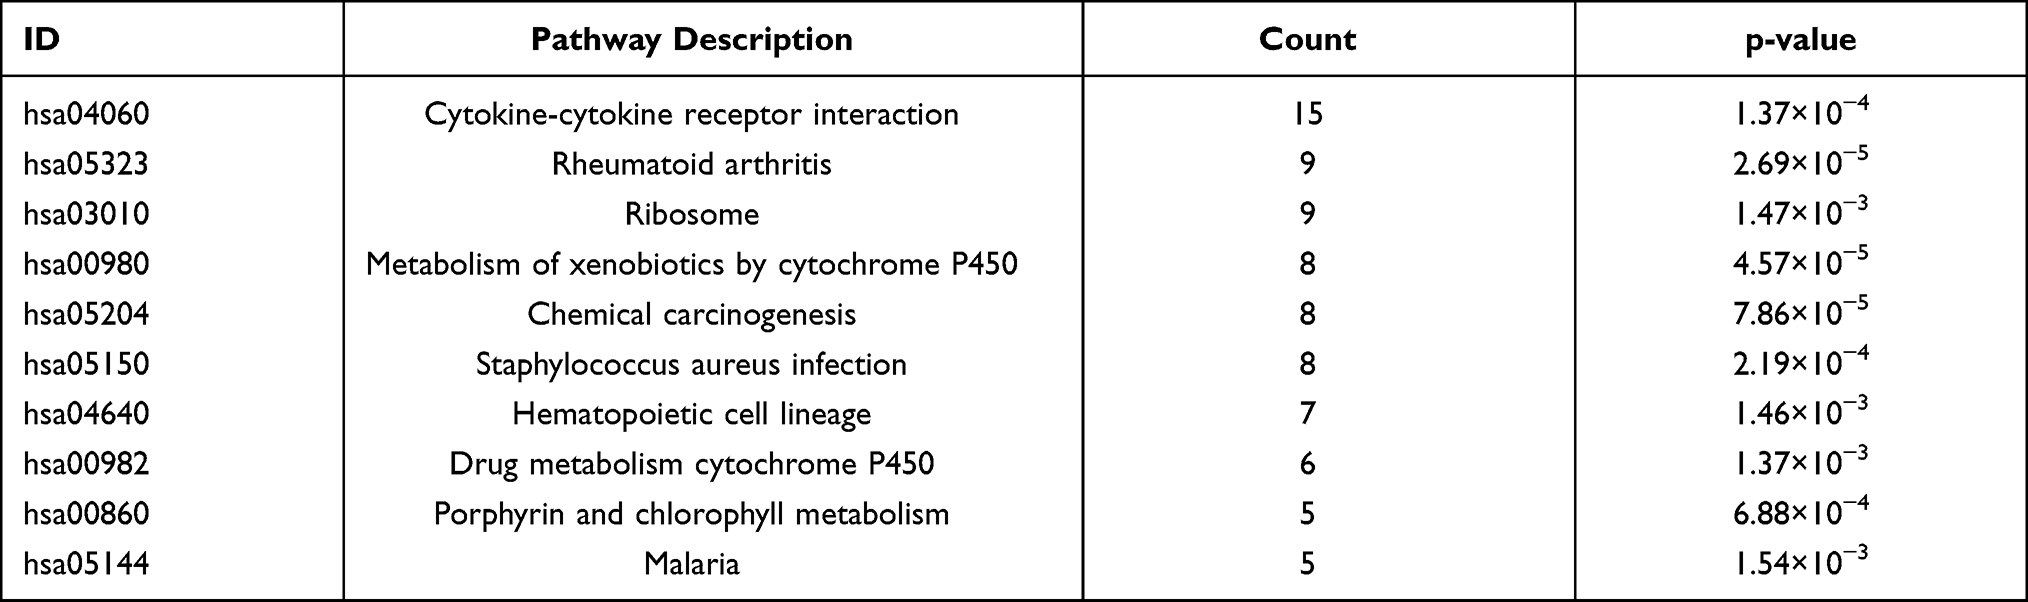 |
Table 4 Top 10 Enriched KEGG Pathways of the DEGs |
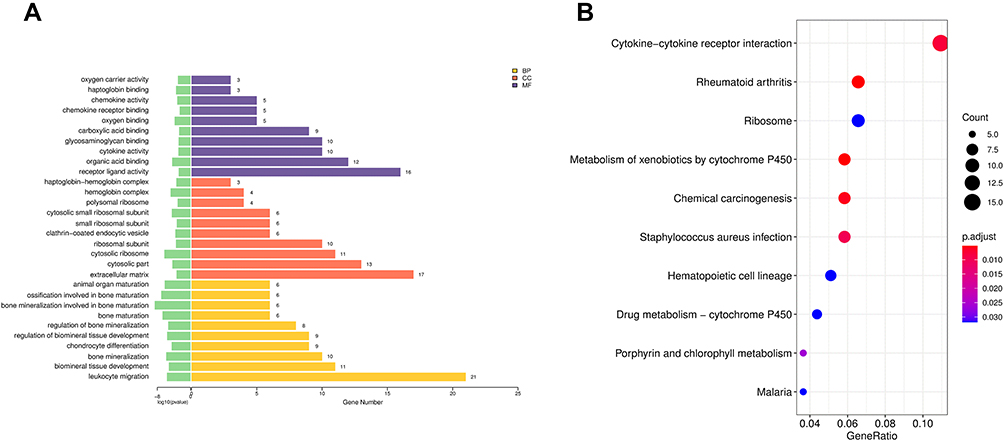 |
Figure 2 GO term and KEGG pathway analyses of DEGs. (A) Top 10 GO terms enrichment of DEGs. (B) Top 10 KEGG pathway enrichment of DEGs. Abbreviations: GO, gene ontology; KEGG, Kyoto Encyclopedia of Genes and Genomes; DEGs, differentially expressed gene. |
Besides, the GO analysis revealed that DELs-target genes were mainly enriched in negative regulation of the cellular catabolic process, cytosolic part, and cofactor binding (Figure 3A, Table 5). The KEGG pathway analysis indicated that DELs-target genes were significantly enriched in RNA transport (Figure 3B, Table 6).
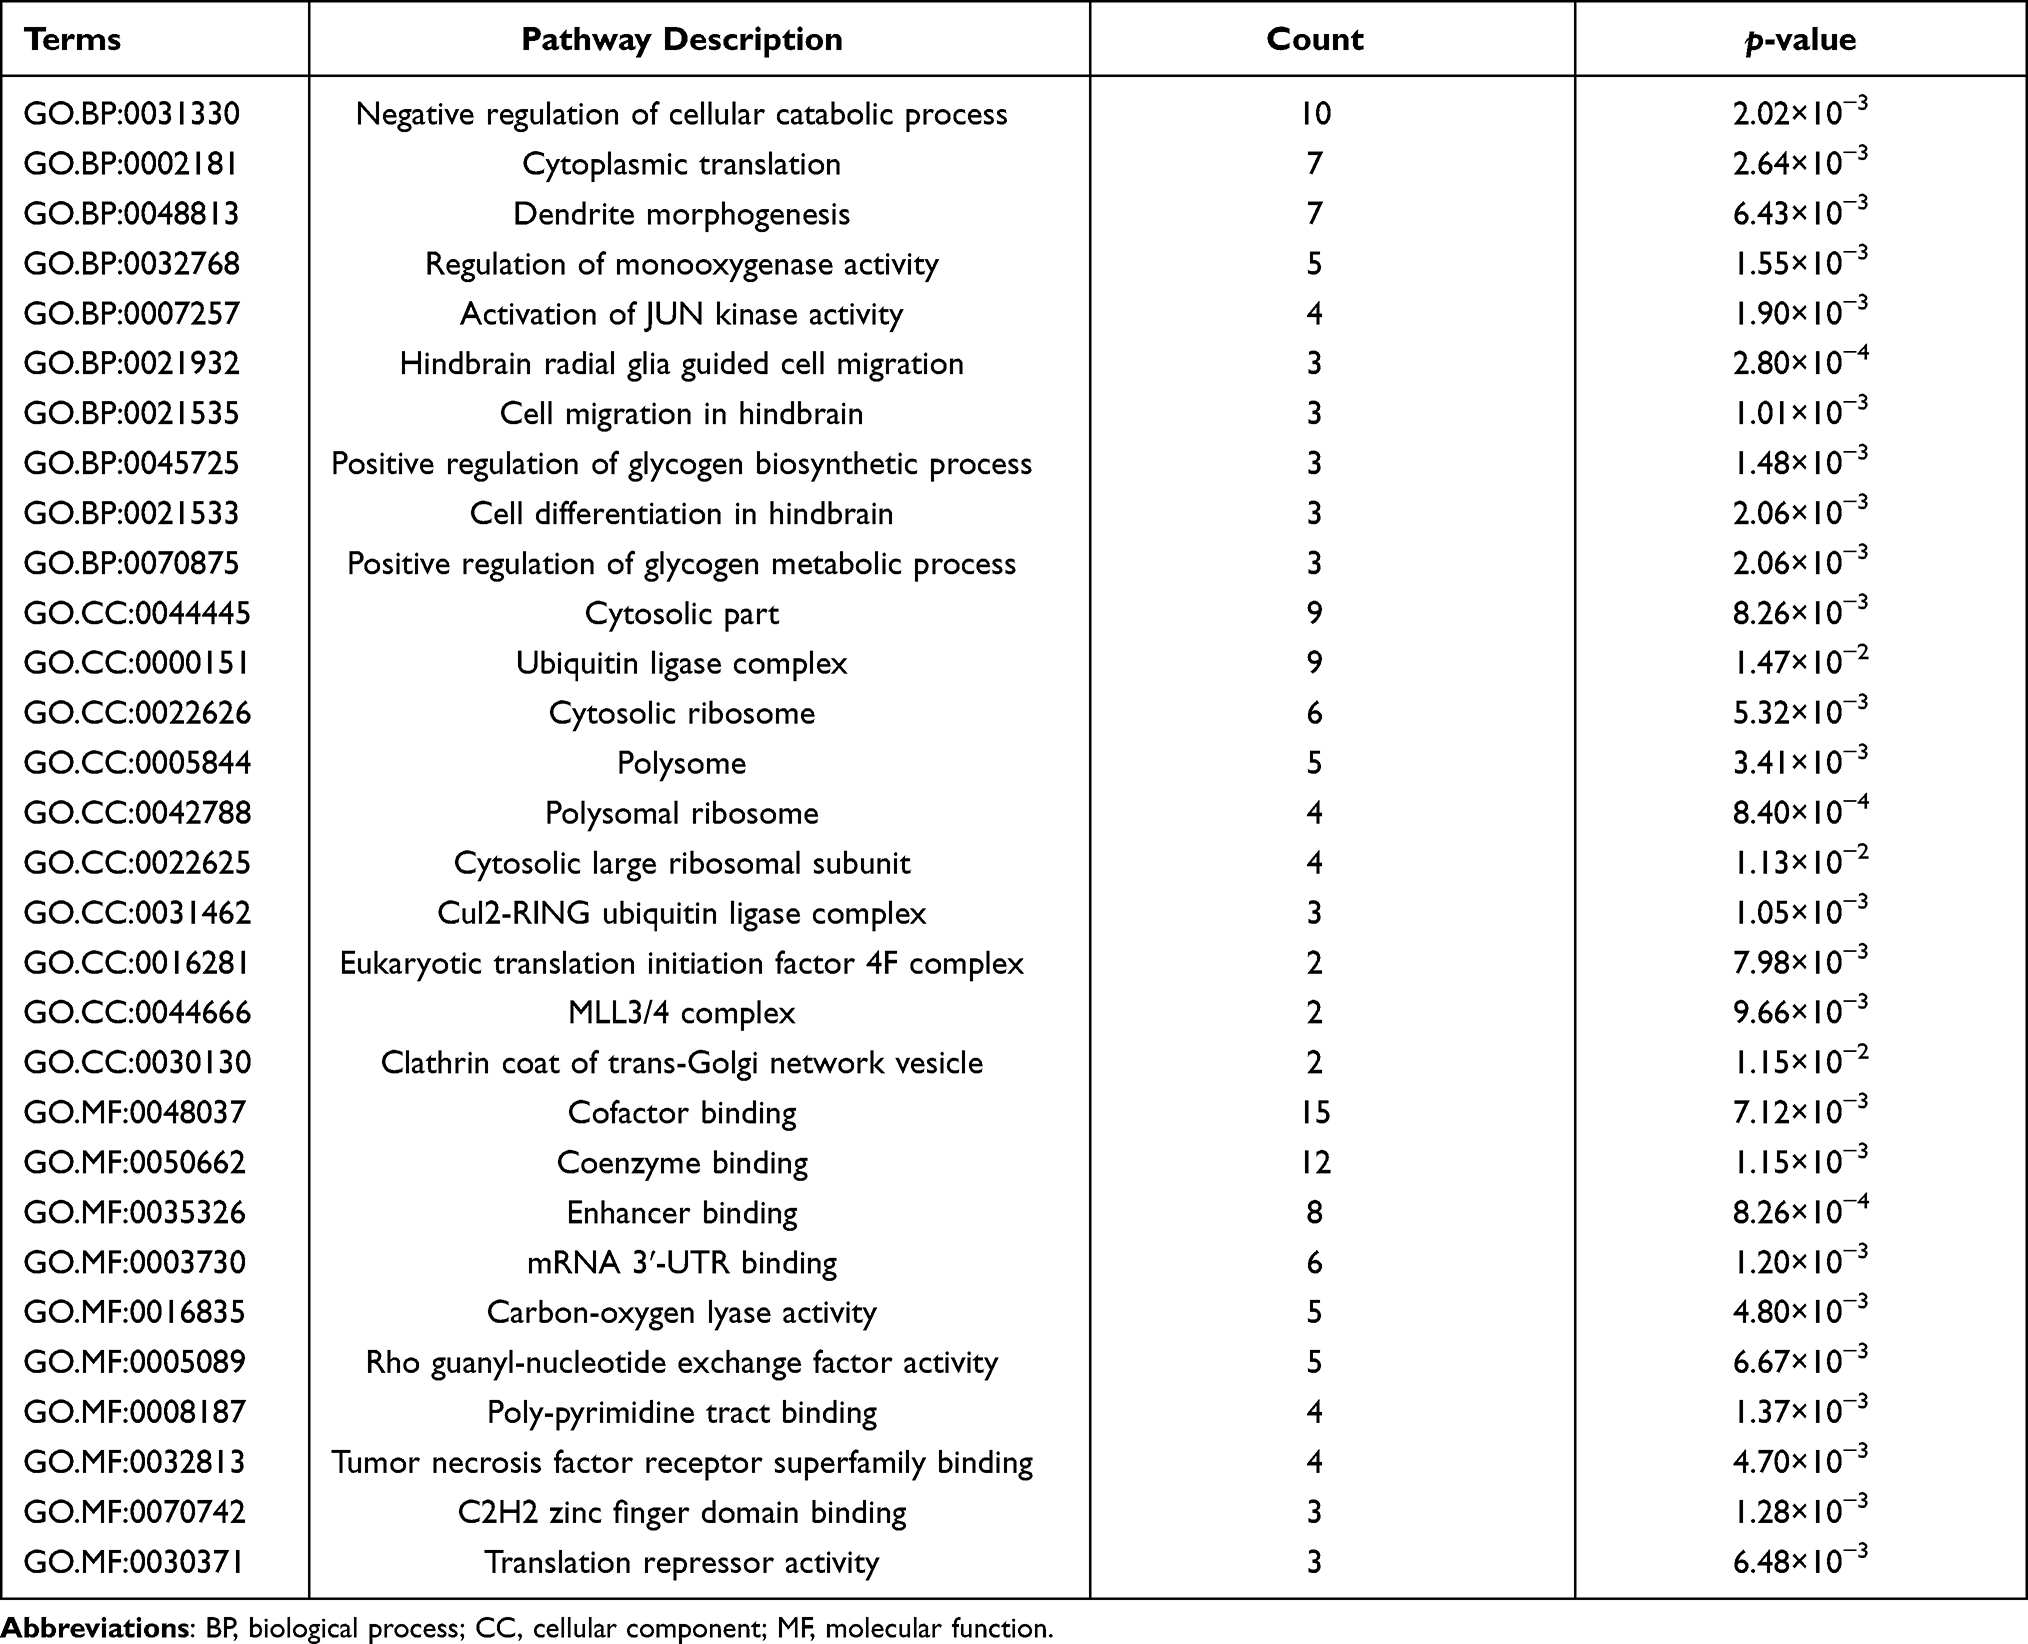 |
Table 5 Top 10 Enriched GO Terms of the DELs-Target Genes |
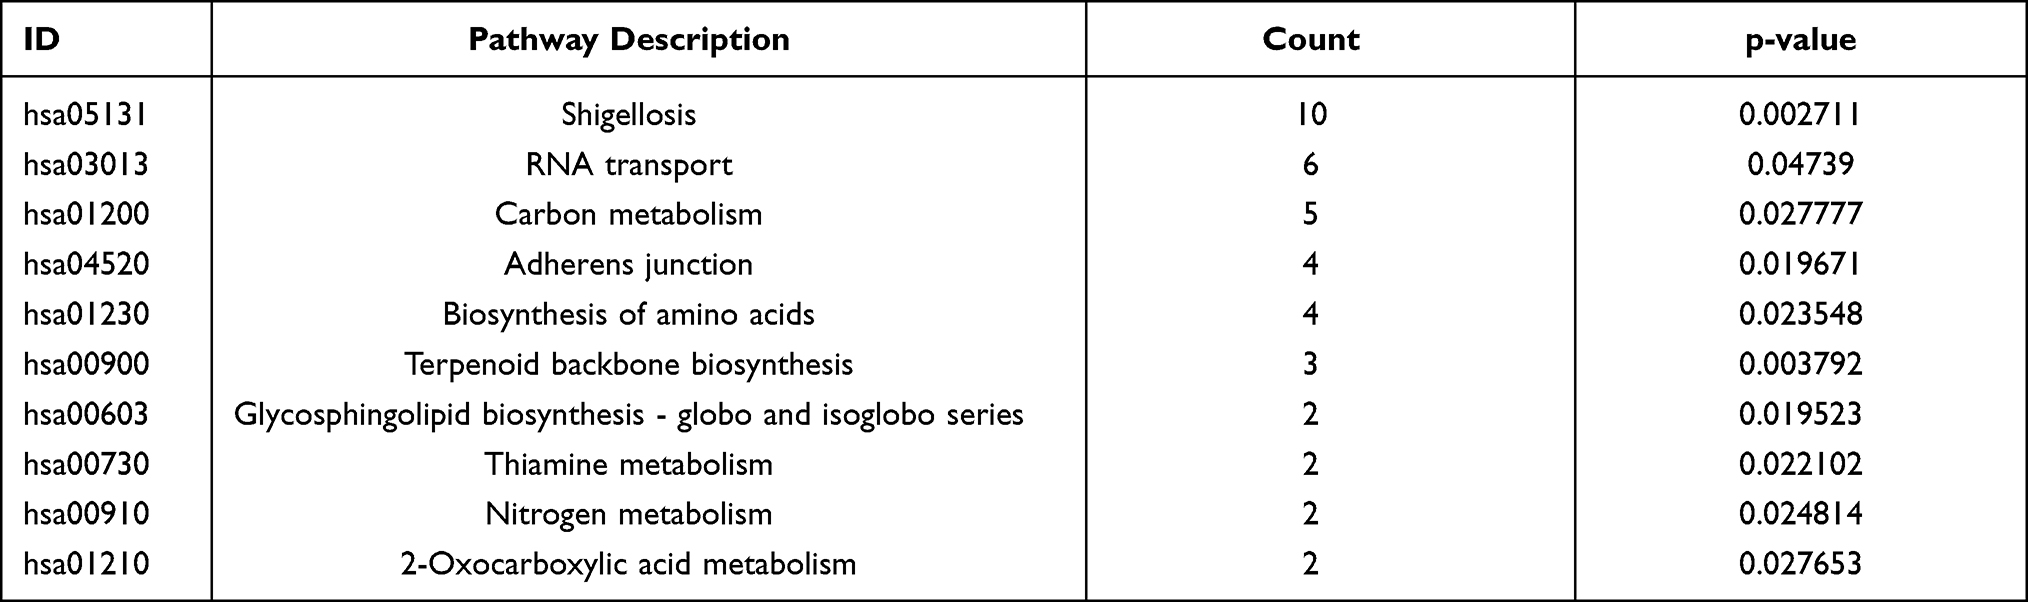 |
Table 6 Top 10 Enriched KEGG Pathways of the DELs-Target Genes |
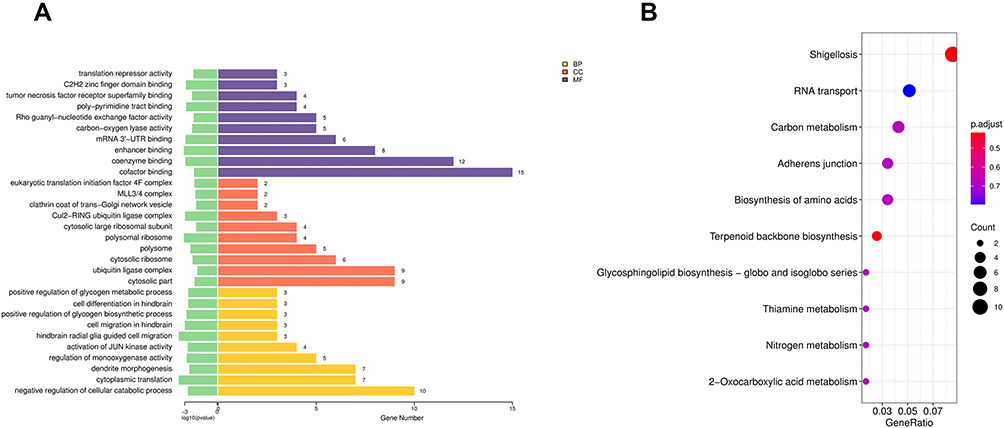 |
Figure 3 GO term and KEGG pathway analyses of DELs-target genes. (A) Top 10 GO terms enrichment of DELs-target genes. (B) Top 10 KEGG pathway enrichment of DELs-target genes. Abbreviations: GO, gene ontology; KEGG, Kyoto Encyclopedia of Genes and Genomes; DELs: differentially expressed lncRNAs. |
Construction of ceRNA Network
A total of 906 lncRNA-miRNA interactions were identified by lncTar software. Combining with DELs and DEMs, 138 lncRNA-miRNA pairs were selected, including 79 DELs, and 15 DEMs (Figure 4A). The 15 DEMs identified in the above step were predicted their target genes using miRanda and RNAhybrid databases. Subsequently, these target genes were integrated with DEGs. Finally, target genes of 1 DEMs (hsa-miR-23a-5p, Figure 4B) were determined.
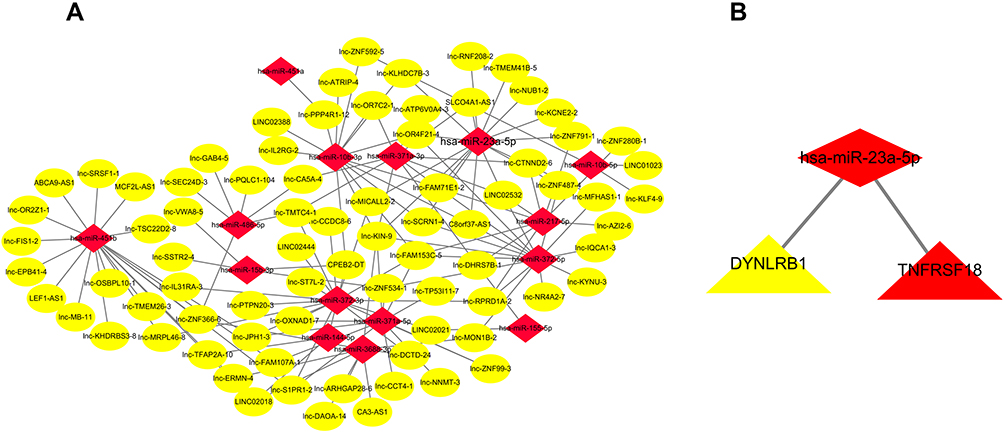 |
Figure 4 lncRNA-miRNA and miRNA-mRNA interaction network. (A) lncRNA-miRNA interaction network. (B) miRNA-mRNA interaction network. In this figure, lncRNA, miRNA, and mRNA were indicated by ellipse, diamond, and triangle, respectively. |
Based on “ceRNA hypothesis”, we established lncRNA-miRNA-mRNA regulatory network. The ceRNA network contains 16 lncRNA (SLCO4A1-AS1, lnc-TMEM41B-5, LINC02532, lnc-ZNF487-4, lnc-ZNF791-1, lnc-MFHAS1-1, lnc-MICALL2-2, lnc-RNF208-2, lnc-FAM71E1-2, lnc-NUB1-2, lnc-KIN-9, C8orf37-AS1, lnc-OR4F21-4, lnc-SCRN1-4, lnc-KLHDC7B-3, lnc-KCNE2-2), 1 miRNA (miR-23a-5p), and 1 mRNA (DYNLRB1). The ceRNA network is presented in Figure 5.
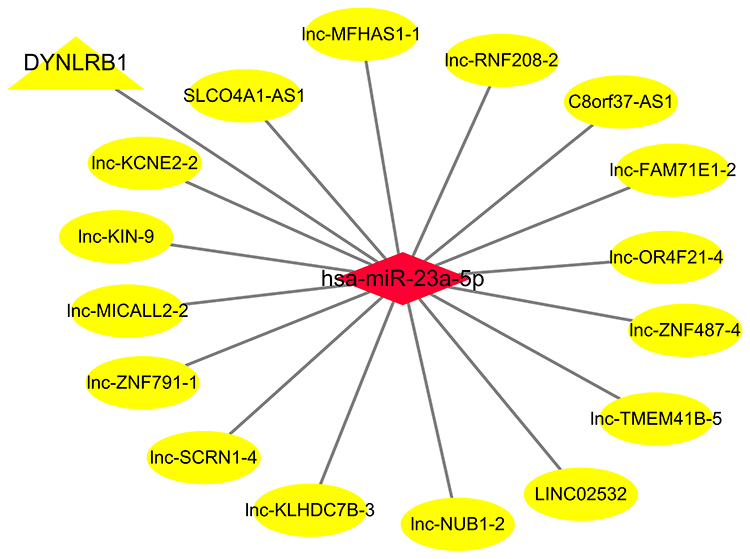 |
Figure 5 Competing endogenous RNA interaction network of lncRNA-miRNA-mRNA. Diamond represents miRNAs, ellipse represents lncRNAs, and triangle represents mRNAs. |
qRT-PCR for the Expression Examination
Based on Figure 5, LINCO2532, SLCO4A1-AS1, miR23a-5p, and DYNLRB1 were selected for expression verification, as shown in Figure 6. We found that lncRNA (LINCO2532 and SLCO4A1-AS1) and DYNLRB1 were downregulated in PE patients compared with healthy controls (p = 0.005, p = 0.013, and p < 0.001, respectively). The expression of miR23a-5p (p < 0.001) was upregulated in PE patients compared with healthy controls.
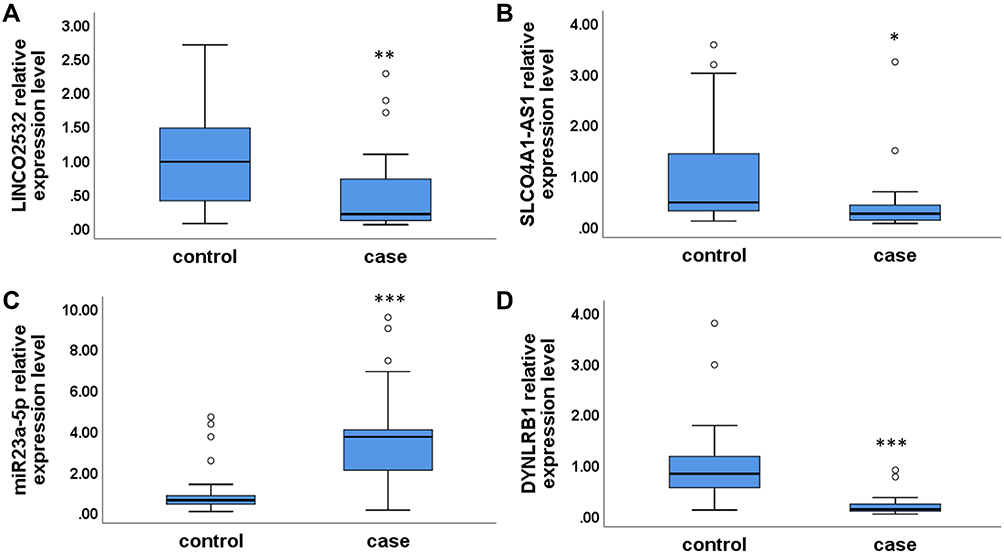 |
Figure 6 The expression of LINCO2532 (A), SLCO4A1-AS1 (B), miR23a-5p (C), and DYNLRB1 (D) in PE patients and healthy controls. Statistical significance of expression level with *for p < 0.05, **for p < 0.01 and ***for p < 0.001. |
Discussion
It is reported that about 3–5% of pregnant women worldwide suffer from PE. Moreover, PE can cause damage to the kidney and liver function of pregnant women and severely can cause the death of pregnant women and fetuses. In recent years, the role of lncRNA and miRNA in the development of PE has received extensive attention.15,16 However, there were few reports on lncRNA-mediated regulatory networks in PE, as well as reports of new transcripts. To identify the new transcripts and biological functions of lncRNA and miRNA in PE, we performed RNA-sequencing of placental samples from PE patients and healthy controls and elucidated the underlying pathogenesis of PE.
In the present study, we identified 726 DELs, 49 DEMs and 318 DEGs based on RNA-sequencing data from placental tissue. To further explore the regulatory role of DELs in PE, the interaction network of lncRNA, miRNA and mRNA was constructed. This network showed that multiple lncRNAs are associated with a single miRNA (miR-23a-5p), and then, it regulates a single mRNA (DYNLRB1). And miR-23a-5p and DYNLRB1 were determined to be involved in various diseases, including renal cell carcinoma, diabetic nephropathy.17,18 These results suggested that miR-23a-5p and DYNLRB1 may play an important role in the process of PE.
The results of qRT-PCR displayed that lncRNA (LINCO2532 and SLCO4A1-AS1) and DYNLRB1 were downregulated and the expression of miR23a-5p was upregulated in PE patients compared with healthy controls. Next, the role of miR-23a-5p and DYNLRB1 in PE need to be further investigated in vivo and in vitro.
ceRNA regulatory network suggests that RNA with miRNA response element (MRE) can competitively bind miRNAs and achieve mutual regulation. Recently, the role of ceRNA regulatory network in various diseases has been widely studied. The study of Zhou et al indicated that an intrahepatic cholangiocarcinoma ceRNA network was built with 30 miRNAs, 16 lncRNAs, and 80 genes, which lncRNA ARHGEF26-AS1 and MIAT were hub genes.19 Sun et al identified 3 lncRNAs, 15 miRNAs, and 138 mRNAs via constructing lncRNA-miRNA-mRNA network as potential markers in the pathogenesis of inflammatory bowel disease.20 Leng et al established a ceRNA network to reveal the role of lncRNA HCG27 in gestational diabetes mellitus.21 At present, some studies have reported the role of ceRNA regulatory network in PE. For example, Liu et al established a ceRNA network related to PE, showing that LINC01492, hsa_circ_0088196 and LIF promote PE development through suppressing miR-100-5p.22 Besides, Zhang et al also built a ceRNA regulatory network consisting of 3 genes, 21 lncRNAs and 69 miRNAs in early-onset preeclampsia.23 Moreover, Hu and his colleagues revealed the global ceRNA network in PE and has_circ_0036877 may serve as a potential novel blood biomarker for early PE.24 However, the etiology and pathogenesis of PE are unclear. To further elucidate the pathogenesis of PE, a new regulatory network of ceRNA was constructed based on transcriptome sequencing data from placenta samples.
In this study, one hub mRNA (dynein light chain roadblock-type 1, DYNLRB1) in the ceRNA network was identified. DYNLRB1 is a member of the roadblock dynein light chain family and is expressed in the placenta.25 It interacts with transforming growth factors and plays a pivotal role in TGF-β signaling transduction.26 Moreover, increasing evidence has highlighted the importance of TGF-β signaling in PE, placenta, and umbilical cord development.27–29 These results suggested that DYNLRB1 may act in PE through TGF-β signaling.
Moreover, we found DYNLRB1 was targeted by miR-23a-5p in the ceRNA network. miR-23a-5p has been reported to be involved in cell apoptosis and growth.30,31 It is reported that miR-23a was increased in the plasma of pregnant women affected by diabetes mellitus.32 Moreover, Li et al uncovered that miR-23a was upregulated in placental samples of PE patients and it promoted trophoblast apoptosis by inhibiting XIAP, ultimately facilitated the development of PE.33 Besides, some researchers reported that the expression of miR-23a-3p showed an upward tendency in women experiencing recurrent miscarriage, preterm birth, and cervical shortening.34,35
The above molecules and their predicted interactions might unveil the mechanisms of PE and provide novel biomarkers for the identification of PE. Despite these interesting results, there are some limitations in this study. One is that the sample size is small. An additional validation cohort should be included in further studies to analyze the expression of these identified lncRNAs, miRNAs and mRNA. Second, this is a preliminary screening study and further experiments are needed to confirm the interactions in the identified ceRNA axes in PE.
Conclusions
In conclusion, a novel lncRNA-associated ceRNA network was constructed in PE patients. It elucidated the regulatory mechanism of PE, and identified novel PE biomarkers, which have important guiding significance for clinical treatment and further scientific research of PE.
Data Sharing Statement
The datasets used and/or analyzed in the current study are available from the corresponding authors on reasonable request.
Acknowledgments
The authors sincerely thank all participators in this study.
Author Contributions
YH, HG carried out the study design. Shu Luo, YH and HG wrote and revised the manuscript. Shu Luo, LW, and Shuming Li carried out data acquisition and functional analysis. HW, SH performed pathway enrichment analysis. ZZ and RW were involved in data analysis. All authors made substantial contributions to conception and design, acquisition of data, or analysis and interpretation of data; took part in drafting the article or revising it critically for important intellectual content; agreed to submit to the current journal; gave final approval of the version to be published; and agree to be accountable for all aspects of the work.
Funding
This work was supported by Major Science and Technology Program of Hainan Province (No. ZDKJ2017007).
Disclosure
The authors declare that there is no conflict of interest that could be perceived as prejudicial to the impartiality of the reported research.
References
1. Mol BWJ, Roberts CT, Thangaratinam S, et al. Pre-eclampsia. Lancet. 2016;387(10022):999–1011. doi:10.1016/S0140-6736(15)00070-7
2. Phipps EA, Thadhani R, Benzing T, Karumanchi SA. Pre-eclampsia: pathogenesis, novel diagnostics and therapies. Nat Rev Nephrol. 2019;15(5):275–289. doi:10.1038/s41581-019-0119-6
3. Malik A, Jee B, Gupta SK. Preeclampsia: disease biology and burden, its management strategies with reference to India. Pregnancy Hypertens. 2019;15:23–31. doi:10.1016/j.preghy.2018.10.011
4. Gao Y, Guo X, Li Y, Sha W, She R. The decreased lncRNA ZEB2-AS1 in pre-eclampsia controls the trophoblastic cell line HTR-8/SVneo’s invasive and migratory abilities via the miR-149/PGF axis. J Cell Biochem. 2019;120(10):17677–17686. doi:10.1002/jcb.29034
5. Tay Y, Rinn J, Pandolfi PP. The multilayered complexity of ceRNA crosstalk and competition. Nature. 2014;505(7483):344–352. doi:10.1038/nature12986
6. Xu Y, Ge Z, Zhang E, et al. The lncRNA TUG1 modulates proliferation in trophoblast cells via epigenetic suppression of RND3. Cell Death Dis. 2017;8(10):e3104. doi:10.1038/cddis.2017.503
7. Li JL, Li R, Gao Y, et al. LncRNA CCAT1 promotes the progression of preeclampsia by regulating CDK4. Eur Rev Med Pharmacol Sci. 2018;22(5):1216–1223.
8. Xu J, Xia Y, Zhang H, et al. Overexpression of long non-coding RNA H19 promotes invasion and autophagy via the PI3K/AKT/mTOR pathways in trophoblast cells. Biomed Pharmacother. 2018;101:691–697. doi:10.1016/j.biopha.2018.02.134
9. Qian S, Liu R. miR-30b facilitates preeclampsia through targeting MXRA5 to inhibit the viability, invasion and apoptosis of placental trophoblast cells. Int J Clin Exp Pathol. 2019;12(11):4057–4065.
10. Zou AX, Chen B, Li QX, Liang YC. MiR-134 inhibits infiltration of trophoblast cells in placenta of patients with preeclampsia by decreasing ITGB1 expression. Eur Rev Med Pharmacol Sci. 2018;22(8):2199–2206.
11. Hemmatzadeh M, Shomali N, Yousefzadeh Y, et al. MicroRNAs: small molecules with a large impact on pre-eclampsia. J Cell Physiol. 2020;235(4):3235–3248. doi:10.1002/jcp.29286
12. Wang CY, Tsai PY, Chen TY, et al. Elevated miR-200a and miR-141 inhibit endocrine gland-derived vascular endothelial growth factor expression and ciliogenesis in preeclampsia. J Physiol. 2019;597(12):3069–3083. doi:10.1113/JP277704
13. Xiao J, Tao T, Yin Y, et al. miR-144 may regulate the proliferation, migration and invasion of trophoblastic cells through targeting PTEN in preeclampsia. Biomed Pharmacother. 2017;94:341–353. doi:10.1016/j.biopha.2017.07.130
14. American College of Obstetricians and Gynecologists. Hypertension in pregnancy. Report of the American College of Obstetricians and Gynecologists’ Task Force on Hypertension in Pregnancy. Obstet Gynecol. 2013;122(5):1122–1131.
15. Wang Q, Lu X, Li C, et al. Down-regulated long non-coding RNA PVT1 contributes to gestational diabetes mellitus and preeclampsia via regulation of human trophoblast cells. Biomed Pharmacother. 2019;120:109501. doi:10.1016/j.biopha.2019.109501
16. Zhang Y, He XY, Qin S, et al. Upregulation of PUM1 Expression in Preeclampsia Impairs Trophoblast Invasion by Negatively Regulating the Expression of the lncRNA HOTAIR. Mol Therapy. 2020;28(2):631–641. doi:10.1016/j.ymthe.2019.11.025
17. Wang Y, Xiao S, Zhou S, et al. High Glucose Aggravates Cholesterol Accumulation in Glomerular Endothelial Cells Through the LXRs/LncRNAOR13C9/ABCA1 Regulatory Network. Front Physiol. 2020;11:552483. doi:10.3389/fphys.2020.552483
18. Quan J, Jin L, Pan X, et al. Oncogenic miR-23a-5p is associated with cellular function in RCC. Mol Med Rep. 2017;16(2):2309–2317. doi:10.3892/mmr.2017.6829
19. Zhou D, Gao B, Yang Q, Kong Y, Wang W. Integrative Analysis of ceRNA Network Reveals Functional lncRNAs in Intrahepatic Cholangiocarcinoma. Biomed Res Int. 2019;2019:2601271. doi:10.1155/2019/2601271
20. Sun F, Liang W, Tang K, Hong M, Qian J. Profiling the lncRNA-miRNA-mRNA ceRNA network to reveal potential crosstalk between inflammatory bowel disease and colorectal cancer. PeerJ. 2019;7:e7451. doi:10.7717/peerj.7451
21. Leng L, Zhang C, Ren L, Li Q. Construction of a long non‑coding RNA-mediated competitive endogenous RNA network reveals global patterns and regulatory markers in gestational diabetes. Int J Mol Med. 2019;43(2):927–935.
22. Liu S, Xie X, Lei H, Zou B, Xie L. Identification of Key circRNAs/lncRNAs/miRNAs/mRNAs and Pathways in Preeclampsia Using Bioinformatics Analysis. Med Sci Monitor. 2019;25:1679–1693. doi:10.12659/MSM.912801
23. Zhang Z, Wang P, Zhang L, et al. Identification of Key Genes and Long Noncoding RNA-Associated Competing Endogenous RNA (ceRNA) Networks in Early-Onset Preeclampsia. Biomed Res Int. 2020;2020:1673486.
24. Hu X, Ao J, Li X, et al. Competing endogenous RNA expression profiling in pre-eclampsia identifies hsa_circ_0036877 as a potential novel blood biomarker for early pre-eclampsia. Clin Epigenetics. 2018;10:48. doi:10.1186/s13148-018-0482-3
25. Fagerberg L, Hallström BM, Oksvold P, et al. Analysis of the human tissue-specific expression by genome-wide integration of transcriptomics and antibody-based proteomics. Mol Cell Proteomics. 2014;13(2):397–406. doi:10.1074/mcp.M113.035600
26. Jin Q, Pulipati NR, Zhou W, et al. Role of km23-1 in RhoA/actin-based cell migration. Biochem Biophys Res Commun. 2012;428(3):333–338. doi:10.1016/j.bbrc.2012.10.047
27. Wu K, Liu F, Wu W, Chen Y, Zhang W. Bioinformatics approach reveals the critical role of TGF-β signaling pathway in pre-eclampsia development. Eur J Obstet Gynecol Reprod Biol. 2019;240:130–138. doi:10.1016/j.ejogrb.2019.06.034
28. Williamson RD, O’Keeffe GW, Kenny LC. Activin signalling and pre-eclampsia: from genetic risk to pre-symptomatic biomarker. Cytokine. 2015;71(2):360–365. doi:10.1016/j.cyto.2014.11.017
29. Xu YT, Shen MH, Jin AY, Li H, Zhu R. Maternal circulating levels of transforming growth factor-β superfamily and its soluble receptors in hypertensive disorders of pregnancy. Int J Gynaecol Obstet. 2017;137(3):246–252. doi:10.1002/ijgo.12142
30. Huang J, Jiang R, Chu X, et al. Overexpression of microRNA −23a-5p induces myocardial infarction by promoting cardiomyocyte apoptosis through inhibited of PI3K/ AKT signalling pathway. Cell Biochem Funct. 2020;38(8):1047–1055. doi:10.1002/cbf.3536
31. Li Y, Quan J, Pan X, et al. Suppressing cell growth and inducing apoptosis by inhibiting miR‑23a‑5p in human bladder cancer. Mol Med Rep. 2018;18(6):5256–5260.
32. Yoffe L, Polsky A, Gilam A, et al. Early diagnosis of gestational diabetes mellitus using circulating microRNAs. Eur j Endocrinol. 2019;181(5):565–577. doi:10.1530/EJE-19-0206
33. Li L, Hou A, Gao X, et al. Lentivirus-mediated miR-23a overexpression induces trophoblast cell apoptosis through inhibiting X-linked inhibitor of apoptosis. Biomed Pharmacother. 2017;94:412–417. doi:10.1016/j.biopha.2017.07.082
34. Yang Q, Gu WW, Gu Y, et al. Association of the peripheral blood levels of circulating microRNAs with both recurrent miscarriage and the outcomes of embryo transfer in an in vitro fertilization process. J Transl Med. 2018;16(1):186. doi:10.1186/s12967-018-1556-x
35. Cook J, Bennett PR, Kim SH, et al. First Trimester Circulating MicroRNA Biomarkers Predictive of Subsequent Preterm Delivery and Cervical Shortening. Sci Rep. 2019;9(1):5861. doi:10.1038/s41598-019-42166-1
 © 2021 The Author(s). This work is published and licensed by Dove Medical Press Limited. The full terms of this license are available at https://www.dovepress.com/terms.php and incorporate the Creative Commons Attribution - Non Commercial (unported, v3.0) License.
By accessing the work you hereby accept the Terms. Non-commercial uses of the work are permitted without any further permission from Dove Medical Press Limited, provided the work is properly attributed. For permission for commercial use of this work, please see paragraphs 4.2 and 5 of our Terms.
© 2021 The Author(s). This work is published and licensed by Dove Medical Press Limited. The full terms of this license are available at https://www.dovepress.com/terms.php and incorporate the Creative Commons Attribution - Non Commercial (unported, v3.0) License.
By accessing the work you hereby accept the Terms. Non-commercial uses of the work are permitted without any further permission from Dove Medical Press Limited, provided the work is properly attributed. For permission for commercial use of this work, please see paragraphs 4.2 and 5 of our Terms.