")
Back to Journals » International Journal of General Medicine » Volume 16
Identification of Hypoxia-Associated Signature in Colon Cancer to Assess Tumor Immune Microenvironment and Predict Prognosis Based on 14 Hypoxia-Associated Genes
Authors Chen P , Li Z, Liang Y, Wei M, Jiang H, Chen S, Zhao Z
Received 2 February 2023
Accepted for publication 30 May 2023
Published 16 June 2023 Volume 2023:16 Pages 2503—2518
DOI https://doi.org/10.2147/IJGM.S407005
Checked for plagiarism Yes
Review by Single anonymous peer review
Peer reviewer comments 3
Editor who approved publication: Dr Scott Fraser
Peng Chen,1 Zhongxin Li,2 Yulong Liang,1 Ming Wei,2 Haibo Jiang,2 Shihao Chen,2 Zengren Zhao2
1Department of General Surgery, The Third Hospital of Hebei Medical University, Shijiazhuang, Hebei, 050000, People’s Republic of China; 2Department of General Surgery, The First Affiliated Hospital of Hebei Medical University, Shijiazhuang, Hebei, 050000, People’s Republic of China
Correspondence: Zengren Zhao, Department of General Surgery, The First Affiliated Hospital of Hebei Medical University, No. 89 Donggang Road, Shijiazhuang, Hebei, 050000, People’s Republic of China, Email [email protected]
Purpose: Colon cancer is the main malignant tumor of the digestive tract. Hypoxia is highly related to the occurrence, progression and tumor immune microenvironment (TIME) of cancer. The aim of this study was to identify a hypoxia-associated signature with high accuracy for predicting the prognosis and TIME of colon cancer.
Methods: Download colon cancer data from the GEO and TCGA databases. A novel hypoxia risk model was identified to predict the prognosis of colon cancer patients. Subsequently, GSEA, TIME and mutation analysis were performed in the hypoxia high and low risk score groups. Finally, the signature gene ANKZF1 was selected for functional verification at the cellular level.
Results: A novel hypoxia risk model was identified. The risk score was significantly associated with poorer overall survival in colon cancer, and could be used as an independent prognostic factor for colon cancer. GSEA analysis found that the processes related to stimulate tumor proliferation and anti-apoptosis were significantly enriched in the hypoxia high risk score group. The expression of immunosuppressive cells and most immune checkpoints in the high risk score group was significantly higher than that in the low risk score group. In vitro cell experiments showed that knockdown the expression of ANKZF1 could inhibit the proliferation, migration and invasion of colon cancer cells.
Conclusion: Hypoxia plays an important role in evaluating the TIME and predicting the prognosis of colon cancer.
Keywords: colon cancer, hypoxia, prognosis, risk score, tumor immune microenvironment
Introduction
Colon cancer is the main malignant tumor of the digestive tract and one of the most malignant tumors in the world, with a high incidence.1 Colon cancer has a high recurrence rate and mortality.2,3 Although surgery, chemotherapy, radiotherapy and immunotherapy for colon cancer have improved, survival rates remain low.4,5 Therefore, it is necessary to identify reliable prognostic models to predict clinical outcomes.
Hypoxia is a typical feature observed in the tumor immune microenvironment (TIME). It is caused by insufficient oxygen supply.6 It has previously been reported that many transcription factors in tumor cells are activated under hypoxic conditions, thereby inducing downstream signals to regulate tumor angiogenesis and cell proliferation.7 There are more and more studies on the TIME, in which immune cells play a vital role in the development of tumors.8–10 Interestingly, increasing evidence suggests an association between tumor hypoxia characteristics and tumor immunosuppression and immune escape. Receptors affected by hypoxia play an important role in the recognition and lysis of a range of NK cell targets. Therefore, under hypoxia conditions, NK cells reduce their ability to kill.11 Hypoxia can promote immunosuppressive cells or immunosuppressive cytokines, which in turn block immune effector cells.12 Colitis-associated colon cancer is induced in wild-type mice, and the hypoxia and T cell immunity in colon cancer tissues were analyzed. It was found that hypoxia enhances immune suppression by inhibiting CD4+ effector T cell and promoting regulatory T cells activity.13 Tumor hypoxia is an important obstacle to effective tumor treatment. Therefore, studying the relationship between tumor hypoxia and immunity is helpful to the effect of immunotherapy.
Currently, methods of research tumor hypoxia are still very limited. However, the existence of public databases of gene data and clinical data makes it possible to identify the relationship between hypoxia and prognosis. In this study, we downloaded data related to colon cancer from the GEO and TCGA databases. Subsequently, hypoxia-associated signature was identified to predict the prognosis and TIME of patients with colon cancer. In addition, hypoxia-associated gene ANKZF1 was selected for in vitro cell experiments to detect the effects on the proliferation, migration and invasion of colon cancer cells.
Materials and Methods
Data Source
We searched gene expression data and complete clinical annotations of colon cancer in the GEO and TCGA databases (Table 1). For the data in TCGA, RNA sequencing data (FPKM value: fragments per kilobase of exon per million reads mapped value) and clinical information were downloaded from UCSC Xena (https://gdc.xenahubs.net). Then, convert the FPKM value into a transcript per kilobase million (TPM) values. For the GSE17536 dataset in GEO, we download the original “CEL” file. The RMA algorithm in “affy” package was used for background adjustment and quantile normalization. The annotation file was used for annotation. If multiple probes correspond to the same gene, take the average value. Then, the gene expression matrix file was obtained. In addition, samples with an overall survival (OS) of less than 30 days were excluded based on clinical information. In this study, the TCGA-colon cancer dataset was used as training set, and the GSE17536 dataset was used as test set. The list of hypoxia-associated genes was obtained from the hallmark gene sets of the Molecular Signatures Database (https://www.gsea-msigdb.org/gsea/index.jsp).14
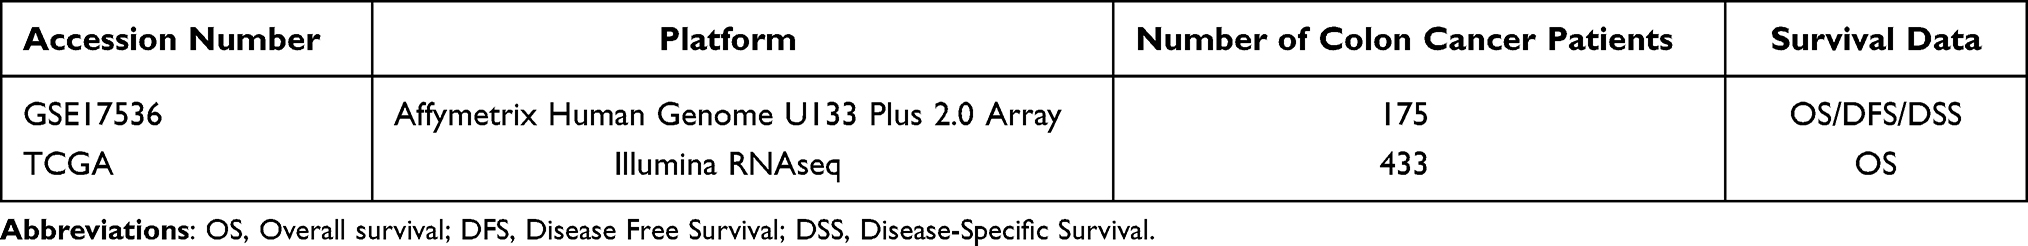 |
Table 1 Basic Information of the Data Set in This Study |
Identification of Hypoxia-Associated Genes Signature
A total of 200 hypoxia-associated genes were in the Molecular Signatures Database. Based on expression data in the TCGA-colon cancer dataset, univariate Cox regression analysis was performed on hypoxia-associated genes to screen out genes associated with prognosis of colon cancer (P <0.05). Subsequently, these genes were screened using the Lasso-cox regression analysis in the glmnet package to reduce the number of genes for the risk score model. In Lasso-cox regression analysis, a lasso penalty was applied, taking into account both shrinkage and variable selection. Through 10-fold cross-validation, the optimal value of the lambda penalty parameter was determined. The purpose of 10-fold cross-validation is to prevent overfitting.15,16 The risk score for colon cancer patients was calculated using the following formula:
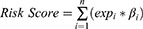
(Note: n, number of prognostic genes; expi: expression value of gene i, βi: regression coefficient of gene i.)
Patients were divided into high and low risk score groups according to the median risk score. The same formula was used to calculate the risk score in the GSE17536 dataset.
Survival Analysis
The OS of the high and low risk groups was compared by Kaplan-Meier analysis using the “survival” and “survminer” packages based on TCGA-colon cancer and GSE17536 datasets. Univariate Cox analysis was used to identify potential prognostic factors based on TCGA-colon cancer dataset. Multivariate Cox analysis was used to determine risk score as an independent risk factor for OS in colon cancer patients based on TCGA-colon cancer dataset. The time-dependent receiver operator characteristic (ROC) curve was generated by the “timeROC” package, which was used to verify the accuracy of the risk model for predicting patient survival based on TCGA-colon cancer and GSE17536 datasets.
Functional Enrichment Analysis
GSEA was performed through Java program (http://software.broadinstitute.org/gsea/index) based on TCGA-colon cancer dataset. The underlying mechanisms were researched in the “Molecular Signatures Database” of c2.cp.kegg.v7.3.symbols.17 False discovery rate (FDR) ≤0.05 were considered statistically significant.
Estimation of TIME Cell Infiltration
We used the ssGSEA algorithm to quantify the relative abundance of TIME cell infiltration in each colon cancer sample in TCGA. From Charoentong’s research, we obtained a set of genes that mark each TIME infiltrating immune cell type.18,19 This gene set stored a variety of human immune cell subtypes, including activated CD8 T cell, macrophage, regulatory T cell and so on. Immune score, stromal score, tumor purity and ESTIMATE score of each patient were calculated using the ESTIMATE algorithm through the “ESTIMATE” software packages in R.
Expression of Cancer Immune Cycle Negative Regulatory Genes
The cancer immune cycle has become the intellectual framework of cancer immunotherapy research. It describes the process of the immune system to eradicate cancer: cancer cell antigen release, cancer cell antigen presentation, initiation and activation, transport of T cells to tumor, infiltration of T cells into tumor, recognition of cancer cells by T cells and killing of cancer cells.20 In order to investigate the expression of genes that negatively regulating these processes in low and high risk score groups, the Tracking Tumor Immunophenotype (http://biocc.hrbmu.edu.cn/TIP/index.jsp) was used to download genes signatures.21
Immune Checkpoint and Somatic Mutation
To clarify the potential relationship between hypoxia in the TIME and clinical immunotherapy, six immune checkpoints were randomly selected to analyze their expression in the high and low risk score groups based on the TCGA-colon cancer and GSE17536 datasets. Six immune checkpoints include PDCD1 (PD1), CD274 (PDL1), PDCD1LG2 (PDL2), CTLA4, CD80 and CD86. In addition, in order to identify the mutation status in the high and low risk score groups, somatic mutation data of colon cancer patients were downloaded from TCGA for somatic mutation analysis.
Cell Experiment
Colon cancer cell HCT116 was selected to knockdown ANKZF1. Subsequently, the expression level of ANKZF1 in the knockdown cells was detected by real time-PCR to screen out the effective interference target. GAPDH was used as the internal reference gene. The relative gene expression level was calculated using the 2−ΔΔCt method. The forward and reverse primer sequences of ANKZF1 were 5’-GCAGAAATCCGGCAATCGAC-3’ and 5’-GCCCTTAGAAGACGCACCAA-3’, respectively. The forward and reverse primer sequences of internal reference gene GAPDH were 5’-CTGGGCTACACTGAGCACC-3’ and 5’-AAGTGGTCGTTGAGGGCAATG-3’, respectively. Subsequently, the cells were divided into normal control (NC, normoxia), Si-ANKZF1 (normoxia), NC+1% O2 (hypoxia) and Si-ANKZF1+1% O2 (hypoxia) groups. Cell counting kit-8 (CCK-8) kit was used to detect the cell activity of each group at 0 h, 24 h and 48 h. The absorbance was measured at 450 nm using a microplate reader. In addition, flat panel clone proliferation experiments were also performed and the results were photographed using camera photography. The number of cell clones formed was statistically analyzed using Image J. Subsequently, the cell migration and invasion of each group were detected by cell wound scratch assay and transwell assay. Matrix metallopeptidase 2 (MMP2) and matrix metallopeptidase 9 (MMP9) play key roles in cancer immune escape and may also play a role in colon cancer progression.22 Low expression of epithelial cadherin (E-cadherin) affects the progression of colon cancer and is associated with poor prognosis.23 Reducing the expression of neural cadherin (N-cadherin) may be involved in the regulation of colon cancer progression.24 Hypoxia-inducible factor-alpha (HIF-α) is a transcription factor that regulates hypoxia response and plays an important regulatory role in colon cancer.25 Western blot was used to detect the protein expression levels of MMP2, MMP9, N-Cadherin, E-Cadherin and HIF-α in each group.
Expression of CA-IX and PD-L1
Electronic expression analysis of CA-IX and PD-L1 was performed in the TCGA (colon cancer tissue samples:paracancer tissue samples=433:41) and GSE110224 (colon cancer tissue samples:paracancer tissue samples =17:17) datasets. The Wilcoxon test was used for statistical significance analysis. Subsequently, immunofluorescence was also performed in colon cancer tissue samples and paracancer tissue samples. Paraffin sections of tissue samples were routinely dewaxed, repaired, and washed twice times (5 min/time) with phosphate-buffered saline (PBS). Then, the blocking serum was added dropwise, and the blocking solution was wiped off with filter paper after 60 minutes at 37°C in a wet box. After adding the primary antibodies (CA-IX: Proteintech, 66243-1; PD-L1: Proteintech, 66248-1), the slides were incubated overnight at 4°C, and washed with PBS five times (3 min/time). The secondary antibody (goat anti-rabbit IgG (H&L):MDL, MD912526) was added dropwise and the sections were incubation at room temperature for 60 min, and washed with PBS three times (5 min/time). Wipe off the PBS outside the specimen with filter paper, and then add 4’,6-diamidino-2-phenylindole (DAPI) dropwise and incubate for 10 minutes in the dark. Finally, the slides were sealed with glycerol and immediately observed under fluorescence microscope. Blue coloring was defined as positive expression.
Statistical Analysis
All statistics were performed using R software (version 3.6.3, https://www.R-project.org). Wilcox.test was used to screen for statistically differentially expressed genes and infiltrating immune cells. When plotting Kaplan-Meier curves, log-rank was used to test the significant difference in OS between groups. In addition, univariate and multivariate Cox regression analyses were performed. P <0.05 was considered statistically significant.
Results
Identification of Hypoxia-Associated Genes Signature Prognostic Model
We performed univariate Cox regression analysis on 200 hypoxia-associated genes, and then screened out 19 genes that were significantly related to the prognosis of colon cancer (Figure 1A). Subsequently, Pearson correlation analysis was performed for these genes (Figure 1B). In addition, in order to more fully understand and demonstrate the associations between these hypoxia-associated genes and their relationship to OS, interaction network was mapped using Cytoscape (Figure 1C). Then, Lasso-cox regression analysis was performed on these 19 genes (Figure 1D and E). Ultimately, 14 hypoxia-associated genes (ALDOB, ANGPTL4, ANKZF1, CSRP2, DDIT3, ENO3, GLRX, GPC1, PGF, PGM2, PPARGC1A, SIAH2, STC2 and TKTL1) were selected to construct the risk score model. We used the coefficients calculated by the lasso regression analysis to calculate the risk score. The formula was as follows: Risk Score = (−0.043 ×ALDOB) + (0.200 × ANGPTL4) + (0.404 × ANKZF1) + (0.311 × CSRP2) + (0.092 × DDIT3) + (0.199 × ENO3) - (0.146 × GLRX) + (0.040 × GPC1) + (0.068 × PGF) - (0.441 × PGM2) - (0.328 × PPARGC1A) + (0.278 × SIAH2) + (0.152 × STC2) + (0.115 × TKTL1).
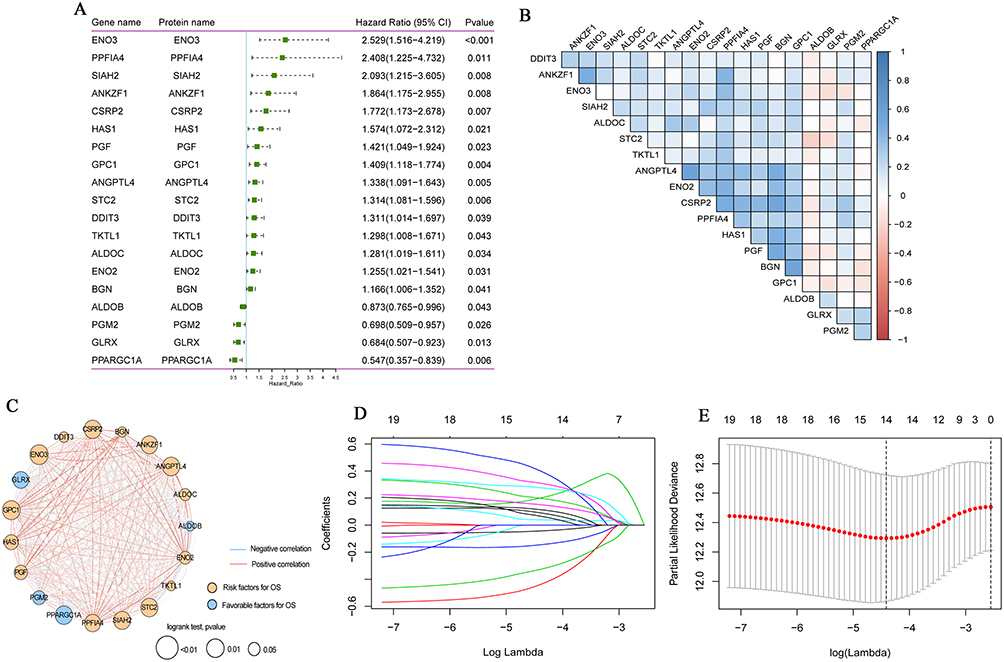 |
Figure 1 Hypoxia gene signature in colon cancer. (A) Forest map of 19 hypoxia-associated genes by univariate Cox analysis; (B) Pearson correlation analysis of 19 hypoxia-associated genes; (C) Interaction network of 19 hypoxia-associated genes mapped by Cytoscape. The Orange circle represents that hypoxia-associated genes were the risk factors of OS. The blue circle represents that hypoxia–associated genes were the favorable factors for OS. The blue line represents a negative correlation between two genes, and the depth of the color represents the strength of the correlation. The Orange line represents a positive correlation between two genes, and the depth of the color represents the strength of the correlation. (D) The lasso regression analysis; (E) The partial likelihood deviance for the lasso regression. Abbreviation: OS, overall survival. |
Prognostic Value of Hypoxia Risk Signature
Patients in TCGA-colon cancer and GSE17536 datasets were divided into high and low risk score groups according to the median risk score. The compareGroups package was used for clinical information statistics of patients in high and low risk score groups (Tables S1 and S2). In this study, we found that mortality was significantly higher in the high risk group than in the low risk group (Figure 2A and B). Subsequently, the expression of 14 hypoxia-associated genes in the high and low risk score groups was analyzed. Heat map results showed that 10 of the 14 hypoxia-associated genes were lowly expressed in the low risk score group, suggesting that high risk score patients were prone to forming hypoxic microenvironment (Figure 2C). The differential expression of 14 hypoxia-associated genes also suggested different disease progression in patients in the high and low risk score groups. In addition, Kaplan-Meier analysis was performed to evaluate the prognostic value of colon cancer hypoxia signature. The results showed that the low risk score group had a better survival advantage than the high risk score group (Figure 2D). This suggests that hypoxia high risk score was related to the poor OS in the TCGA-colon cancer dataset, which has been further validated by the GSE17536 dataset.
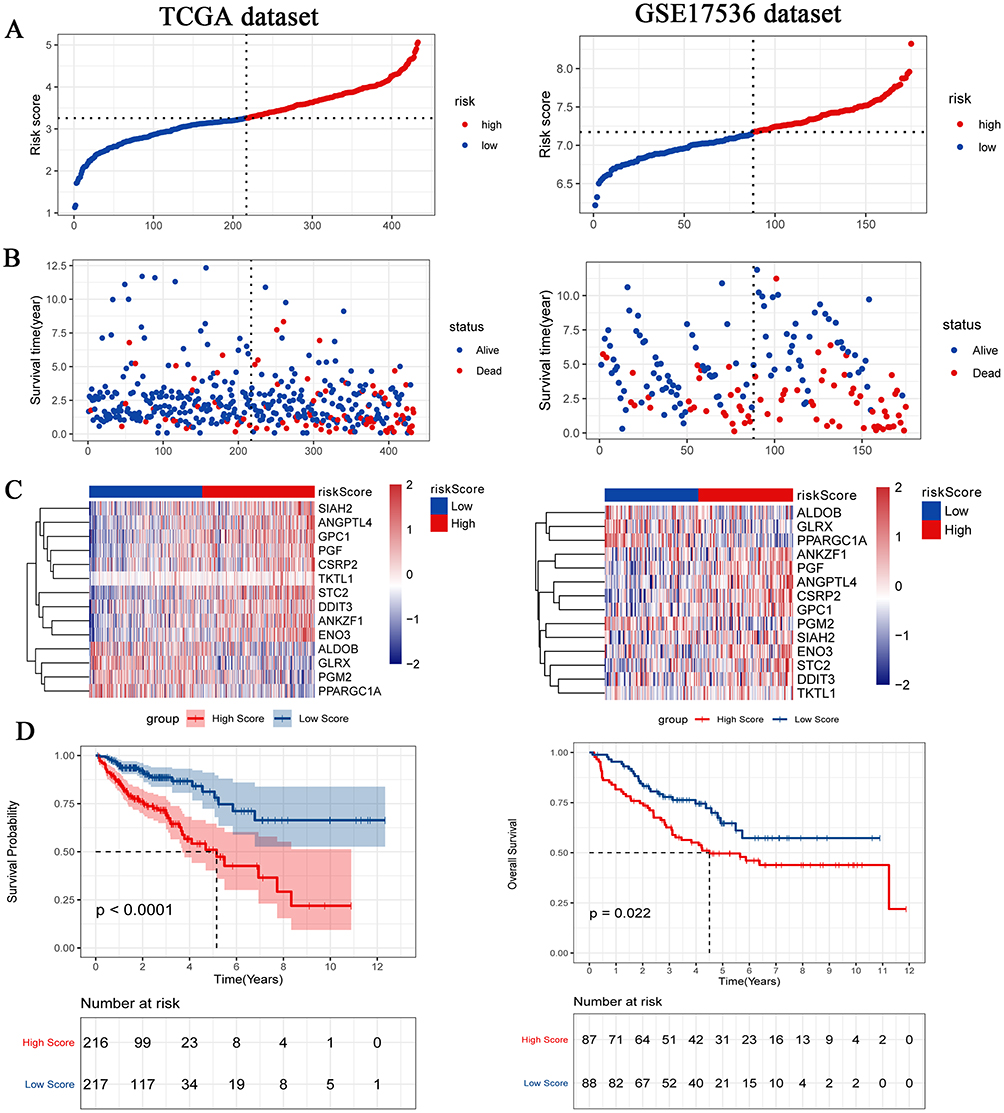 |
Figure 2 Distributions of risk score (A), OS status (B), heat map of signature genes (C) and survival of patients with high risk score and low risk score (D). The TCGA-colon cancer dataset on the left is training set and the GSE17536 dataset on the right is test set. P < 0.05 was considered statistically significant. Abbreviations: TCGA, the cancer genome atlas; OS, overall survival. |
Hypoxia Signature and Prognosis Assessment
In order to assess the accuracy of hypoxia signature in predicting 1-year, 3-year and 5-year survival rates, time-dependent ROC analysis was performed using data from TCGA-colon cancer and GSE17536 datasets. In the case of AUC >0.5, the greater the AUC value, the higher the accuracy. In the TCGA-colon cancer dataset, the area under curve (AUC) for 1-year, 3-year and 5-year was 0.710, 0.708 and 0.782, respectively (Figure 3A). In the GSE17536 dataset, the AUC for 1-year, 3-year and 5-year was 0.66, 0.7 and 0.81, respectively (Figure 3B). This indicates that the hypoxia signature has high prognostic prediction accuracy. Univariate Cox analysis showed that risk score was significantly correlated with OS of colon cancer patients (P <0.05) (Figure 3C). Multivariate Cox analysis showed that the risk score was associated with poor OS and could be used as an independent prognostic factor for colon cancer patients (P <0.05) (Figure 3D).
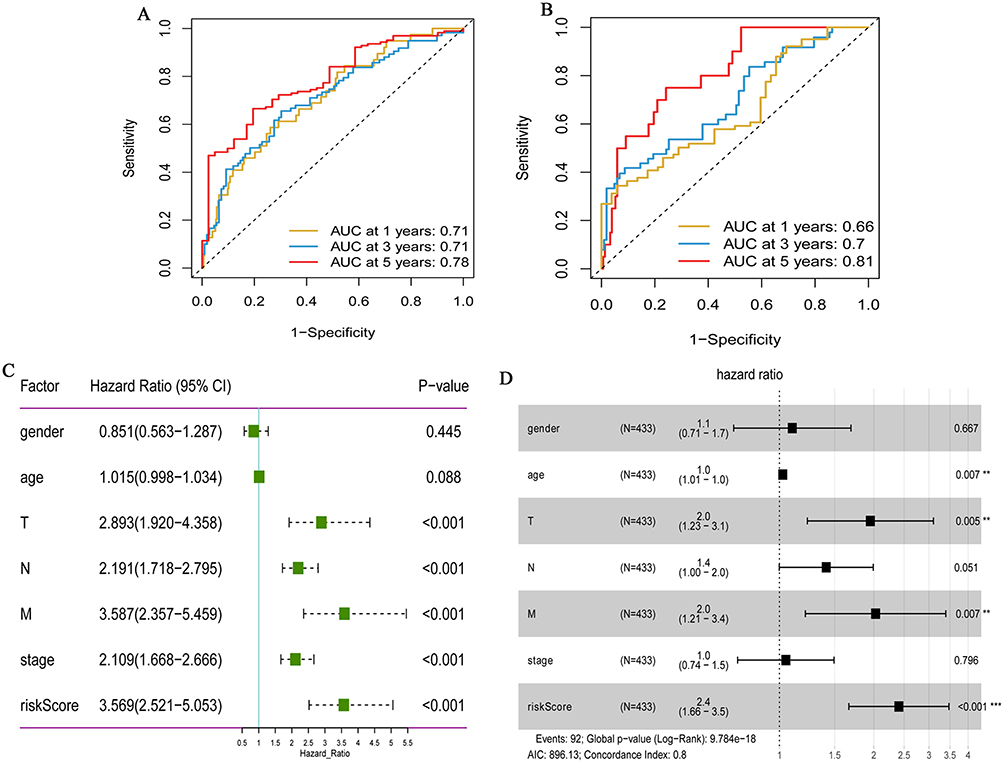 |
Figure 3 Prognostic value of the hypoxia gene signature in colon cancer. (A) ROC curves showing the predictive efficiency of the hypoxia gene signature on the 1-, 3-, and 5-years survival rate in TCGA-colon cancer dataset; (B) ROC curves showing the predictive efficiency of the hypoxia gene signature on the 1-, 3-, and 5-years survival rate in GSE17536 dataset; (C) Univariate Cox analysis of hypoxia gene signature to evaluate the independent prognostic value of OS in colon cancer patients; (D) Multivariate Cox analysis of hypoxia gene signature to evaluate the independent prognostic value of OS in colon cancer patients. **P <0.01; ***P <0.001. Abbreviations: OS, overall survival; ROC, receiver operator characteristic, AUC, area under curve. |
Gsea
In order to further understand the relevant signaling pathways activated in the high risk score group, GSEA was used to compare high and low risk score groups. The results showed that the activities of tumor proliferation and anti-apoptosis related processes were higher in the high risk score group. For example, cell cycle, PI3K-Akt, JAK-STAT, MAPK, mTOR, VEGF and other pathways (Figure 4). Therefore, it is speculated that these pathways may be involved in promoting disease progression in patients in the high risk score group.
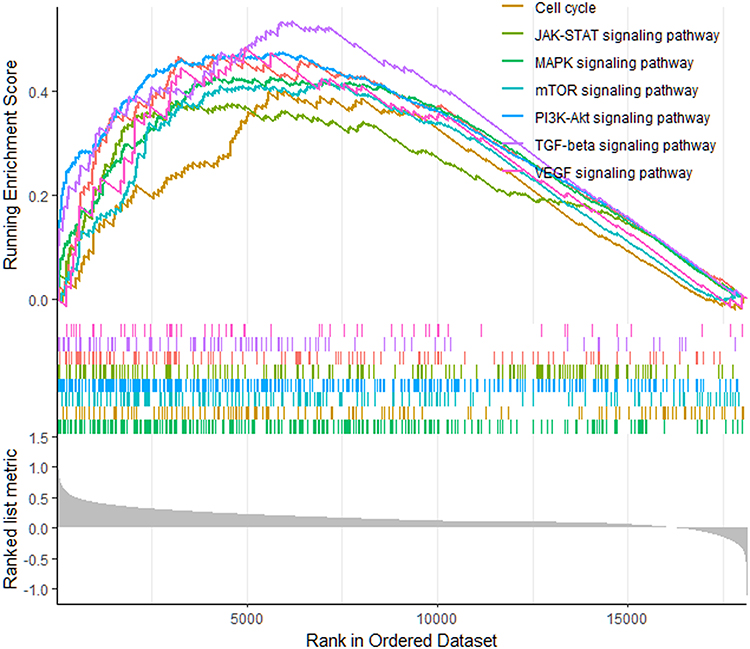 |
Figure 4 Gene set enrichment analysis (GSEA) results in the high risk score group. |
Immune Status of Low and High Risk Score Groups
In this study, we investigate the ability of hypoxia risk signature to assess the TIME. The ssGSEA algorithm was used to quantify the infiltration level of immune cells in colon cancer samples. The boxplot of ssGSEA results shows that compared to the low risk score group, the high risk score group had higher infiltration levels of immunosuppressive cells (for example, regulatory T cell, macrophage), while the immune infiltration levels of activated CD4 T cell and neutrophil were lower (Figure 5A). In addition, ESTIMATE algorithm results also confirmed that in patients with high risk score, the immune score, stromal score, and ESTIMATE score were significantly lower than those of patients with low risk score, while the tumor purity was significantly higher than that of patients with low risk score (Figure 5B–E).
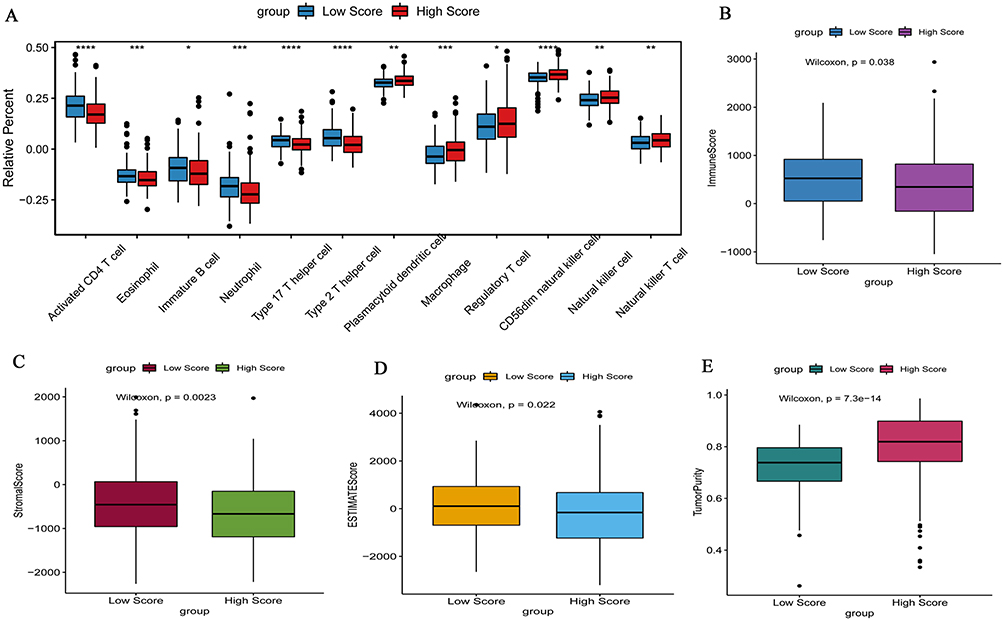 |
Figure 5 Difference in immune cells (A), immune score (B), stromal score (C), ESTIMATE score (D) and tumor purity (E) between high and low risk score groups. *P <0.05; **P <0.01; ***P <0.001;****P <0.0001. P < 0.05 was considered statistically significant. |
High Risk Score Indicates an Immunosuppressive Microenvironment
Tracking Tumor Immunophenotype was used to download genes signatures. In the high risk score group, most of the genes related to the negative regulation of the cancer immune cycle were up-regulated (Figure 6). The results suggest that the cancer immune cycle is low active in high risk score patients.
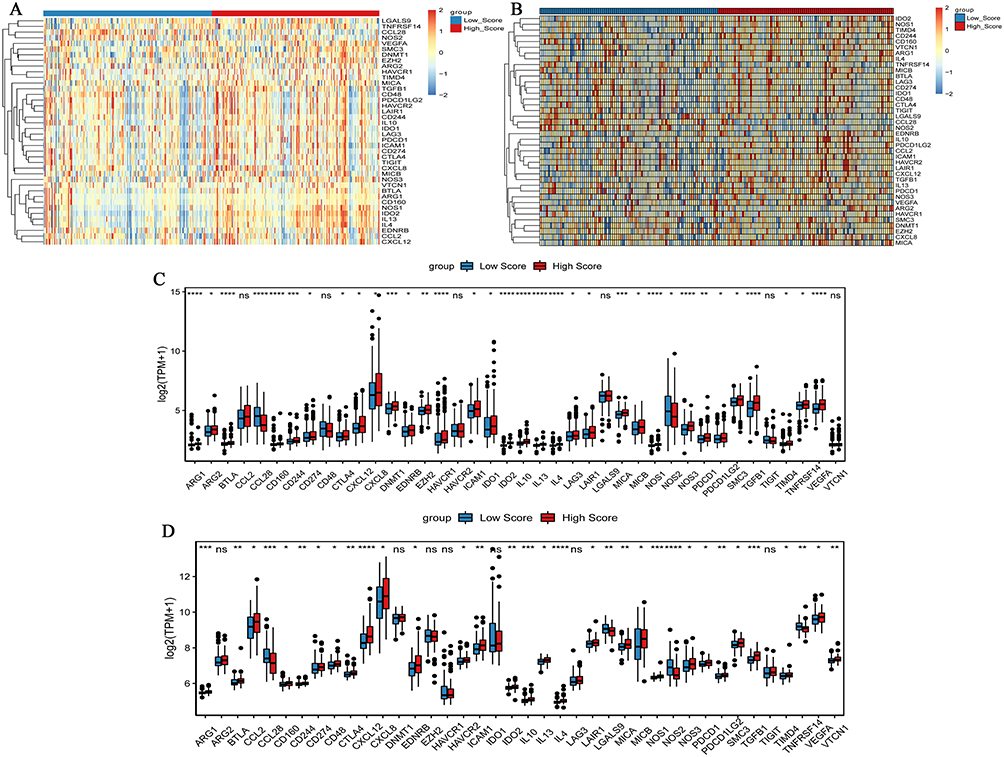 |
Figure 6 Expression of cancer-immune cycle negative regulatory genes in high and low risk score groups. (A) Heat map of cancer-immune cycle negative regulatory genes in high and low risk score groups in the TCGA-colon cancer dataset. The clustering is constructed using the full chain method together with the Euclidean distance. Each row and column represents a cancer-immune cycle negative regulatory gene and a sample, respectively. Orange indicates above the reference channel (high expression genes). Blue indicates below the reference channel (low expression genes). (B) Heat map of cancer-immune cycle negative regulatory genes in high and low risk score groups in the GSE17536 dataset. The clustering is constructed using the full chain method together with the Euclidean distance. Each row and column represents a cancer-immune cycle negative regulatory gene and a sample, respectively. Orange indicates above the reference channel (high expression genes). Blue indicates below the reference channel (low expression genes). (C) Box plot of cancer-immune cycle negative regulatory genes in the TCGA-colon cancer dataset; (D) Box plot of cancer-immune cycle negative regulatory genes in the GSE17536 dataset. *P <0.05; **P <0.01; ***P <0.001;****P <0.0001. Abbreviation: ns, no statistical significance. |
Immune Checkpoint and Somatic Mutation Analysis
The expression of six immune checkpoints in high and low risk score groups was analyzed based on TCGA-colon cancer (Figure 7A) and GSE17536 (Figure 7B) datasets. The expression of most immune checkpoints was significantly higher in high risk score group. These results suggest that patients with high risk score tend to suppress the TIME by up-regulating immune checkpoints. In addition, we also analyzed the genes with the top 20 mutation frequency between patients with high risk score and patients with low risk score based on TCGA-colon cancer dataset (Figure 7C and D). The results showed that the frequency of genetic mutations was high in both groups. However, the mutated genes in the two groups were different.
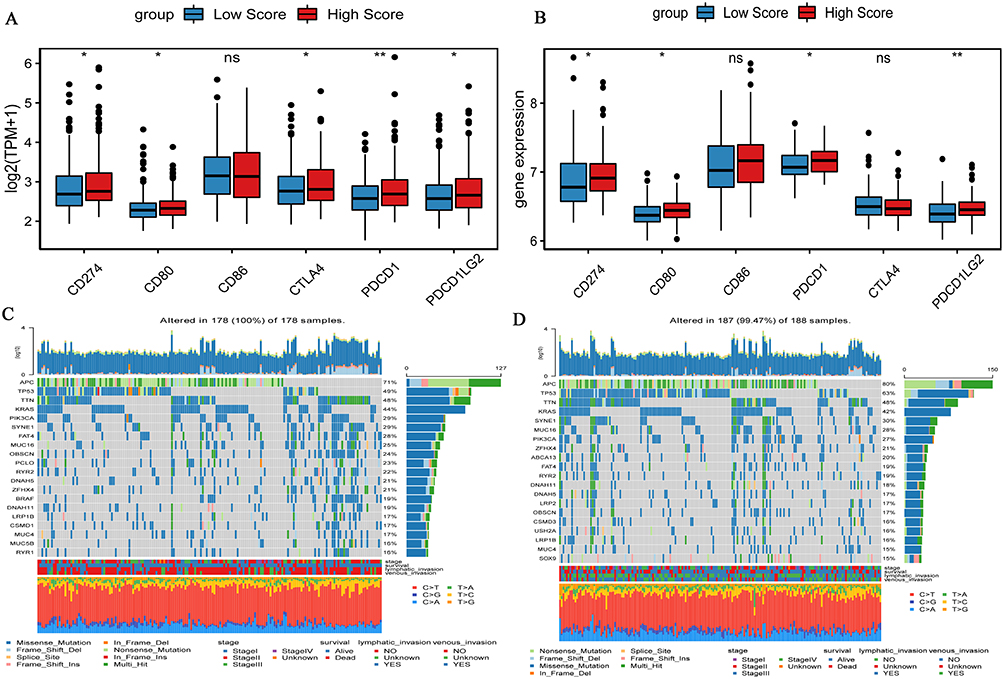 |
Figure 7 Expression of immune checkpoints and genes mutations between high and low risk score groups. (A) Expression of immune checkpoints in high and low risk score groups in the TCGA-colon cancer dataset; (B) Expression of immune checkpoints in high and low risk score groups in the GSE17536 dataset; (C) Waterfall chart of genes mutations in the low risk score group in the TCGA-colon cancer dataset; (D) Waterfall chart of gene mutations in the high risk score group in the GSE17536 dataset. *P <0.05; **P <0.01. Abbreviation: ns, no statistical significance. |
Knockdown ANKZF1 Inhibited the Proliferation, Migration and Invasion of Colon Cancer Cell HCT116
Colon cancer cell HCT116 was selected to knockdown ANKZF1. The expression level of ANKZF1 in the knockdown cells was detected by real time-PCR to screen out the effective interference targets. The results showed that the knockdown effect of target 1 was the best (Figure 8A), so we chose Si-RNA1 for subsequent experiments. CCK8 assay showed that the activity of colon cancer cells significantly increased under hypoxia condition, and the activity of cancer cells in Si-ANKZF1 and Si-ANKZF1+1% O2 groups was inhibited after ANZF1 knockdown (Figure 8B). Flat panel clone experiment showed that the proliferation of cancer cells significantly increased under hypoxia condition, and the proliferation of cancer cells in Si-ANKZF1 and Si-ANKZF1+1% O2 groups was inhibited after ANKZF1 knockdown (Figure 8C and D). Cell wound scratch assay showed that the migration of cancer cells significantly increased under hypoxia condition, and the migration of cancer cells in Si-ANKZF1 and Si-ANKZF1+1% O2 groups was inhibited after ANKZF1 knockdown (Figure 9A and B). Transwell assay showed that the invasion of cancer cells significantly increased under hypoxia condition, and the invasion of cancer cells in Si-ANKZF1 and Si-ANKZF1+1% O2 groups was inhibited after ANKZF1 knockdown (Figure 9C and D). The above results suggest that knockdown the expression of ANKZF1 can help inhibit the proliferation, migration and invasion of colon cancer cells, and also indicate that ANKZF1 may play an important molecular regulatory role in the progression of colon cancer. Subsequently, protein expression levels of MMP2, MMP9, N-Cadherin, E-Cadherin and HIF-α in each group were detected by Western blot. The results showed that knockdown ANKZF1 expression also affected the expression of MMP2, MMP9, N-Cadherin, E-Cadherin and HIF-α in cancer cells (Figure 10A and B). This further suggests that ANKZF1 may play an important role in colon cancer progression.
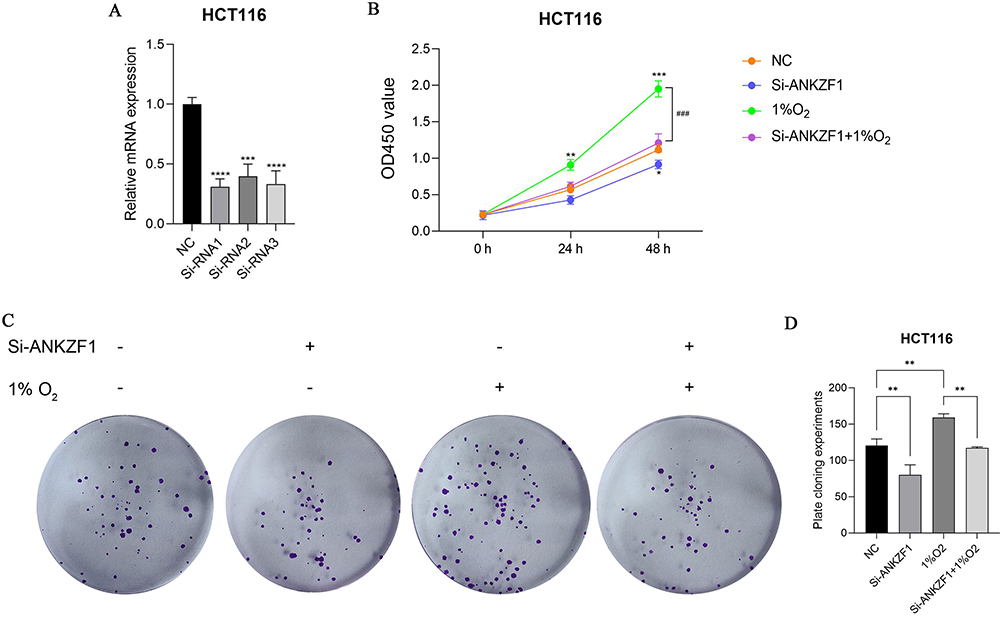 |
Figure 8 Activity and proliferation of colon cancer cells HCT116 after knockdown ANKZF1. (A) Real time-PCR was used to detect the expression of ANKZF1 to screen out effective interference targets in HCT116; (B) CCK8 was used to detect the activity of cancer cells in NC, Si-ANKZF1, NC+1% O2 and Si-ANKZF1+1% O2 groups; (C) Flat panel clone experiment was used to detect the proliferation of cancer cells in NC, Si-ANKZF1, NC+1% O2 and Si-ANKZF1+1% O2 groups; (D) Histogram of cell proliferation detected by flat panel clone experiment. *P <0.05; **P <0.01; ***P <0.001; ###P <0.001; ****P <0.0001. Abbreviation: NC, normal control. |
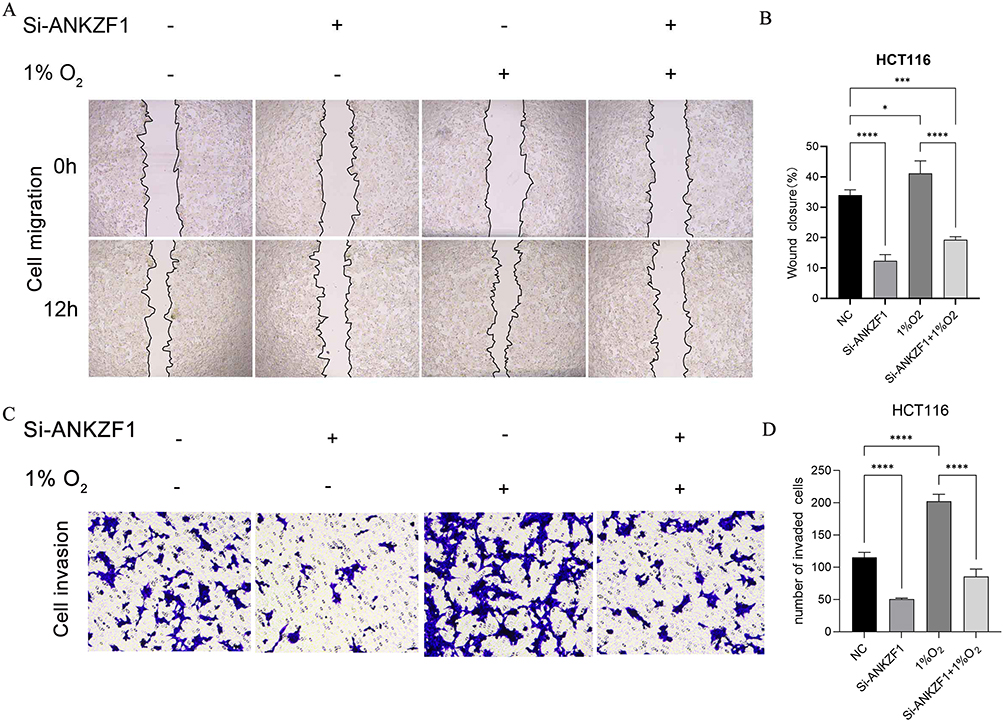 |
Figure 9 Migration and invasion of colon cancer cells HCT116 after knockdown ANKZF1. (A) Cell wound scratch experiment was used to detect the migration of cancer cells in NC, Si-ANKZF1, NC+1% O2 and Si-ANKZF1+1% O2 groups. Observation under 40x microscope. (B) Histogram of cell migration detected by cell wound scratch experiment; (C) Transwell was used to detect the invasion of cancer cells in NC, Si-ANKZF1, NC+1% O2 and Si-ANKZF1+1% O2 groups. Observation under 200x microscope. (D) Histogram of cell migration detected by transwell. *P <0.05; ***P <0.001; ****P <0.0001. Abbreviation: NC, normal control. |
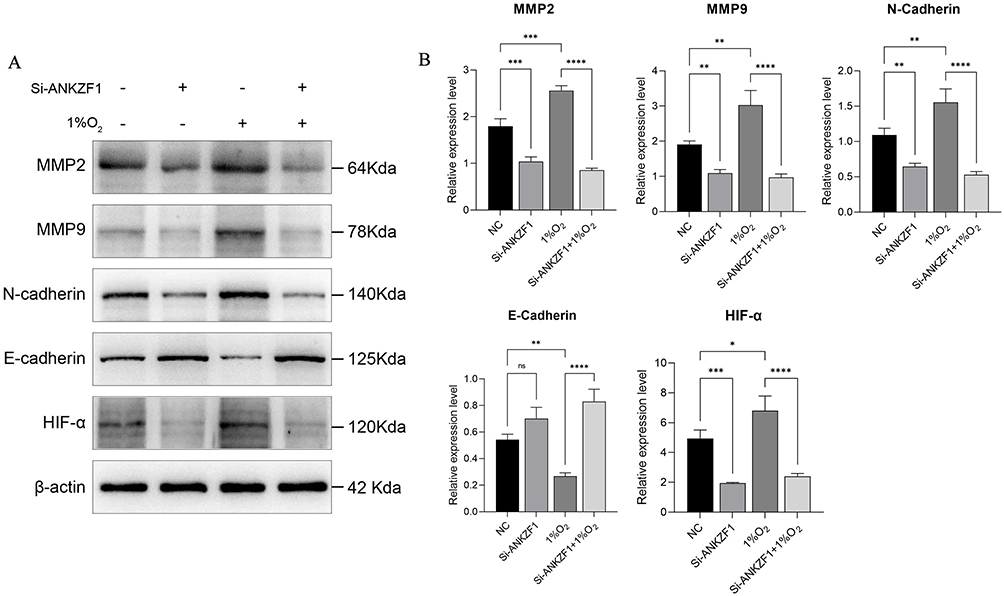 |
Figure 10 Western blot was used to detect the protein expression levels of MMP2, MMP9, N-Cadherin, E-Cadherin and HIF-α in NC, Si-ANKZF1, NC+1% O2 and Si-ANKZF1+1% O2 groups. (A) The expression bands of MMP2, MMP9, N-Cadherin, E-Cadherin and HIF-α in NC, Si-ANKZF1, NC+1% O2 and Si-ANKZF1+1% O2 groups were detected by Western blotting; (B) The relative expression levels of MMP2, MMP9, N-Cadherin, E-Cadherin and HIF-α proteins in NC, Si-ANKZF1, NC+1% O2 and Si-ANKZF1+1% O2 groups. *P <0.05; **P <0.01; ***P <0.001; ****P <0.0001. Abbreviations: NC, normal control; ns, no statistical significance. |
Expression Analysis of CA-IX and PD-L1
It was previously reported that CA-IX is a reliable marker of hypoxia and is highly expressed in hypoxia microenvironment.26 PD-L1 is widely regarded as a potential immune marker and therapeutic target for cancers. Therefore, we verified the expression of CA-IX and PD-L1 in colon cancer tissue samples and paracancer tissue samples. We analyze the mRNAs expression of CA-IX and PD-L1 in TCGA dataset. The results showed that CA-IX expression was significantly increased in colon cancer (Figure S1A) (P <0.05). In addition, the expression of PD-L1 in colon cancer tissues also had an increasing trend but was not significant (Figure S1B). We further verified the mRNAs expression of CA-IX and PD-L1 in the GSE110224 dataset. The results showed that CA-IX and PD-L1 were significantly increased in colon cancer tissues (Figure S1C and D) (P <0.05). Subsequently, the proteins expression of CA-IX and PD-L1 in colon cancer tissue samples and adjacent tissue samples was also verified by immunofluorescence. Compared with normal tissues adjacent to cancer, the number and degree of cells staining positive for CA-IX and PD-L1 proteins in colon cancer tissues had increase trended (Figure S1E and F).
Discussion
Colon cancer is a cancer that develops from the epithelial cells lining the colon or rectum of the gastrointestinal tract and is one of the most common cancers in the world.27 With the improvement of colon cancer detection and treatment methods, morbidity and mortality have been reduced, but 30–50% of patients have recurrence and metastasis within five years after treatment.28 Previous studies have found that immune cell infiltration,29 autophagy-related genes,30 tumour-stroma ratio31 and other characteristics can be used to predict the prognosis of patients with colon cancer. However, there are few studies on the relationship between hypoxia and the prognosis of colon cancer. Hypoxia is a typical feature of TIME.6 Recent studies have shown that hypoxia plays an important role in tumor prognosis.32–34 A study has shown that hypoxic-associated gene signature can be used to predict the prognosis of colon cancer patients.35 In order to deepen our understanding of predicting the prognosis of colon cancer using hypoxia risk score model, we also identified a novel hypoxic-associated gene signatures based on mRNA analysis data. The results showed that colon cancer patients in the hypoxia high risk score group had a poor prognosis. Different from the study of Yixin Xu et al, this study was a novel risk score model identified based on 14 hypoxia-associated genes. Subsequently, risk score model gene ANKZF1 was selected for in vitro cell experiments to detect the effects on the proliferation, migration and invasion of colon cancer cells.
In this study, the identified risk model consisted of 14 hypoxia-associated genes (ALDOB, ANGPTL4, ANKZF1, CSRP2, DDIT3, ENO3, GLRX, GPC1, PGF, PGM2, PPARGC1A, SIAH2, STC2 and TKTL1), which were significantly associated with colon cancer prognosis. Aldolase B (ALDOB) has been reported to alter the traction force of colorectal cancer to hypoxia, which has been linked to tumor metastasis.36 The expression level of the angiogenic gene angiopoietin like 4 (ANGPTL4) in colorectal cancer was up-regulated under hypoxia.37 High expression of ankyrin repeat and zinc finger peptidyl tRNA hydrolase 1 (ANKZF1) is associated with lower OS in colon cancer through involvement in angiogenesis and several cancer signaling pathways.38 In this study, knockdown the expression of ANKZF1 in colon cancer cells ANKZF1 can inhibit the proliferation, migration and invasion of cells. Moreover, knockdown ANKZF1 expression also affected the expression of MMP2, MMP9, N-Cadherin, E-Cadherin and HIF-α in cancer cells. This further suggests that ANKZF1 may play an important role in colon cancer progression. Cysteine and glycine rich protein 2 (CSRP2), an aggressive actin binding protein, was up-regulated by hypoxia in breast cancer cell lines.39 In addition, CSRP2 was abnormally expressed in colorectal cancer and was a potential therapeutic target.40 Studies in colon cancer have shown that DNA damage inducible transcript 3 (DDIT3) was significantly induced in the hypoxia response.41 Low expression level of enolase 3 (ENO3) was associated with positive prognosis of colon cancer and can be used as a prognostic biomarker in patients with colon cancer.42 Glutaredoxin (GLRX) was abnormally expressed in colon cancer.43 Glypican 1 (GPC1) expression was increased in colon cancer and was significantly related to prognosis.44,45 Previous studies have found that hypoxia can activate the expression of placental growth factor (PGF).46 Furthermore, PGF can induce the formation of blood vessels in colon cancer.47 The down-regulation of phosphoglucomutase 2 (PGM2) may be related to poor prognosis of colorectal cancer, and may also be involved in the regulation of the process of colorectal cancer by regulating cell cycle, purine metabolism and spliceosome.48 PPARG coactivator 1 alpha (PPARGC1A) was significantly down-regulated in colon cancer stroma and was a potential prognostic biomarker.49 Siah E3 ubiquitin protein ligase 2 (SIAH2) is a ring finger ligase, which is an important regulator of hypoxia activation pathway.50 In addition, SIAH2 expression plays an important role in the adaptation of colorectal cancer cells to hypoxia.51 Down-regulation of stanniocalcin 2 (STC2) significantly inhibited the growth and migration of colon cancer cells under hypoxic conditions.52 STC2 was also a potential tumor biomarker for colorectal cancer diagnosis and prognosis.53 Transketolase like 1 (TKTL1) expression can be induced in colon cancer cells under hypoxia condition, and plays a vital role in cell proliferation.54,55 In addition, strong TKTL1 protein expression is associated with poor prognosis in colon cancer.56 Therefore, the hypoxia risk model of colon cancer constructed by these 14 hypoxia-associated genes has potential reliability.
Tumor hypoxia is a negative prognostic factor associated with oncogenic signal activation, immune escape and resistance to therapy.57 Macrophages stimulate an anti-tumor immune response under hypoxia.58 Hypoxia can enhance immunosuppression by inhibiting the function of CD4+ effector T cells and promoting Treg activity, thus affecting the immune detection of colon cancer.13 In our study, the proportion of immunosuppressive cells such as macrophages and Treg in the hypoxia high risk score group was significantly higher, while the proportion of immune cells such as activated CD4 T cells and B cells was reduced. In addition, in patients with high risk score of hypoxia, the immune score, stromal score, and ESTIMATE score were significantly lower than those of patients with low risk score, while the tumor purity was significantly higher than that of patients with low risk score. These results imply that the hypoxia risk model may predict TIME of colon cancer. Up-regulation of immune checkpoints and their ligands in the TIME can modulate tumor immune escape.59 A study found that immune checkpoint inhibitors can improve survival in patients with clear cell renal cell carcinoma.60 In this study, immune checkpoints like PD1, PD-L1, CD80, and PDL2 were significantly up-regulated in the high risk score group. Therefore, identifying the underlying mechanisms of hypoxia in immune escape and immune checkpoints may help identify potential therapeutic targets for colon cancer. It was previously reported that CA-IX is a reliable marker of hypoxia and is highly expressed in hypoxia microenvironment.26 CA-IX is overexpressed in colorectal cancer, and this overexpression leads to a poor prognosis.61 The expression of CA-IX is associated with the proliferation of colon cancer cells.62 In this study, CA-IX expression was up-regulated trend in colon cancer tissues. This further suggests that hypoxia plays an important role in mediating the progression of colon cancer.
Nevertheless, this study also has some limitations. The hypoxia risk score model obtained in this study based on public data lacks clinical validation to demonstrate its effectiveness. Although the risk score model was analyzed in two different databases, there are still potential risks. Therefore, it is necessary to collect samples for further research. The immunofluorescence results showed that compared with the control group, CA-IX was increase in colon cancer, but it was not significant. It may be caused by sample heterogeneity and technical issues with experimental operations. We will continue to study further in the later period.
Conclusion
In this study, a novel hypoxia risk model for colon cancer was identified based on 14 hypoxia-associated genes. It can not only predict the survival of colon cancer patients, but also evaluate TIME. Analysis of the relationship between hypoxia and prognosis and immune cells will help improve the level of cancer treatment and prognosis of colon cancer patients. In addition, in vitro cell experiments showed that knockdown the expression of the risk score model gene ANKZF1 in colon cancer cells can inhibit cell proliferation, migration and invasion. In short, this study lays the foundation for understanding the value of hypoxia-associated genes in colon cancer.
Data Sharing Statement
All data generated or analyzed during this study are included in this published article. We searched for colon cancer public data from TCGA (https://tcga-data.nci.nih.gov/tcga/) and GEO (http://www.ncbi.nlm.nih.gov/geo). The accession numbers are TCGA-colon cancer; GEO: GSE17536 and GEO: GSE110224, respectively.
Ethics Approval and Consent to Participate
This study was approved by the Ethics Committee of The First Affiliated Hospital of Hebei Medical University (2013106). All participants were informed as to the purpose of this study, and that this study complied with the Declaration of Helsinki. The informed consent was obtained from the all participants.
Funding
This study was supported by the Key Science and Technology Research Project of Health and Family Planning Commission of Hebei Province (grant no. 20221165), Natural science foundation of Hebei Province (No. H2020206374 & No. H2021206306), Clinical medicine excellent talents project of Hebei Province (No. LS202001).
Disclosure
The authors declare that they have no competing interests.
References
1. Chen W, Zheng R, Zhang S, et al. Cancer incidence and mortality in China, 2013. Cancer Lett. 2017;401:63–71. doi:10.1016/j.canlet.2017.04.024
2. Benson AB, Venook AP, Al-Hawary MM, et al. NCCN guidelines insights: colon cancer, version 2.2018. J Natl Comprehen Cancer Network. 2018;16(4):359–369. doi:10.6004/jnccn.2018.0021
3. Gupta R, Bhatt LK, Johnston TP, et al. Colon cancer stem cells: potential target for the treatment of colorectal cancer. Cancer Biol Ther. 2019;20(8):1068–1082. doi:10.1080/15384047.2019.1599660
4. Allemani C, Matsuda T, Di Carlo V, et al. Global surveillance of trends in cancer survival 2000–14 (Concord-3): analysis of individual records for 37 513 025 patients diagnosed with one of 18 cancers from 322 population-based registries in 71 countries. Lancet. 2018;391:1023–1075. doi:10.1016/S0140-6736(17)33326-3
5. Chen H, Luo J, Guo J. Development and validation of a five-immune gene prognostic risk model in colon cancer. BMC Cancer. 2020;20(1):395. doi:10.1186/s12885-020-06799-0
6. Multhoff G, Vaupel P. Hypoxia compromises anti-cancer immune responses. Adv Exp Med Biol. 2020;1232:131–143.
7. Semenza GL. Hypoxia-inducible factors: mediators of cancer progression and targets for cancer therapy. Trends Pharmacol Sci. 2012;33(4):207–214. doi:10.1016/j.tips.2012.01.005
8. Zhang B, Tang B, Gao J, et al. A hypoxia-related signature for clinically predicting diagnosis, prognosis and immune microenvironment of hepatocellular carcinoma patients. J Transl Med. 2020;18(1):342. doi:10.1186/s12967-020-02492-9
9. Hinshaw DC, Shevde LA. The tumor microenvironment innately modulates cancer progression. Cancer Res. 2019;79(18):4557–4566. doi:10.1158/0008-5472.CAN-18-3962
10. Liu G, Rui W, Zhao X, et al. Enhancing CAR-T cell efficacy in solid tumors by targeting the tumor microenvironment. Cell Mol Immunol. 2021;18(5):1085–1095. doi:10.1038/s41423-021-00655-2
11. Balsamo M, Manzini C, Pietra G, et al. Hypoxia downregulates the expression of activating receptors involved in NK-cell-mediated target cell killing without affecting ADCC. Eur J Immunol. 2013;43(10):2756–2764. doi:10.1002/eji.201343448
12. Terry S, Buart S, Chouaib S. Hypoxic Stress-Induced Tumor and Immune Plasticity, Suppression, and Impact on Tumor Heterogeneity. Front Immunol. 2017;8:1625. doi:10.3389/fimmu.2017.01625
13. Westendorf AM, Skibbe K, Adamczyk A, et al. Hypoxia enhances immunosuppression by inhibiting CD4+ effector T cell function and promoting treg activity. Cell Physiol Biochem. 2017;41(4):1271–1284. doi:10.1159/000464429
14. Liberzon A, Birger C, Thorvaldsdóttir H, et al. The Molecular Signatures Database (MSigDB) hallmark gene set collection. Cell Syst. 2015;1(6):417–425. doi:10.1016/j.cels.2015.12.004
15. Zlobec I, Steele R, Nigam N, et al. A predictive model of rectal tumor response to preoperative radiotherapy using classification and regression tree methods. Clin Cancer Res. 2005;11(15):5440–5443. doi:10.1158/1078-0432.CCR-04-2587
16. Li YM, Li ZL, Chen F, et al. A LASSO-derived risk model for long-term mortality in Chinese patients with acute coronary syndrome. J Transl Med. 2020;18(1):157. doi:10.1186/s12967-020-02319-7
17. Subramanian A, Tamayo P, Mootha VK, et al. Gene set enrichment analysis: a knowledge-based approach for interpreting genome-wide expression profiles. Proc Natl Acad Sci U S A. 2005;102(43):15545–15550. doi:10.1073/pnas.0506580102
18. Pinello N, Sun S, Wong JJ. Aberrant expression of enzymes regulating m(6)A mRNA methylation: implication in cancer. Cancer Biol Med. 2018;15(4):323–334. doi:10.20892/j.issn.2095-3941.2018.0365
19. Tong J, Cao G, Zhang T, et al. m(6)A mRNA methylation sustains Treg suppressive functions. Cell Res. 2018;28(2):253–256. doi:10.1038/cr.2018.7
20. Chen DS, Mellman I. Oncology meets immunology: the cancer-immunity cycle. Immunity. 2013;39(1):1–10. doi:10.1016/j.immuni.2013.07.012
21. Xu L, Deng C, Pang B, et al. TIP: a Web Server for Resolving Tumor Immunophenotype Profiling. Cancer Res. 2018;78(23):6575–6580. doi:10.1158/0008-5472.CAN-18-0689
22. Buttacavoli M, Di Cara G, Roz E, et al. Integrated multi-omics investigations of metalloproteinases in colon cancer: focus on MMP2 and MMP9. Int J Mol Sci. 2021;22(22):12389. doi:10.3390/ijms222212389
23. Yue B, Qiu S, Zhao S, et al. LncRNA-ATB mediated E-cadherin repression promotes the progression of colon cancer and predicts poor prognosis. J Gastroenterol Hepatol. 2016;31(3):595–603. doi:10.1111/jgh.13206
24. Zhou H, Zou J, Shao C, et al. Prolyl 4-hydroxylase subunit alpha 3 facilitates human colon cancer growth and metastasis through the TGF-β/Smad signaling pathway. Pathol Res Pract. 2022;230:153749. doi:10.1016/j.prp.2021.153749
25. Zhdanov AV, Dmitriev RI, Papkovsky DB. Bafilomycin A1 activates HIF-dependent signalling in human colon cancer cells via mitochondrial uncoupling. Biosci Rep. 2012;32(6):587–595. doi:10.1042/BSR20120085
26. Zheng S, Zou Y, Liang JY, et al. Identification and validation of a combined hypoxia and immune index for triple-negative breast cancer. Mol Oncol. 2020;14(11):2814–2833. doi:10.1002/1878-0261.12747
27. Jahanafrooz Z, Mosafer J, Akbari M, et al. Colon cancer therapy by focusing on colon cancer stem cells and their tumor microenvironment. J Cell Physiol. 2020;235(5):4153–4166. doi:10.1002/jcp.29337
28. Schmoll HJ, Van Cutsem E, Stein A, et al. ESMO consensus guidelines for management of patients with colon and rectal cancer. a personalized approach to clinical decision making. Ann Oncol. 2012;23(10):2479–2516. doi:10.1093/annonc/mds236
29. Zhou R, Zhang J, Zeng D, et al. Immune cell infiltration as a biomarker for the diagnosis and prognosis of stage I-III colon cancer. Cancer Immunol Immunother. 2019;68(3):433–442. doi:10.1007/s00262-018-2289-7
30. Wang X, Xu Y, Li T, et al. Development of prognosis model for colon cancer based on autophagy-related genes. World J Surg Oncol. 2020;18(1):285. doi:10.1186/s12957-020-02061-w
31. van Pelt GW, Sandberg TP, Morreau H, et al. The tumour-stroma ratio in colon cancer: the biological role and its prognostic impact. Histopathology. 2018;73(2):197–206. doi:10.1111/his.13489
32. Xia X, Wang S, Ni B, et al. Hypoxic gastric cancer-derived exosomes promote progression and metastasis via MiR-301a-3p/PHD3/HIF-1α positive feedback loop. Oncogene. 2020;39(39):6231–6244. doi:10.1038/s41388-020-01425-6
33. Tao J, Yang G, Zhou W, et al. Targeting hypoxic tumor microenvironment in pancreatic cancer. J Hematol Oncol. 2021;14(1):14.
34. de Heer EC, Jalving M, Harris AL. HIFs, angiogenesis, and metabolism: elusive enemies in breast cancer. J Clin Invest. 2020;130(10):5074–5087. doi:10.1172/JCI137552
35. Xu Y, Cao C, Zhu Z, et al. Novel hypoxia-associated gene signature depicts tumor immune microenvironment and predicts prognosis of colon cancer patients. Front Genet. 2022;13:901734.
36. Huang HC, Lin WR, Lim SN, et al. Aldolase triggers metabolic reprogramming in colorectal cancer in hypoxia and stiff desmoplastic microenvironments. Colloids Surf B Biointerfaces. 2020;190:110969. doi:10.1016/j.colsurfb.2020.110969
37. Zong S, Li W, Li H, et al. Identification of hypoxia-regulated angiogenic genes in colorectal cancer. Biochem Biophys Res Commun. 2017;493(1):461–467. doi:10.1016/j.bbrc.2017.08.169
38. Zhou X, Shang YN, Lu R, et al. High ANKZF1 expression is associated with poor overall survival and recurrence-free survival in colon cancer. Future Oncol. 2019;15(18):2093–2106. doi:10.2217/fon-2018-0920
39. Hoffmann C, Mao X, Brown-Clay J, et al. Hypoxia promotes breast cancer cell invasion through HIF-1α-mediated up-regulation of the invadopodial actin bundling protein CSRP2. Sci Rep. 2018;8(1):10191. doi:10.1038/s41598-018-28637-x
40. Chen L, Long X, Duan S, et al. CSRP2 suppresses colorectal cancer progression via p130Cas/Rac1 axis-meditated ERK, PAK, and HIPPO signaling pathways. Theranostics. 2020;10(24):11063–11079. doi:10.7150/thno.45674
41. Liu T, Laurell C, Selivanova G, et al. Hypoxia induces p53-dependent transactivation and Fas/CD95-dependent apoptosis. Cell Death Differ. 2007;14(3):411–421. doi:10.1038/sj.cdd.4402022
42. Pan X, Wu H, Chen G, et al. Prognostic value of enolase gene family in colon cancer. Med Sci Monit. 2020;26:e922980. doi:10.12659/MSM.922980
43. Cha MK, Kim IH. Preferential overexpression of glutaredoxin3 in human colon and lung carcinoma. Cancer Epidemiol. 2009;33(3–4):281–287. doi:10.1016/j.canep.2009.08.006
44. Papiewska-Pająk I, Krzyżanowski D, Katela M, et al. Glypican-1 level is elevated in extracellular vesicles released from MC38 colon adenocarcinoma cells overexpressing snail. Cells. 2020;9(7):1585. doi:10.3390/cells9071585
45. Zhang L, Wang S, Wang Y, et al. Effects of hypoxia in intestinal tumors on immune cell behavior in the tumor microenvironment. Front Immunol. 2021;12:645320.
46. Tudisco L, Orlandi A, Tarallo V, et al. Hypoxia activates placental growth factor expression in lymphatic endothelial cells. Oncotarget. 2017;8(20):32873–32883. doi:10.18632/oncotarget.15861
47. Unterleuthner D, Neuhold P, Schwarz K, et al. Cancer-associated fibroblast-derived WNT2 increases tumor angiogenesis in colon cancer. Angiogenesis. 2020;23(2):159–177. doi:10.1007/s10456-019-09688-8
48. Yang F, Cai S, Ling L, et al. Identification of a five-gene prognostic model and its potential drug repurposing in colorectal cancer based on TCGA, GTEx and GEO databases. Front Genet. 2020;11:622659.
49. Uddin MN, Li M, Wang X. Identification of transcriptional signatures of colon tumor stroma by a meta-analysis. J Oncol. 2019;2019:1–12. doi:10.1155/2019/8752862
50. Nakayama K, Qi J, Ronai Z. The ubiquitin ligase Siah2 and the hypoxia response. Mol Cancer Res. 2009;7(4):443–451. doi:10.1158/1541-7786.MCR-08-0458
51. Bruno T, Valerio M, Casadei L, et al. Che-1 sustains hypoxic response of colorectal cancer cells by affecting Hif-1α stabilization. J Exp Clin Cancer Res. 2017;36(1):32. doi:10.1186/s13046-017-0497-1
52. Miyazaki S, Kikuchi H, Iino I, et al. Anti-VEGF antibody therapy induces tumor hypoxia and stanniocalcin 2 expression and potentiates growth of human colon cancer xenografts. Int J Cancer. 2014;135(2):295–307. doi:10.1002/ijc.28686
53. Chen B, Zeng X, He Y, et al. STC2 promotes the epithelial-mesenchymal transition of colorectal cancer cells through AKT-ERK signaling pathways. Oncotarget. 2016;7(44):71400–71416. doi:10.18632/oncotarget.12147
54. Bentz S, Cee A, Endlicher E, et al. Hypoxia induces the expression of transketolase-like 1 in human colorectal cancer. Digestion. 2013;88(3):182–192. doi:10.1159/000355015
55. Hu LH, Yang JH, Zhang DT, et al. The TKTL1 gene influences total transketolase activity and cell proliferation in human colon cancer LoVo cells. Anticancer Drugs. 2007;18(4):427–433. doi:10.1097/CAD.0b013e328013d99e
56. Langbein S, Zerilli M, Zur Hausen A, et al. Expression of transketolase TKTL1 predicts colon and urothelial cancer patient survival: warburg effect reinterpreted. Br J Cancer. 2006;94(4):578–585. doi:10.1038/sj.bjc.6602962
57. Deng J, Li J, Sarde A, et al. Hypoxia-induced vista promotes the suppressive function of myeloid-derived suppressor cells in the tumor microenvironment. Cancer Immunol Res. 2019;7(7):1079–1090. doi:10.1158/2326-6066.CIR-18-0507
58. Joshi S, Liu KX. Macrophage Syk-PI3Kγ inhibits antitumor immunity: SRX3207, a novel dual Syk-PI3K inhibitory chemotype relieves tumor immunosuppression. Mol Cancer Ther. 2020;19(3):755–764. doi:10.1158/1535-7163.MCT-19-0947
59. Toor SM, Sasidharan Nair V, Decock J, et al. Immune checkpoints in the tumor microenvironment. Semin Cancer Biol. 2020;65:1–12. doi:10.1016/j.semcancer.2019.06.021
60. Miao D, Margolis CA, Gao W. Genomic correlates of response to immune checkpoint therapies in clear cell renal cell carcinoma. Science. 2018;359(6377):801–806. doi:10.1126/science.aan5951
61. Zengin Kurt B, Sonmez F, Ozturk D, et al. Synthesis of coumarin-sulfonamide derivatives and determination of their cytotoxicity, carbonic anhydrase inhibitory and molecular docking studies. Eur J Med Chem. 2019;183:111702. doi:10.1016/j.ejmech.2019.111702
62. Alafeefy AM, Ahmad R, Abdulla M, et al. Development of certain new 2-substituted-quinazolin-4-yl-aminobenzenesulfonamide as potential antitumor agents. Eur J Med Chem. 2016;109:247–253. doi:10.1016/j.ejmech.2016.01.001
 © 2023 The Author(s). This work is published and licensed by Dove Medical Press Limited. The full terms of this license are available at https://www.dovepress.com/terms.php and incorporate the Creative Commons Attribution - Non Commercial (unported, v3.0) License.
By accessing the work you hereby accept the Terms. Non-commercial uses of the work are permitted without any further permission from Dove Medical Press Limited, provided the work is properly attributed. For permission for commercial use of this work, please see paragraphs 4.2 and 5 of our Terms.
© 2023 The Author(s). This work is published and licensed by Dove Medical Press Limited. The full terms of this license are available at https://www.dovepress.com/terms.php and incorporate the Creative Commons Attribution - Non Commercial (unported, v3.0) License.
By accessing the work you hereby accept the Terms. Non-commercial uses of the work are permitted without any further permission from Dove Medical Press Limited, provided the work is properly attributed. For permission for commercial use of this work, please see paragraphs 4.2 and 5 of our Terms.