
Back to Journals » Neuropsychiatric Disease and Treatment » Volume 21
Identification of Genes in Diagnosing Major Depressive Disorder with Anorexia Through Bioinformatics Analysis
Authors Guo F, Li Y, Cheng J, Wang X, Hu W, Zhang K, Jing X, Xing J  , Liu Z, Zhang H, Liu P
Received 2 March 2025
Accepted for publication 14 July 2025
Published 30 July 2025 Volume 2025:21 Pages 1533—1547
DOI https://doi.org/10.2147/NDT.S525882
Checked for plagiarism Yes
Review by Single anonymous peer review
Peer reviewer comments 3
Editor who approved publication: Dr Yu-Ping Ning
Fengtao Guo,1,2 Ying Li,2,3 Junxiang Cheng,1,2 Xinxia Wang,1,2 Wei Hu,1,2 Kun Zhang,4 Xushu Jing,1,2 Jinrui Xing,1,2 Zhifen Liu,1 Huanhu Zhang,2,5 Penghong Liu1,2
1Department of Psychiatry, First Hospital of Shanxi Medical University, Taiyuan, Shanxi, People’s Republic of China; 2Shanxi Medical University, Taiyuan, Shanxi, People’s Republic of China; 3School of Basic Medical Sciences, Shanxi Medical University, Taiyuan, Shanxi, People’s Republic of China; 4Shanxi Mental Health Center, Taiyuan Fifth People’s Hospital, Taiyuan, Shanxi, People’s Republic of China; 5Shanxi University of Chinese Medicine, Jinzhong, Shanxi, People’s Republic of China
Correspondence: Huanhu Zhang, Shanxi Medical University, Taiyuan, SX030001, People’s Republic of China, Tel +86-13593166631, Email [email protected] Penghong Liu, Department of Psychiatry, First Hospital of Shanxi Medical University, Taiyuan, SX030001, People’s Republic of China, Tel +86-18634363075, Email [email protected]
Background: Researches have indicated that major depressive disorder (MDD) and anorexia may have overlapping pathogenic mechanisms. In light of this, we endeavored to identify diagnostic gene candidates for MDD in individuals with comorbid anorexia.
Methods: Gene expression data pertaining to MDD and healthy controls (HC) were retrieved from the Gene Expression Omnibus (GEO) database. Utilizing Limma and weighted gene co-expression network analysis (WGCNA), key MDD-associated genes were meticulously screened. Subsequently, these genes were cross-referenced with established anorexia-related genes to pinpoint common genetic factors shared between MDD and anorexia. Further refinement was conducted using Cytoscape software to identify hub-genes. Ultimately, animal experiments were conducted to validate and confirm the findings.
Results: We identified a total of 214 genes that are commonly associated with both MDD and anorexia. These genes were found to be enriched in inflammatory and immune-related pathways. Among these 214 genes, six were distinguished as hub-genes: IL10, ITGAM, PTPRC, IL13, STAT5B, and JAK2. Immune infiltration analysis further revealed that all these hub-genes exhibited associations with multiple immune cell types. Animal experiments demonstrated that, compared to control mice, the model group exhibited significantly elevated expression levels of PTPRC, STAT5B, and JAK2.
Conclusion: Through the application of bioinformatics analysis and animal experimentation, we have pinpointed three hub-genes (PTPRC, STAT5B, and JAK2) that hold potential as both diagnostic biomarkers and therapeutic targets for MDD accompanied with anorexia.
Keywords: major depressive disorder, anorexia, inflammation, bioinformatics analysis, differentially expressed genes
Introduction
Major depressive disorder (MDD) is a prevalent mental health condition distinguished by persistent low mood. According to statistics, around 4.4% of people worldwide suffer from MDD, and this condition is well-known for its frequent recurrences.1 MDD imposes a significant economic burden on individuals and families,2 and it is anticipated to become the second major contributor to the global disease burden by 2030.3 Individualized repetitive transcranial magnetic stimulation (rTMS) based on magnetic resonance imaging (MRI) has already been applied in the treatment of major depressive disorder (MDD),4 and some scholars have formulated optimization strategies for transcranial magnetic stimulation.5 Additionally, studies have demonstrated the efficacy and safety of ketamine and electroconvulsive therapy (ECT) in the treatment of treatment-refractory depression.6 Despite some achievements made in the treatment of MDD, the overall therapeutic efficacy still needs improvement. One of the primary reasons is that the pathogenesis of MDD remains unclear. While the precise pathogenesis of MDD remains elusive at present, there is a broad consensus on the significant role inflammation plays in the onset and progression of this disorder.7
MDD frequently coexists with other physical conditions or somatic symptoms,8 and anorexia is a prevalent comorbidity associated with MDD.9 Research has shown that alleviating anorexia symptoms in patients with comorbid MDD and anorexia can improve depressive symptoms,10 and stimulating the cingulate gyrus below the corpus callosum is an effective treatment for both MDD and anorexia.11 The Cross-Disorder Group of the Psychiatric Genomics Consortium conducted a comprehensive analysis of genomic data across eight psychiatric disorders, including MDD and anorexia. This analysis revealed a substantial amount of genomic overlap among these disorders, indicating the presence of shared genetic mechanisms that may contribute to their pathogenesis.12 Hence, it is plausible that MDD and anorexia share similar underlying pathogenic mechanisms.
While the precise relationship between MDD and anorexia remains elusive, it is unequivocally established that both disorders involve inflammatory and immune processes.7,13 Proinflammatory cytokines can augment neuroinflammatory processes and peripheral inflammation, ultimately inducing depression through their impact on glial cell function, modulation of neurotransmitters, and disruption of the intestinal mucosal barrier.7 Inflammation can lead to anorexia by modulating the levels of appetite-regulating hormones, influencing brain functions that govern hunger and satiety, and through other mechanisms.13 Moreover, our previous research has demonstrated that inflammation is a shared causal factor in both anorexia and MDD.14 Consequently, identifying the shared genetic factors between MDD and anorexia, and examining their associations with inflammatory and immune processes, will enhance our understanding of the distinct features of MDD accompanied with anorexia. This, in turn, may offer a novel foundation for diagnosing and treating this subtype of MDD, as well as patients with comorbid MDD and anorexia.
In our current study, we obtained the MDD dataset from the Gene Expression Omnibus(GEO) database, applied the Limma to identify differentially expressed genes (DEGs), and utilized weighted gene co-expression network analysis (WGCNA) to reveal key module genes related to MDD. By intersecting these genetic data with anorexia-linked genes from GenCards, we were able to uncover the common genetic denominators between MDD and anorexia. We conducted functional enrichment analysis on these intersecting genes and constructed a protein-protein interaction (PPI) network for them. Additionally, we screened for hub genes using Cytoscape. Furthermore, we performed immune infiltration analysis on MDD patients and conducted correlation analysis between the differentially expressed inflammatory factors and the hub genes. Finally, we validated these hub genes through mouse experiments. This study provides valuable information for screening diagnostic markers of MDD accompanied with anorexia.
Material and Methods
Preparation of Gene Sets and Screening for Differentially Expressed Genes
The research process is outlined in Figure S1. We downloaded the series matrix and platform information for GSE5279015 and GSE7682616 from the GEO (https://www.ncbi.nlm.nih.gov/geo). For inclusion in the analysis, we selected data from 10 MDD patients and 12 healthy controls(HC) from the GSE52790 whole blood sample dataset, and similarly, data from 10 MDD patients and 12 HC from the GSE76826 dataset. We merged the GSE52790 and GSE76826 datasets after removing batch effects. Finally, we obtained a normalized gene expression matrix file containing 20 cases of MDD and 24 cases of HC. In July 2024, we input “anorexia” as a keyword into the GenCards website (www.genecards.org) for search, and subsequently obtained a total of 3611 human anorexia-associated genes from the GenCards database, which will be used in our subsequent studies and analyses.
Based on the criteria of |log2Fold change(FC)| > 1.2 and p < 0.05, we screened for differentially expressed genes between MDD patients and HC in the combined dataset using the Limma (version 3.40.6) package in the R software,17 and visualized them using Sangerbox (version 3.0, http://vip.sangerbox.com/).
Constructing of Weighted Gene Co-Expression Network Analysis
Constructing gene co-expression networks to study gene-phenotype relationships using the WGCNA package in R software.18 Firstly, we eliminated 50% of the genes with the lowest median absolute deviation (MAD) values. Secondly, we computed Pearson correlation matrices for all gene pairs and generated a weighted adjacency matrix employing the average chaining technique alongside weighted correlation coefficients. Thirdly, we calculated the neighbor-joining degree using the soft-threshold power method and transformed it into a topological overlap matrix (TOM). We grouped genes with similar expression profiles into modules by utilizing a TOM-based dissimilarity metric on an average linkage hierarchy, ensuring that the hierarchy encompassed at least 50 genome-scale clusters. Subsequently, we computed the dissimilarity among the genes that characterized each module and determined a cut-off point for the module dendrogram to facilitate its integration. Using WGCNA, we identified key modules associated with MDD and created a visualized network of the feature genes within these modules.
Identifying Common Genes Between MDD and Anorexia
To identify common genes that impact both MDD and anorexia, we took the intersection of differential genes obtained from Limma of the combined dataset, the differentially co-expressed genes derived from the WGCNA network, and the 3,611 anorexia-associated genes downloaded from the database.
GO and KEGG Functional Enrichment Analysis
First, we conducted Gene Ontology(GO)19 and Kyoto Encyclopedia of Genes and Genomes(KEGG)20 analyses, applying a significance threshold of p < 0.05, and visualized the results on the Sangerbox platform (http://vip.sangerbox.com/). Subsequently, we further analyzed the common genes that were previously identified through these GO and KEGG analyses.
Protein-Protein Interaction Analysis
We used the STRING database (version 12.0, https://cn.string-db.org/) to study PPI.21 We constructed a PPI network based on the common genes previously identified. Subsequently, we utilized Cytoscape software (version 3.7.2) to identify the key interacting genes within this network. To screen for the most significant genes, we applied four algorithms available in cytoHubba within Cytoscape: MCC (Maximum Clique Centrality), MNC (Maximum Neighborhood Component), EPC (Edge Percolation Component), and Degree.22 Finally, we took the intersection of the top 10 genes obtained from each algorithm to identify the hub-genes.
Immune Infiltration Analysis
We utilized the analytical tools provided by ImmuCellAI to evaluate immune cell infiltration based on gene expression profiling (https://guolab.wchscu.cn/ImmuCellAI).23 Through this platform, we assessed the differences in the infiltration of 24 immune cell types between MDD and HC groups. Subsequently, we employed the Sangerbox platform to create proportional bar graphs depicting the distribution of the 24 immune cell types across all samples. Additionally, we generated violin plots to compare the infiltration levels of these immune cells between the two groups. Ultimately, we conducted a Spearman correlation analysis to examine the relationships between the hub-genes obtained earlier and the immune cells that exhibited significant differences between the two groups.
Animal Experimental Validation
Preparation of Mouse Models
To validate the results of the bioinformatic analysis, we established a co-morbid model of MDD and anorexia in mice by chronic unpredictable mild stress(CUMS).24 The duration of the modeling process was four weeks. The mice in the model group exhibited a significant reduction in body weight and a decrease in food intake exceeding 30% compared to the control group, serving as the criteria for establishing the anorexia model. Following the establishment of the model, behavioral experiments were conducted on the anorexic adult mice to screen for comorbid conditions of anorexia and depression (Figure S2).
A total of 20 male C57 BL/6 J mice, aged 8 weeks, were acquired from Vital River Laboratories in Beijing, China. After a seven-day acclimatization period, all mice were weighed and then randomly assigned to two groups based on their body mass: the healthy control (HC) group and the model group (CUMS group). Throughout the experiment, all mice were reared under standardized conditions, including a fixed 12:12 light/dark cycle (lights on at 08:00) and a constant temperature of 25±1°C, with unlimited access to food and water. During this period, the HC group was housed normally and received no additional treatment. In contrast, the model group was housed in individual cages and subjected to stress treatments in the modeling room. These treatments were conducted daily at 08:00, with 1–2 stressors administered at a time. To ensure the unpredictability of the stressors, the same stressors were not consecutively used (Table 1). At the end of each modeling session, the mice in the model group were moved back to their rearing room.
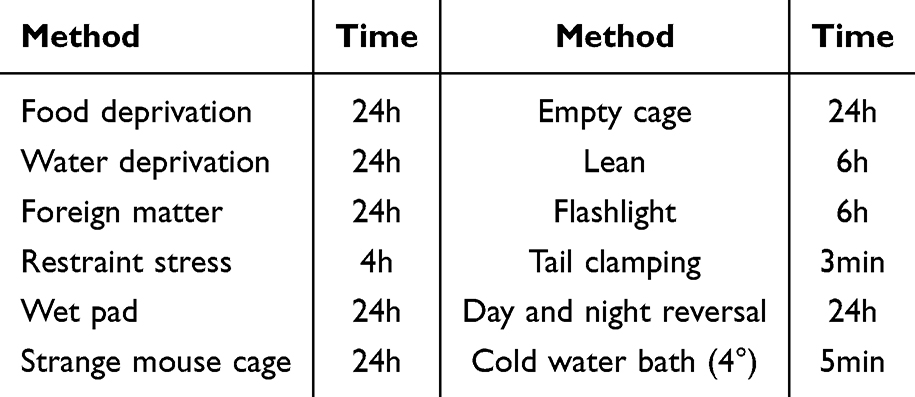 |
Table 1 Source and Duration of Stress |
Detection of Routine Indicators
After modeling the experimental animals, the mice were observed and monitored weekly for coat color, activity level, diet and body weight.
Behavioral Tests
The sucrose preference test(SPT) has been extensively utilized to evaluate the extent of hedonic deficiency, which constitutes a pivotal symptom of depression. Prior to conducting the test, all animals were individually acclimated in captivity for a duration of 48 hours. During this acclimation period, the animals had access to two bottles of water: one containing a 1% sucrose solution and the other plain drinking water. The bottles were exchanged midway through the acclimation phase to ensure consistency, and the animals were provided with a standard diet. Upon completion of the acclimation period, all mice underwent a 12-hour fast, deprived of water but not food. This marked the official commencement of the test. Throughout the testing phase, the animals resumed their diet and were once again presented with two bottles of water-one containing the 1% sucrose solution and the other tap water. The consumption of both water and sucrose was meticulously measured by weighing the bottles before and after administering them to the mice. To mitigate any potential preference bias, the positions of the two bottles were alternated between groups, with a position swap occurring midway through the test. The sucrose preference percentage (%) was calculated using the formula: (sucrose solution consumption)/(water consumption + sucrose solution consumption)*100%.
The forced swimming test(FST) is designed to observe the animal’s response when compelled to swim in a confined space with no escape route. After a certain period, when the animal realizes that escape is hopeless, it ceases struggling and exhibits a state of floating, known as “behavioral despair”. This test is primarily employed for screening antidepressant medications and investigating receptors associated with depression. Prior to the experiment, all animals were transferred to the behavioral room thirty minutes in advance to acclimate to the environment. Subsequently, each mouse was randomly placed in a transparent, cylindrical water tank maintained at room temperature (24°C±1°C) for a total duration of six minutes. The immobility time of the mice was meticulously recorded during the final four minutes of this period. After testing each mouse, the water was replaced, and the tank was dried using a clean paper towel. The test animals were then placed under a heat source (37°C) to restore their body temperature. Notably, a longer duration of immobilization indicates a higher level of depressive-like behavior.
The tail suspension test (TST) is a standardized method for the initial screening of antidepressant drugs, as it exploits the animals’ inability to overcome an abnormal body position, thereby inducing a “behavioral state of despair” characterized by an “immobility state.” Prior to the commencement of the experiment, the mice were securely wrapped with medical tape around the distal one-third of their tails and suspended within a tail suspension box. The behavior of the mice was meticulously recorded for a duration of six minutes, with the immobility time being specifically noted for the final four minutes. Notably, a longer duration of immobility indicates a more severe manifestation of depressive-like behavior in the animals.
Validation of Hub-Genes Through Real-Time Fluorescent Quantitative PCR (qPCR)
Following a four-week modeling period, the efficacy of the model was evaluated. Subsequently, on the following day, the mice were anesthetized using isoflurane gas and euthanized. Brain tissues were then carefully dissected and preserved in a refrigerator at −80°C. Total RNA was extracted utilizing the TransZol Up Plus RNA Kit sourced from Beijing AllStyle Gold Biotechnology Co., Ltd., China. cDNA synthesis was achieved using the One-Step gDNA Removal Kit, also provided by Beijing AllStyle Gold Biotechnology Co., Ltd., China. Amplification of the cDNA was carried out using the PerfecyStart Green qPCR SuperMR system on a fully automated nucleic acid amplification instrument, namely the Gentier 96R. The real-time quantitative PCR was performed using the PerfecyStart Green qPCR SuperMix kit, supplied by Beijing QuanShiJin Biotechnology Co., Ltd., China. The primer sequences utilized are presented in Table 2. Each sample was assayed in triplicate to ensure accuracy. The fold change of the target genes, relative to the corresponding GAPDH endogenous control, was computed using the 2-ΔΔCt method.
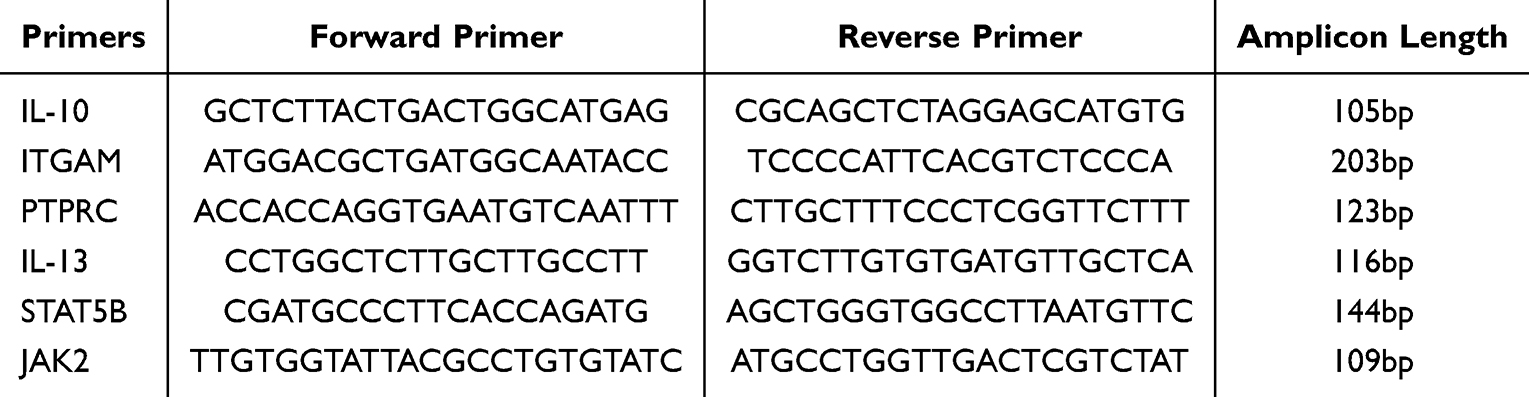 |
Table 2 The List of Primers Used for qPCR |
Statistical Analysis
In this study, statistical analysis was conducted using GraphPad Prism software (version 9.0). Independent sample T-tests or Mann–Whitney U-tests were used to assess statistical significance, with a p-value less than 0.05 considered statistically significant.
Results
Screening for DEGs
By integrating the datasets GSE52790 and GSE76826 and applying a de-batching effect correction, we successfully compiled a consolidated dataset comprising 20 instances of MDD and 24 instances of HC. We identified 1,646 DEGs in the combined MDD dataset, based on the criteria of a p-value < 0.05 and an absolute log2 fold change (|log2FC|) > 1.2. Among these, 1,232 genes were found to be up-regulated, while 414 were down-regulated. The volcano plot depicted in Figure 1a and the heat map presented in Figure 1b visually illustrate the distinct expression patterns exhibited by these DEGs. We employed WGCNA to examine the most pertinent modules within the merged MDD dataset. The soft threshold β was established at 4, taking into account both scale independence and average connectivity. Consequently, we generated clustering dendrograms and module eigenvector clustering maps for both MDD and HC. These analyses yielded a total of 15 gene co-expression modules, each denoted by a distinct color. During the module merging process, a minimum module size of 150 genes was imposed, with a threshold value set at 0.25 (Figure 1c and d). Figure 1e shows a strong correlation between the turquoise module and MDD, with a correlation coefficient of r = 0.71 and a p-value < 0.001. This turquoise module comprises a total of 2,788 genes, prompting us to conduct a more in-depth analysis of these genes. The correlation analysis presented in Figure 1f reveals a positive association between the Module Membership within the turquoise module and the gene significance for MDD, with a correlation coefficient of r = 0.86 and a p-value < 0.001.
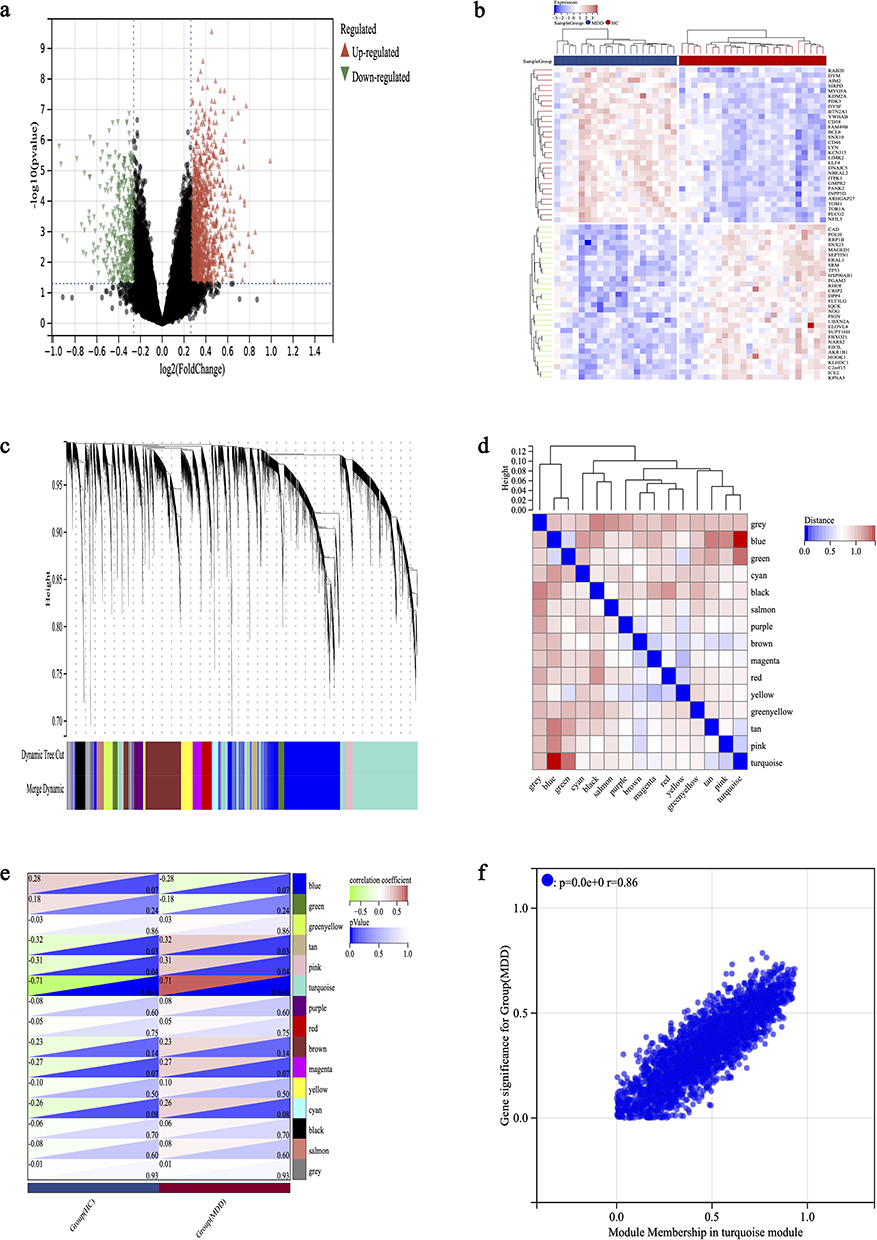 |
Figure 1 Identification of MDD DEGs by Limma and WGCNA analysis. (a) Volcano plot of DEGs, red and blue colors represent up- and down-regulated DEGs, respectively. (b) The heatmap shows the top 30 differentially expressed genes in the MDD dataset, with red and blue representing up- and down-regulation, respectively. (c) Under the gene tree, different colored modules represent different gene co-expression modules. (d) Neighbor-joining heatmap of characterized genes. (e) Heatmap analysis of the correlation between module genes and MDD showed that the turquoise module had the highest correlation with MDD. (f) Correlation plot of module affiliation with gene significance for turquoise module gene (correlation coefficient r = 0.86, p < 0.001). |
Identifying Common Genes Between MDD and Anorexia and Functional Enrichment Analysis
We cross-referenced a comprehensive set of 3,611 human genes associated with anorexia, sourced from the GenCards database, with 1,646 DEGs derived from the previous step on the merged dataset using Limma, as well as with 2,788 genes contained within the turquoise module from our WGCNA analysis. This intersection yielded a total of 214 common genes (Figure 2a). Taking into account these 214 genes as being shared between MDD and anorexia, we subsequently conducted a functional enrichment analysis on these genes. As illustrated in Figure 2b, the results of the KEGG analysis revealed that the common genes are implicated in various processes, including “Th17 cell differentiation”, “T cell receptor signaling pathway”, and “Th1 and Th2 cell differentiation”. The GO analysis indicated that the common genes were involved in “immune system processes”, “immune response”, and “inflammatory response” (Figure 2c). The findings suggested that the shared genes between MDD and anorexia are implicated in immune and inflammatory processes, hinting at a potential common pathogenic mechanism involving the immune system and inflammation for both.
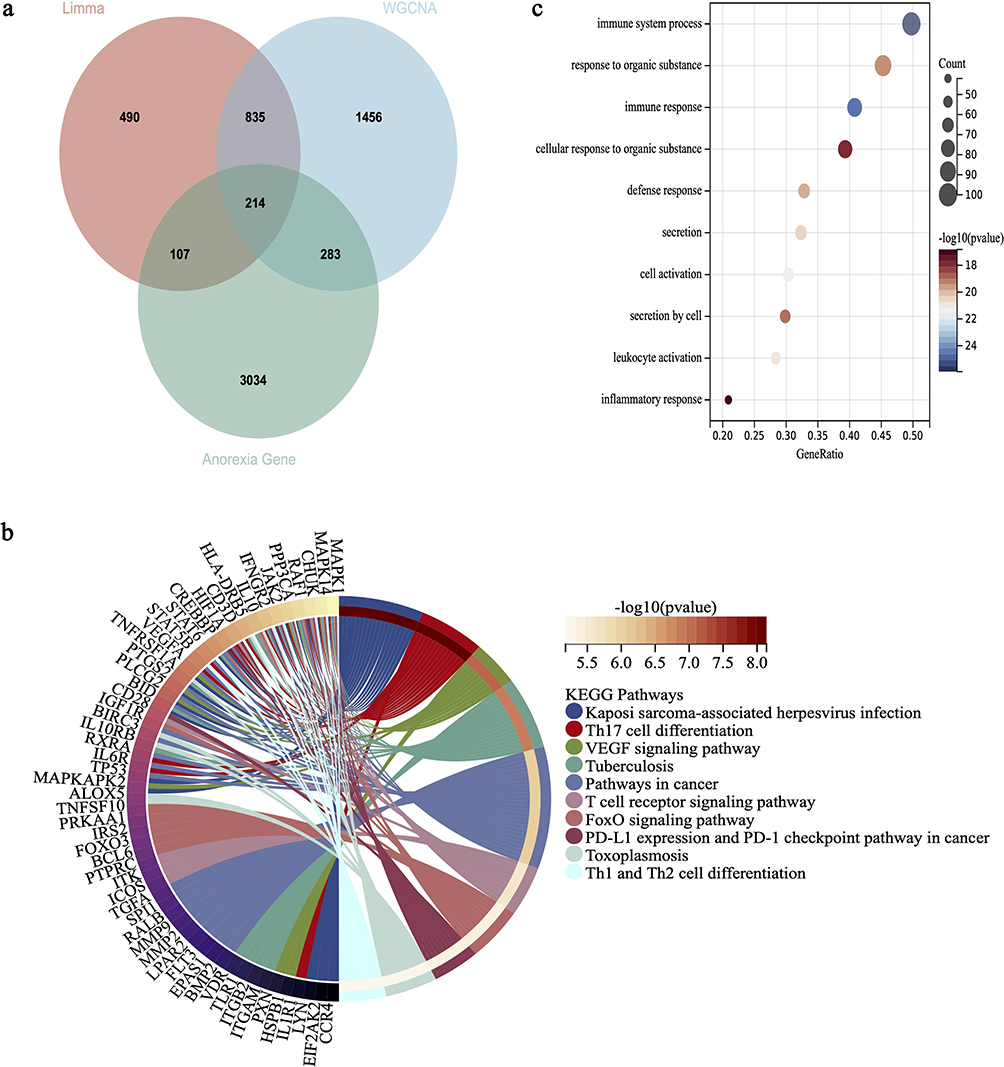 |
Figure 2 Functional enrichment analysis of the intersection of genes related to MDD and anorexia. (a) The Venn diagram displays the 214 DEGs obtained by taking the intersection of genes identified through Limma, WGCNA module genes, and genes related to anorexia. (b) Performing KEGG analysis on the intersecting DEGs, with different colors representing various significant pathways and their associated genes. (c) Performing GO analysis on the intersecting DEGs. The y-axis represents GO terms, and the x-axis represents gene ratio involved in corresponding GO terms, where the size of the circles reflects the number of genes and the color represents the P-value. -Log10(p-value) >1.3 (equivalent to p<0.05) is considered significant. |
Identifying Hub-Genes Through PPI Analysis Using cytoHubba
After excluding common genes that lack connections to other nodes, we constructed a PPI network comprising 212 shared genes on the STRING platform. To identify the most significant genes within this network, we utilized four algorithms from the cytoHubba plugin in Cytoscape: MCC, MNC, EPC, and Degree (Figure S3a–d). We selected the top 10 Co-DEGs for each algorithm, subsequently identified their intersections (Figure S3e), and generated Venn plots to pinpoint six hub genes: IL10, ITGAM, PTPRC, IL13, STAT5B, and JAK2.
Immune Infiltration Analysis and Immune Correlation Analysis
We utilized the ImmuCellAI platform to examine the variations in immune cell populations between 24 MDD patients and HC, encompassing DC cell, B_cell, Monocyte cell, Macrophage cell, NK cell, Neutrophil cell, CD4_T cell, CD8_T cell, NKT cell, Gamma_delta cell, CD4_naive cell, Tr1 cell, nTreg cell, iTreg cell, Th1 cell, Th2 cell, Th17 cell, Tfh cell, CD8_naive cell, Cytotoxic cell, Exhausted cell, MAIT cell, Central_memory cell, Effector_memory cell. The proportions of 24 types of immune cells in the MDD group and the control group are shown in Figure S4a, while Figure S4b illustrated the disparities in these 24 immune cell populations between the MDD and HC groups. Notably, significant differences are observed in the proportions of B_cell, Macrophage cell, Neutrophil cell, CD4_T cell, Tr1 cell, iTreg cell, Tfh cell, CD8_naive cell and MAIT cell between the two groups. Lastly, we conducted a Spearman correlation analysis between the immune cell populations that exhibited differences between the two groups and the six previously identified hub genes (IL10, ITGAM, PTPRC, IL13, STAT5B, and JAK2). The results revealed that these hub genes exhibited correlations with a diverse array of immune cell types (Figure S4c).
Changes in General Indicators, Appetite and Body Weight in a Co-Morbid Model of Depression and Anorexia Mice
During the modeling phase, the control mice maintained an excellent mental state, featuring glossy and smooth fur as well as a healthy appetite. In contrast, the mice in the model group exhibited a poor mental state, characterized by dull and unkempt fur along with a reduced appetite.
To evaluate the effectiveness of the anorexia modeling in mice, we conducted weekly assessments of their dietary intake and body weights. The results presented in Figure 3a demonstrate that, following four weeks of stress modeling, the food intake of mice in the model group progressively decreased over time when compared to the control group. Furthermore, Figure 3b illustrated that when comparing the weekly food intake of mice, a significant reduction in intake was observed in the model group from week 2 onwards, in comparison to the control group (p<0.0001). As depicted in Figure 4a, after four weeks of stress modeling, the mice in the model group exhibited a slower rate of body weight gain over time compared to the control group. Additionally, Figure 4b revealed that when analyzing the change in body weight before and after modeling, the mice in the model group gained weight at a significantly slower pace than those in the control group (p<0.001).
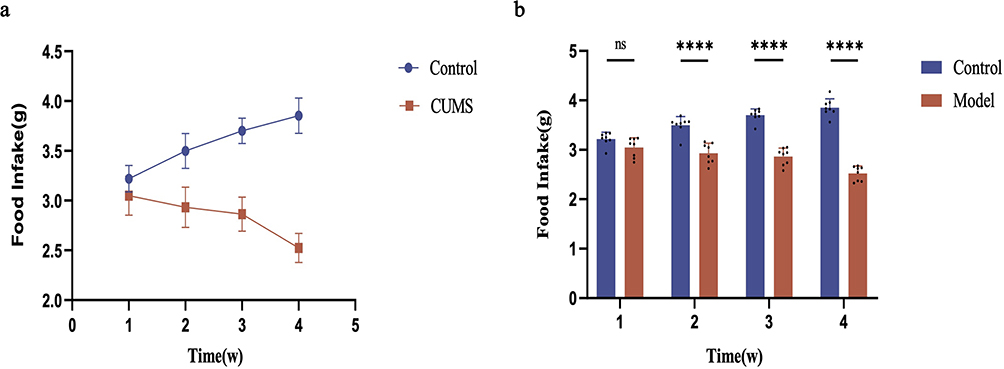 |
Figure 3 Changes in food intake of mice in each group. (a) The growth trend of food intake in two groups of mice during the 4-week modeling. (b) Differences in food intake between the two groups of mice during the 4-week modeling. Compared to the control group: ns indicates p>0.05, **** indicates p<0.0001. |
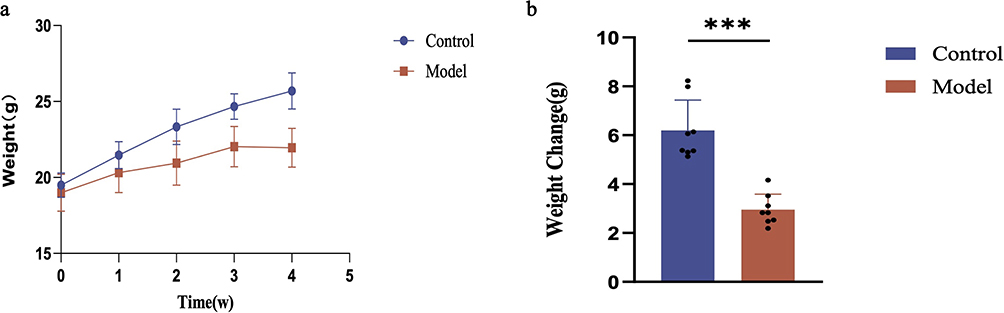 |
Figure 4 Changes in body weight of mice in each group. (a) The growth trend of body weight in two groups of mice during the 4-week modeling. (b) Differences in body weight between the two groups of mice after the 4-week modeling. Compared to the control group: *** indicates p<0.001. |
Behavioral Assessment
To establish a successful mouse model of comorbid anorexia and depression, mice underwent behavioral tests, including SPT, FST, and TST, the day following the final body weight measurement. The results presented in Figure 5a indicate that the mice in the model group exhibited a reduced preference for sugar water, which was significantly lower than that of the control group. Although no significant differences were found in the FST between model and control groups as shown in Figure 5c, Figure 5b demonstrates that the mice in the model group remained immobilized for a significantly longer duration during the TST, showing a notable difference in immobilization time compared to the control group.
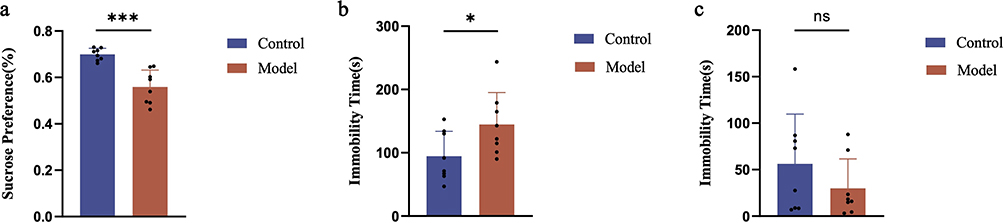 |
Figure 5 Results of behavioral indicators in mice from each group. (a) Results of sucrose preference rate in two groups of mice after 4 weeks of modeling. (b) Results of immobility time in the tail suspension test for two groups of mice after 4 weeks of modeling. (c) Results of immobility time in the forced swimming test for two groups of mice after 4 weeks of modeling. Compared to the control group: ns indicates p>0.05, * indicates p<0.05, *** indicates p<0.001. |
Results of qPCR in Mice
To confirm the findings obtained from the previous experiments, we conducted an analysis of the mRNA expression levels of IL-13, ITGAM, JAK2, PTPRC, STAT5B, and IL-10 in specific brain regions of the mice. As illustrated in Figure 6, the expression levels of JAK2, PTPRC, and STAT5B were significantly upregulated in the brain regions of mice belonging to the model group, in comparison to those in the control group.
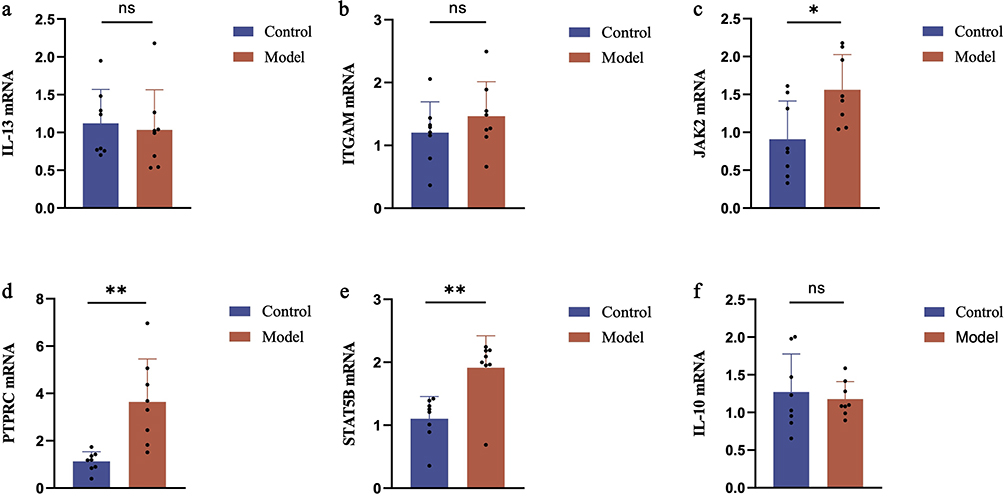 |
Figure 6 mRNA expression profile in mice with comorbid depression and anorexia. The mRNA expression levels of (a) IL-13, (b) ITGAM, (c) JAK2, (d) PTPRC, (e) STAT5B and (f) IL-10 in mice were measured by qRT-PCR. Compared to the control group: ns indicates p>0.05, * indicates p<0.05, ** indicates p<0.01. |
Discussion
Clinical studies have shown elevated levels of pro-inflammatory cytokines in patients with MDD,25,26 while animal experiments have elucidated their direct or indirect effects on brain circuits, behavior, and mood.27 Pro-inflammatory cytokines can induce depression by activating neuroimmune pathways through the stimulation of peripheral immunity, which leads to alterations in microglia and astrocytes. Furthermore, inflammatory factors may impair intestinal mucosal barrier function, enabling intestinal bacteria, endotoxins, and other harmful substances to enter the bloodstream and reach the brain, thereby exacerbating neuroinflammation.7 Some studies have even shown that inflammatory cytokines correlate with the severity of MDD,28 and that anti-inflammatory treatment can improve the symptoms of MDD.29 Currently, the diagnosis and treatment of MDD pose significant challenges, highlighting the importance of identifying suitable diagnostic biomarkers. Given that inflammation also plays a pivotal role in anorexia, and our prior research has demonstrated inflammation as a shared pathogenic mechanism underlying both MDD and anorexia, we conducted a bioinformatics analysis to screen for six crucial genes implicated in both disorders: IL-10, ITGAM, PTPRC, IL-13, STAT5B, and JAK2. We conducted a differential gene expression analysis using the GSE54575 dataset,30 which comprises human brain samples. Our findings revealed that the expression differences of these six genes in the human brain differ from those observed in the blood. This finding underscores the complexity of MDD as a disease, indicating that there could be different mechanisms underlying its development in various tissues. Peripheral blood and the brain are separate physiological settings, and gene expression is regulated by numerous factors, including the types of cells present, the local surroundings, and various signaling routes. Upon validation through animal experiments, it was determined that the expression levels of PTPRC, STAT5B, and JAK2 differed significantly between the two groups among the six screened key genes. These three genes have the potential to serve as diagnostic biomarkers for MDD comorbid with anorexia.
Protein tyrosine phosphatase receptor type C (PTPRC), also known as CD45, is an important regulator of antigen receptor-mediated activation of T and B cells.31 PTPRC levels are elevated in ulcerative colitis, atherosclerosis, depression and other diseases.32,33 Inflammation and immunity constitute the underlying pathologic mechanisms of these diseases, with PTPRC being closely associated with both inflammatory and immune processes.31 Despite the lack of clarity regarding the precise mechanisms involved, aberrant expression or dysfunction of PTPRC has been implicated in a range of inflammation-related diseases.34,35 Both MDD and anorexia are inflammation-related conditions, and our current study indicates that PTPRC may serve as a promising diagnostic biomarker for MDD accompanied with anorexia.
A diverse array of inflammatory factors exerts their effects through the JAK/STAT signaling pathway.36 The JAK/STAT signaling pathway plays a pivotal role in regulating the development, activation, and functionality of immune cells. Furthermore, it possesses the capability to modulate both effective immune responses and inflammatory reactions.37 The JAK family comprises four members: JAK1, JAK2, JAK3, and TYK2, whereas the STAT family encompasses seven members, namely STAT1, STAT2, STAT3, STAT4, STAT5A, STAT5B, and STAT6.37 The JAK/STAT signaling pathway orchestrates a multitude of central nervous system functions that are intimately tied to the pathophysiology of mood disorders. Research has demonstrated that this signaling cascade represents a novel therapeutic target for the treatment of depression.38 Elevated mRNA levels of IL-6, JAK2, and STAT3 observed in a rat model of depression induced by chronic mild stress (CMS) indicate that the IL-6/JAK2/STAT3 signaling pathway may be activated in the context of depression.39 Lipopolysaccharide(LPS) can induce depression by disrupting the JAK2/STAT5 signaling pathway, whereas Erythropoietin (EPO) has the capacity to alleviate depressive symptoms by mitigating this signaling pathway impairment.40 It has also been shown that N-acetylcysteine may exert antidepressant effects by mediating the JAK/STAT pathway.41 Our study showed elevated mRNA levels of JAK2 and STAT5B in mice with MDD accompanied with anorexia. Inflammation is a key factor in malnutrition and may lead to decreased food intake, causing anorexia.13 In the hypothalamus, leptin-induced anorexia requires signaling through JAK-STAT, and leptin-induced anorexia is lost after administration of JAK2 blockers.42 In mouse experiments, anorexia and fat loss were significantly improved in malignant mice after injection of JAK2 inhibitors.43 Experiments in rats have also shown that Liujunzi Decoction (a classical Chinese herbal formula composed of Ren Shen, Bai Zhu, Fu Ling, Ban Xia, Gan Cao, Chen Pi, Sheng Jiang and Da Zao) improves chemotherapy-induced anorexia mainly by inhibiting the JAK-STAT signaling pathway.44 In this study, JAK2 and STAT5B were used as candidate diagnostic biomarkers.
It is well-documented that inflammation and immunity play a crucial role in the pathogenesis of MDD.26,28 Additionally, inflammatory factors are also significant in the development of anorexia.13 Activation of various immune cells (neutrophils, macrophages, natural killer cells, innate lymphocytes) can cause mast cell degranulation, which facilitates antigen uptake and presentation of antigens to adaptive immune cells, resulting in target organ damage.45 The inflammasome is a cytosolic protein complex that serves as a key component of the innate immune system, mediating inflammatory responses. Various innate immune cells (macrophages and monocytes) express inflammasomes.46 Therefore, immune cells can recognize pathogens and activate inflammatory responses through inflammasomes. Mucosal-associated invariant T cells (MAIT) are a type of “innate-like” T cells that express semi-invariant αβ T cell receptors (TCRs). They have the ability to recognize non-peptide antigens presented on MHC class I molecules. Furthermore, MAIT cells can produce pro-inflammatory cytokines and cytotoxic molecules, which contribute to exacerbating inflammation and causing tissue damage.47 In summary, immune cells can trigger immune and inflammatory responses through various pathways. The involvement of the immune system in the inflammatory pathology of MDD remains unclear, but studies have shown alterations in immune cells in MDD patients,48 and inflammation can contribute to depression through multiple pathways.7 Our study showed that B_cell, Macrophage cell, Neutrophil cell, CD4_T cell, Tr1 cell, iTreg cell, Tfh cell, CD8_naive cell, and MAIT cell were higher in the MDD group, which is in line with the results of related studies. In addition to this, our study showed that genes common to MDD and anorexia are closely associated with these differential immune cells. Inflammation and immunity are also critical for anorexia.13 In anorexia, inflammation of the intestinal tract can alter the permeability of the intestinal mucosa, thereby impacting the hunger and satiety center.49 Furthermore, studies have demonstrated that various autoimmune diseases can coexist with anorexia, and treating these autoimmune diseases can lead to improvements in anorexia. This analysis suggests that there may be a shared immune pathway between the two conditions.50 Adolescent women with anorexia exhibit elevated plasma levels of pro-inflammatory parameters and dysfunction in intercellular inflammatory pathways. Moreover, markers of inflammation positively correlate with the severity of the disease.51 Further research has indicated that anorexia induced by inflammation is dependent on cyclooxygenase-2 (COX-2).52 Our study also found that the common differential gene function enrichment in MDD and anorexia was mainly focused on multiple immune, inflammation-related pathways, which is consistent with our previous findings.14
This study ultimately identified three genes (PTPRC, STAT5B, and JAK2) through bioinformatics analysis and animal experiments. These genes may serve as potential candidate genes for the diagnosis of MDD with anorexia. All of these genes are related to inflammation and immunity, highlighting the significant roles of inflammation and immunity in MDD and anorexia. This provides new insights into the diagnosis of MDD accompanied with anorexia.
However, our study has certain limitations. First, the gene expression datasets for MDD came from a small sample of patients and controls. This small size may introduce sampling bias and limit the generalizability of our findings. Future studies should use larger clinical samples to enhance result reliability. Second, our data were from human peripheral blood, which may not fully mirror brain gene expression patterns, the key site of MDD pathology. There are differences between blood and brain gene expression. Future research ought to incorporate multiple tissue or organ samples, such as blood and brain, to validate the relevance of genes. Last, we only employed the qPCR detection method, and more experimental methods can be utilized for validation in future studies.
Conclusion
Through the application of bioinformatics analysis and animal experimentation, we have pinpointed three hub-genes (PTPRC, STAT5B, and JAK2) that hold potential as both diagnostic biomarkers and therapeutic targets for MDD accompanied with anorexia.
Abbreviations
MDD, major depressive disorder; HC, healthy controls; GEO, Gene Expression Omnibus; WGCNA, weighted gene co-expression network analysis; rTMS, repetitive transcranial magnetic stimulation; MRI, magnetic resonance imaging; ECT, electroconvulsive therapy; DEGs, differentially expressed genes; PPI, protein-protein interaction; MAD, median absolute deviation; TOM, topological overlap matrix; GO, Gene Ontology; KEGG, Kyoto Encyclopedia of Genes and Genomes; MCC, Maximum Clique Centrality; MNC, Maximum Neighborhood Component; EPC, Edge Percolation Component; CUMS, chronic unpredictable mild stress; SPT, sucrose preference test; FST, forced swimming test; TST, tail suspension test; qPCR, Real-Time Fluorescent Quantitative PCR; PTPRC, Protein tyrosine phosphatase receptor type C; CMS, chronic mild stress; LPS, Lipopolysaccharide; EPO, Erythropoietin; MAIT, Mucosal-associated invariant T cells; TCRs, T cell receptors; COX-2, cyclooxygenase-2.
Data Sharing Statement
All data are available upon reasonable request of the corresponding author.
Ethics Approval and Consent to Participate
The animal experiments in this study were approved by the Ethical Review Committee for Laboratory Animal Welfare at the First Hospital of Shanxi Medical University (Approval No.: DWLL-2024-035) and complied with the Chinese National Laboratory Animal-Guidelines for Ethical Review of Animal Welfare (GB/T35892-2018). This study utilized data obtained from public databases. In accordance with Items 1 and 2 of Article 32 of China’s ‘Ethical Review Measures for Life Sciences and Medical Research Involving Human Subjects’ (issued February 18, 2023), this research qualifies for institutional ethics approval exemption as it: (1) employs legally authorized, open-access data for which original informed consent was obtained by the data contributors, and (2) introduces no additional privacy concerns or ethical risks during analysis.
Acknowledgments
The authors are deeply appreciative of all individuals who have contributed to this research.
Author Contributions
All authors made a significant contribution to the work reported, whether that is in the conception, study design, execution, acquisition of data, analysis and interpretation, or in all these areas; took part in drafting, revising or critically reviewing the article; gave final approval of the version to be published; have agreed on the journal to which the article has been submitted; and agree to be accountable for all aspects of the work.
Funding
This study was supported by the National Natural Science Foundation of the China Youth Program (82201691), the National Natural Science Foundation of China (82471558), the Free Exploration Program of the Science and Technology Department of Shanxi Province (20210302124193), the Health Commission research project of Shanxi Provincia l(2023037) and the Free Exploration Program of the Science and Technology Department of Shanxi Province (20210302123243).
Disclosure
The authors declare that they have no competing financial interests or personal relationships that could have appeared to influence the work reported in this paper.
References
1. Herrman H, Patel V, Kieling C. et al. Time for united action on depression: a Lancet-World Psychiatric Association Commission. Lancet. 2022;399(10328):957–1022. doi:10.1016/S0140-6736(21)02141-3
2. Greenberg P, Chitnis A, Louie D, et al. The Economic Burden of Adults with Major Depressive Disorder in the United States. Adv Ther. 2023;40(10):4460–4479. doi:10.1007/s12325-023-02622-x
3. Roy B, Dunbar M, Shelton RC, Dwivedi Y. Identification of MicroRNA-124-3p as a Putative Epigenetic Signature of Major Depressive Disorder. Neuropsychopharmacology. 2017;42(4):864–875. doi:10.1038/npp.2016.175
4. Yuan S, Luo X, Zhang B. Individualized Repetitive Transcranial Magnetic Stimulation for Depression Based on Magnetic Resonance Imaging. Alpha Psychiatry. 2023;24(6):273–275. doi:10.5152/alphapsychiatry.2023.231412
5. Wen KS, Zheng W. Optimization Strategies of Transcranial Magnetic Stimulation in Major Depressive Disorder. Alpha Psychiatry. 2023;24(6):270–272. doi:10.5152/alphapsychiatry.2023.231401
6. Huang XB, Zheng W. Ketamine and Electroconvulsive Therapy for Treatment-Refractory Depression. Alpha Psychiatry. 2023;24(6):244–246. doi:10.5152/alphapsychiatry.2023.231358
7. Kouba BR, de Araujo Borba L, Borges de Souza P, Gil-Mohapel J, Rodrigues ALS. Role of Inflammatory Mechanisms in Major Depressive Disorder: from Etiology to Potential Pharmacological Targets. Cells. 2024;13(5):423. doi:10.3390/cells13050423
8. Berk M, Kohler-Forsberg O, Turner M, et al. Comorbidity between major depressive disorder and physical diseases: a comprehensive review of epidemiology, mechanisms and management. World Psychiatry. 2023;22(3):366–387. doi:10.1002/wps.21110
9. Panero M, Marzola E, Tamarin T, Brustolin A, Abbate-Daga G. Comparison between inpatients with anorexia nervosa with and without major depressive disorder: clinical characteristics and outcome. Psychiatry Res. 2021;297:113734. doi:10.1016/j.psychres.2021.113734
10. Cassioli E, Rossi E, Martelli M, et al. Longitudinal Coupling between Eating Disorder Psychopathology and Depression in Patients with Anorexia Nervosa and Bulimia Nervosa Treated with Enhanced Cognitive Behavior Therapy: a One-Year Follow-Up Study. Brain Sci. 2023;13(4):535. doi:10.3390/brainsci13040535
11. Teixeira SA, Moreira JLS, Sousa NRT, et al. Molecular basis and clinical perspectives of deep brain stimulation for major depressive disorder. J Cereb Blood Flow Metab. 2022;42(4):683–685. doi:10.1177/0271678X221074279
12. Cross-Disorder Group of the Psychiatric Genomics Consortium. Electronic address pmhe, Cross-Disorder Group of the Psychiatric Genomics C. Genomic Relationships, Novel Loci, and Pleiotropic Mechanisms across Eight Psychiatric Disorders. Cell. 2019;179(7):1469–1482e11. doi:10.1016/j.cell.2019.11.020.
13. Stumpf F, Keller B, Gressies C, Schuetz P. Inflammation and Nutrition: friend or Foe? Nutrients. 2023;15(5):1159. doi:10.3390/nu15051159
14. Guo F, Jing L, Xu Y, et al. Gut microbiota and inflammatory factor characteristics in major depressive disorder patients with anorexia. BMC Psychiatry. 2024;24(1):334. doi:10.1186/s12888-024-05778-0
15. Liu Z, Li X, Sun N, et al. Microarray profiling and co-expression network analysis of circulating lncRNAs and mRNAs associated with major depressive disorder. PLoS One. 2014;9(3):e93388. doi:10.1371/journal.pone.0093388
16. Miyata S, Kurachi M, Okano Y, et al. Blood Transcriptomic Markers in Patients with Late-Onset Major Depressive Disorder. PLoS One. 2016;11(2):e0150262. doi:10.1371/journal.pone.0150262
17. Ritchie ME, Phipson B, Wu D, et al. limma powers differential expression analyses for RNA-sequencing and microarray studies. Nucleic Acids Res. 2015;43(7):e47. doi:10.1093/nar/gkv007
18. Langfelder P, Horvath S. WGCNA: an R package for weighted correlation network analysis. BMC Bioinf. 2008;9:559. doi:10.1186/1471-2105-9-559
19. The Gene Ontology C. The Gene Ontology Resource: 20 years and still GOing strong. Nucleic Acids Res. 2019;47(D1):D330–D338. doi:10.1093/nar/gky1055.
20. Kanehisa M, Goto S. KEGG: Kyoto Encyclopedia of Genes and Genomes. Nucleic Acids Res. 2000;28(1):27–30. doi:10.1093/nar/28.1.27
21. von Mering C, Huynen M, Jaeggi D, Schmidt S, Bork P, Snel B. STRING: a database of predicted functional associations between proteins. Nucleic Acids Res. 2003;31(1):258–261. doi:10.1093/nar/gkg034
22. Shannon P, Markiel A, Ozier O, et al. Cytoscape: a software environment for integrated models of biomolecular interaction networks. Genome Res. 2003;13(11):2498–2504. doi:10.1101/gr.1239303
23. Miao YR, Zhang Q, Lei Q, et al. ImmuCellAI: a Unique Method for Comprehensive T-Cell Subsets Abundance Prediction and its Application in Cancer Immunotherapy. Adv Sci. 2020;7(7):1902880. doi:10.1002/advs.201902880
24. Jiao H, Fan Y, Gong A, Li T, Fu X, Yan Z. Xiaoyaosan ameliorates CUMS-induced depressive-like and anorexia behaviors in mice via necroptosis related cellular senescence in hypothalamus. J Ethnopharmacol. 2024;318(Pt A):116938. doi:10.1016/j.jep.2023.116938
25. Bravi B, Melloni EMT, Paolini M, et al. Choroid plexus volume is increased in mood disorders and associates with circulating inflammatory cytokines. Brain Behav Immun. 2024;116:52–61. doi:10.1016/j.bbi.2023.11.036
26. Xu Y, Liang J, Sun Y, et al. Serum cytokines-based biomarkers in the diagnosis and monitoring of therapeutic response in patients with major depressive disorder. Int Immunopharmacol. 2023;118:110108. doi:10.1016/j.intimp.2023.110108
27. Barnes J, Mondelli V, Pariante CM. Genetic Contributions of Inflammation to Depression. Neuropsychopharmacology. 2017;42(1):81–98. doi:10.1038/npp.2016.169
28. Min X, Wang G, Cui Y, et al. Association between inflammatory cytokines and symptoms of major depressive disorder in adults. Front Immunol. 2023;14:1110775. doi:10.3389/fimmu.2023.1110775
29. Su WJ, Hu T, Jiang CL. Cool the Inflamed Brain: a Novel Anti-inflammatory Strategy for the Treatment of Major Depressive Disorder. Curr Neuropharmacol. 2024;22(5):810–842. doi:10.2174/1570159X21666230809112028
30. Chang LC, Jamain S, Lin CW, Rujescu D, Tseng GC, Sibille E. A conserved BDNF, glutamate- and GABA-enriched gene module related to human depression identified by coexpression meta-analysis and DNA variant genome-wide association studies. PLoS One. 2014;9(3):e90980. doi:10.1371/journal.pone.0090980
31. Al Barashdi MA, Ali A, McMullin MF, Mills K. Protein tyrosine phosphatase receptor type C (PTPRC or CD45). J Clin Pathol. 2021;74(9):548–552. doi:10.1136/jclinpath-2020-206927
32. Huang P, Yan L, Li Z, et al. Potential shared gene signatures and molecular mechanisms between atherosclerosis and depression: evidence from transcriptome data. Comput Biol Med. 2023;152:106450. doi:10.1016/j.compbiomed.2022.106450
33. Huang J, Wang F, Tang X. Uncovering the shared molecule and mechanism between ulcerative colitis and atherosclerosis: an integrative genomic analysis. Front Immunol. 2023;14:1219457. doi:10.3389/fimmu.2023.1219457
34. Allen ME, Young SP, Michell RH, Bacon PA. Altered T lymphocyte signaling in rheumatoid arthritis. Eur J Immunol. 1995;25(6):1547–1554. doi:10.1002/eji.1830250612
35. Yacyshyn BR, Pilarski LM. Expression of CD45RO on circulating CD19+ B-cells in Crohn’s disease. Gut. 1993;34(12):1698–1704. doi:10.1136/gut.34.12.1698
36. Gandolfo S, Ciccia F. JAK/STAT Pathway Targeting in Primary Sjogren Syndrome. Rheumatol Immunol Res. 2022;3(3):95–102. doi:10.2478/rir-2022-0017
37. Lv Y, Qi J, Babon JJ, et al. The JAK-STAT pathway: from structural biology to cytokine engineering. Signal Transduct Target Ther. 2024;9(1):221. doi:10.1038/s41392-024-01934-w
38. Shariq AS, Brietzke E, Rosenblat JD, et al. Therapeutic potential of JAK/STAT pathway modulation in mood disorders. Rev Neurosci. 2018;30(1):1–7. doi:10.1515/revneuro-2018-0027
39. Guan X, Wang Q, Liu M, Sun A, Li X. Possible Involvement of the IL-6/JAK2/STAT3 Pathway in the Hypothalamus in Depressive-Like Behavior of Rats Exposed to Chronic Mild Stress. Neuropsychobiology. 2021;80(4):279–287. doi:10.1159/000509908
40. Luo Y, Ali T, Liu Z, et al. EPO prevents neuroinflammation and relieves depression via JAK/STAT signaling. Life Sci. 2023;333:122102. doi:10.1016/j.lfs.2023.122102
41. Al-Samhari MM, Al-Rasheed NM, Al-Rejaie S, et al. Possible involvement of the JAK/STAT signaling pathway in N-acetylcysteine-mediated antidepressant-like effects. Exp Biol Med. 2016;241(5):509–518. doi:10.1177/1535370215619707
42. Morton GJ, Blevins JE, Kim F, Matsen M, Figlewicz DP. The action of leptin in the ventral tegmental area to decrease food intake is dependent on Jak-2 signaling. Am J Physiol Endocrinol Metab. 2009;297(1):E202–10. doi:10.1152/ajpendo.90865.2008
43. Arora G, Gupta A, Guo T, et al. JAK Inhibitors Suppress Cancer Cachexia-Associated Anorexia and Adipose Wasting in Mice. JCSM Rapid Commun. 2020;3(2):115–128. doi:10.1002/rco2.24
44. Dai Y, Chen S, Li Y, Zhang G, Bi P, Nie K. Liujunzi Decoction ameliorated cisplatin-induced anorexia by inhibiting the JAK-STAT signaling pathway and coordinating anorexigenic and orexigenic neuropeptides in rats. J Ethnopharmacol. 2022;285:114840. doi:10.1016/j.jep.2021.114840
45. Bernard JK, Marakovits C, Smith LG, Francis H. Mast Cell and Innate Immune Cell Communication in Cholestatic Liver Disease. Semin Liver Dis. 2023;43(2):226–233. doi:10.1055/a-2104-9034
46. Zhang Z, Zhao L, Zhou X, Meng X, Zhou X. Role of inflammation, immunity, and oxidative stress in hypertension: new insights and potential therapeutic targets. Front Immunol. 2022;13:1098725. doi:10.3389/fimmu.2022.1098725
47. Waterholter A, Wunderlich M, Turner JE. MAIT cells in immune-mediated tissue injury and repair. Eur J Immunol. 2023;53(12):e2350483. doi:10.1002/eji.202350483
48. Kohler CA, Freitas TH, Maes M, et al. Peripheral cytokine and chemokine alterations in depression: a meta-analysis of 82 studies. Acta Psychiatr Scand. 2017;135(5):373–387. doi:10.1111/acps.12698
49. Kingsbury C, Shear A, Heyck M, et al. Inflammation-relevant microbiome signature of the stroke brain, gut, spleen, and thymus and the impact of exercise. J Cereb Blood Flow Metab. 2021;41(12):3200–3212. doi:10.1177/0271678X211039598
50. Sirufo MM, Magnanimi LM, Ginaldi L, De Martinis M. Anorexia nervosa and autoimmune comorbidities: a bidirectional route? CNS Neurosci Ther. 2022;28(12):1921–1929. doi:10.1111/cns.13953
51. Caso JR, Graell M, Navalon A, et al. Dysfunction of inflammatory pathways in adolescent female patients with anorexia nervosa. Prog Neuropsychopharmacol Biol Psychiatry. 2020;96:109727. doi:10.1016/j.pnpbp.2019.109727
52. Nilsson A, Wilhelms DB, Mirrasekhian E, Jaarola M, Blomqvist A, Engblom D. Inflammation-induced anorexia and fever are elicited by distinct prostaglandin dependent mechanisms, whereas conditioned taste aversion is prostaglandin independent. Brain Behav Immun. 2017;61:236–243. doi:10.1016/j.bbi.2016.12.007
 © 2025 The Author(s). This work is published and licensed by Dove Medical Press Limited. The
full terms of this license are available at https://www.dovepress.com/terms
and incorporate the Creative Commons Attribution
- Non Commercial (unported, 4.0) License.
By accessing the work you hereby accept the Terms. Non-commercial uses of the work are permitted
without any further permission from Dove Medical Press Limited, provided the work is properly
attributed. For permission for commercial use of this work, please see paragraphs 4.2 and 5 of our Terms.
© 2025 The Author(s). This work is published and licensed by Dove Medical Press Limited. The
full terms of this license are available at https://www.dovepress.com/terms
and incorporate the Creative Commons Attribution
- Non Commercial (unported, 4.0) License.
By accessing the work you hereby accept the Terms. Non-commercial uses of the work are permitted
without any further permission from Dove Medical Press Limited, provided the work is properly
attributed. For permission for commercial use of this work, please see paragraphs 4.2 and 5 of our Terms.