")
Back to Journals » Cancer Management and Research » Volume 12
Identification of G2 and S Phase-Expressed-1 as a Potential Biomarker in Patients with Prostate Cancer
Authors Xiong J, Zhang J, Li H
Received 19 July 2020
Accepted for publication 28 August 2020
Published 28 September 2020 Volume 2020:12 Pages 9259—9269
DOI https://doi.org/10.2147/CMAR.S272795
Checked for plagiarism Yes
Review by Single anonymous peer review
Peer reviewer comments 2
Editor who approved publication: Professor Seema Singh
Jian Xiong,1 Jianzhong Zhang,2 Hongjun Li1
1Department of Urology, Peking Union Medical College Hospital, Peking Union Medical College, Chinese Academy of Medical Sciences, Beijing 100730, People’s Republic of China; 2Department of Urology, Beijing Friendship Hospital, Capital Medical University, Beijing 100050, People’s Republic of China
Correspondence: Hongjun Li
Department of Urology, Peking Union Medical College Hospital, Peking Union Medical College, Chinese Academy of Medical Sciences, 1 Shuaifuyuan, Dongcheng District, Beijing 100730, People’s Republic of China
Email [email protected]
Jianzhong Zhang
Department of Urology, Beijing Friendship Hospital, Capital Medical University, No. 95 Yong-An Road, Xicheng District, Beijing 100050, People’s Republic of China
Email [email protected]
Background: This study aimed to predict and explore the possible clinical value and mechanism of genetic markers in prostate cancer (PCa) using a bioinformatics analysis method.
Materials and Methods: The RNA-seq data were downloaded from The Cancer Genome Atlas (TCGA) database to identify the differentially expressed genes (DEGs). The hub genes were screened by building protein–protein interaction (PPI) subnetworks with four topological analysis methods. The overall survival analysis of hub genes was conducted using Kaplan–Meier curves. Furthermore, the bioinformatics results were confirmed in 102 PCa samples collected in our hospital. Gene Set Enrichment Analysis (GSEA) was performed to provide information about the molecular mechanisms underlying PCa.
Results: Among 13 hub genes, the high expression of GTSE1 or KIF18B was associated with worse overall survival according to the TCGA samples. Immunoreactive scores for GTSE1 staining were significantly higher in PCa tissues than in paracancerous tissues (P< 0.01). The overall survival time of patients with high GTSE1 expression was shorter than that of patients with low GTSE1 expression (P=0.015). GSEA demonstrated that high GTSE1 expression was mainly enriched in the cell cycle (P< 0.001), DNA replication (P< 0.001), mismatch repair (P< 0.001), and p53 signaling pathway (P< 0.001).
Conclusion: GTSE1 expression was significantly high in PCa and associated with poor prognosis. GTSE1 may serve as a potential biomarker and therapeutic target in PCa patients.
Keywords: prostate cancer, GTSE1, bioinformatics analysis, prognosis
Introduction
Prostate cancer (PCa) is the most prevalent non-skin malignancy and the fifth leading cause of cancer-related mortality, affecting approximately 15% of the male population.1 PCa is very heterogeneous, ranging from indolent to highly aggressive. There are effective treatments for localized PCa, but it is significantly difficult to treat patients with aggressive and metastatic PCa. Serum prostate-specific antigen (PSA) has been widely applied as a biomarker for the diagnosis and prognosis of PCa. However, PSA screening has led to overdiagnosis and overtreatment of PCa due to a lack of specificity and poor ability to reflect the aggressiveness of PCa.2 In view of this limitation, PSA cannot be used as a sole criterion.3 Therefore, there is an urgent need for more accurate markers for the prognosis assessment of PCa patients.
Currently, there are two research strategies for screening prognostic biomarkers in cancer patients. The first is to conduct conventional experiments on the validation of reported proteins that affect the development and progression of different cancers. For example, it has been reported that the expression levels of CtBP2 and BUB1B are closely related to the prognosis of PCa.4,5 The second is to screen and identify key genes by analyzing gene expression profiles in tumor tissue samples. For example, Yoshie et al identified PEG10 as a candidate biomarker for shorter survival of patients with PCa using The Cancer Genome Atlas (TCGA) database.6 With the advances of high-throughput sequencing and microarray technologies, the second strategy has been widely applied in screening biomarkers for the diagnosis and prognosis of different cancers. However, false-positive rates in microarray and high-throughput sequencing analyses make it difficult to use the results. To improve this disadvantage, our study analyzed the genome-wide data in the TCGA database using four different topological analysis methods to identify the most important hub genes. These different topological analysis methods can provide more biological information according to different scoring strategies and topological features. Furthermore, we also collected 102 PCa samples and the paired adjacent tissues in our hospital to confirm the results of the bioinformatics analysis.
In our study, G2 and S phase-expressed-1 (GTSE1) was identified as the most important hub gene in PCa. GTSE1 is a cell cycle-related protein that has been reported to be associated with different kinds of cancers.7 Subhash et al found that GTSE1 is a biomarker for chemoresistance in gastric cancer. In cisplatin-treated gastric cancer cells, knockdown of GTSE1 inhibited cell proliferation through the p53 signaling pathway.8 In non-small-cell lung cancer, knockdown of GTSE1 enhanced radiosensitivity through the DNA damage repair pathway.9 Wu et al reported that GTSE1 promoted migration and invasion through epithelial-to-mesenchymal transition (EMT) modulation and was associated with poor prognosis in hepatocellular carcinoma.10 However, the role of GTSE1 in PCa has not been studied until now.
The aims of our study were to screen and identify potential biomarkers related to the prognosis of PCa by bioinformatics analysis and to validate the identified biomarkers in patients who underwent radical prostatectomy in our hospital. Moreover, we used the Gene Set Enrichment Analysis (GSEA) to investigate the Kyoto Encyclopedia of Genes and Genomes (KEGG) pathways11 related to the identified genes. GSEA might provide information for future research about the molecular mechanisms underlying PCa to discover potential therapeutic targets.
Materials and Methods
Data Processing
RNA sequencing (RNA-seq) data were downloaded from the TCGA database,12 which included 483 PCa samples and 51 paracancerous samples. The study adheres to the TCGA publication guidelines. EdgerR (version 3.6) was downloaded from Bioconductor and used to screen differentially expressed genes (DEGs).13 DEGs meeting the criteria of |fold change|≥4 and P≤0.01 were regarded as statistically significant. A volcano plot was constructed to present the DEGs. Gene Ontology (GO)14 and KEGG analyses of these DEGs were performed based on the Database for Annotation, Visualization and Integrated Discovery (DAVID).15
Building the Protein–Protein Interaction (PPI) Network and Identifying Hub Genes
The protein–protein interaction (PPI) network of the DEGs was performed by the Search Tool for the Retrieval of Interacting Genes (STRING) online database,16 and an interaction with a combined score>0.4 was considered statistically significant. Cytoscape (version 3.7.2) was applied to visualize the PPI network.17 The plug-in Molecular Complex Detection (MCODE) plugin was used to identify the most significant module in the PPI network (MCODE scores >5, degree cut-off=2, node score cut-off=0.2, max depth=100, and k-score=2).18 Four subnetworks were constructed using different topological analysis methods, namely the maximum neighborhood component (MNC), density of maximum neighborhood component (DMNC), maximal clique centrality (MCC) and degree method.19 The biological process analysis of hub genes was conducted by the Biological Networks Gene Oncology tool (BiNGO) plugin of Cytoscape.20 Hierarchical clustering of hub genes was performed by the heatmap.2 function of R software. The overall survival analysis of hub genes was conducted using Kaplan–Meier curves in the Gene Expression Profiling Interactive Analysis (GEPIA) online tool.21 The relationship between expression patterns and Gleason scores was analyzed using the UALCAN online tool.22
Patients and Tissue Specimens
Tissue samples, including 102 PCa and paired adjacent tissues, were collected from patients who underwent radical prostatectomy at the Department of Urology of Peking Union Medical College Hospital from May 2010 to March 2012. None of the patients had received chemotherapy or radiation therapy prior to surgery. The Gleason scores and pathological stages of the PCa specimens were confirmed by two pathologists. Clinical data were collected from the medical records of these patients. The study was approved by the Medical Ethics Committee of Peking Union Medical College Hospital (No. S-214) and was performed in accordance with the Declaration of Helsinki and its later amendments. All the patients provided informed consent for their tissues and data to be used in the study.
Immunohistochemical Staining
Immunohistochemistry (IHC) staining was performed to detect the GTSE1 expression in PCa tissues. Briefly, after being placed in an oven (65°C) for 40 min, the paraffin-embedded tissues were cut into 4 um sections, deparaffined with xylene and rehydrated with graded alcohol. Next, endogenous peroxidase blocking and antigenic retrieval were conducted sequentially. The tissue slides were incubated with anti-GTSE antibody (1:100, Abcam, USA) in a moist chamber at 4°C for 12 h, and then, anti-rabbit secondary antibody was added to the slides, which were then incubated at 37°C for 30 min. After that, samples were further incubated with streptavidin-horseradish peroxidase conjugate, developed with DAB, stained with Mayer’s hematoxylin, and dehydrated. Finally, the slides were sealed with neutral size and visualized under an Olympus CX31 microscope (Olympus, Center Valley, PA). The IHC results were assessed independently by two pathologists who were blinded to the clinical features of the PCa patients. The H-score system was used to semiquantify the results of IHC. The intensity of GTSE1-positive cells was scored as 0 (negative), 1 (weak), 2 (moderate), or 3 (strong). The percentage (0–100%) of stained cells was multiplied by the dominant intensity pattern of staining (0–3). Thus, the H-score values ranged from 0 to 300. The expression of GTSE1 was dichotomized by median value.
Gene Set Enrichment Analysis
The expression profile data of PCa patients from the TCGA database were classified into the high and low GTSE1 expression groups and then analyzed with GSEA (version 4.0).23 The kegg.v6.1.symbols.gmt was downloaded from the MsigDB database of the GSEA website. In our study, GSEA was performed with 1000 random combinations.
Statistical Analysis
Data were analyzed with SPSS 19.0 (IBM, USA). Student’s t-test was conducted to analyze the measurement data. The counting data were analyzed with the chi-squared test or Fisher’s exact test. Survival curves were constructed with the Kaplan–Meier method and analyzed with the Log rank test. Gene clusters with a false discovery rate (FDR)<0.25 and P value<0.05 were regarded as significantly enriched genes for GSEA.
Results
Identification of DEGs
Based on the RNA-seq data from the TCGA Prostate Adenocarcinoma (TCGA-PRAD) project, 428 DEGs were obtained. Among these DEGs in PCa, 130 DEGs were upregulated and 298 DEGs were downregulated. A volcano plot was constructed to visualize the distribution of these DEGs (Figure 1A).
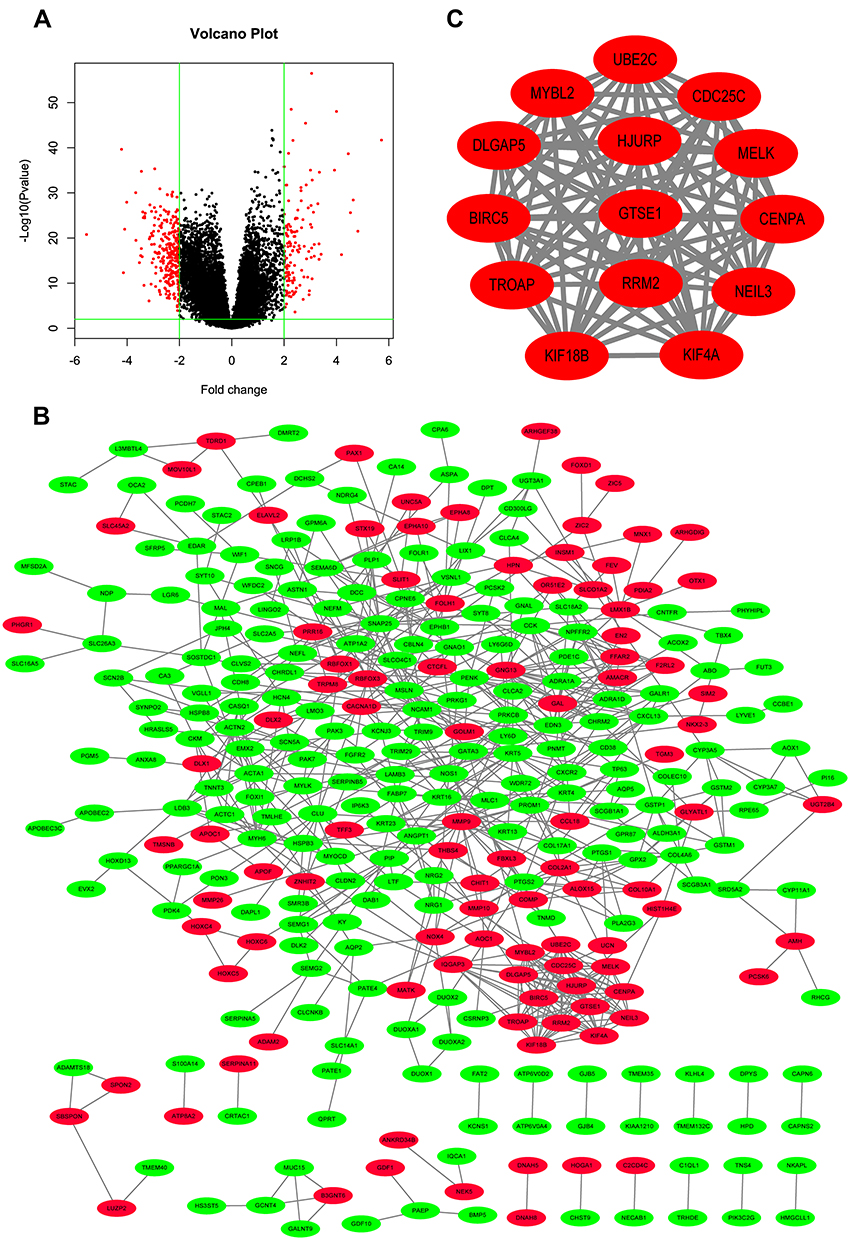 |
Figure 1 Differentially expressed genes identified in samples from the TCGA. (A) Volcano plot of the differentially expressed genes in patients with prostate adenocarcinoma included in The Cancer Genome Atlas database. The green vertical lines represent 4-fold upregulation and downregulation, and the horizontal line represents a P-value of 0.01. (B) Construction of protein–protein interaction network. Upregulated genes are marked in red; down-regulated genes are marked in green. PPI enrichment p value < 1.0e-16. (C) PPI network of the most significant module with 14 nodes and 89 edges. PPI enrichment p value < 1.0e-16. |
GO and KEGG Analyses of DEGs
To analyze the biological function of these DEGs, GO and KEGG analyses were conducted using DAVID. GO analysis demonstrated that these DEGs were significantly enriched in protein binding, cellular process, protein metabolic process, DNA binding, cell cycle, and cell proliferation (Table 1). KEGG pathway analysis revealed that the DEGs were significantly enriched in chemical carcinogenesis, focal adhesion, cGMP-PKG signaling pathway, and p53 signaling pathway (Table 1).
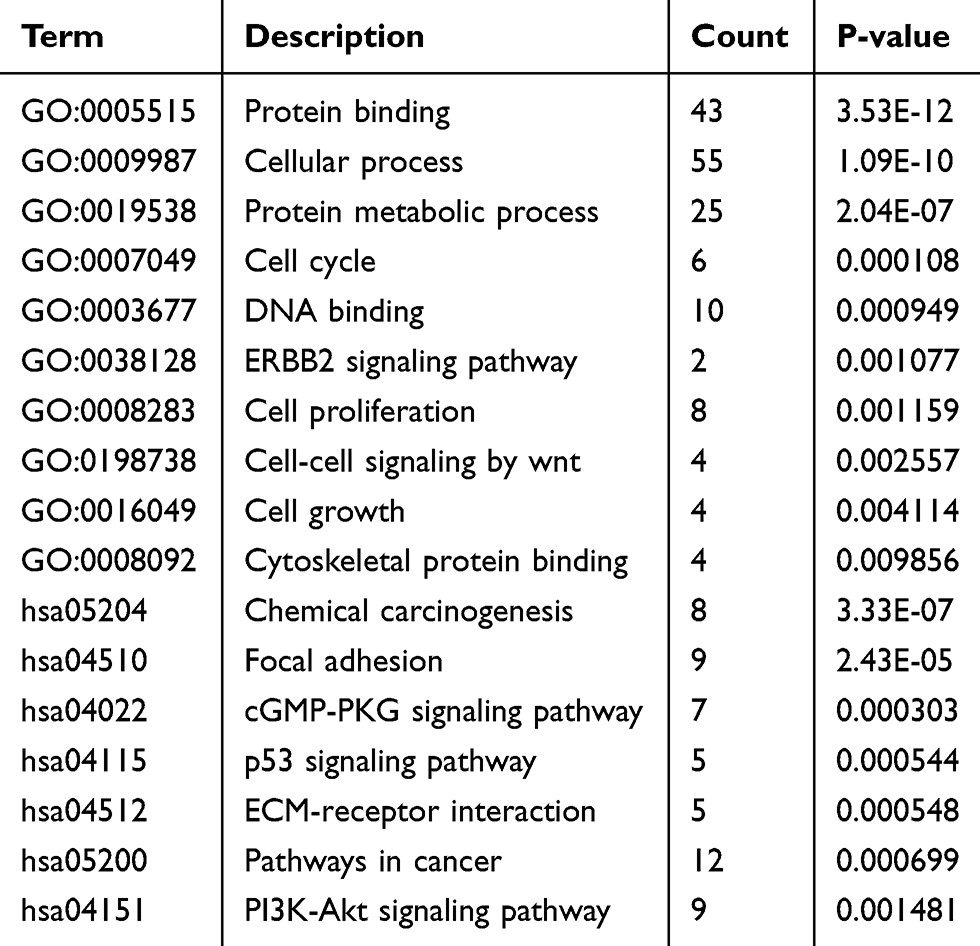 |
Table 1 Presentation of Part of the GO and KEGG Pathway Enrichment Analysis for the DEGs Associated with Cancer Genesis and Progress |
PPI Network Construction and Module Analysis
The PPI network of DEGs was constructed using the String database and visualized with Cytoscape (Figure 1B). The PPI enrichment P value was less than 1.0E-16, which indicated that the interaction between these proteins was greater than that of a group of random proteins. These proteins were at least partially bioconjugated as a group. The most important module was obtained using MCODE (Figure 1C). The GO and KEGG analyses of genes in this module demonstrated that these genes were significantly enriched in the cell cycle, mitotic nuclear division, microtubule-based process, and p53 signaling pathway (Table 2).
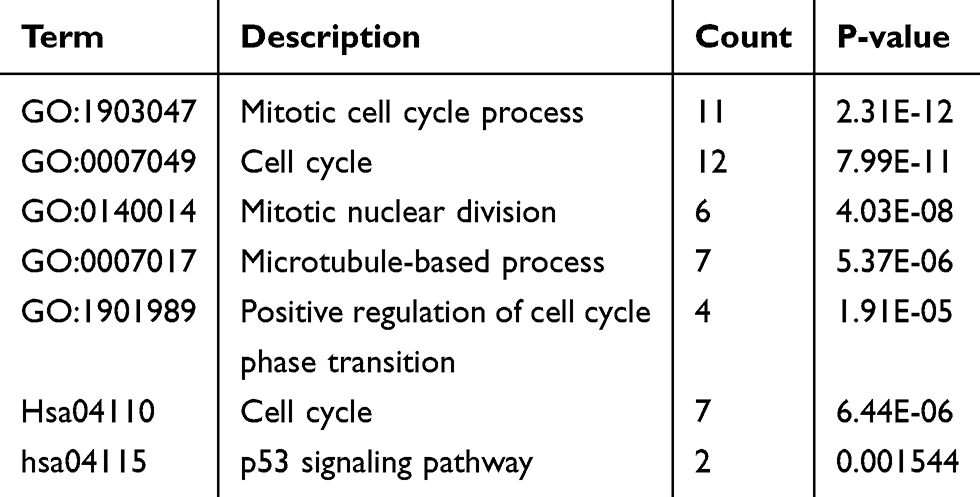 |
Table 2 Presentation of GO and KEGG Pathway Enrichment Analysis for the Genes in the Most Significant Modules |
Hub Gene Selection and Analysis
It is important to search for hub genes with different topological analysis methods due to the heterogeneity of the PPI networks. Four topological analysis methods (MCC, DMNC, MNC and degree) were used to analyze the DEGs (Figure 2A). Thirteen hub genes were obtained from the top 25 genes scored by the four topological methods (Figure 2B). The hub gene scores according to the different topological analysis methods are listed in Table 3. The network of these 13 hub genes and their coexpressed genes are shown in Figure 2C. The biological process analysis of these hub genes is shown in Figure 2D. Hierarchical clustering demonstrated that these hub genes could differentiate PCa samples from the noncancerous samples (Figure 3). Subsequently, the survival analysis of the hub genes revealed that the high-expression levels of GTSE1 or KIF18B were associated with worse overall survival according to the TCGA database (Figure 4A). Based on the data of PCa patients in the TCGA database, the expression of GTSE1 was more closely related to the Gleason score than that of KIF18B (Figure 4B). Thus, we then validated GTSE1 expression in 102 PCa tissue samples and paired adjacent tissues.
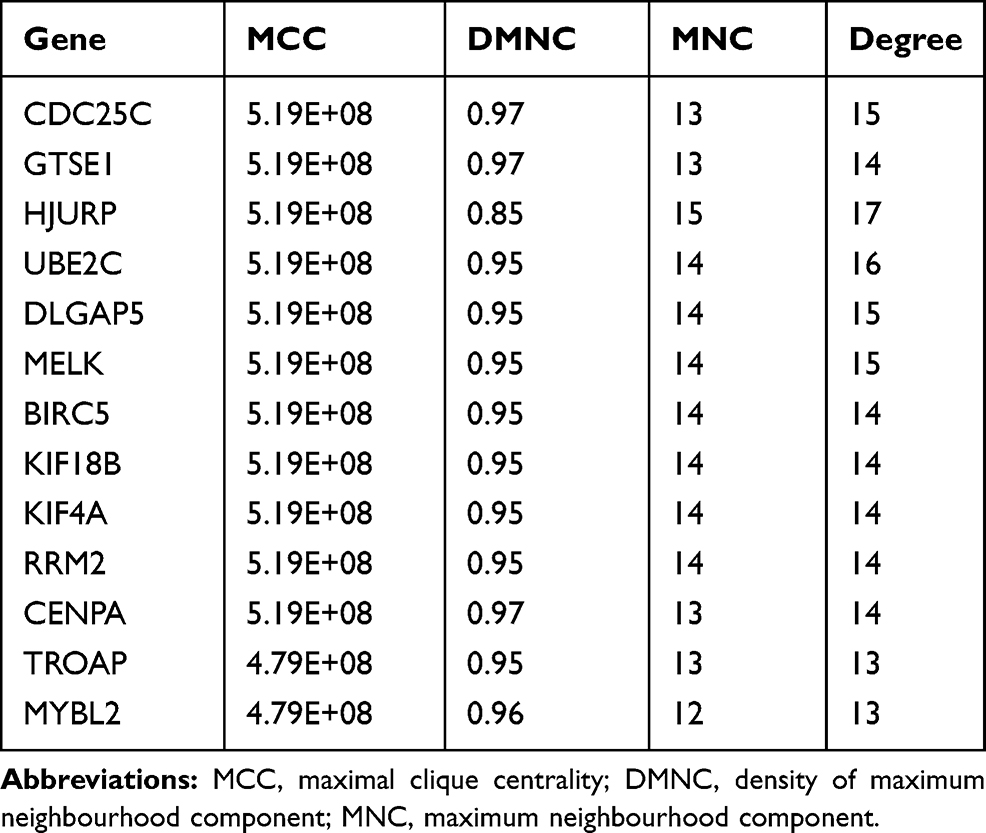 |
Table 3 Hub Gene Score According to the Four Topological Analysis Methods |
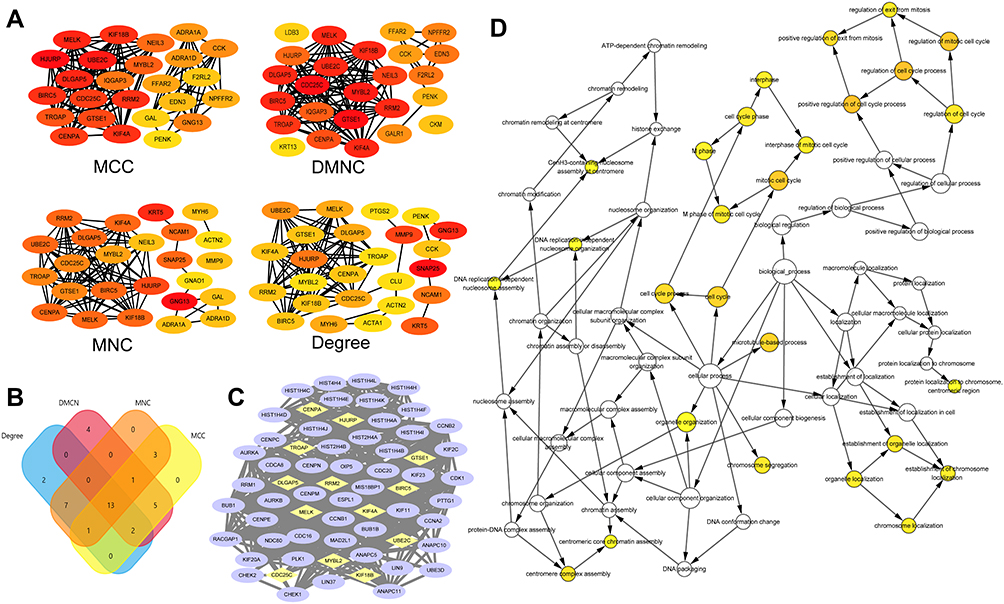 |
Figure 2 Hub genes identified in samples from the TCGA. (A) Subnetworks obtained by four different topological analysis methods. Color labelling from red to yellow represented the importance of the protein in the module. (B) Venn diagram representing the intersection set of hub genes obtained from the four topological analysis methods. (C) Interaction net work of hub genes and their co-expression genes. Nodes with yellow diamond represent hub genes. Nodes with blue ellipse represent the co-expression genes. (D) Biological process analysis of the hub genes constructed by GiNGO. The size of nodes refers to the numbers of genes that are involved in the ontologies. The color depth of nodes refers to the corrected p-value of ontologies. P<0.01 was considered statistically significant. Abbreviations: MCC, maximal clique centrality; DMNC, density of maximum neighbourhood component; MNC, maximum neighbourhood component. |
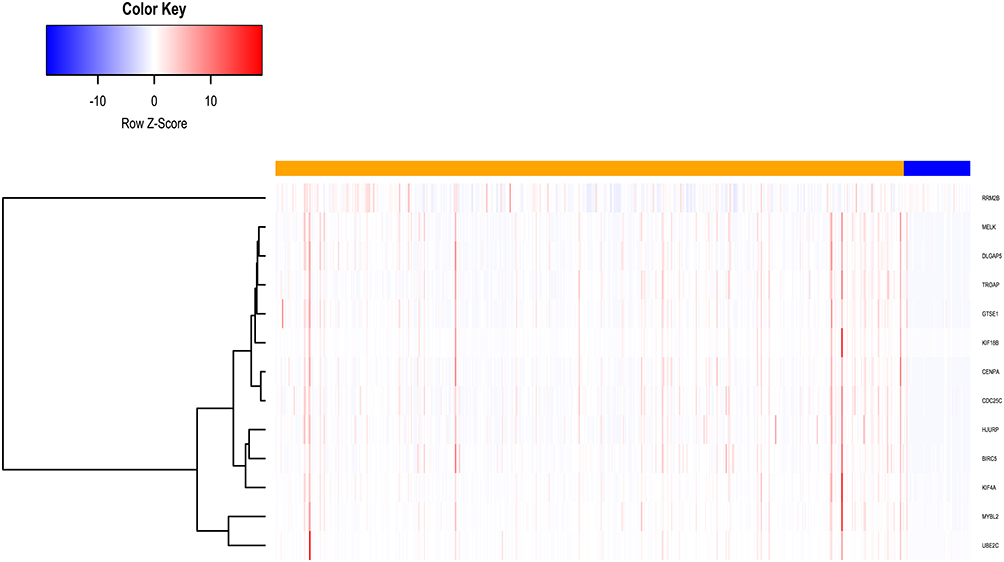 |
Figure 3 Hierarchical clustering of hub genes constructed using heatmap.2 function of R software. The samples under the orange bar are prostate cancer samples and the samples under the blue bar are non-cancerous samples. Upregulation of genes is marked in red; downregulation of genes is marked in blue. |
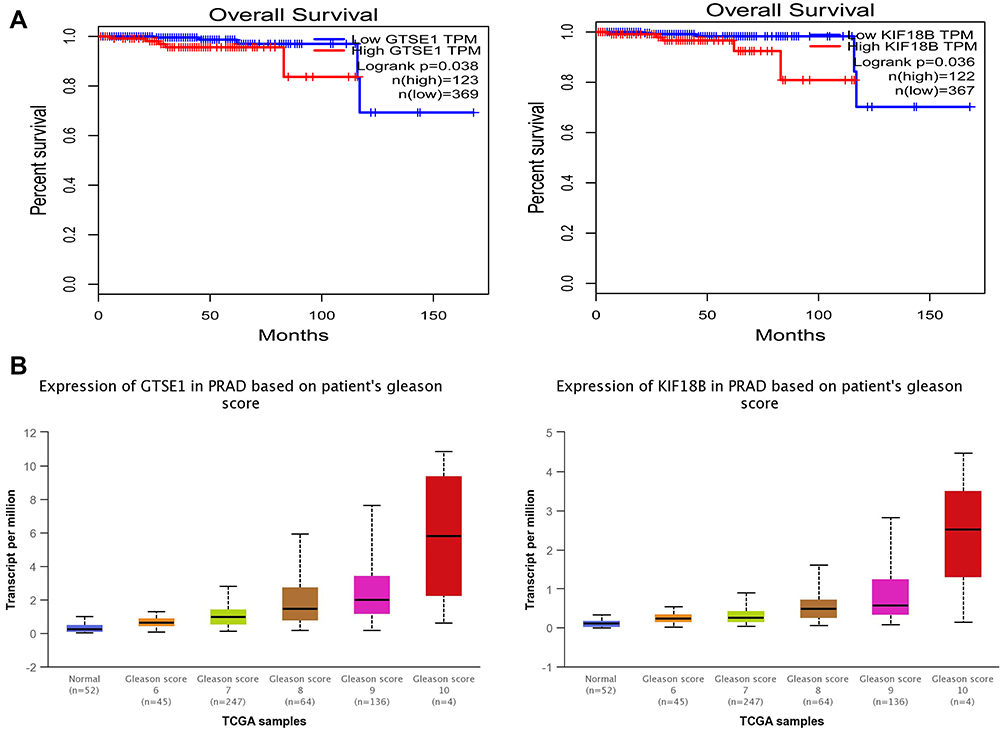 |
Figure 4 The expression of GTSE1 and KIF18B in samples from the TCGA. (A) Kaplan–Meier curves indicating the correlation of the overall survival of prostate cancer patients with the expression of GTSE1 (P=0.038) and KIF18B (P=0.036). The patients were divided into two groups according to the expression of hub genes. The blue curve represents the low-expression group, while the red curve represents the high-expression group. (B) Expression of GTSE1 and KIF18A in PRAD based on patient’s Gleason score according to the TCGA samples. The expression of GTSE1 was more closely related to Gleason score than that of KIF18A. GTSE1: P=6.96e-04 Gleason 6 vs 7, P=3.80e-03 Gleason 7 vs 8, P=0.044 Gleason 8 vs 9, P=0.058 Gleason 9 vs 10; KIF18B: P=2.43e-03 Gleason 6 vs 7, P=0.008 Gleason 7 vs 8, P=0.293 Gleason 8 vs 9, P=0.303 Gleason 9 vs 10. |
Immunohistochemical Staining of GTSE1 in PCa Tissue Samples
Immunohistochemical staining was performed to detect the expression of GTSE1 in 102 paired PCa tissues collected at Peking Union Medical College Hospital (Figure 5A). The median H-score in PCa tissues was 84.5 (interquartile range, 65–105.75), whereas the median H-score in the paracancerous tissues was 61 (interquartile range, 43.25–84). Immunoreactive scores for GTSE1 staining in PCa tissues were significantly higher than those in paracancerous tissues (P<0.01).
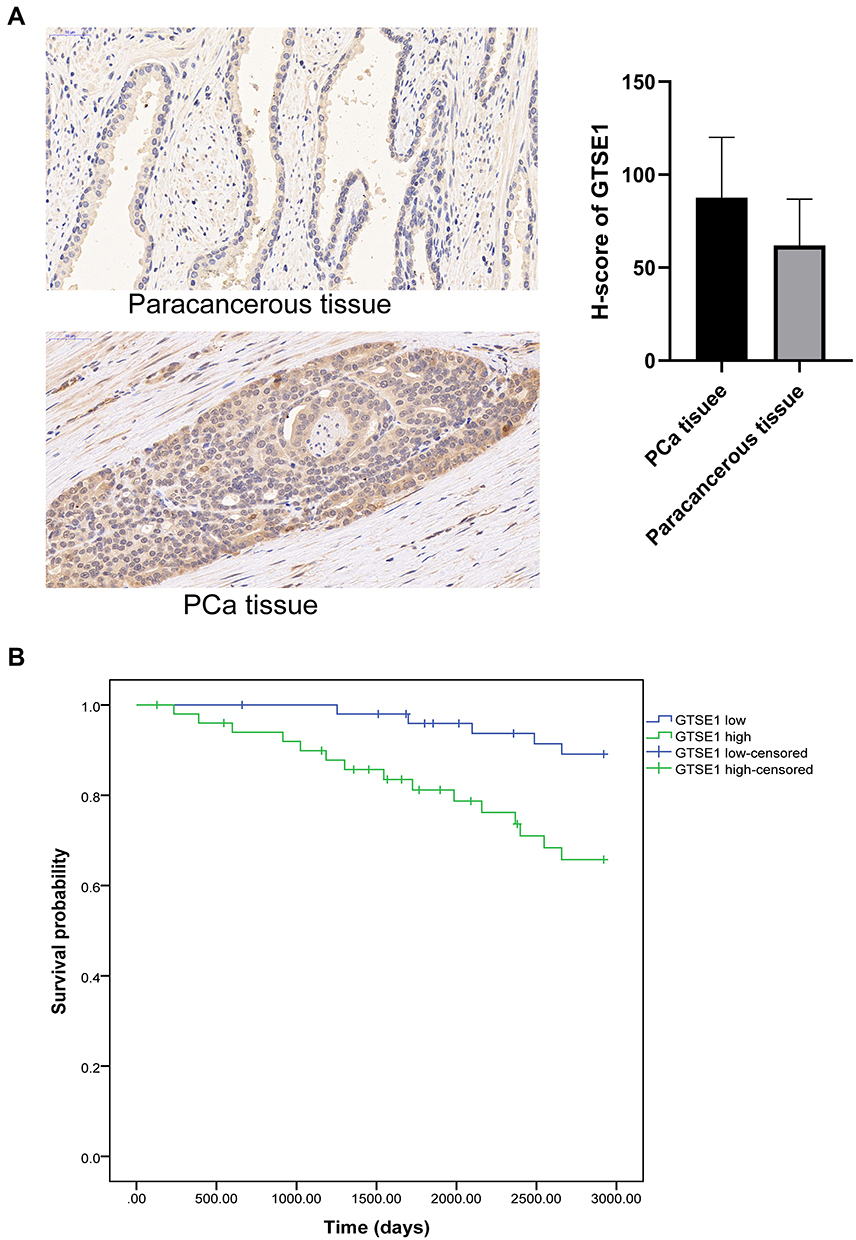 |
Figure 5 GTSE1 expression in samples from our hospital. (A) The expression of GTSE1 in PCa tissues and paracancerous tissues. Immunoreactive scores for GTSE1 staining in PCa tissues were significantly higher compared with those in paracancerous tissues (P<0.01). (B) Overall survival curves according to the expression level of GTSE1. The overall survival time of patients with high GTSE1 expression was shorter than those with low GTSE1 expression (P=0.015). |
Association Between GTSE1 Expression and Clinicopathological Characteristics of PCa Patients
The clinicopathological features of PCa patients are displayed in Table 4. The association of GTSE1 expression was statistically irrelevant to patient age, serum PSA and surgical margin. In contrast, the high expression of GTSE1 was closely associated with the Gleason score (P=0.001), pathological stage (P=0.017), lymph node involvement (P=0.03) and bone metastasis (P=0.017). The overall survival time of patients with high GTSE1 expression was shorter than that of patients with low GTSE1 expression (Figure 5B, P=0.015).
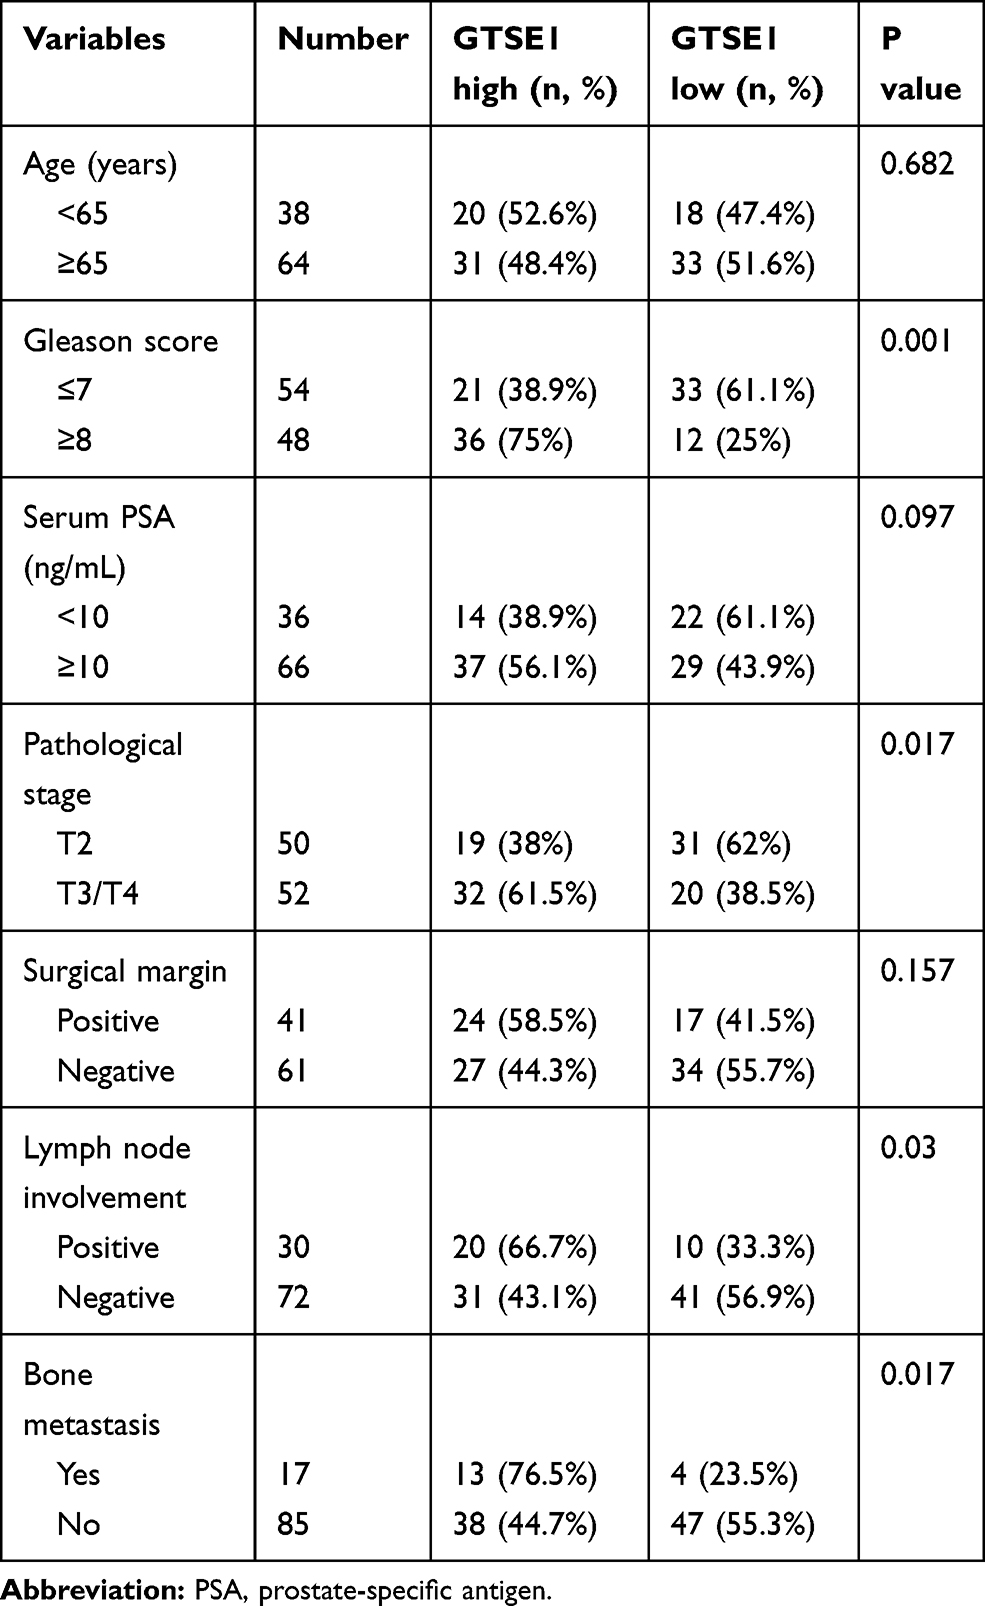 |
Table 4 Relationship Between GTSE1 Expression and Clinicopathologic Features |
GSEA of PCa Samples in the TCGA Database
GSEA demonstrated that high GTSE1 expression samples were mainly enriched in the cell cycle (P<0.001, FDR=0, ES=0.661), DNA replication (P<0.001, FDR=0, ES=0.759), mismatch repair (P<0.001, FDR=0, ES=0.738), and p53 signaling pathway (P<0.001, FDR=5.026E-4, ES=0.533) (Figure 6).
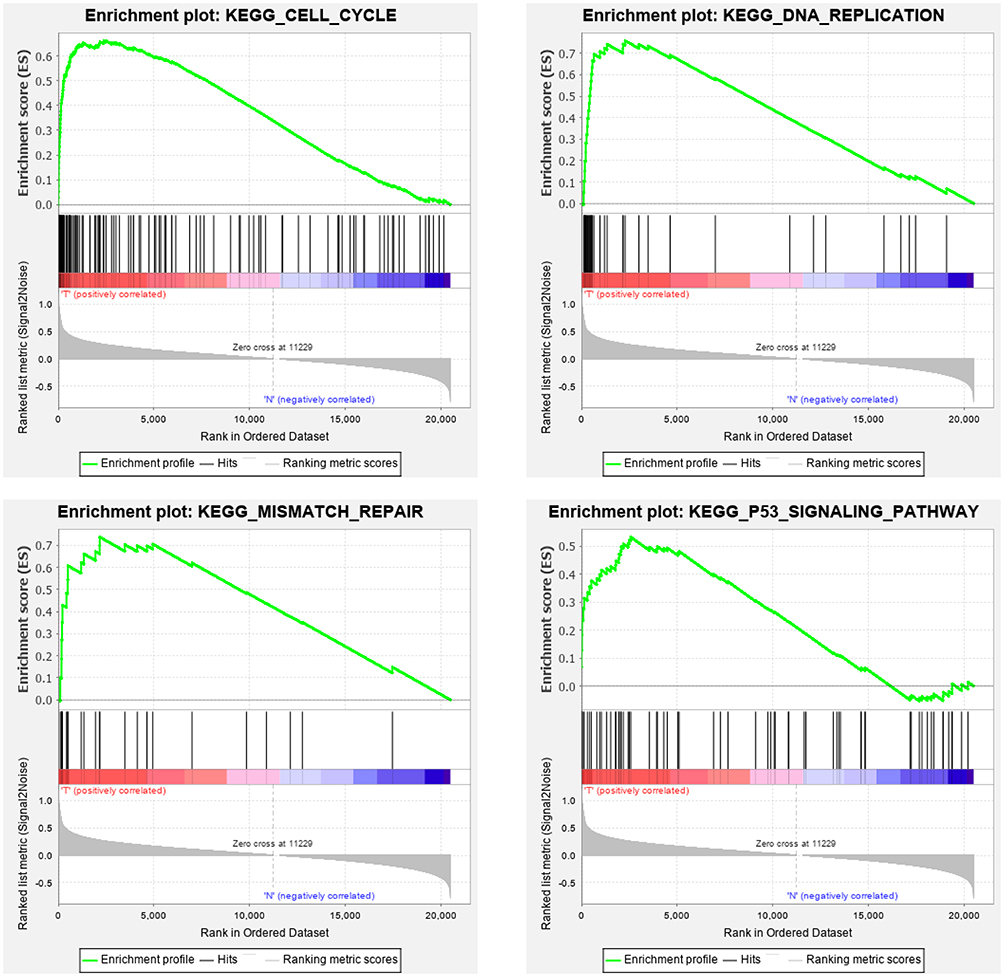 |
Figure 6 GTSE1 correlated enrichment gene analysis with GSEA. Cell cycle: P<0.001, FDR=0, ES=0.661; DNA replication: P<0.001, FDR=0, ES=0.759; Mismatch repair: P<0.001, FDR=0, ES=0.738; p53 signaling pathway: P<0.001, FDR=5.026e-4, ES=0.533. |
Discussion
In our study, the expression profile data of 483 PCa and 51 paracancerous tissues from the TCGA database were analyzed to detect the DEGs. A PPI network was constructed using the STRING database. Four different topological analysis methods, including the DMNC, MNC, MCC and degree, were performed to build subnetworks to identify the hub genes. It has been reported that it is more accurate to use four topological analysis methods in PPI network analysis.24 Thirteen hub genes were identified in the four subnetworks, namely, CDC25C, GTSE1, HJURP, UBE2C, DLGAP5, MELK, BIRC5, KIF18B, KIF4A, RRM2, CENPA, TROAP and MYBL2. GTSE1 was selected as the key hub gene based on the results of survival analysis. The expression of GTSE1 was significantly higher in PCa tissues than in the paired adjacent tissues in IHC analysis of 102 PCa patients in our hospital. Furthermore, the expression of GTSE1 was also correlated with overall survival in the 102 PCa patients, which indicated that GTSE1 might be a potential biomarker in PCa patients.
In 1998, Utrera et al discovered a new p53-inducible gene during the screening of tumor-associated DEGs and named it B99.25 Two years later, a study by Collavin et al showed that the B99 gene encodes a protein specifically expressed in the G2 and S phases. According to the expression feature, B99 was named GTSE1.26 GTSE1 regulates p53 by stimulating the relocalization of p53 to the cytoplasm, subsequently inhibiting p53-induced apoptosis.27 The overexpression of GTSE1 has been reported to be involved in the progression of many cancers, such as gastric cancer,8 breast cancer,28 liver cancer,29 non-small-cell lung cancer,9 acral melanoma7 and bladder cancer.30 However, the role and underlying molecular mechanism of GTSE1 in PCa remain unknown. In the present study, we identified GTSE1 as a hub gene in PCa using bioinformatics analysis methods and predicted it as a potential biomarker in PCa. Furthermore, we validated the bioinformatics results in 102 PCa patients and revealed that the high expression of GTSE1 was closely correlated with the Gleason score, pathological stage, lymph node involvement and bone metastasis. The high expression of GTSE1 was also associated with poor prognosis in patients with PCa. In addition, the majority of the TCGA samples were from Caucasian patients, while samples from Chinese patients were further analyzed in the present study. The results indicated that GTSE1 might be highly expressed in PCa across different ethnic groups.
It has been reported that GSEA has significant advantages compared with traditional gene expression analysis.19 GSEA could identify biological processes in the whole gene profile by focusing on gene sets. In our study, GSEA revealed that the high expression of GTSE1 was related to some signaling pathways, such as the cell cycle and p53 signaling pathway. Thus, we speculated that the high expression of GTSE1 might promote the development and progression of PCa through the cell cycle and p53 signaling pathway, and these results are in accordance with those from previous studies on other cancers.28,30 Many antineoplastic drugs are associated with the cell cycle mechanism, while GTSE1 promotes tumor growth by influencing the cell cycle. Therefore, GTSE1 may act as a cell cycle-specific therapeutic target. However, this conclusion still needs to be validated in further experiments. Moreover, studies have also demonstrated that GTSE1 could promote breast cancer cell growth through the AKT pathway28 and enhance hepatocellular carcinoma metastasis by regulating the EMT pathway.10 In addition, GTSE1 was proven to be associated with tumor multidrug resistance,30 which also deserves to be explored in PCa.
In conclusion, the current study found that the expression of GTSE1 was significantly high in PCa tissues, and the high expression of GTSE1 was associated with poor prognosis in PCa patients. Furthermore, GTSE1 might be involved in the development and progression of PCa by influencing the cell cycle. Therefore, GTSE1 may serve as a potential biomarker and therapeutic target in patients with PCa. However, further studies are needed to validate the underlying mechanism of GTSE1 in the development and progression of PCa.
Author Contributions
All authors made substantial contributions to conception and design, acquisition of data, or analysis and interpretation of data; took part in drafting the article or revising it critically for important intellectual content; agreed on the journal to which the article will be submitted; gave final approval of the version to be published; and agree to be accountable for all aspects of the work.
Funding
This study was funded by the National Natural Science Foundation of China (81671448).
Disclosure
Authors report no conflicts of interest in this work.
References
1. Jemal A, Bray F, Center MM, Ferlay J, Ward E, Forman D. Global cancer statistics. CA Cancer J Clin. 2011;61(2):69–90. doi:10.3322/caac.20107
2. Saini S. PSA and beyond: alternative prostate cancer biomarkers. Cell Oncol. 2016;39(2):97–106. doi:10.1007/s13402-016-0268-6
3. NICE. NICE Guidance – prostate cancer: diagnosis and management. BJU Int. 2019;124(1):9–26. doi:10.1111/bju.14809
4. Fu X, Chen G, Cai Z, et al. Overexpression of BUB1B contributes to progression of prostate cancer and predicts poor outcome in patients with prostate cancer. Onco Targets Ther. 2016;9(1):2211–2220. doi:10.2147/OTT.S101994
5. Zhang C, Li S, Qiao B, et al. CtBP2 overexpression is associated with tumorigenesis and poor clinical outcome of prostate cancer. Arch Med Sci. 2015;11(6):1318–1323. doi:10.5114/aoms.2015.56359
6. Yoshie H, Sedukhina AS, Minagawa K, et al. A bioinformatics-to-clinic sequential approach to analysis of prostate cancer biomarkers using TCGA datasets and clinical samples: a new method for precision oncology? Oncotarget. 2017;8(59):99601–11pp. doi:10.18632/oncotarget.20448
7. Xu T, Ma M, Chi Z, et al. High G2 and S-phase expressed 1 expression promotes acral melanoma progression and correlates with poor clinical prognosis. Cancer Sci. 2018;109(6):1787–1798. doi:10.1111/cas.13607
8. Subhash VV, Tan SH, Tan WL, et al. GTSE1 expression represses apoptotic signaling and confers cisplatin resistance in gastric cancer cells. BMC Cancer. 2015;15(1):550. doi:10.1186/s12885-015-1550-0
9. Lei X, Du L, Zhang P, et al. Knockdown GTSE1 enhances radiosensitivity in non–small-cell lung cancer through DNA damage repair pathway. J Cell Mol Med. 2020;24(9):5162–5167. doi:10.1111/jcmm.15165
10. Wu X, Wang H, Lian Y, et al. GTSE1 promotes cell migration and invasion by regulating EMT in hepatocellular carcinoma and is associated with poor prognosis. Sci Rep. 2017;7(1):1–2. doi:10.1038/s41598-017-05311-2
11. Kanehisa M, Goto S. KEGG: kyoto encyclopaedia of genes and genomes. Nucleic Acids Res. 2000;28(1):27–30. doi:10.1093/nar/28.1.27
12. Weinstein JN, Collisson EA, Mills GB, et al. The cancer genome atlas pan-cancer analysis project. Nat Genet. 2013;45(10):1113–1120. doi:10.1038/ng.2764
13. Robinson MD, Mccarthy DJ, Smyth GK. edgeR: a bioconductor package for differential expression analysis of digital gene expression data. Bioinformatics. 2010;26(1):139–140. doi:10.1093/bioinformatics/btp616
14. Ashburner M, Ball CA, Blake JA, et al. Gene ontology: tool for the unification of biology. Nat Genet. 2000;25(1):25–29. doi:10.1038/75556
15. Sherman BT, Tan Q, Collins JR, et al. The DAVID gene functional classification tool: a novel biological module-centric algorithm to functionally analyze large gene lists. Genome Biol. 2007;8(9):R183. doi:10.1186/gb-2007-8-9-r183
16. Szklarczyk D, Gable AL, Lyon D, et al. STRING v11: protein-protein association networks with increased coverage, supporting functional discovery in genome-wide experimental datasets. Nucleic Acids Res. 2019;47:D607–D613. doi:10.1093/nar/gky1131
17. Shannon P, Markiel A, Ozier O, et al. Cytoscape: a software environment for integrated models of biomolecular interaction networks. Genome Res. 2003;13(11):2498–2504. doi:10.1101/gr.1239303
18. Gan Y, Zheng S, Baak JPA, et al. Prediction of the anti-inflammatory mechanisms of curcumin by module-based protein interaction network analysis. Acta Pharm Sin B. 2015;005(006):590–595. doi:10.1016/j.apsb.2015.09.005
19. Chin CH, Chen SH, Wu HH, Ho CW, Ko MT, Lin CY. cytoHubba: identifying hub objects and sub-networks from complex interactome. BMC Syst Biol. 2014;8(S4):S11. doi:10.1186/1752-0509-8-S4-S11
20. Maere S, Heymans K, Kuiper M. BiNGO: a cytoscape plugin to assess overrepresentation of gene ontology categories in biological networks. Bioinformatics. 2005;21(16):3448–3449. doi:10.1093/bioinformatics/bti551
21. Tang Z, Li C, Kang B, Ge G, Cheng L, Zhang Z. GEPIA: a web server for cancer and normal gene expression profiling and interactive analyses. Nucleic Acids Res. 2017;45:W98–W102. doi:10.1093/nar/gkx247
22. Chandrashekar DS, Bashel B, Balasubramanya SAH, Creighton CJ, Varambally S. UALCAN: a portal for facilitating tumor subgroup gene expression and survival analyses. Neoplasia. 2017;19(8):649–658. doi:10.1016/j.neo.2017.05.002
23. Subramanian A, Tamayo P, Mootha VK, et al. Gene set enrichment analysis: a knowledge-based approach for interpreting genome-wide expression profiles. Proc Natl Acad Sci U S A. 2005;102(43):15545–15550. doi:10.1073/pnas.0506580102
24. Gao H, Wang H, Yang W. Identification of key genes and construction of microRNA–mRNA regulatory networks in multiple myeloma by integrated multiple GEO datasets using bioinformatics analysis. Int J Hematol. 2017;106(1):99–107. doi:10.1007/s12185-017-2216-2
25. Utrera R, Collavin L, Lazarevic D, Delia D, Schneider C. A novel p53‐inducible gene coding for a microtubule‐localized protein with G2‐phase‐specific expression. EMBO J. 1998;17(17):5015–5025. doi:10.1093/emboj/17.17.5015
26. Collavin L, Monte M, Verardo R, Pfleger CM, Schneider C. Cell-cycle regulation of the p53-inducible gene B99. FEBS Lett. 2000;481(1):57–62. doi:10.1016/S0014-5793(00)01969-4
27. Short B. GTSE1 leads cancer cells into CIN. J Cell Biol. 2016;215(5):593. doi:10.1083/jcb.2155if
28. Lin F, Xie YJ, Zhang XK, et al. GTSE1 is involved in breast cancer progression in p53 mutation-dependent manner. J Exp Clin Cancer Res. 2019;38(1):1–16. doi:10.1186/s13046-019-1157-4
29. Zheng Y, Shi Y, Yu S, Han Y, Wang J. GTSE1, CDC20, PCNA, and MCM6 synergistically affect regulations in cell cycle and indicate poor prognosis in liver cancer. Anal Cell Pathol. 2019;2019:1–13. doi:10.1155/2019/1038069
30. Liu A, Zeng S, Lu X, et al. Overexpression of G2 and S phase-expressed-1 contributes to cell proliferation, migration, and invasion via regulating p53/FoxM1/CCNB1 pathway and predicts poor prognosis in bladder cancer. Int J Biol Macromol. 2019;123:322–334. doi:10.1016/j.ijbiomac.2018.11.032
 © 2020 The Author(s). This work is published and licensed by Dove Medical Press Limited. The full terms of this license are available at https://www.dovepress.com/terms.php and incorporate the Creative Commons Attribution - Non Commercial (unported, v3.0) License.
By accessing the work you hereby accept the Terms. Non-commercial uses of the work are permitted without any further permission from Dove Medical Press Limited, provided the work is properly attributed. For permission for commercial use of this work, please see paragraphs 4.2 and 5 of our Terms.
© 2020 The Author(s). This work is published and licensed by Dove Medical Press Limited. The full terms of this license are available at https://www.dovepress.com/terms.php and incorporate the Creative Commons Attribution - Non Commercial (unported, v3.0) License.
By accessing the work you hereby accept the Terms. Non-commercial uses of the work are permitted without any further permission from Dove Medical Press Limited, provided the work is properly attributed. For permission for commercial use of this work, please see paragraphs 4.2 and 5 of our Terms.