Back to Journals » ImmunoTargets and Therapy » Volume 14
Identification of EARS2 as a Potential Biomarker with Diagnostic, Prognostic, and Therapeutic Implications in Colorectal Cancer
Authors Wang L, Deng X, Tang J, Gong Y, Bu S ![]() , Li Z, Liao B, Ding Y, Dai T, Liao Y, Li Y
, Li Z, Liao B, Ding Y, Dai T, Liao Y, Li Y ![]()
Received 8 October 2024
Accepted for publication 18 January 2025
Published 30 January 2025 Volume 2025:14 Pages 65—85
DOI https://doi.org/10.2147/ITT.S499680
Checked for plagiarism Yes
Review by Single anonymous peer review
Peer reviewer comments 3
Editor who approved publication: Professor Michael Shurin
Video abstract of “EARS2 as a potential biomarker in colorectal cancer” [499680].
Views: 157
Ling Wang,1,2,* Xuemei Deng,1,* Jiaxi Tang,3 Yi Gong,2 Shaojin Bu,4 Zuli Li,1 Bin Liao,2 Yao Ding,2 Tingting Dai,1,5 Yong Liao,1 Yongsheng Li2,6
1Department of Infectious Diseases, Second Affiliated Hospital, Chongqing Medical University, Chongqing, People’s Republic of China; 2Department of Phase I Clinical Trial Ward, Chongqing Key Laboratory of Translational Research for Cancer Metastasis and Individualized Treatment, Chongqing University Cancer Hospital, Chongqing, People’s Republic of China; 3Department of Anesthesiology, Chongqing University Cancer Hospital, Chongqing, China; 4Department of Anesthesiology, Fengdu People’s Hospital, Chongqing, People’s Republic of China; 5Department of Medical Oncology, Chongqing University Fuling Hospital, Chongqing, China; 6Department of Medical Oncology, Chongqing University Cancer Hospital, Chongqing, People’s Republic of China
*These authors contributed equally to this work
Correspondence: Yong Liao, Department of Infectious Diseases, Second Affiliated Hospital, Chongqing Medical University, NO. 288 Chayuan Astronomy Avenue, Nanan District, Chongqing, 401336, People’s Republic of China, Email [email protected] Yongsheng Li, Department of Medical Oncology, Chongqing University Cancer Hospital, No. 181 hanyu Road, Shapingba District, Chongqing, 400030, People’s Republic of China, Email [email protected]
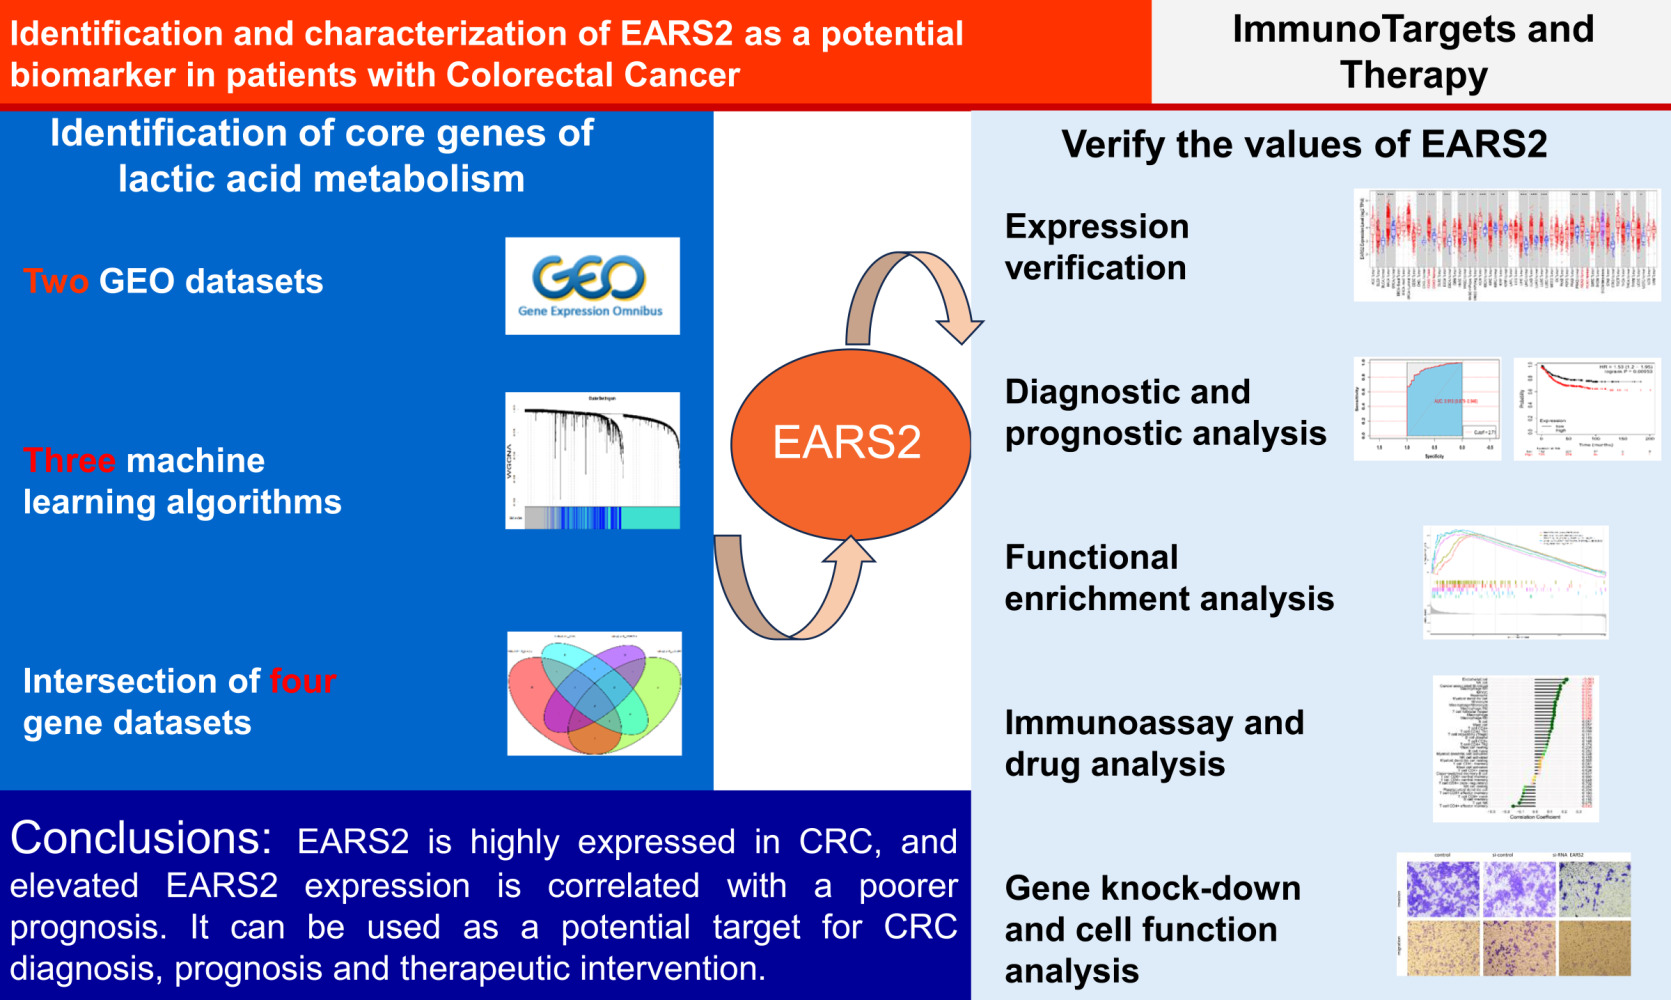
Purpose: Colorectal cancer (CRC) is a prevalent malignancy, and lactate metabolism significantly influences tumorigenesis and progression. This study identifies key genes associated with lactic acid metabolism and explore their impact on CRC.
Patients and Methods: This study utilized data from The Cancer Genome Atlas, Gene Expression Omnibus, other public databases, and our institutional resources. Machine learning identified key lactate metabolism-related genes. Receiver Operating Characteristic analysis, Kaplan-Meier analysis, and the construction of a nomogram model were conducted to assess the diagnostic and prognostic significance of the key lactate metabolism-related gene EARS2. EARS2 expression in colorectal tissue was validated using both publicly available external data and samples from our institution. To investigate the mechanisms underlying EARS2 in CRC, Gene Ontology, Kyoto Encyclopedia of Genes and Genomes, Gene Set Enrichment Analysis, and Protein-Protein Interaction analyses were performed, alongside the construction of miRNA-mRNA interaction networks. Additionally, the relationships between EARS2 and immune cell infiltration, as well as responses to drug therapy, were examined. Following the knockdown of EARS2, we assessed cell proliferation, migration capabilities, and apoptosis. Statistical analyses were conducted using R and GraphPad Prism software.
Results: ERAS2 was overexpressed in CRC tissues compared to normal and adenoma tissues, with higher expression levels correlating with aberrant lactate metabolism and poorer patient prognosis. EARS2 was involved in pathways such as neuroactive ligand-receptor interactions, protein digestion, and cholesterol metabolism, and it was associated with immune cell infiltration and responses to drug treatment. Additionally, the knockdown of EARS2 inhibited the proliferation, migration, and invasion of CRC cells while enhancing their apoptosis.
Conclusion: Elevated expression of EARS2 is associated with abnormal lactate metabolism, immune cell infiltration, altered therapeutic sensitivity, and poorer survival outcomes in CRC. This correlation suggests that EARS2 may serve as a potential target for the diagnosis, prognosis, and therapeutic intervention in CRC.
Keywords: biomarker, CRC, EARS2, lactic acid, prediction model
Graphical Abstract:
Introduction
Colorectal cancer (CRC) ranks as the third most prevalent cancer globally and is the second leading cause of cancer-related mortality.1 Despite advancements in early detection and treatment strategies, CRC continues to pose a substantial public health challenge, characterized by its high incidence and mortality rates.2 Approximately 35% of cancer patients are diagnosed with distant metastases,3 and fewer than 20% survive beyond five years following their initial diagnosis.4 The onset and progression of CRC are attributed to the prolonged interaction of multiple factors.5
Lactic acid, a byproduct of glycolysis and a precursor to gluconeogenesis, plays a vital role as an energy source for mitochondrial respiration and exhibits various biological functions.6 Elevated lactic acid levels have been observed in the serum of patients with multiple cancer types, including melanoma, breast cancer, lung cancer, gastrointestinal cancer, urogenital cancer, and sarcoma, often reaching concentrations up to 40 times higher than normal.7 This increased lactate concentration is correlated with lymph node or distant metastasis and is associated with lower survival rates.8 Within tumor tissue, the accumulation of lactic acid in the tumor microenvironment (TME) contributes to the establishment of an acidic environment, which facilitates tumor progression, angiogenesis, metastasis, drug resistance, and immunosuppression.9
Lactic acid has been demonstrated to inhibit immune cell activity within the TME. Specifically, it can induce apoptosis in natural killer (NK) cells and natural killer T (NKT) cells, thereby enabling tumor cells to evade immune detection.10 Additionally, lactic acid impairs the production of interferon-gamma (IFN-γ) and the cytotoxic functions of NK cells.10 It also disrupts the production of IFN-γ and interleukin-4 (IL-4) in NKT cells by obstructing the mechanistic target of rapamycin (mTOR) signaling pathway, which hinders the activation of these immune cells.11 Elevated levels of lactic acid in the TME further suppress the proliferation and functionality of T cells. Dendritic cells (DCs), which are pivotal as antigen-presenting cells in immune responses, are also adversely affected by lactic acid, as it inhibits their differentiation.12 Moreover, lactic acid fosters the generation of myeloid-derived suppressor cells (MDSCs), leading to various immunosuppressive effects, including the inhibition of DC maturation, reduction of NK cell cytotoxicity, prevention of T-cell activation, and promotion of regulatory T-cell differentiation within the TME.13 Furthermore, lactic acid activates the ERK/STAT14 and MCT-HIF1-α pathways,15 which facilitate macrophage polarization toward the M2 phenotype and enhance cancer cell proliferation, migration, and angiogenesis.16
The elevated production of lactic acid within the tumor microenvironment is critical for sustaining the energy demands of cancer cells.17 Research has shown that the introduction of varying concentrations of exogenous lactate enhances the migration of cancer cells.18 Additionally, lactic acid contributes to the increased synthesis of hyaluronic acid, MMP-9, cysteine protease B, and actin, thereby facilitating cancer growth and migration.19 Furthermore, it upregulates the expression of CD44, which enhances the adhesion of breast and prostate cancer cells to the bone marrow endothelium, ultimately promoting bone metastasis.20 Angiogenesis, a vital process in tumorigenesis, is also stimulated by lactic acid, resulting in the production of VEGF, TGF-β, and FGF2 by endothelial cells and fostering the development of tumor blood vessels.21,22
Among the key genes involved in lactic acid metabolism, EARS2 (glutamyl-tRNA synthetase 2, mitochondrial) has garnered increasing attention due to its fundamental role in mitochondrial function and aminoacyl-tRNA biosynthesis, both of which are essential for protein translation and energy metabolism.23 Dysregulation of mitochondrial genes, including EARS2, has been implicated in a variety of diseases, including malignancies.24–32 Notably, elevated EARS2 expression has been linked to increased tumor recurrence in cancers such as prostate,30 breast and pancreatic cancers.30,31 Cui et al identified 14 metabolism-related genes, including EARS2, that are associated with colorectal cancer prognosis and may serve as potential therapeutic targets.32 However, the precise mechanisms underlying its regulatory role in colorectal cancer remain to be elucidated.
Preliminary studies suggest that EARS2 overexpression is correlated with poor survival outcomes in colorectal cancer. Understanding the role of EARS2 in this context could reveal novel mechanisms through which lactic acid metabolism contributes to tumorigenesis and may provide new targets for therapeutic intervention.
This study aims to perform a comprehensive and systematic analysis of the core genes involved in the lactic acid metabolic pathway, with a particular focus on EARS2. Utilizing a combination of bioinformatics analyses, molecular biology experiments, and cell function assays, we examine gene expression data to validate the role of EARS2 in colorectal cancer. This research seeks to elucidate the molecular mechanisms driving EARS2’s involvement in cell proliferation, migration, and apoptosis. Additionally, the findings aim to highlight the potential of EARS2 as a biomarker for the diagnosis, prognosis, and treatment strategies of CRC.
Materials and Methods
Data Collection and Overall Experimental Procedure
The Cancer Genome Atlas (TCGA) dataset (https://cancergenome.nih.gov/), comprising 512 samples, was employed to gather clinical and RNA-sequencing (RNA-seq) data from CRC patients. Additionally, data from 13 datasets within the Gene Expression Omnibus (GEO) database (GSE9348, GSE17536, GSE17538, GSE180440, GSE18105, GSE20842, GSE21510, GSE31905, GSE37182, GSE39582, GSE103479, GSE106584, and GSE133057) were acquired to enhance the analysis of CRC patient information. Furthermore, RNA-seq data and drug IC50 values for CRC cell lines were sourced from the Genomics of Drug Sensitivity in Cancer database (https://www.cancerrxgene.org/).33 A flow chart illustrating our study is presented in Figure 1. The subsequent section offers a comprehensive and detailed description of our research.
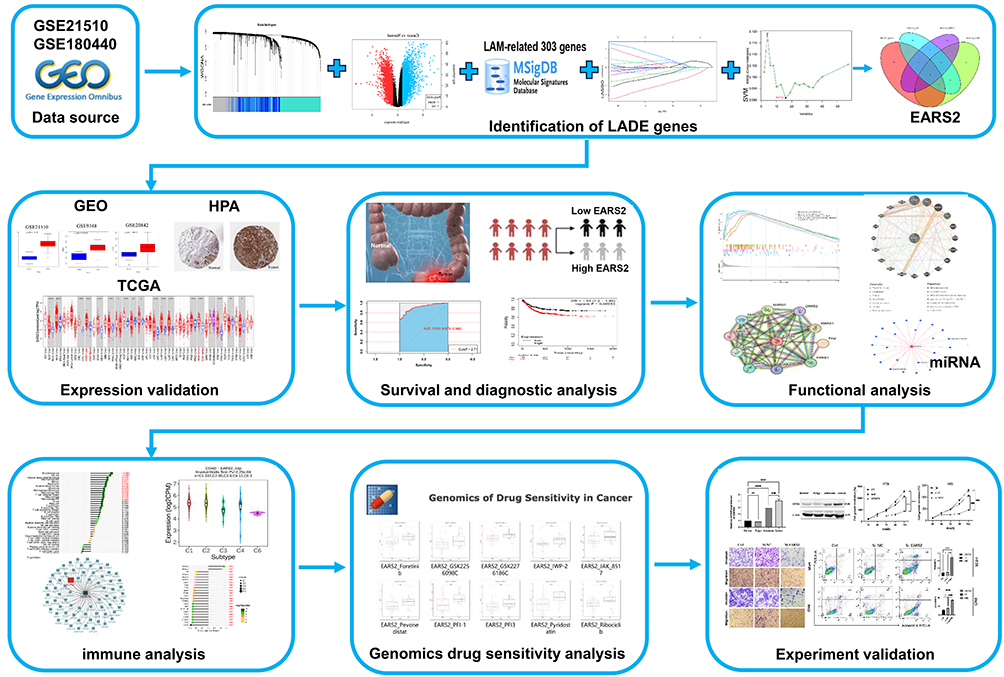 |
Figure 1 The study flow chart. Abbreviations: GEO, Gene Expression Omnibus; LADE, Lactic acid metabolism differential gene; HPA, human protein atlas; TCGA, The Cancer Genome Atlas. |
Identification of Lactic Acid Metabolism-Related Differential Core Genes
Lactic acid metabolism-related genes (LARGs) were identified using the Molecular Signatures Database (MsigDB, https://www.gsea-msigdb.org/gsea/msigdb/).34 Expression data from tumor and normal tissues of CRC patients were extracted from the GEO datasets GSE21510 and GSE180440 to identify differentially expressed genes (DEGs) in CRC. DEGs were defined as genes exhibiting an absolute log fold change (logFC) greater than 1 and an adjusted p-value of less than 0.05. Clinical data, including stage, metastasis, and recurrence, were also collected. In the GSE21510 dataset, weighted gene coexpression network analysis (WGCNA) was performed based on clinical phenotypes, and the resulting gene set was intersected with LARGs. Subsequently, Least Absolute Shrinkage and Selection Operator (LASSO) and Support Vector Machines (SVM) analyses were conducted on the intersected gene expression data of DEGs from GSE21510 and LARGs, stratified by sample type (tumor tissue versus normal tissue). The DEGs from GSE180440 were then intersected with the LARGs. Core genes associated with lactic acid metabolism were identified by intersecting these four gene sets. Finally, prognostic analysis was performed on these core genes, leading to the selection of genes with predictive value for prognosis for further investigation (Figure S1).
Validation of EARS2 Gene Expression in CRC
Core genes associated with lactic acid metabolism were identified through the intersection of the four aforementioned gene sets, which highlighted three potential candidates: EARS2, MRPL3, and PNPT1. Prognostic analysis indicated that EARS2 holds significant prognostic value, whereas MRPL3 and PNPT1 demonstrated no relevance. Consequently, EARS2 was chosen for further investigation.
To evaluate the differential expression of EARS2 in CRC patients, we employed the Tumor Immune Estimation Resource (TIMER 2.0, http://timer.cistrome.org/), the TCGA database as well as five GEO datasets (GSE9348, GSE20842, GSE21510, GSE37182, and GSE39582). The GEO microarray datasets were normalized using the Robust Multi-array Average (RMA) method within R 2.6.2 statistical software, specifically utilizing the affy package from BioConductor. Following normalization, gene expression levels were log2-transformed and analyzed using an unpaired t-test.35 The distributions of gene expression were illustrated through box plots. Additionally, we validated the expression of EARS2 in colon tissues through immunohistochemistry, referencing the Human Protein Atlas (HPA, https://www.proteinatlas.org/) database.
To investigate the role of the EARS2 gene in the development and progression of CRC, we collected ten samples each of normal colorectal tissue, polyp tissue, adenoma tissue, and tumor tissue from our institution. The collection of these tissues for analysis was approved by the Institutional Review Board of Chongqing University Cancer Hospital (CZLS2023085-A), and informed consent was obtained from all participants. The samples were analyzed using quantitative polymerase chain reaction (qPCR) and Western blot (WB) techniques, with all experiments conducted in triplicate to ensure accuracy.
Diagnosis, Prognosis and Clinicopathological Analysis
To investigate the diagnostic and prognostic significance of the EARS2 gene in CRC patients, we performed receiver operating characteristic (ROC) curve analysis and Kaplan-Meier (KM) survival curve analysis using a variety of datasets, including TCGA, the Kaplan-Meier Plotter database (https://kmplot.com/analysis),36 and eight GEO datasets (GSE9348, GSE17536, GSE17538, GSE18105, GSE31905, GSE103479, GSE106584, and GSE133057). The KM analysis was conducted using R software (version 4.0.2),37 along with the survival package (version 3.5–8)38 and the survminer package (version 0.4.9)39 for survival analysis and visualization. Survival curves were generated based on high and low EARS2 expression levels, with cutoff values determined either by X-tile software (version 3.6.1, http://tissuearray.org)40 or by median gene expression. ROC curve analysis was performed to differentiate between cancerous and normal tissues by calculating the area under the curve (AUC) and determining cutoff values. The pROC package (version 1.18.5) was employed for ROC curve analysis.41
To assess the correlation between EARS2 expression and clinicopathological indicators, we utilized EARS2 expression data from GSE103479 in conjunction with clinical data, including age, sex, mutation status, and survival information for clinicopathological analysis.
Development of the Nomogram
EARS2 expression, clinical features, and survival data were extracted from the GSE17536 dataset. Univariate and multivariate Cox analyses were performed utilizing the survival package (version 3.5–8).38 A prognostic nomogram for CRC patients was constructed using the rms package (version 6.8–0), based on the significant indicators identified in the univariate Cox analysis.42 The risk score of the nomogram was calculated using the following equation:43

To evaluate the model’s accuracy, we conducted a ROC curve analysis using the timeROC package (version 0.4).44 Additionally, calibration plots were generated to compare the nomogram-predicted survival rates at 1-year, 3-year, and 5-year intervals with the actual observed outcomes.
Functional Enrichment Analysis of the EARS2 Gene
Gene Ontology (GO) and Kyoto Encyclopedia of Genes and Genomes (KEGG) enrichment analyses were conducted on genes that exhibited differential expression between patients with high and low EARS2 expression in the TCGA_COAD dataset. This analysis aimed to elucidate the associated biological processes (BP), molecular functions (MF), cellular components (CC), and molecular pathways. Following this, gene set enrichment analysis (GSEA) was performed using the ‘Human MSigDB v2023.2 Gene Annotation Set’ alongside the GSEABase package (version 1.60.0).45 The GeneMANIA prediction server (https://genemania.org/) was employed to predict the function and biological network of EARS2.46 Genes associated with EARS2, extracted from the GeneMANIA gene network, underwent GO and KEGG enrichment analysis utilizing the Metascape network tool (https://metascape.org/).47 Additionally, the STRING network tool (https://cn.string-db.org/) was utilized to analyze and construct protein-protein interaction (PPI) networks pertinent to the EARS2 gene.48
To explore the miRNA network associated with the EARS2 gene, we gathered miRNA gene sets that interact with EARS2 from two prominent miRNA databases: Starbase (https://rnasysu.com/encori/)49 and miRnet (https://www.mirnet.ca/).50 By intersecting these two datasets, we established a potential EARS2-miRNA network.
Analysis of Immune Cell Infiltration and Immune Function
We employed the TIMER2.0 network analysis tool (http://timer.comp-genomics.org/timer/) to explore the relationships between EARS2 expression and the infiltration of 16 distinct immune cell types, including B cells, cancer-associated fibroblasts, endothelial cells, macrophages, mast cells, myeloid-derived suppressor cells, monocytes, myeloid dendritic cells, neutrophils, NK cells, plasmacytoid dendritic cells, CD4+ T cells, CD8+ T cells, follicular helper T cells, NK T cells, and regulatory T cells.51 To analyze the correlation between EARS2 expression and immune cell infiltration, we integrated multiple algorithms—Cibersort, Epic, Estimate, Mcp, Quantiseq, Timer, and xCell—and visualized our findings using a lollipop chart.
The correlation between EARS2 expression and immune-related molecules, including immunoinhibitors and chemokines was investigated, using the online analysis tool TISIDB (http://cis.hku.hk/TISIDB/index.php). Additionally, this study evaluated variations in EARS2 gene expression across six immune subtypes, as classified by Thorsson et al.52 These subtypes include C1 (Wound Healing), C2 (IFN-γ Dominant), C3 (Inflammatory), C4 (Lymphocyte Depleted), C5 (Immunologically Quiet), and C6 (TGF-β Dominant). Additionally, the study identified potential pharmacological agents that target the EARS2 gene.53
Sensitivity of Common Drug Analysis
To examine the correlation between EARS2 gene expression and drug sensitivity, we employed the Genomics of Drug Sensitivity in Cancer database to assess the variations in drug sensitivity between groups exhibiting high and low levels of EARS2 expression. Our analysis concentrated on the relationship between EARS2 gene expression and sensitivity to 275 distinct drugs.
Cell Culture and Transfection
Human CRC cell lines HCT116, HT29, and RKO were obtained from the American Type Culture Collection (ATCC) and cultured in RPMI-1640 medium supplemented with 10% fetal bovine serum (FBS) and 1% penicillin/streptomycin. The cells were maintained at 37°C in a humidified atmosphere containing 5% CO2. Following verification via Western blot analysis, two of the three cell lines exhibiting elevated EARS2 expression were selected for subsequent transfection knockdown experiments (Figure S2). Once the cells reached 60–70% confluence, they were transfected using Lipofectamine 3000 according to the manufacturer’s instructions. This transfection involved the application of EARS2-specific small interfering RNAs (siRNAs) (si-EARS2-1, si-EARS2-2, si-EARS2-3, or si-EARS2-4) or a negative control siRNA (si-NC). The specific sequences of the EARS2 siRNAs used in the experiments are detailed in Table S1. The day following transfection, total RNA was extracted using TRIzol and subsequently converted to complementary DNA (cDNA) using a cDNA synthesis kit. Western blot analysis was then performed to assess the silencing efficiency, with beta-actin serving as the internal control.
Cell Proliferation Assay
Following transfection, the cells were seeded into 96-well plates at a density of 5000 cells per well. The cells were cultured for 24, 48, 72, 96, or 120 hours. At predetermined time points, 10 μL of Cell Counting Kit-8 (CCK-8, Dojindo, Japan) reagent was added to each well, and the cells were incubated for 2 hours. Subsequently, the optical density (OD) was measured using a plate reader.
Cell Migration and Invasion Assay
In the migration assay, once the cells reached 90% confluence, a scratch was created in the 6-well plates using a 200 μL pipette tip. The culture medium was then replaced with serum-free medium to minimize the effects of cell proliferation on the experimental outcomes. Phase-contrast microscopy images were captured at the initial time point, as well as at 24- and 48-hours post-scratch. For the assessment of invasion and migration, transwell chambers were utilized, with some being precoated with Matrigel and others remaining uncoated. Cells suspended in serum-free medium were added to the upper chamber, while the lower chamber was filled with medium supplemented with 10% FBS. After a 24-hour incubation period, the cells were fixed and stained.
Cell Apoptosis Assay
To further explore the role of EARS2 in cellular processes, apoptosis assays were conducted after cell culture and transfection with EARS2-specific siRNA. Following the manufacturer’s transfection protocol, the cells were harvested and subsequently labeled with the Annexin V-FITC/PI kit to detect apoptosis. Flow cytometry was then utilized to analyze the extent of cellular apoptosis.
Statistical Analysis
Data analysis, statistical evaluation, and result presentation were performed using R software (version 4.0.4) and GraphPad Prism 10.0 software (GraphPad, USA). Grayscale images were converted, and semiquantitative analysis was conducted using ImageJ 1.46r software (ImageJ, USA). The overall survival of CRC patients was assessed using the Kaplan-Meier method. The diagnostic accuracy of genes in CRC patients was evaluated through ROC curve analysis. Continuous variables between two independent groups were compared using either the Wilcoxon rank-sum test or the unpaired t-test, while multiple sets of continuous variables were analyzed using one-way ANOVA. A P-value of less than 0.05 was deemed to indicate statistical significance in all analyses.
Results
Elevated Expression of EARS2 Gene in CRC
Differential analysis of RNA-seq data from the GSE21510 and GSE180440 datasets, comparing CRC tissue to normal tissue, identified 4,423 and 6,555 genes of interest, respectively (Figure 2A and B, Tables S2 and S3). By extracting and organizing genes associated with lactic acid metabolism from the MsigDB database, a total of 303 relevant genes were identified (Tables S4 and S5). In the GSE21510 dataset, SVM regression and LASSO analyses were performed on the differentially expressed genes related to lactic acid metabolism in both tumor and normal tissue samples, leading to the identification of 16 and 13 significant genes, respectively (Figure 2C and D and Table S6). Using Weighted Gene Co-expression Network Analysis (WGCNA), we identified a total of 6,521 tumor-related genes within the turquoise and blue modules of the GSE21510 dataset, categorized by sample type (Figure 2E and F and Table S6). The intersection of these gene sets highlighted three key genes: EARS2, MRPL3, and PNPT1 (Figure 2G). KM analysis indicated that EARS2 exhibited strong prognostic value, while MRPL3 and PNPT1 did not demonstrate any prognostic significance (Figure S1). Consequently, we selected the EARS2 gene for further exploration and analysis.
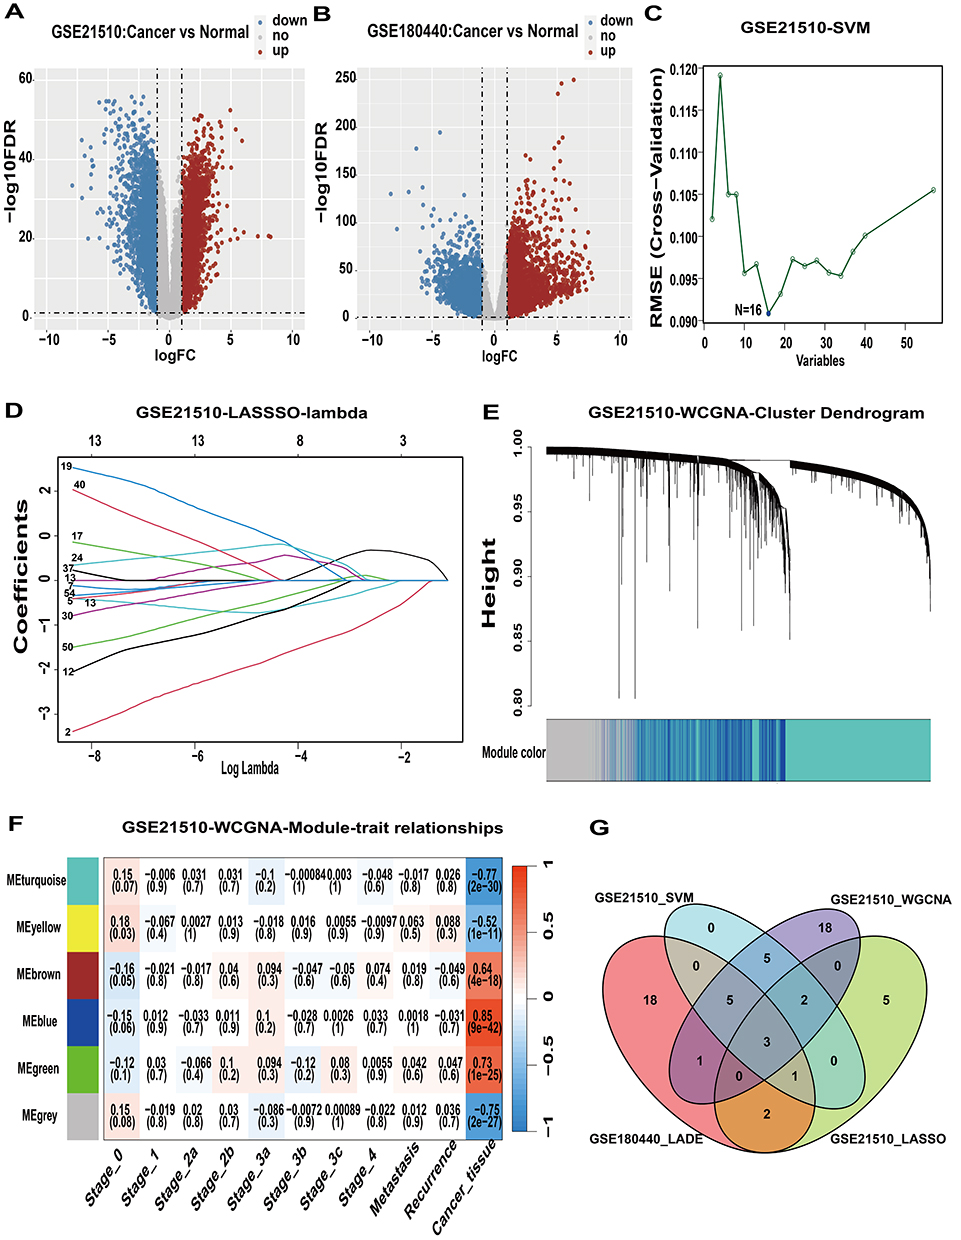 |
Figure 2 Screening of core genes of the lactic acid metabolic pathway. (A and B) Differential analysis of the GSE21510 and GSE180440 datasets. (C) SVM analysis of the GSE21510 dataset. (D) LASSO analysis of the GSE21510 dataset. (E) Clustering in WGCNA. (F) Module analysis related to sample type in WGCNA. (G) Venn diagram of key genes. Abbreviations: SVM, Support Vector Machines; LASSO, Least Absolute Shrinkage and Selection Operator; WGCNA, Weighted Gene Coexpression Network Analysis; LADE, Lactic acid metabolism differential gene. |
To investigate the differential expression patterns of EARS2 in colorectal tumors compared to normal tissues, we conducted an analysis utilizing data from TCGA in conjunction with five GEO datasets: GSE9348, GSE20842, GSE21510, GSE37182, and GSE39582. The results demonstrated a significant upregulation of the EARS2 gene in CRC tissues relative to normal colorectal tissues (Figure 3A–F). Moreover, validation using HPA immunohistochemical data confirmed the elevated expression of EARS2 in tumor tissues (Figure 3G and H).
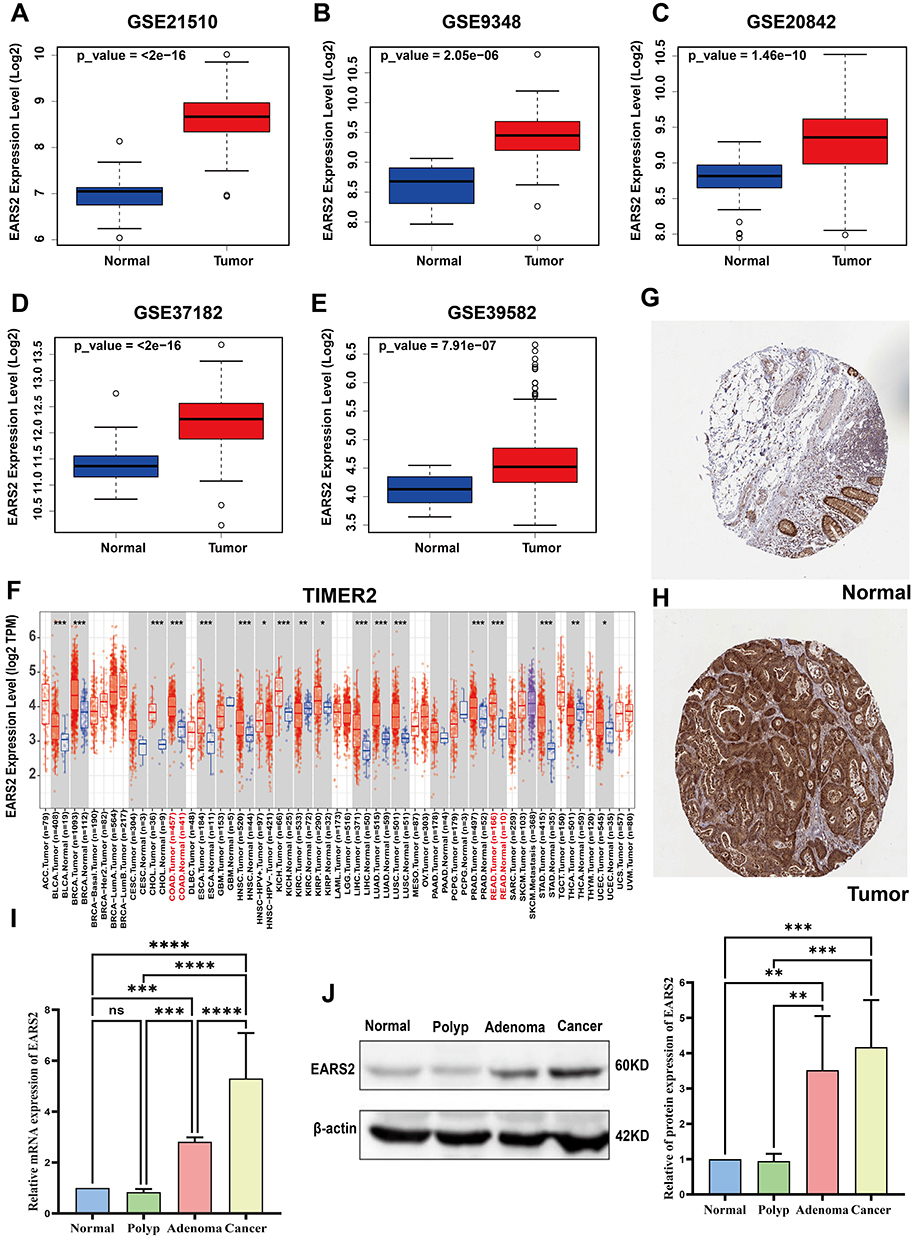 |
Figure 3 EARS2 expression levels in colorectal tissues. (A-E) Boxplots representing EARS2 expression levels (log2) in normal versus tumor tissues from different CRC-related GEO datasets (GSE21510, GSE9348, GSE20842, GSE37182, and GSE39582). (F) EARS2 expression levels in various tumor types and adjacent normal tissues from the TIMER2 database. The red text labels colon adenocarcinoma (COAD) and rectum adenocarcinoma (READ), highlighting EARS2 expression in these two cancer types (G and H) Immunohistochemical analysis of the HPA indicated that EARS2 was highly expressed in CRC tissues.(I and J) qRT-PCR and WB analyses revealed differential EARS2 expression in normal tissue, polyp tissue, adenoma tissue, and tumor tissue at both the gene and protein levels. *, P<0.05; **, P<0.01; ***, P<0.001; ****, P<0.0001. Abbreviations: COAD, Colon Adenocarcinoma; READ, Rectum Adenocarcinoma; ns, not significant. |
Subsequent qPCR and WB analyses conducted on samples from our institution further supported the increased EARS2 expression in tumors at both the gene and protein levels. Notably, we observed a positive correlation between EARS2 expression and tumor malignancy, as indicated by the rising EARS2 expression levels associated with higher tumor grades (Figure 3I and J). These findings suggest that EARS2 expression is elevated in CRC and is correlated with lactic acid metabolism, indicating its potential role in CRC progression.
Diagnostic and Prognostic Significance of EARS2 in CRC Patients
To investigate the diagnostic and prognostic significance of EARS2, we performed ROC curve analysis and KM survival analysis using datasets obtained from TCGA, KM Plotter, and GEO databases, specifically GSE9348, GSE17536, GSE18105, GSE31905, GSE106584, and GSE133057. The ROC curve analysis demonstrated diagnostic accuracies of 0.913, 0.936, 0.753, and 0.945 for EARS2, indicating strong diagnostic performance (Figure 4A). Survival analysis utilizing KM curves revealed that increased EARS2 expression correlated with poorer overall survival (OS) outcomes, with P-values less than 0.05 (Figure 4B). Additionally, high EARS2 expression was associated with unfavorable rates of disease-free survival (DFS), disease-specific survival (DSS), progression-free survival (PFS), and recurrence-free survival (RFS) (Figure S3).
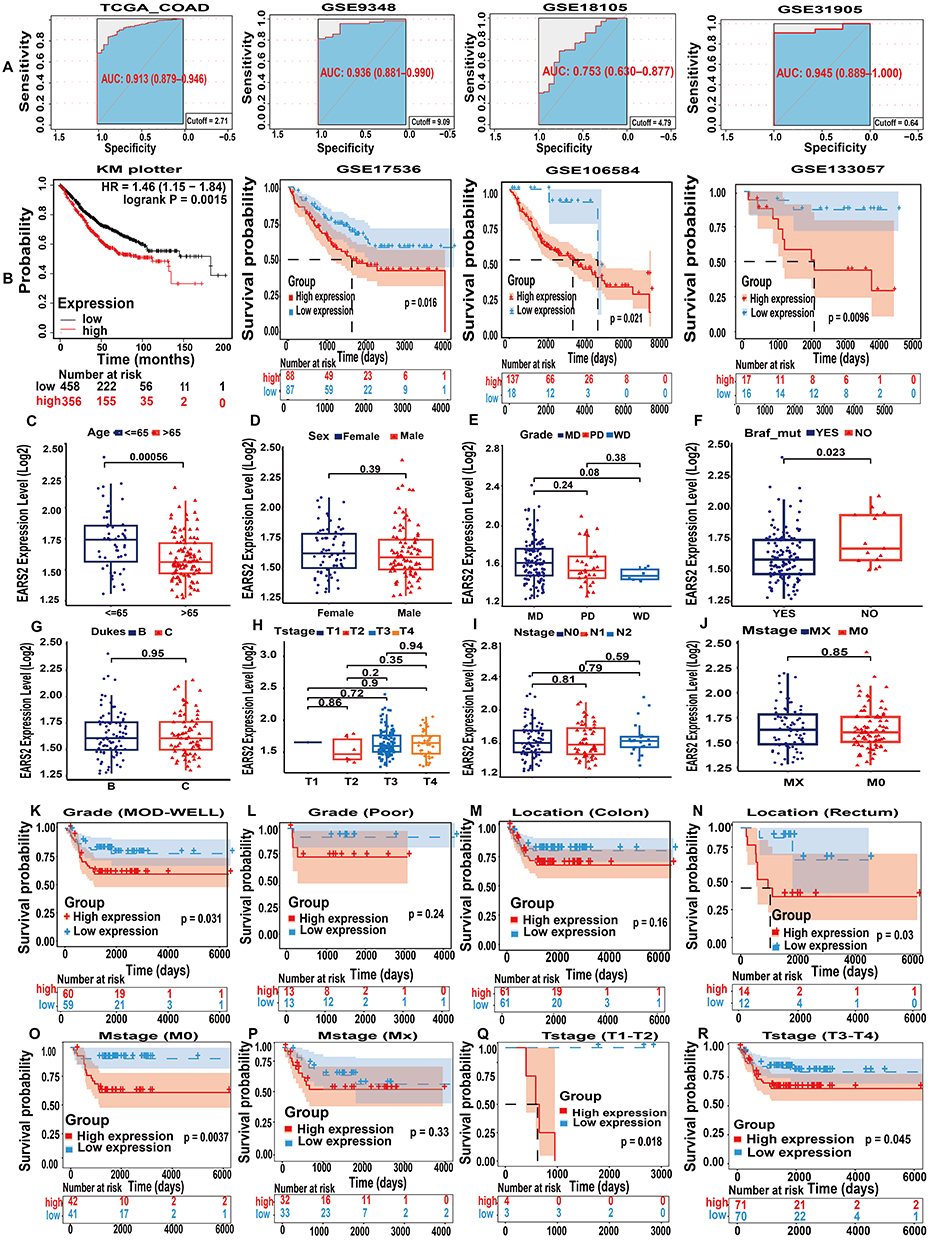 |
Figure 4 The diagnostic, prognostic value of EARS2 and clinicopathological analysis. (A) ROC curve analysis revealed that EARS2 has an excellent ability to differentiate tumor tissue from normal tissue, with AUC values exceeding 0.75 across all four datasets. (B) High EARS2 expression predicts poor OS in CRC patients according to Kaplan–Meier (KM) curve analysis. (C-J) Clinicopathological analysis of EARS2 gene expression in different subgroups in the GSE103479 dataset. (K-R) Clinicopathological analysis of GSE103479 dataset revealed the influence of EARS2 gene expression on PFS across various patient subgroups. Abbreviations: MD, moderately differentiated; PD, poorly differentiated; WD, well differentiated; MOD, moderately of differentiated. |
Through a clinicopathological analysis of the GSE103479 dataset, we observed that EARS2 gene expression was significantly lower in CRC patients aged over 65 years and higher in patients with BRAF mutations. Notably, factors such as sex, tumor grade, Dukes stage, and TNM stage did not have a significant impact on EARS2 gene expression (Figure 4C–J). Furthermore, subgroup analyses utilizing Kaplan-Meier survival analysis methods for CRC patients revealed that elevated expression of EARS2 is associated with poorer PFS in patients with moderately to highly differentiated CRC. Here, “highly differentiated” denotes tumors that closely resemble normal tissue in both structure and function, indicative of lower-grade malignancies (Figure 4K and L). Furthermore, high EARS2 expression was found to correlate with worse PFS in rectal cancer patients (Figure 4M and N), in M0 patients—those without distant metastasis according to the TNM staging system (Figure 4O and P), and across all T stages (Figure 4Q and R).
Univariate and multivariate Cox analyses were conducted to assess OS and DSS within the GSE17536 cohort. The results from the univariate Cox regression analysis revealed that EARS2 expression and clinical stage significantly influenced OS and DSS in CRC patients (Figures 5A and S4A). Furthermore, the multivariate Cox regression analysis established EARS2 as an independent risk factor for both OS and DSS (Figures 5B and S4B). Nomogram models were developed based on the significant indicators identified through univariate analysis (Figures 5C and S4C). Subsequently, the prognostic models were assessed for their differentiation and calibration using ROC curves and calibration curves. The ROC curves for the nomogram models predicting all-cause mortality yielded AUC values of 0.829, 0.787, and 0.800 for one-year, three-year, and five-year predictions, respectively (Figure 5D). In a similar manner, the ROC curves for the nomogram models predicting cancer-specific mortality exhibited AUC values of 0.824, 0.832, and 0.813 for one-year, three-year, and five-year projections, respectively (Figure S4D). The calibration curves for the nomogram models assessing overall OS and DSS demonstrated a close alignment between the observed outcomes and the predicted probabilities (Figures 5E and S4E). These data indicate the association of EARS2 expression with survival outcomes in CRC.
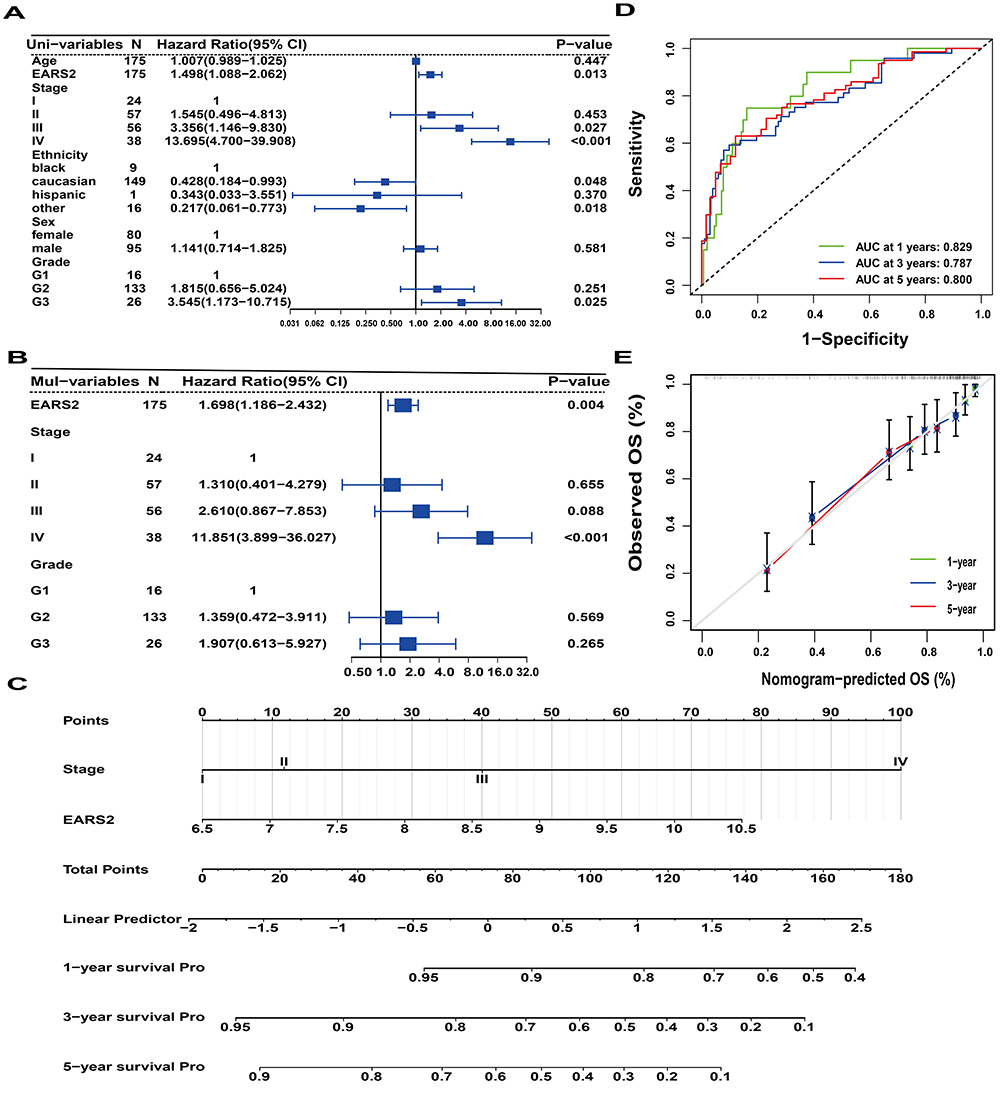 |
Figure 5 Prognostic model construction and analysis. (A) Two indexes were chosen by using univariate Cox regression analysis to influence overall survival.(B) EARS2 stands out as an independent predictor of prognosis, as indicated by multivariate Cox analysis.(C) Nomogram constructed based on univariate Cox regression analysis results. (D) ROC curve analysis to assess the discrimination power of the nomogram model. (E). Calibration curve analysis of nomogram model. |
Comprehensive Analysis of EARS2-Related Genes in CRC for Precision Medicine
The TCGA_COAD dataset was stratified based on EARS2 expression levels, leading to the identification of 894 significant genes through differential expression analysis (Figure 6A and Table S7). KEGG enrichment analysis demonstrated that these 894 genes were predominantly associated with pathways such as neuroactive ligand-receptor interaction, protein digestion and absorption, and cholesterol metabolism (Figure 6B). Moreover, GO enrichment analysis for these significant genes across the BP, MF, and CC categories is illustrated in Figure 6C. Additionally, GSEA results indicated that these genes were implicated in 6611 pathways (Table S8), with the top five downregulated and upregulated pathways depicted in Figure 6D and E.
 |
Figure 6 Enrichment and PPI analysis of the EARS2 gene. (A) The difference analysis of the EARS2 high-and low-expression groups was based on the TCGA_COAD dataset. (B-E) GO, KEGG and GSEA enrichment analyses were performed on the DEGs in the EARS2 high-low subgroup. (F) GeneMANIA gene network of EARS2. (G) GO and KEGG enrichment analyses of EARS2-related genes from the GeneMANIA gene network. (H) PPI analysis of the 11 EARS2-related genes from STRING. (I and J) EARS2-miRNA network construction. The red dots represent mRNA and the blue squares represent miRNA. |
Using the GeneMANIA gene network tool, we identified twenty-one genes related to EARS2, which were utilized to construct a gene regulatory network map that illustrates the physical interactions, coexpression, pathways, and gene functions among these genes (Figure 6F). The results of GO and KEGG enrichment analyses for these 21 genes were performed using the MetScape web tool (Figure 6G). Additionally, the findings from the PPI analysis conducted with the STRING network tool are depicted in Figure 6H, emphasizing EARS2 as the central gene among the 11 interactive network genes. Furthermore, we identified a total of 42 miRNAs associated with EARS2 from the Starbase database, in addition to 25 miRNAs from the miRNet database. The intersection of these datasets yielded four common miRNAs: hsa-mir-24-3p, hsa-mir-1-3p, hsa-mir-146a-5p, and hsa-mir-7-5p (Figure 6I and J). Together the integration of gene regulatory network analysis of EARS2 in CRC reveals potential therapeutic targets.
EARS2 Expression Correlates With Tumor Immunity and Therapeutic Sensitivity in CRC
To further explore the therapeutic potential of targeting EARS in CRC, we examined the relationship between tumor immunity, drug sensitivity, and EARS2 expression. By integrating various immune cell infiltration algorithms, our study revealed strong positive associations between EARS2 expression and the presence of endothelial cells, NK cells, cancer-associated fibroblasts, macrophages, MDSCs, neutrophils, myeloid dendritic cells, monocytes, and T follicular helper cells. In contrast, we observed a negative correlation between EARS2 expression and CD4+ effector memory T cells (Figure 7A). The statistical significance of the variation in EARS2 gene expression across five immune subtypes (C1, C2, C3, C4, and C6) was confirmed with a P-value of less than 0.001 (Figure 7B). Elevated expression levels of EARS2 were observed in patients classified as C1 and C2, in contrast to those categorized as C3 and C6, underscoring its potential role in immune regulation. Additionally, EARS2 expression demonstrated significant correlations with 23 immune-related factors, including positive associations with ICOSLG and CXCL14, alongside negative associations with other immune-related components (Figure 7C). Additionally, using the TISIDB database, we identified glutamic acid (DrugBank Accession Number: DB00142) as a promising drug candidate for targeting the EARS2 gene (Figure 7D). Moreover, an analysis of the Genomics of Drug Sensitivity in Cancer database revealed a robust correlation between EARS2 expression levels and the responsiveness to 31 commonly utilized drugs (Table S9). Increased EARS2 expression was linked to heightened sensitivity to these pharmacological agents, with the specific details of the 12 significant findings illustrated in Figure 8. These results demonstrate that EARS2 correlates with tumor immunity and therapeutic sensitivity.
 |
Figure 7 Immune infiltration and functional analysis. (A) Correlation analysis between immune infiltration of 22 types of immune cells and EARS2 expression. (B) Analysis of differences in EARS2 gene expression among different immune subtypes. (C) Correlation analysis between immune-related molecules and EARS2 expression. (D) Prediction of drugs targeting the EARS2 gene based on TISIDB. *, P<0.05; **, P<0.01; ***, P<0.001; ****, P<0.0001. |
 |
Figure 8 Drug sensitivity analysis. (A-L) Differential analysis of the sensitivity to 12 drugs, such as fortinib, GSK2256098C, GSK2276186C, IWP-2, lenalidomide and oxaliplatin, in high- and low-expression groups. |
EARS2 Knockdown Inhibits CRC Cell Proliferation and Invasion
To further investigate the impact of EARS2 on CRC cells, we analyzed its effects on various cellular processes, including cell growth, motility, and programmed cell death. By utilizing si-EARS2-2, we successfully downregulated EARS2 expression in HT29 and RKO cell lines (Figure S5). Following EARS2 knockdown, we observed a significant reduction in the migration and invasion capabilities of both CRC cell lines (Figure 9A and B). Additionally, flow cytometry data reinforced the role of EARS2 in inhibiting apoptosis within CRC cells (Figure 9C). Moreover, the results from the CCK-8 assay indicated a substantial decrease in cell proliferation in the EARS2-silenced group when compared to both the control and si-NC groups (Figure 9D). These results suggest that EARS contributes to the proliferation and invasion of CRC cells.
 |
Figure 9 Effect of EARS2 on the proliferation, migration, and apoptosis of CRC cells. (A and B) Compared with the control and si-NC groups, the EARS2 knockdown group exhibited inhibited migration and invasion ability in CRC cell lines. (C) Flow cytometry revealed that EARS2 depletion increased apoptosis in CRC cell lines. (D) Depleting EARS2 significantly suppressed the proliferation of HT29 and RKO cells. ns, not significant; *, P<0.05; **, P<0.01; ***, P<0.001; ****, P<0.0001. |
Discussion
CRC is a common malignancy, representing approximately 10% of all cancer cases and accounting for 9.4% of cancer-related deaths worldwide. Recent studies have underscored the significant role of lactic acid in facilitating immune evasion, cellular proliferation, metastasis, and the progression of CRC.54–57 Inhibition of lactate activity has been demonstrated to enhance drug sensitivity in CRC treatment.58,59 Furthermore, dysfunction of the EARS2 gene can lead to oxidative phosphorylation subtype 12 deficiency, which is associated with lactic acidosis, intellectual disability, and mitochondrial damage.60–62 However, the precise role of EARS2 in lactic acid metabolism and its implications for the onset and progression of CRC remain unclear. Through a comprehensive analysis of various public databases and experimental data, we have confirmed the upregulation of the EARS2 gene in CRC. Additionally, we found a correlation between EARS2 expression levels and the severity of colorectal tissue lesions, suggesting a potential role for EARS2 in CRC development. Further investigations are necessary to validate this hypothesis. Notably, EARS2 is highly expressed in tumor tissues, allowing for effective differentiation between malignant and normal tissues. Moreover, elevated expression of EARS2 is associated with poorer prognosis, underscoring its potential as both a diagnostic and prognostic biomarker. The correlation between EARS2 levels and decreased PFS in M0 (patients—those without distant metastasis) indicates that EARS2 may promote tumor progression through mechanisms that are independent of metastasis. Further investigation is required to clarify the mechanisms by which EARS2 affects tumor behavior in M0 patients and to assess its potential as a therapeutic target for reducing the risk of recurrence in early-stage CRC.
As a member of the class I family of aminoacyl-tRNA synthases, EARS2 plays a critical role in protein biosynthesis,13 a fundamental process essential for the growth and proliferation of CRC cells, which is consistent with our research findings. Notably, the mitochondrial localization of EARS2 suggests its potential involvement in cellular energy metabolism, a key aspect of CRC pathogenesis.63 Our results indicate that genes differentially expressed between high and low EARS2 expression groups are enriched in cholesterol metabolism, implying that variations in EARS2 expression may influence lipid metabolism in CRC by modulating the differential expression of other genes. Through GO enrichment analysis, we found that EARS2 expression significantly impacts both cellular and humoral immune functions in CRC. Furthermore, in constructing a PPI network, we identified genes closely associated with EARS2, including LARS2, GATB, and EPRS1. Previous studies have underscored the critical roles of these genes in disease progression, particularly in affecting immune cell functionality.64,65 Consequently, our findings suggest that EARS2 may contribute to the initiation and progression of CRC by modulating immune cell function, thereby providing potential insights for immunotherapy in CRC.
By constructing miRNA‒mRNA networks, we identified four upstream miRNAs that may regulate EARS2 gene expression: hsa-mir-24-3p, hsa-mir-1-3p, hsa-mir-146a-5p, and hsa-mir-7-5p. Previous studies have associated hsa-mir-24-3p with colon polyps,66 hsa-mir-1-3p with inflammatory bowel disease through the regulation of MALAT1 and IL-6,67 hsa-mir-146a-5p with colorectal tumors via SPP1 gene regulation,68 and hsa-mir-7-5p with CRC patient prognosis through IL-2RG regulation.69 Nevertheless, further investigations are required to elucidate the complex regulatory relationships between EARS2 and these miRNAs.
Tumor-associated immune cells within the TME play a critical role in tumor progression.2 Utilizing a range of immunological algorithms, we have demonstrated a positive correlation between EARS2 expression and the infiltration of CAFs, MDSCs, NK cells, monocyte-MDCs, and macrophages. Given the complex regulation of immune cells, the significant influence of the EARS2 gene on immune cell function highlights the necessity for further comprehensive exploration and validation. Our study revealed significant variations in the expression of the EARS2 gene expression across different immune subtypes, suggesting its potential role in immune regulatory mechanisms. Additionally, our research demonstrated a correlation between EARS2 expression and the levels of several immune regulatory factors, including immunostimulators, immunoinhibitors, and chemokines. This finding is crucial for enhancing our understanding of the regulatory mechanisms governing immune responses, improving disease diagnosis, developing effective treatment strategies, and advancing personalized medicine.
Chemotherapy remains the primary treatment for patients with CRC, and its overall therapeutic effectiveness is significantly influenced by drug sensitivity. Oxaliplatin is a commonly used chemotherapeutic agent for CRC patients.70 The combination of ribociclib with irinotecan71 or 5-fluorouracil72 has been shown to enhance drug efficacy against CRC cell proliferation. Additionally, pevonedistat has been found to induce CRC cell death through various apoptotic pathways, including both p53-dependent and p53-independent mechanisms, and it has demonstrated potential synergy with irinotecan-based chemotherapy, suggesting its viability as a combination agent.73 Our drug sensitivity analysis indicated a potential link between EARS2 gene expression and drug sensitivity in CRC. This finding implies that assessing EARS2 expression levels may enable predictions regarding CRC patients’ responses to specific drugs, thereby paving the way for personalized treatment approaches. Furthermore, analyzing EARS2 drug sensitivity could facilitate the development of novel CRC therapeutics that target tumor growth and dissemination by directly interfering with EARS2 function. Analysis conducted via the TISIDB website identified glutamic acid (DB00142) as a potential drug for targeting the EARS2 gene, warranting further validation in future studies. Additionally, our cell function experiments revealed that the knockdown of the EARS2 gene inhibited the proliferation, migration, and infiltration of CRC cells while promoting apoptosis. These findings are consistent with the results of our prognostic analysis.
Despite the insights gained from our study, several limitations must be acknowledged. The small sample size indicates a potential trend toward increased EARS2 gene expression associated with more severe colorectal lesions; however, this observation requires validation through larger-scale experiments. Additionally, we have not yet explored the role of EARS2 in colorectal tumorigenesis using animal models, highlighting the need for further research to confirm our findings and elucidate the underlying mechanisms.
Conclusion
This study investigates the role of EARS2, a crucial gene involved in the lactic acid metabolic pathway, as a diagnostic, prognostic and therapeutic biomarker in CRC. The development of a prognostic correlation model that incorporates EARS2 has demonstrated significant prognostic value, indicating that elevated EARS2 expression is linked to a poorer prognosis. Furthermore, EARS2 may influence the proliferation, migration, and apoptosis of CRC cells while also modulating tumor immunity. Additionally, EARS2 could impact the sensitivity of CRC to chemotherapeutic agents. Overall, the insights gained from this research on EARS2 may deepen our understanding of CRC pathogenesis and progression, offering potential therapeutic targets and enhancing patient survival rates.
Abbreviations
ATCC, American Type Culture Collection; AUC, Area Under the Curve; BP, Biological Processes; CC, Cellular Components; CCK-8, Cell Counting Kit-8; CRC, Colorectal Cancer; DEGs, Differentially Expressed Genes; DFS, Disease-Free Survival; DSS, Disease-Specific Survival; FBS, fetal bovine serum; GEO, Gene Expression Omnibus; GO, Gene Ontology; GSEA, Gene Set Enrichment Analysis; HPA, Human Protein Atlas; KEGG, Kyoto Encyclopedia of Genes and Genomes; KM, Kaplan‒Meier; LARGs, Lactic Acid Metabolism Related Genes; LASSO, Least Absolute Shrinkage and Selection Operator; logFC, Log Fold Change; MD, Moderately Differentiated; MF, Molecular Functions; OD, Optical Density; OS, Overall Survival; PD, Poorly Differentiated; PFS, Progression-Free Survival; PPI, Protein-Protein Interaction; qPCR, quantitative polymerase chain reaction; RFS, Recurrence-Free Survival; RNA-seq, RNA-sequencing; ROC, Receiver Operating Characteristic; SVM, Support Vector Machines; TCGA, The Cancer Genome Atlas; TME, tumor microenvironment; WB, Western blot; WD, well differentiated; WGCNA, Weighted Gene Coexpression Network Analysis.
Data Sharing Statement
Data is provided within the manuscript or supplementary information files.
Ethics Approval and Informed Consent
All procedures conformed to the Helsinki Declaration for research on humans. Signed informed consent was obtained from all patients. This experimental research was approved by the Ethics Committee of Chongqing University Cancer Hospital with the approval code CZLS2023085-A.
Author Contributions
All authors made a significant contribution to the work reported, whether that is in the conception, study design, execution, acquisition of data, analysis and interpretation, or in all these areas; took part in drafting, revising or critically reviewing the article; gave final approval of the version to be published; have agreed on the journal to which the article has been submitted; and agree to be accountable for all aspects of the work.
Funding
This study was funded by the Key Laboratory Open Fund Project of Chongqing University Cancer Hospital (cquchkfjj006) to Jiaxi Tang and the Medical research project of Health Commission, Chongqing, China (2023MSXM033) to Shaojin Bu.
Disclosure
The authors declare that they have no competing interests.
References
1. Sung H, Ferlay J, Siegel RL, et al. Global cancer statistics 2020: GLOBOCAN estimates of incidence and mortality worldwide for 36 cancers in 185 countries. CA A Cancer J Clin. 2021;71(3):209–249. doi:10.3322/caac.21660
2. Kuipers EJ, Grady WM, Lieberman D, et al. Colorectal cancer. Nat Rev Dis Prim. 2015;1:15065.
3. Zacharakis M, Xynos ID, Lazaris A, et al. Predictors of survival in stage IV metastatic colorectal cancer. Anticancer Res. 2010;30(2):653–660.
4. Biller LH, Schrag D. diagnosis and treatment of metastatic colorectal cancer: a review. JAMA. 2021;325(7):669–685. doi:10.1001/jama.2021.0106
5. Arnold M, Sierra MS, Laversanne M, Soerjomataram I, Jemal A, Bray F. Global patterns and trends in colorectal cancer incidence and mortality. Gut. 2017;66(4):683–691. doi:10.1136/gutjnl-2015-310912
6. Certo M, Tsai CH, Pucino V, Ho PC, Mauro C. Lactate modulation of immune responses in inflammatory versus tumour microenvironments. Nat Rev Immunol. 2021;21(3):151–161. doi:10.1038/s41577-020-0406-2
7. Vaupel P, Schmidberger H, Mayer A. The Warburg effect: essential part of metabolic reprogramming and central contributor to cancer progression. Internat J Rad Bio. 2019;95(7):912–919. doi:10.1080/09553002.2019.1589653
8. Dhup S, Dadhich RK, Porporato PE, Sonveaux P. Multiple biological activities of lactic acid in cancer: influences on tumor growth, angiogenesis and metastasis. Curr Pharm Des. 2012;18(10):1319–1330. doi:10.2174/138161212799504902
9. Pérez-Tomás R, Pérez-Guillén I. Lactate in the tumor microenvironment: an essential molecule in cancer progression and treatment. Cancers. 2020;12(11):3244. doi:10.3390/cancers12113244
10. Harmon C, Robinson MW, Hand F, et al. Lactate-mediated acidification of tumor microenvironment induces apoptosis of liver-resident NK cells in colorectal liver metastasis. Cancer Immunol Res. 2019;7(2):335–346.
11. Kumar A, Pyaram K, Yarosz EL, et al. Enhanced oxidative phosphorylation in NKT cells is essential for their survival and function. Proc Natl Acad Sci U S A 2019;116:7439–7448.
12. Nasi A, Fekete T, Krishnamurthy A, et al. Dendritic cell reprogramming by endogenously produced lactic acid. J Immunol. 2013;191(6):3090–3099. doi:10.4049/jimmunol.1300772
13. Morrot A, da Fonseca LM, Salustiano EJ, et al. Metabolic symbiosis and immunomodulation: how tumor cell-derived lactate may disturb innate and adaptive immune responses. Front Oncol. 2018;8:81.
14. Mu X, Shi W, Xu Y, et al. Tumor-derived lactate induces M2 macrophage polarization via the activation of the ERK/STAT3 signaling pathway in breast cancer. Cell Cycle. 2018;17(4):428–438. doi:10.1080/15384101.2018.1444305
15. Zhang L, Li S. Lactic acid promotes macrophage polarization through MCT-HIF1α signaling in gastric cancer. Exp Cell Res. 2020;388(2):111846. doi:10.1016/j.yexcr.2020.111846
16. Colegio OR, Chu NQ, Szabo AL, et al. Functional polarization of tumour-associated macrophages by tumour-derived lactic acid. Nature. 2014;513(7519):559–563.
17. San-Millán I, Brooks GA. Reexamining cancer metabolism: lactate production for carcinogenesis could be the purpose and explanation of the Warburg Effect. Carcinogenesis. 2017;38(2):119–133. doi:10.1093/carcin/bgw127
18. Goetze K, Walenta S, Ksiazkiewicz M, Kunz-Schughart LA, Mueller-Klieser W. Lactate enhances motility of tumor cells and inhibits monocyte migration and cytokine release. Int J Oncol. 2011;39(2):453–463. doi:10.3892/ijo.2011.1055
19. Walenta S, Mueller-Klieser WF. Lactate: mirror and motor of tumor malignancy. Sem Rad Oncol. 2004;14(3):267–274. doi:10.1016/j.semradonc.2004.04.004
20. Bourguignon LY, Singleton PA, Diedrich F, Stern R, Gilad E. CD44 interaction with Na+-H+ exchanger (NHE1) creates acidic microenvironments leading to hyaluronidase-2 and cathepsin B activation and breast tumor cell invasion. J Biol Chem. 2004;279(26):26991–27007. doi:10.1074/jbc.M311838200
21. Kumar VB, Viji RI, Kiran MS, Sudhakaran PR. Endothelial cell response to lactate: implication of PAR modification of VEGF. J Cell Physiol. 2007;211(2):477–485. doi:10.1002/jcp.20955
22. Polet F, Feron O. Endothelial cell metabolism and tumour angiogenesis: glucose and glutamine as essential fuels and lactate as the driving force. J Internal Med. 2013;273(2):156–165. doi:10.1111/joim.12016
23. Prasun P, Mintz C, Cork E, Naidich TP, Webb BD. Broad spectrum of clinical presentation in EARS2 beyond typical ”leukoencephalopathy with thalamus and brain stem involvement”. J Neurol Sci. 2019;406:116448. doi:10.1016/j.jns.2019.116448
24. Yin KF, Chen T, Gu XJ, et al. Identification of potential causal genes for neurodegenerative diseases by mitochondria-related genome-wide Mendelian randomization. Mole Neurobio. In press2024. doi:10.1007/s12035-024-04528-3
25. Boutaud L, Ruzzenente B, Tessier A, et al. Neuropathological hallmarks of antenatal mitochondrial diseases with a corpus callosum defect. Brain J Neuro. 2023;146(5):1804–1811. doi:10.1093/brain/awac417
26. Ai X, Shen H, Wang Y, et al. Developing a diagnostic model to predict the risk of asthma based on ten macrophage-related gene signatures. Biomed Res Int. 2022;2022(1):3439010. doi:10.1155/2022/3439010
27. Sawada D, Naito S, Aoyama H, et al. Remitting and exacerbating white matter lesions in leukoencephalopathy with thalamus and brainstem involvement and high lactate. Brain Dev. 2021;43(7):798–803. doi:10.1016/j.braindev.2021.03.008
28. Park J, Lutz SM, Choi S, et al. Multi-omics analyses implicate EARS2 in the pathogenesis of atopic dermatitis. Allergy. 2021;76(8):2602–2604. doi:10.1111/all.14837
29. Feng Y, Tang K, Lai Q, et al. The landscape of aminoacyl-tRNA synthetases involved in severe acute respiratory syndrome coronavirus 2 infection. Front Physiol. 2021;12:818297.
30. Zhong Q, Sun R, Aref AT, et al. Proteomic-based stratification of intermediate-risk prostate cancer patients. Life Sci Alliance. 2024;7(2):e202302146. doi:10.26508/lsa.202302146
31. Lehrer S, Rheinstein PH. EARS2 significantly coexpresses with PALB2 in breast and pancreatic cancer. Cancer Trea Res Comm. 2022;32:100595. doi:10.1016/j.ctarc.2022.100595
32. Cui Y, Han B, Zhang H, Liu H, Zhang F, Niu R. Identification of metabolic-associated genes for the prediction of colon and rectal adenocarcinoma. Onco Targets Ther. 2021;14:2259–2277. doi:10.2147/OTT.S297134
33. Yang W, Soares J, Greninger P, et al. Genomics of drug sensitivity in cancer (GDSC): a resource for therapeutic biomarker discovery in cancer cells. Nucleic Acids Res. 2013;41(Database issue):D955–961. doi:10.1093/nar/gks1111
34. Subramanian A, Tamayo P, Mootha VK, et al. Gene set enrichment analysis: a knowledge-based approach for interpreting genome-wide expression profiles. Proc Natl Acad Sci U S A 2005;102:15545–15550.
35. Tsukamoto S, Ishikawa T, Iida S, et al. Clinical significance of osteoprotegerin expression in human colorectal cancer. Clinl Cancer Res Official J Ame Assoc Cancer Res. 2011;17(8):2444–2450. doi:10.1158/1078-0432.CCR-10-2884
36. Lánczky A, Győrffy B. Web-based survival analysis tool tailored for medical research (KMplot): development and implementation. J Med Int Res. 2021;23(7):e27633. doi:10.2196/27633
37. R Core Team. R: A language and Environment for Statistical Computing. Vienna, Austria: R Foundation for Statistical Computing; 2022.Available from: https://www.R-project.org/.
38. Therneau T. _A Package for Survival Analysis in R_. R package version 3.5-8. 2024;https://CRAN.R-project.org/package=survival.
39. Kassambara A, Kosinski M, Biecek P. Survminer: drawing survival curves using ‘ggplot2’. R package version 0.4.9. 2021. https://CRAN.R-project.org/package=survminer.
40. Camp RL, Dolled-Filhart M, Rimm DL. X-tile: a new bio-informatics tool for biomarker assessment and outcome-based cut-point optimization. Clinl Cancer Res Official J Ame Assoc Cancer Res. 2004;10(21):7252–7259. doi:10.1158/1078-0432.CCR-04-0713
41. Robin X, Turck N, Hainard A, et al. pROC: an open-source package for R and S+ to analyze and compare ROC curves. BMC Bioinf. 2011;12(1):77. doi:10.1186/1471-2105-12-77
42. Harrell FE
Jr. rms: regression modeling strategies. R package version 6.8-0. 2024. https://CRAN.R-project.org/package=rms.
43. Hu J, He Y, Liao K, et al. Identification of inflammatory factor-related genes associated with the prognosis and immune cell infiltration in colorectal cancer patients. Genes Dis. 2023;10(5):2109–2124. doi:10.1016/j.gendis.2022.07.015
44. Blanche P, Dartigues JF, Jacqmin-Gadda H. Estimating and comparing time-dependent areas under receiver operating characteristic curves for censored event times with competing risks. Stat Med. 2013;32(30):5381–5397. doi:10.1002/sim.5958
45. Morgan M, Falcon S, Gentleman R. GSEABase: gene set enrichment data structures and methods. R package version 1.60.0. 2022.
46. Warde-Farley D, Donaldson SL, Comes O, et al. The GeneMANIA prediction server: biological network integration for gene prioritization and predicting gene function. Nucleic Acids Res. 2010;38(Web Server issue):W214–220. doi:10.1093/nar/gkq537
47. Zhou Y, Zhou B, Pache L, et al. Metascape provides a biologist-oriented resource for the analysis of systems-level datasets. Nat Commun. 2019;10(1):1523. doi:10.1038/s41467-019-09234-6
48. Szklarczyk D, Kirsch R, Koutrouli M, et al. The STRING database in 2023: protein-protein association networks and functional enrichment analyses for any sequenced genome of interest. Nucleic Acids Res. 2023;51(D1):D638–d646. doi:10.1093/nar/gkac1000
49. Li JH, Liu S, Zhou H, Qu LH, Yang JH. starBase v2.0: decoding miRNA-ceRNA, miRNA-ncRNA and protein-RNA interaction networks from large-scale CLIP-Seq data. Nucleic Acids Res. 2014;42(Database issue):D92–97. doi:10.1093/nar/gkt1248
50. Chang L, Zhou G, Soufan O, Xia J. miRNet 2.0: network-based visual analytics for miRNA functional analysis and systems biology. Nucleic Acids Res. 2020;48(W1):W244–w251. doi:10.1093/nar/gkaa467
51. Li T, Fu J, Zeng Z, et al. TIMER2.0 for analysis of tumor-infiltrating immune cells. Nucleic Acids Res. 2020;48(W1):W509–w514. doi:10.1093/nar/gkaa407
52. Thorsson V, Gibbs DL, Brown SD, et al. The immune landscape of cancer. Immunity. 2018;48(4):812–830.e814. doi:10.1016/j.immuni.2018.03.023
53. Ru B, Wong CN, Tong Y, et al. TISIDB: an integrated repository portal for tumor-immune system interactions. Bioinformatics. 2019;35(20):4200–4202. doi:10.1093/bioinformatics/btz210
54. Zhou H, Yao J, Zhong Z, et al. Lactate-induced CCL8 in tumor-associated macrophages accelerates the progression of colorectal cancer through the CCL8/CCR5/mTORC1 axis. Cancers. 2023;15(24):5795. doi:10.3390/cancers15245795
55. Liu Y, Jiang C, Xu C, Gu L. Systematic analysis of integrated bioinformatics to identify upregulated THBS2 expression in colorectal cancer cells inhibiting tumour immunity through the HIF1A/lactic acid/GPR132 pathway. Can Cell Inter. 2023;23(1):253. doi:10.1186/s12935-023-03103-5
56. Qian J, Gong ZC, Zhang YN, et al. Lactic acid promotes metastatic niche formation in bone metastasis of colorectal cancer. Cell Comm Sign CCS. 2021;19(1):9. doi:10.1186/s12964-020-00667-x
57. Chen S, Nishi M, Morine Y, et al. Epigallocatechin‑3‑gallate hinders metabolic coupling to suppress colorectal cancer malignancy through targeting aerobic glycolysis in cancer‑associated fibroblasts. Int J Oncol. 2022;60(2). doi:10.3892/ijo.2022.5309
58. Babaei-Jadidi R, Kashfi H, Alelwani W, et al. Anti-miR-135/SPOCK1 axis antagonizes the influence of metabolism on drug response in intestinal/colon tumour organoids. Oncogenesis. 2022;11(1):4. doi:10.1038/s41389-021-00376-1
59. Yang W, Wang Y, Tao C, Li Y, Cao S, Yang X. CRNDE silencing promotes apoptosis and enhances cisplatin sensitivity of colorectal carcinoma cells by inhibiting the Akt/mTORC1-mediated Warburg effect. Oncol Lett. 2022;23(2):70. doi:10.3892/ol.2022.13190
60. Ni M, Black LF, Pan C, et al. Metabolic impact of pathogenic variants in the mitochondrial glutamyl-tRNA synthetase EARS2. J Inherit Metabol Disease. 2021;44(4):949–960. doi:10.1002/jimd.12387
61. Danhauser K, Haack TB, Alhaddad B, et al. EARS2 mutations cause fatal neonatal lactic acidosis, recurrent hypoglycemia and agenesis of corpus callosum. Metab Brain Dis. 2016;31(3):717–721. doi:10.1007/s11011-016-9793-2
62. Steenweg ME, Ghezzi D, Haack T, et al. Leukoencephalopathy with thalamus and brainstem involvement and high lactate ‘LTBL’ caused by EARS2 mutations. Brain J Neuro. 2012;135(Pt 5):1387–1394. doi:10.1093/brain/aws070
63. Masci D, Puxeddu M, Silvestri R, La Regina G. Metabolic rewiring in cancer: small molecule inhibitors in colorectal cancer therapy. Molecules. 2024;29(9):2110. doi:10.3390/molecules29092110
64. Patel SK, Rabb H. Targeting immune cell glutamyl-prolyl-transfer RNA synthetase 1 (EPRS1) to prevent fibrosis after tubulointerstitial nephritis. Kidney Int. 2024;105(5):924–926. doi:10.1016/j.kint.2024.02.007
65. Liang W, Yang X, Li X, et al. Investigating gene signatures associated with immunity in colon adenocarcinoma to predict the immunotherapy effectiveness using NFM and WGCNA algorithms. Aging. 2024;16(9):7596–7621. doi:10.18632/aging.205763
66. RezaSoltani M, Forouzesh F, Salehi Z, Zabihi MR, Rejali L, Nazemalhosseini-Mojarad E. Identification of LncPVT1 and CircPVT1 as prognostic biomarkers in human colorectal polyps. Sci Rep. 2023;13(1):13113. doi:10.1038/s41598-023-40288-1
67. Nemati Bajestan M, Piroozkhah M, Chaleshi V, et al. Expression analysis of long noncoding RNA-MALAT1 and interleukin-6 in inflammatory bowel disease patients. Iran J Allergy Asthma Immunol. 2023;22(5):482–494. doi:10.18502/ijaai.v22i5.13997
68. Žlajpah M, Boštjančič E, Zidar N. (Epi)genetic regulation of osteopontin in colorectal cancerogenesis. Epigenomics. 2020;12(16):1389–1403. doi:10.2217/epi-2020-0032
69. Gharib E, Rejali L, Piroozkhah M, et al. IL-2RG as a possible immunotherapeutic target in CRC predicting poor prognosis and regulated by miR-7-5p and miR-26b-5p. J Transl Med. 2024;22(1):439. doi:10.1186/s12967-024-05251-2
70. Feng Z, Zhang S, Han Q, et al. Liensinine sensitizes colorectal cancer cells to oxaliplatin by targeting HIF-1α to inhibit autophagy. Phytomed Internat J phytothera phytopharma. 2024;129:155647. doi:10.1016/j.phymed.2024.155647
71. Huang CI, Huang YK, Lee HM, Chen JH, Su YC, Lin PM. Synergistic and antagonistic antiproliferative effects of ribociclib (Lee011) and irinotecan (SN38) on colorectal cancer cells. Anticancer Res. 2023;43(5):1933–1941. doi:10.21873/anticanres.16353
72. Lin PM, Lee HM, Huang CI, et al. Synergistic antiproliferative effect of ribociclib (LEE011) and 5-fluorouracil on human colorectal cancer. Anticancer Res. 2020;40(11):6265–6271. doi:10.21873/anticanres.14647
73. Ferris J, Espona-Fiedler M, Hamilton C, et al. Pevonedistat (MLN4924): mechanism of cell death induction and therapeutic potential in colorectal cancer. Cell Death Discovery. 2020;6(1):61. doi:10.1038/s41420-020-00296-w
 © 2025 The Author(s). This work is published and licensed by Dove Medical Press Limited. The
full terms of this license are available at https://www.dovepress.com/terms
and incorporate the Creative Commons Attribution
- Non Commercial (unported, 3.0) License.
By accessing the work you hereby accept the Terms. Non-commercial uses of the work are permitted
without any further permission from Dove Medical Press Limited, provided the work is properly
attributed. For permission for commercial use of this work, please see paragraphs 4.2 and 5 of our Terms.
© 2025 The Author(s). This work is published and licensed by Dove Medical Press Limited. The
full terms of this license are available at https://www.dovepress.com/terms
and incorporate the Creative Commons Attribution
- Non Commercial (unported, 3.0) License.
By accessing the work you hereby accept the Terms. Non-commercial uses of the work are permitted
without any further permission from Dove Medical Press Limited, provided the work is properly
attributed. For permission for commercial use of this work, please see paragraphs 4.2 and 5 of our Terms.