Back to Journals » Diabetes, Metabolic Syndrome and Obesity » Volume 12
Identification of dynamic molecular networks in peripheral blood mononuclear cells in type 1 diabetes mellitus
Received 27 February 2019
Accepted for publication 8 May 2019
Published 25 June 2019 Volume 2019:12 Pages 969—982
DOI https://doi.org/10.2147/DMSO.S207021
Checked for plagiarism Yes
Review by Single anonymous peer review
Peer reviewer comments 2
Editor who approved publication: Professor Ming-Hui Zou
Lu Li,1,* Zongfu Pan,2,* Xi Yang1
1Department of Pharmacy, The First Affiliated Hospital, College of Medicine, Zhejiang University, Hangzhou, Zhejiang, People’s Republic of China; 2Department of Pharmacy, Zhejiang Cancer Hospital, Hangzhou, Zhejiang, People’s Republic of China
*These authors contributed equally to this work
Background: Type 1 diabetes mellitus (T1DM) is an autoimmune disease caused by the immune destruction of islet β cells. Gene expression in peripheral blood mononuclear cells (PBMCs) could offer new disease and treatment markers in T1DM. The objective of this study was to explore the coexpression and dynamic molecular networks in PBMCs of T1DM patients.
Methods: Dataset GSE9006 contains PBMC samples of healthy volunteers, newly diagnosed T1DM patients, T1DM patients after insulin treatment, and newly diagnosed type 2 diabetes mellitus (T2DM) patients. Weighted correlation network analysis (WGCNA) was used to generate coexpression networks in T1DM and T2DM. Functional pathways in highly correlated modules of T1DM were enriched by gene set enrichment analysis (GSEA). We next filtered the differentially expressed genes (DEGs) and revealed their dynamic expression profiles in T1DM with or without insulin treatment. Furthermore, dynamic clusters and dynamic protein–protein interaction networks were identified. Kyoto Encyclopedia of Genes and Genomes pathway enrichment analysis was developed in dynamic clusters.
Results: WGCNA disclosed 12 distinct gene modules, and distinguished between correlated networks in T1DM and T2DM. Two modules were closely associated with T1DM. GSEA showed that the immune response and response to cytokines were enriched in the T1DM highly correlated module. Next, we screened 44 DEGs in newly diagnosed T1DM compared with healthy donors, and 71 DEGs in 1-month and 97 DEGs in 4-month insulin treatment groups compared with newly diagnosed T1DM. Dynamic expression profiles of DEGs indicated the potential targets for T1DM treatment. Moreover, four molecular dynamic clusters were analyzed in newly diagnosed and insulin-treated T1DM. Functional annotation showed that these clusters were mainly enriched in the IL-17 signaling pathway, nuclear factor-ϰB signaling pathway, and tumor necrosis factor signaling pathway.
Conclusion: The results indicate potential drug targets or clinical efficacy markers, as well as demonstrating the underlying molecular mechanisms of T1DM treatment.
Keywords: type 1 diabetes mellitus, dynamic molecular networks, coexpression networks, peripheral blood mononuclear cells
Introduction
Type 1 diabetes mellitus (T1DM) is a major form of diabetes affecting public health around the world. The incidence of T1DM is increasing worldwide, and T1DM can affect people at any age, but mostly occurs at a young age.1 T1DM is an autoimmune disease caused by the immune destruction of islet β cells. The body’s immune system attacks β cells, which leads to a deficiency of insulin secretion. The causes have still not been fully elucidated. Insulin injection is the most common and effective solution to maintain the blood glucose level for patients with T1DM. Islet transplantation has been proven to restore long-term endogenous insulin production in T1DM patients,2 but the lack of human islets limits this treatment method.
Immunotherapy is expected to attenuate immune responses against β cells.3 However, so far, there are no effective clinical immune-based therapies to prevent and reverse T1DM.4 Several studies have used gene expression profile analysis to explore the pathological mechanisms and potential treatment of diabetes.5–7 Islet-infiltrating immune effectors and metabolic derangements in T1DM could be sampled in peripheral blood mononuclear cells (PBMCs).8 It has been reported that PBMCs are suitable for the assessment of immunological markers in T1DM.9 Dynamic alterations in key genes in PBMCs after insulin therapy may offer new insights into T1DM treatment, among other things. Several studies have focused on the roles of PBMCs in T1DM, using bioinformatic analysis.8,10–12 However, the differences in coexpression networks in PBMCs of T1DM and type 2 diabetes mellitus (T2DM), as well as the dynamic molecular networks during insulin treatment of T1DM, have not been fully elucidated.
In the present work, coexpression networks of dataset GSE9006 were analyzed to reveal differences between T1DM and T2DM. Functional pathway enrichment of highly correlated modules in T1DM was then analyzed by gene set enrichment analysis (GSEA). Differentially expressed genes (DEGs) in newly diagnosed and insulin-treated T1DM patients were filtered to elucidate the potential key genes in T1DM treatment. Furthermore, we explored the dynamic networks of altered DEGs after insulin treatment. The results provide potential drug targets and clinical efficacy markers for T1DM treatment.
Materials and methods
Microarray and data processing
Microarray dataset GSE9006,8 containing 117 PBMC samples from 2–18-year-old children, was obtained from the Gene Expression Omnibus (GEO,
Construction of coexpression networks by weighted gene correlation network analysis (WGCNA)
WGCNA was applied to reveal the weighted correlations between genes and clinical features, as previously described.5,13 We used the WGCNA package in R to perform weighted correlation network analysis of all genes of healthy samples, and newly diagnosed T1DM and T2DM patients in GSE9006. The appropriate soft threshold power was automatically calculated. Here, the power of β=6 was selected to ensure a scale-free network. Gene modules in different colors were generated by hierarchical clustering dendrograms, and the module structure was visualized by topological overlap matrix plots. The correlation coefficients between each module and clinical trait were analyzed, and were referred to as module eigengene significances. The module eigengene is defined as the first principal component of a given module. It can be considered as being representative of the gene expression profiles in a module.
Gene set enrichment analysis (GSEA)
GSEA was applied on the highly correlated modules identified by WGCNA to explore mRNA functional pathways in T1DM samples. GSEA software (version 3.0; Broad Institute, Cambridge, MA, USA) was used. The annotated gene set c5.bp.v6.2.symbols.gmt was chosen as the reference gene set. A false discovery rate (FDR) <0.25,14 enrichment score >0.6, and gene sets ≥15 were set as the cut-off criteria.
Classification of DEGs in T1DM and insulin treatment samples
DEGs in newly diagnosed T1DM vs control, and newly diagnosed vs insulin-treated T1DM were analyzed based on the limma package in R. Statistically significant DEGs were defined with an FDR <0.05 and log2fold change >0.585 as the cut-off criteria.
Dynamic analysis of DEGs by Short Time-series Expression Miner (STEM)
STEM software (version 1.3.11; Carnegie Mellon University, Pittsburgh, PA, USA) was used for the analysis of DEGs' dynamic expression profiles.15,16 DEGs were sampled at four stages: normal, newly diagnosed T1DM, and after 1 month (1M) and 4 months (4M) of insulin treatment for T1DM. DEGs in newly diagnosed T1DM vs control, and newly diagnosed vs insulin-treated T1DM were uploaded and normalized by STEM. The STEM clustering method was chosen, the maximum number of model profiles was set to 20, and the maximum unit change in model profiles between time-points was set to 2. The significance level at which the number of genes assigned to a model profile differed from the expected number of genes assigned was set to 0.05, with Bonferroni correction. The rest of the parameters retained their default values.
Identification of dynamic clusters during insulin treatment
The Cytoscape (version 3.6.1; The Cytoscape Consortium, New York, NY, USA) plugin DyNetViewer17 was used to provide the construction, analysis, and visualization of dynamic protein–protein interaction networks. For dynamic module analysis, three groups, ie, newly diagnosed, 1M and 4M insulin-treated T1DM, were included. A time-course protein interaction networks algorithm was applied to construct networks, and the threshold was set to 7. The Molecular Complex Detection clustering algorithm was used to analyze clusters of dynamic networks. The degree cut-off was set to 5, maximum depth to 100, and K-core to 2.
Functional pathway annotation
The gene functional annotation of Kyoto Encyclopedia of Genes and Genomes (KEGG) enrichment was analyzed by the Cytoscape ClueGO plugin18 for highly correlated modules and dynamic modules. Pathway-like visualization was created by the CluePedia plugin.19 The ClueGO plugin was set as follows: the kappa-score threshold was set to 0.4 and the P-value to 0.05, with the two-sided hypergeometric test and Bonferroni stepdown.
Results
Coexpression gene networks in newly diagnosed T1DM and T2DM patients
To screen significantly enriched coexpression networks of T1DM patients and distinguish between correlated networks in T1DM and T2DM, WGCNA was carried out to disclose highly correlated gene modules. In total, 24 healthy samples, 43 newly diagnosed T1DM, and 12 newly diagnosed T2DM patients in the microarray dataset GSE9006 were included in this analysis. After data processing, a total of 13,434 probes was obtained. The sample dendrogram and clinical trait heatmap of GSE9006 are shown in Figure 1A. Five clinical features, namely T1DM, T2DM, age, sex, and initial pH, are shown for 79 samples from GSE9006 (Figure 1A). Thus, 12 distinct gene modules were identified by the hierarchical clustering dendrogram according to the gene expression profiles (Figure S1A). The color row shows the module assignment determined by the dynamic tree cut in R. A topological overlap matrix plot was generated by calculating the correlation matrix of gene expression (Figure S1B). Branches in the hierarchical clustering dendrograms correspond to modules. Modules are displayed in the color bars below and to the right of the dendrograms. Light colors indicate low topological overlap, and high coexpression interconnectedness is indicated by progressively darker red. Eigengene adjacency heatmaps were applied to identify and display the module correlations (Figure 1B). To elucidate significant associations between modules and clinical traits, module–trait relationships were analyzed. The results showed that T1DM was positively correlated with the purple module and negatively correlated with the magenta module (Figure 1C). T2DM was negatively correlated with the purple module and positively correlated with the magenta module.
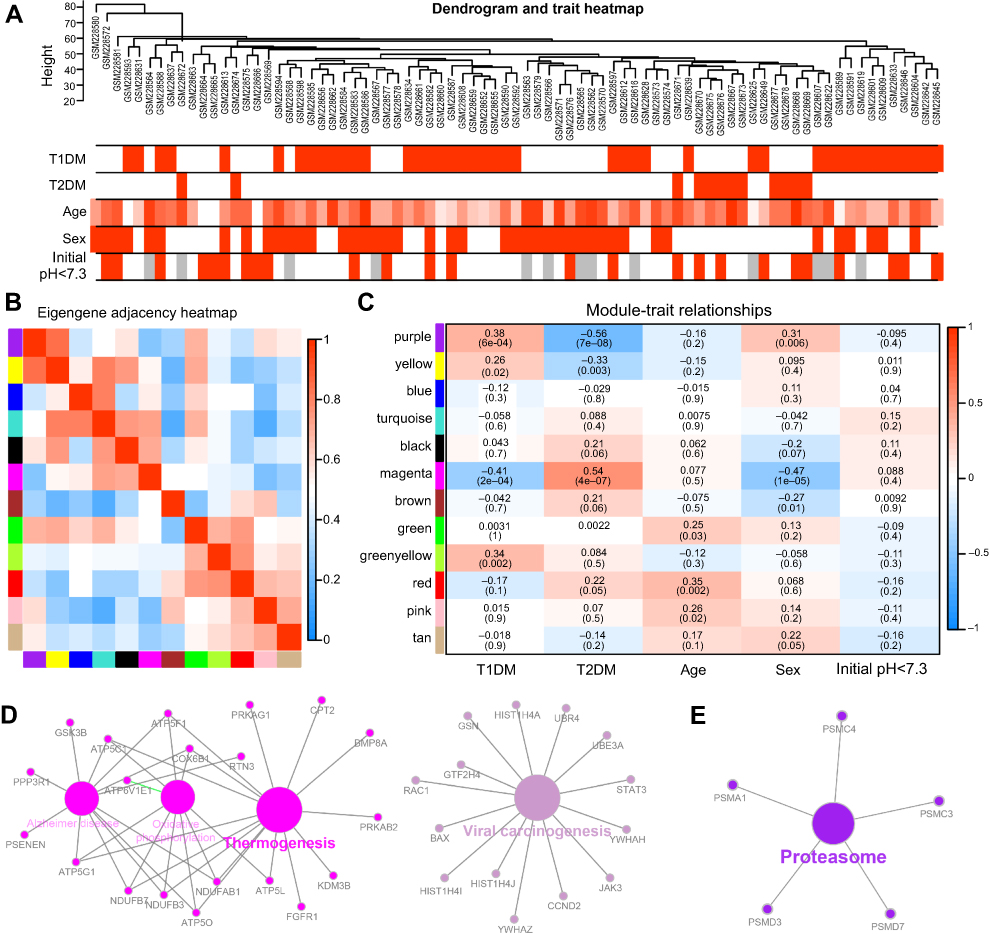 | Figure 1 Correlation of modules and clinical traits. (A) Cluster analysis of samples and clinical features. In the T1DM, T2DM, sex, and initial pH rows, the red color represents T1DM, T2DM, male, and initial pH <7.3 samples, respectively. In the age row, the red color intensity is proportional to higher age. The gray color represents no data for initial pH. (B) Interactions among different gene coexpression modules. Red represents a positive correlation and blue represents a negative correlation. (C) Module–trait associations. Each row corresponds to a module eigengene and each column to a clinical trait. Each cell contains the corresponding correlation in the upper line and the P-value in the lower line. Red represents a positive correlation and blue represents a negative correlation. The different shades of red and blue represent the significance of the difference. (D, E) Gene annotation enrichment analysis of KEGG pathway in magenta module (D) and purple module (E). Abbreviations: T1DM, type 1 diabetes mellitus; T2DM, type 2 diabetes mellitus; KEGG, Kyoto Encyclopedia of Genes and Genomes. |
The genes in the magenta module were mainly enriched in thermogenesis and viral carcinogenesis (Figure 1D), while the genes in the purple module were mainly enriched in proteasomes (Figure 1E). These results indicate opposite module correlations between T1DM and T2DM. We found that the black module was associated with the relaxin signaling pathway, insulin secretion, and pancreatic secretion (Figure S2A); the blue module was associated with complement and coagulation cascades, phototransduction, pathways in cancer, olfactory transduction, the PI3K–Akt signaling pathway, microRNAs in cancer, and neuroactive ligand–receptor interaction (Figure S2B); the pink module was associated with hepatitis B, toxoplasmosis, and leishmaniasis (Figure S2C); the green module was associated with lysosomes, ribosomes, and glycolysis/gluconeogenesis (Figure S2D); the tan module was associated with apoptosis, mRNA surveillance pathway, fluid shear stress, and atherosclerosis (Figure S2E); the brown module was associated with autophagy, RNA transport, apoptosis, ribosome biogenesis in eukaryotes, and mismatch repair (Figure S2F); the green–yellow module was associated with Staphylococcus aureus infection, natural killer cell-mediated cytotoxicity, osteoclast differentiation, the tumor necrosis factor (TNF) signaling pathway, apoptosis, transcriptional misregulation in cancer, cytokine–cytokine receptor interaction, and necroptosis (Figure S2G); the turquoise module was associated with aldosterone synthesis and secretion, the cyclic adenosine monophosphate (cAMP) signaling pathway, the calcium signaling pathway, and olfactory transduction (Figure S2H); the yellow module was associated with herpes simplex virus-1 infection, spliceosomes, endocytosis, and protein processing in the endoplasmic reticulum (Figure S2I); and the red module was associated with Fc-gamma-R-mediated phagocytosis, lysosomes, primary immunodeficiency, ribosomes, hematopoietic cell lineage, and the T-cell receptor signaling pathway (Figure S2J).
GSEA of highly correlated modules in T1DM patients
To explore the functional pathway enriched in T1DM highly correlated modules, GSEA was conducted to search the Gene Ontology (GO) biological process in the magenta and purple modules. As a result, nine functional gene sets were enriched in the magenta module, while no gene sets met the cut-off criteria in the purple module (Figure 2). The nine functional gene sets were upregulated in T1DM PBMCs, and mainly focused on immune response, locomotion, cell motility, regulation of cellular component movement, cellular component morphogenesis, movement of cell or subcellular components, regulation of protein complex assembly, response to cytokines, and ion transmembrane transport. The genes included in these gene sets are listed in Table 1.
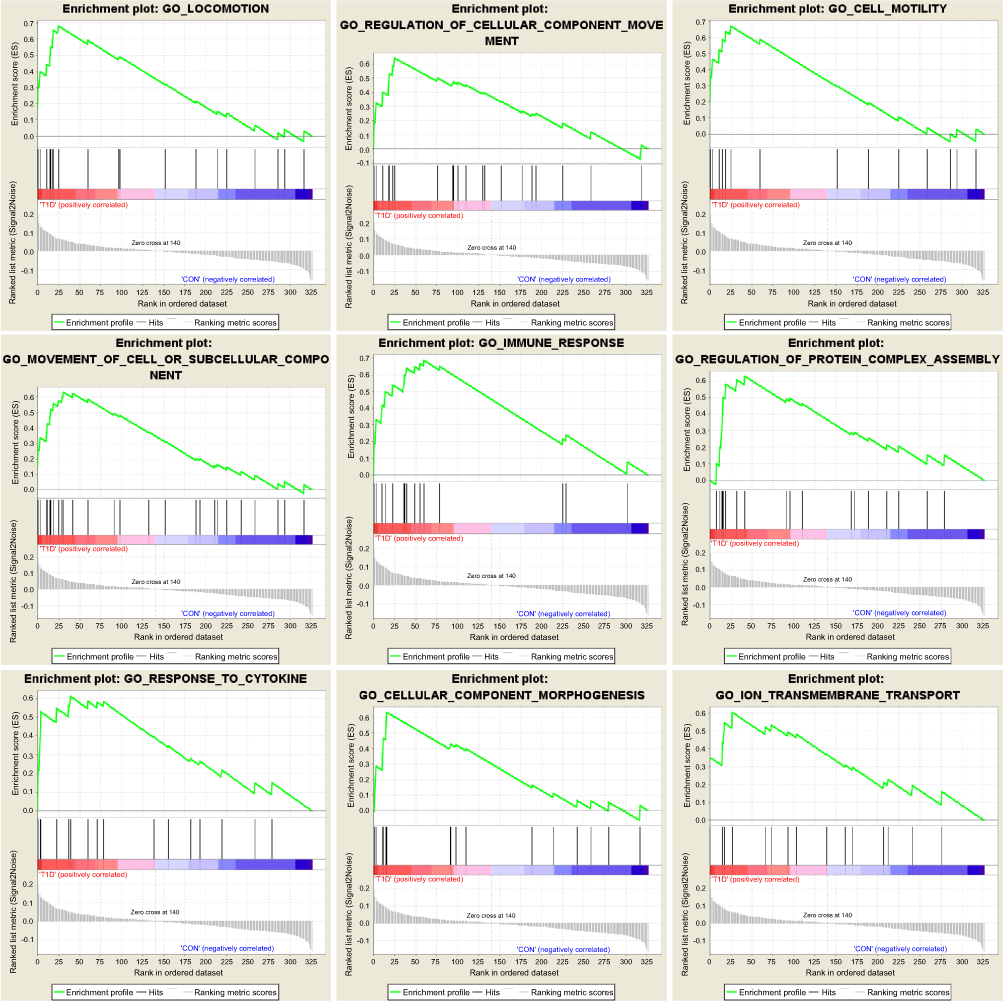 | Figure 2 Enrichment plots of Gene Ontology biological process pathways in magenta module. |
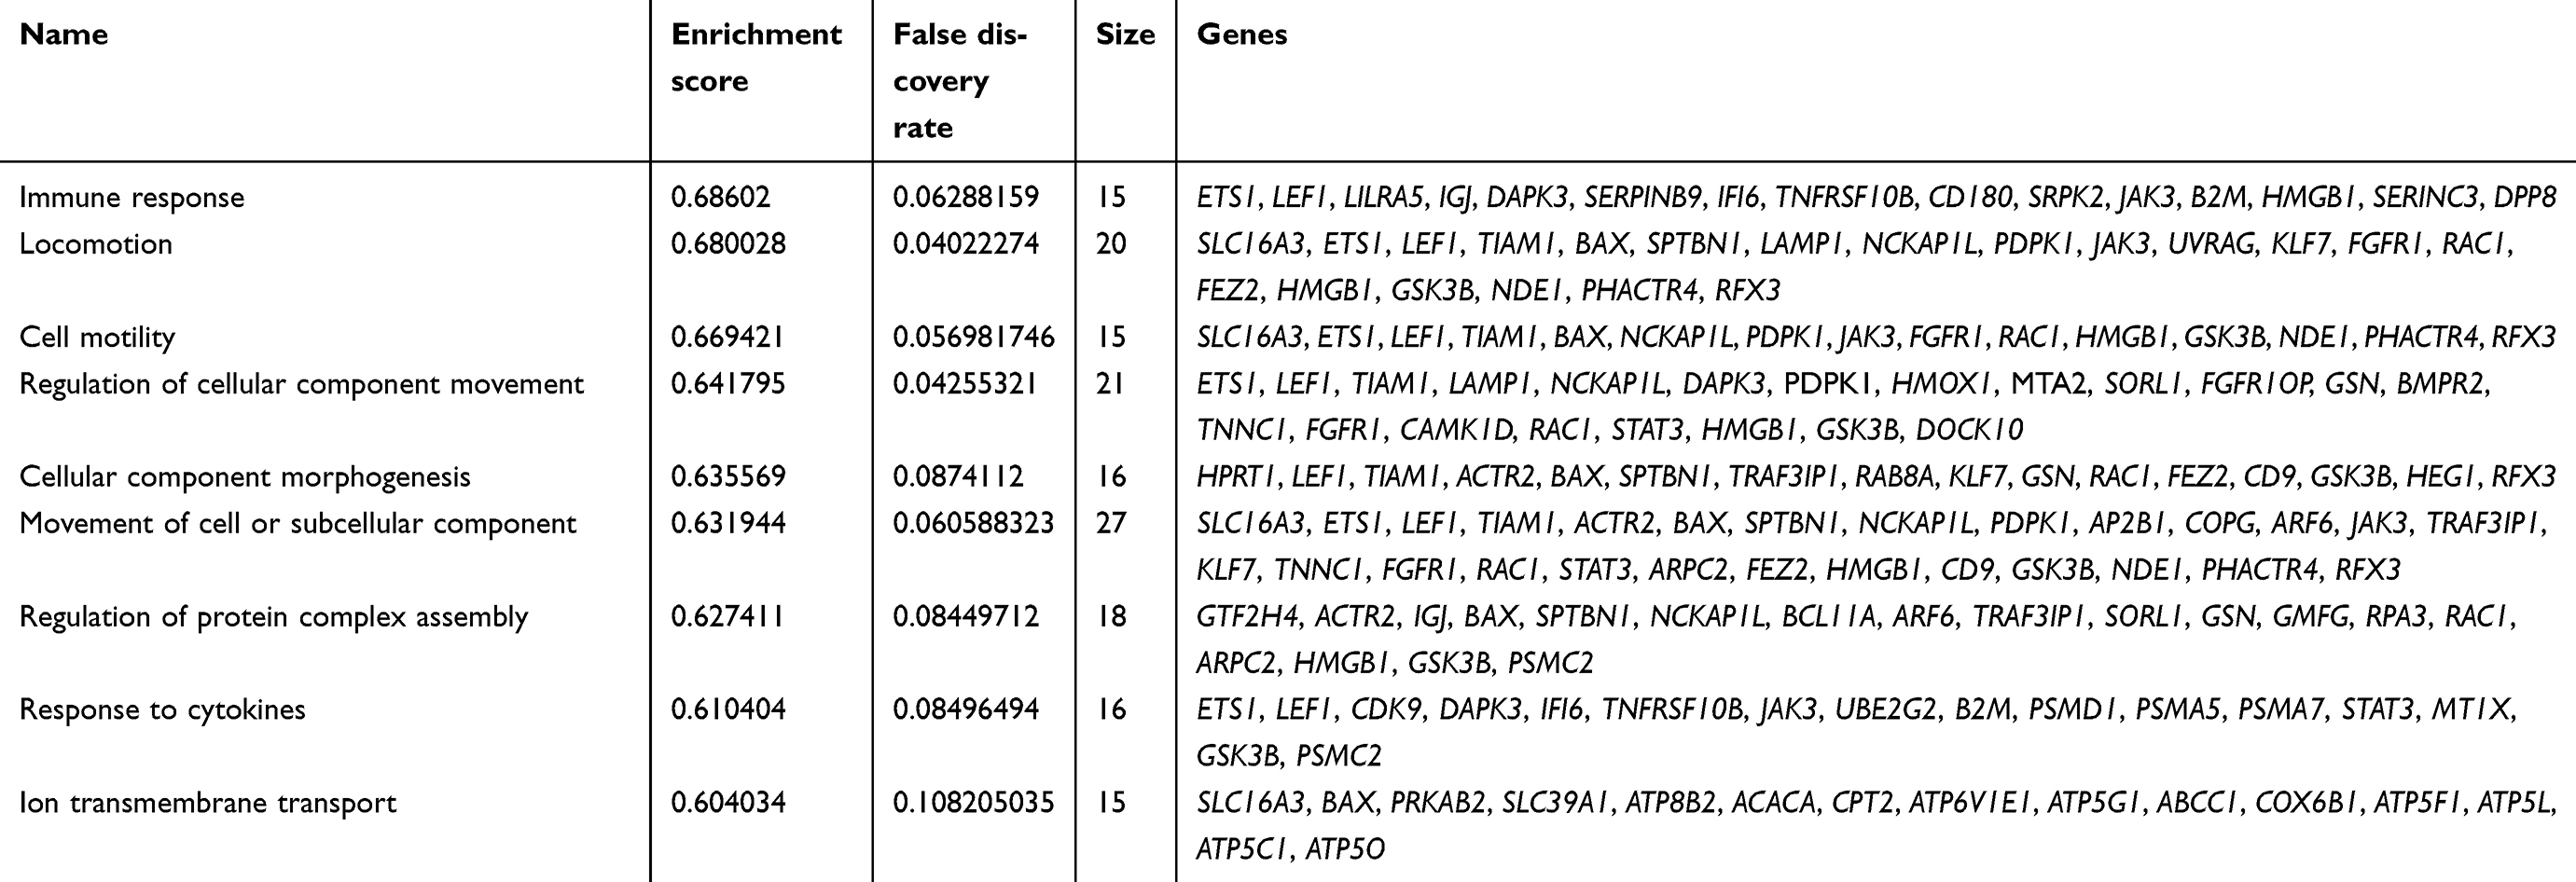 | Table 1 Genes in enriched pathways of gene set enrichment analysis |
Identification of DEGs in newly diagnosed and insulin-treated T1DM patients
T1DM patients were divided into three groups: newly diagnosed T1DM patients, and 1M and 4M insulin-treated patients. To elucidate the altered genes after insulin treatment, we filtered the 44 DEGs in newly diagnosed T1DM patients compared with healthy donors, and 71 DEGs in the 1M and 97 DEGs in the 4M insulin-treated groups compared with the newly diagnosed group without insulin treatment, respectively (Figure 3A). DEGs in module 1 were changed in newly diagnosed T1DM vs the control group, 1M insulin-treated and 4M vs newly diagnosed T1DM group. DEGs in module 2 were changed in newly diagnosed T1DM vs the control group, and 1M insulin-treated vs the newly diagnosed T1DM group. DEGs in module 3 were changed in newly diagnosed T1DM vs the control group, and 4M insulin-treated vs the newly diagnosed T1DM group. We found that eight DEGs in module 1 were included in three groups, while two DEGs in module 2 and 11 DEGs in module 3 were included in only two groups (Figure 3A). IFI44L in module 2 and TUBB1 in module 3 were downregulated in T1DM, and upregulated by 1M or 4M insulin treatment, respectively. The remaining DEGs in modules 1–3 were all upregulated in T1DM, and downregulated after 1M and/or 4M insulin treatment (Figure 3B). The expression of DEGs in modules 1–3 is displayed in a heatmap (Figure 3C). Our results imply that these DEGs may be appropriate drug targets and clinical therapeutic markers for T1DM.
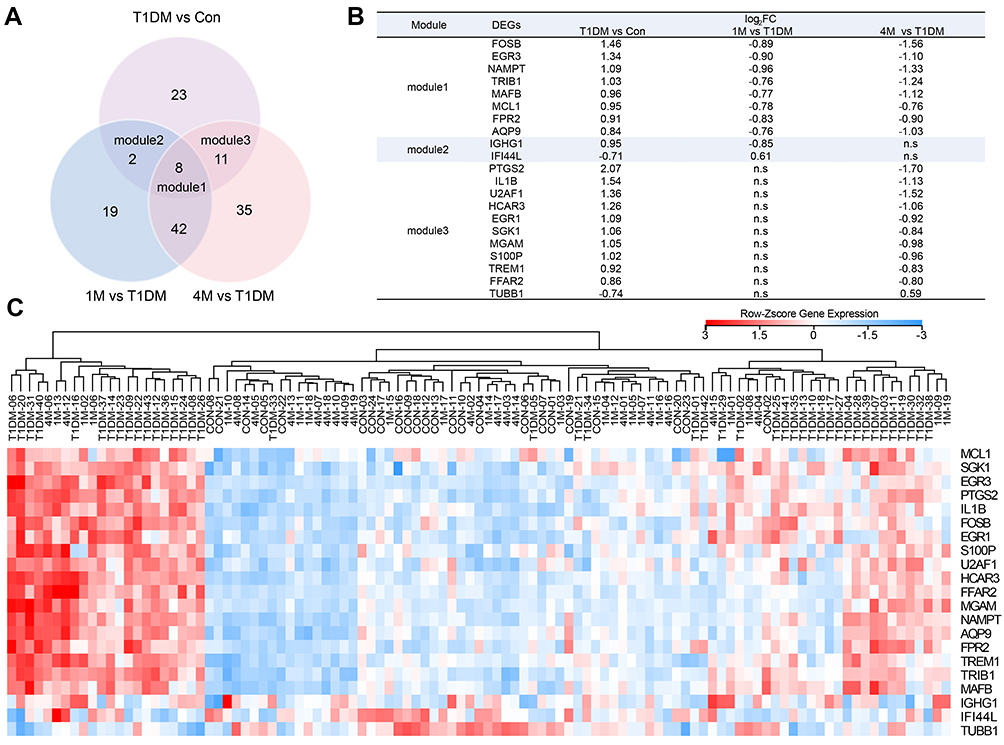 | Figure 3 Classification of DEGs in T1DM and insulin-treated patients. (A) Venn diagram showing the DEGs in different groups. (B) DEGs in modules 1–3. (C) Heatmap of DEGs in modules 1–3. Red indicates upregulation and blue indicates downregulation. Abbreviations: T1DM, type 1 diabetes mellitus; Con, control; DEG, differentially expressed gene; 1M, 1 month; 4M, 4 months; ns, not significant. |
Dynamic expression analysis of DEGs in newly diagnosed and insulin-treated T1DM patients
For further investigation of potential drug targets or treatment markers in T1DM, we next analyzed the dynamic expression profiles of DEGs in Figure 3A. STEM software can easily determine and visualize the behavior and trends in gene expression in different periods.15 In total, 20 expression behaviors were enriched, and each box corresponds to a different temporal expression model profile (Figure 4A). These 20 profiles were generated independently of our data by STEM. Then, each DEG in our study was assigned to the model profile to which its time series matched most closely, based on the correlation coefficient. We considered that profiles with two expression behaviors were meaningful in T1DM treatment. The first trend was that genes increased in the newly diagnosed T1DM period compared with control, and then decreased at 1M or 4M treatment, as in profiles 13 (Figure 4B), 14 (Figure 4C), and 16 (Figure 4D). The second trend was that genes decreased in the newly diagnosed T1DM period compared with control, and then increased at 1M or 4M treatment, as in profile 12 (Figure 4E). The results indicate that genes in these profiles could be potential targets for T1DM treatment and as clinical markers.
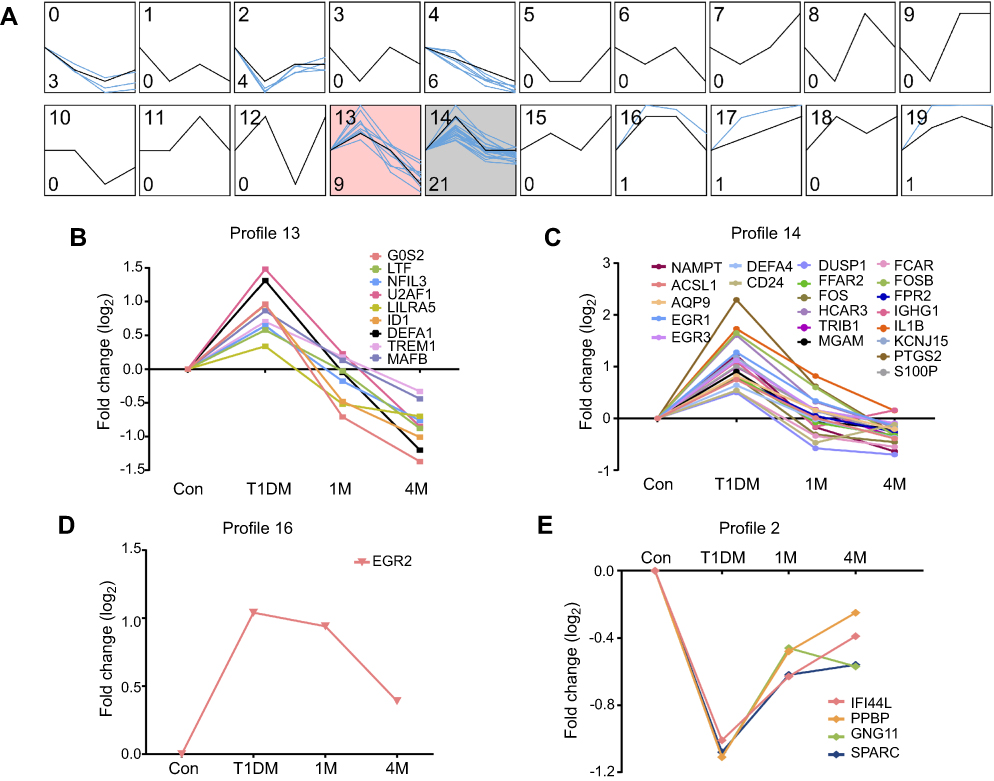 | Figure 4 Dynamic expression patterns of DEGs in different periods of T1DM treatment. (A) Dynamic expression profiles of DEGs determined by STEM. The black lines in the boxes represent model expression profiles. The blue lines indicate the individual gene expression change ratios over different periods. The number in the top left corner is the profile ID, and the number in the bottom left corner is the gene number of this profile. The colored profiles (13 and 14) indicate that a statistically significant number of genes was assigned to the model expression profile. (B–E) Classified gene expression trends in meaningful profiles were present in different periods. Abbreviations: DEG, differentially expressed gene; STEM, Short Time-series Expression Miner; Con, control; T1DM, type 1 diabetes mellitus; 1M, 1 month; 4M, 4 months. |
Dynamic cluster analysis during insulin treatment in T1DM
To elucidate the functional pathway involved in insulin treatment of T1DM, dynamic cluster attributions from newly diagnosed, 1M and 4M T1DM PBMCs were analyzed. The clusters that represented highly interconnected regions at different stages were defined as important modulators in the corresponding period. Altogether, four molecular cluster were identified for insulin treatment in T1DM (Figure 5A–D). According to the dynamic cluster attribute of modularity, clusters 1 and 2 contributed to newly diagnosed T1DM, cluster 3 contributed to the 1M insulin treatment period, and cluster 4 contributed to the 4M insulin treatment period (Figure 5E). For functional pathway enrichment of the dynamic clusters in each period, KEGG pathway enrichment was applied by ClueGO. Clusters 1 and 2 of the newly diagnosed T1DM period were mainly enriched in the IL-17 signaling pathway (Figure 5F). Cluster 3 of the 1M treatment period was mainly enriched in the IL-17 signaling pathway, amphetamine addiction, nuclear factor-ϰB (NF-ϰB) signaling pathway and leishmaniasis, and FOSB, CASP8, TNFAIP3, FOS, NFKBIA, and IL1B were shared by two or more pathways (Figure 5G). Cluster 4 of the 4M treatment period was mainly enriched in the NF-ϰB signaling pathway and TNF signaling pathway, and IL1B, NFKBIA, and TNFAIP3 participated in as many as two pathways (Figure 5H).
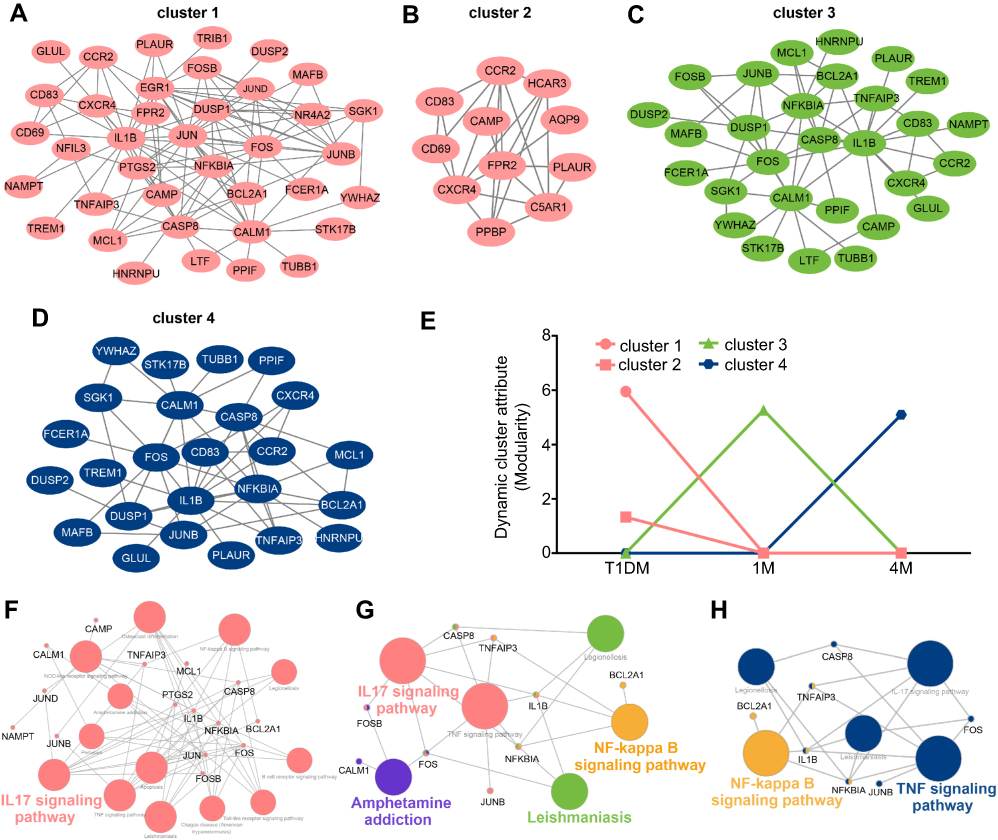 | Figure 5 Cluster analysis of dynamic network during insulin treatment in T1DM. (A–D) Four dynamic clusters were identified by the DyNetViewer MCODE algorithm in newly diagnosed and insulin-treated T1DM. (E) Dynamic cluster attributes of modularity were calculated in three periods. (F–H) KEGG pathway enrichment of dynamic clusters in each period (F, newly diagnosed T1DM; G, 1-month insulin-treated T1DM; H, 4-month insulin-treated T1DM) were analyzed by ClueGO. Abbreviations: T1DM, type 1 diabetes mellitus; 1M, 1 month; 4M, 4 months; KEGG, Kyoto Encyclopedia of Genes and Genomes. |
Discussion
The use of bioinformatics analysis offers new insights into T1DM diagnosis and treatment. Several researchers have previously analyzed the GSE9006 dataset. Kaizer et al, who provided the original data for GSE9006, demonstrated that T1DM and T2DM share a final common pathway, including IL-1β and prostaglandin secretion by immune effector cells.8 Riquelme et al analyzed the coexpression network of all T1DM subjects, including newly diagnosed, 1M and 4M insulin-treated samples.10 We also analyzed the coexpression networks by WGCNA in the present study. Unlike the previous studies mentioned here, we included a control group, newly diagnosed T1DM and T2DM, and thus we could exclude the influence of insulin treatment in T1DM genes, and demonstrate differences between the two types of diabetes. Although both T1DM and T2DM are characterized by hyperglycemia, our results revealed opposite coexpression networks in PBMCs in these two types of diabetes. Coexpression network analysis identified altogether 12 distinct gene modules in newly diagnosed T1DM and T2DM PBMCs. We found that the purple module was positively correlated with T1DM but negatively correlated with T2DM. In contrast, the magenta module was negatively associated with T1DM but positively associated with T2DM (Figure 1). KEGG pathway enrichment indicated that the magenta module was mainly involved in thermogenesis and viral carcinogenesis (Figure 1D), while the purple module was involved with proteasomes (Figure 1E). For further investigation, GSEA combined the gene expression profiles of newly diagnosed T1DM with the gene set database to explore the functional pathway enrichment in T1DM highly correlated modules. As a result, the magenta module was found to be associated with the immune response and response to cytokines for the GO biological process (Figure 2). Previous studies indicated that non-shivering thermogenesis leads to the recruitment and activation of immune cells in various metabolic tissues,20 and increased thermogenesis could be found in children with T1DM.21 Exposure of cells to inflammatory cytokines induced the expression of proteasome immuno-subunits in peripheral tissues and constitutes a mechanism that prevents the development of CD8 T-cell-mediated autoimmune diseases, such as T1DM.22 The results implied the diverse effects of PBMCs in T1DM and T2DM, and revealed the related mechanisms in the development of T1DM. In addition, our results indicated that T1DM may be related to the cellular movement of PBMCs. Nine genes (GSK3B, PDPK1, LEF1, HMGB1, ETS1, TIAM1, NCKAP1L, RAC1, and FGFR1) in the magenta module were included in four cellular movement-related pathways, namely locomotion, cell motility, regulation of cellular component movement, and movement of cell or subcellular component (Table 1), and may play critical roles in T1DM pathogenesis. The relationships between T1DM and other enriched pathways, such as cellular component morphogenesis, regulation of protein complex assembly, and ion transmembrane transport, were not fully explored,
To investigate the changes in expression of potential key genes, Liu et al analyzed the DEGs of GSE9006 in three periods, including newly and insulin-treated T1DM, by comparison with a control group.11 In the present study, we also identified the DEGs in these periods. The difference is that we screened the DEGs by comparing insulin treatment groups with newly diagnosed T1DM and constructed dynamic clusters attributed to different treatment periods, and therefore we were able to filter out the DEGs that changed after insulin treatment in T1DM. Safari-Alighiarloo et al found several cytokines and chemokines in β cells and their receptors in PBMCs.12 In this study, we explored the dynamic networks of altered DEGs after insulin treatment, which could possibly provide potential drug targets or clinical efficacy markers for T1DM treatment.
As shown in Figure 3, we found that DEGs in module 1 were significantly changed in both short (1M) and long (4M) periods of insulin therapy. Meanwhile, DEGs in module 2 only changed significantly in 1M treatment, and DEGs in module 3 only altered remarkably in 4M treatment. Therefore, we speculate that DEGs in module 1 would be the most suitable markers for T1DM clinical features and treatment, and DEGs in module 3 would be useful markers for long-term treatment of T1DM. The dynamic expression profiles of all DEGs in newly diagnosed T1DM and insulin treatment groups were then analyzed. As a consequence, MAFB, AQP9, FPR2, NAMPT, EGR3, TRIB1, and FOSB in module 1 were included in meaningful profiles 13 and 14. These genes are more likely to be potential key genes in insulin treatment of T1DM. High expression of MAFB in human pancreatic beta-cells was reported to increase cellular vulnerability to viral infections associated with the etiology of T1DM.23 Expression of AQP9 was upregulated in the liver in T1DM.24,25 FPR2 helped to promote regeneration of the corneal epithelium in T1DM mice.26 Our data indicate that these three genes may also play roles in the PBMCs in T1DM. Nurten et al demonstrated that serum NAMPT levels in pediatric T1DM patients at onset did not differ significantly from healthy controls, but were elevated in longstanding patients.27 Our study showed the distinct result that the NAMPT level in PBMCs increased at onset, but decreased after insulin treatment. The roles of the remaining genes in T1DM, apart from those mentioned in this paragraph, are not fully understood.
In addition, dynamic cluster attributions from newly diagnosed and insulin-treated T1DM were detected for pathway functional annotation. The IL-17 signaling pathway was enriched in clusters 1 and 2 in the newly diagnosed T1DM period, and cluster 3 in the 1M insulin treatment period. This result is consistent with previous research. IL-17 secreted by Th17 cells could aggravate the progression of T1DM.28 Omega-3 polyunsaturated fatty acids ameliorated T1DM, accompanied by suppression of IL-17.29 Our results further implied that the IL-17 signaling pathway may mainly have effects in the early stage of insulin treatment, since the signaling pathway was not enriched in the 4M treatment period. The NF-ϰB signaling pathway was enriched in the 1M and 4M insulin treatment periods, while the TNF signaling pathway was enriched in the 4M treatment period. NFKBIA, IL1B, and TNFAIP3 were involved in these pathways at three different stages. Previous studies demonstrated that hyperglycemia induced NF-ϰB activation in isolated PBMCs of T1DM patients,30 and glucose control with insulin resulted in a reduction of NF-ϰB binding activity by translocating NFKBIA (also known as IϰB-α) into the cytoplasm of mononuclear cells in recently manifested T1DM patients.31 The secretion of IL-1β and TNF-α was increased in monocytes from T1DM patients.32 We indicated that the TNF signaling pathway was mainly involved in the relatively late period of insulin treatment. The effects of hyperglycemia on IL-1β expression in T1DM PBMCs and islet cells showed conflicting results.33 In agreement with other research on GSE9006,8,10 we identified that IL-1β played an important role in T1DM PBMCs. We also found that IL-1β participated in the insulin treatment course of T1DM PBMCs. However, the effect of TNFAIP3 in PBMCs in T1DM remains unknown and needs further exploration.
Conclusion
The study showed key genes that may be potential drug targets and clinical therapeutic markers for T1DM. However, further experiments are still needed to explore the function of genes and pathways in PBMCs in T1DM.
Abbreviation list
DEG, differentially expressed gene; FDR, false discovery rate; GEO, Gene Expression Omnibus; GO, Gene Ontology; GSEA, gene set enrichment analysis; KEGG, Kyoto Encyclopedia of Genes and Genomes; NF-ϰB, nuclear factor-ϰB; PBMC, peripheral blood mononuclear cell; STEM, Short Time-series Expression Miner; T1DM, type 1 diabetes mellitus; T2DM, type 2 diabetes mellitus; TNF, tumor necrosis factor; WGCNA, weighted correlation network analysis.
Acknowledgments
This work was supported by The National Natural Science Foundation of China (No 81703578 and No 81802673).
Author contributions
All authors contributed toward data analysis, drafting and critically revising the paper, gave final approval of the version to be published, and agree to be accountable for all aspects of the work.
Disclosure
The authors report no conflicts of interest in this work.
References
1.
2. Shapiro AM, Ricordi C, Hering BJ, et al. International trial of the Edmonton protocol for islet transplantation. N Engl J Med. 2006;355(13):1318–1330. doi:10.1056/NEJMoa061267
3. Ni Q, Pham NB, Meng WS, Zhu G, Chen X. Advances in immunotherapy of type I diabetes. Adv Drug Deliv Rev. 2018. doi:10.1016/j.addr.2018.12.003
4. Atkinson MA, Roep BO, Posgai A, Wheeler D, Peakman M. The challenge of modulating beta-cell autoimmunity in type 1 diabetes. Lancet Diabetes Endocrinol. 2019;7(1):52–64. doi:10.1016/S2213-8587(18)30112-8
5. Li L, Pan Z, Yang S, Shan W, Yang Y. Identification of key gene pathways and coexpression networks of islets in human type 2 diabetes. Diabetes Metab Syndr Obes. 2018;11:553–563. doi:10.2147/DMSO.S178894
6. van Oostrom O, de Kleijn DP, Fledderus JO, et al. Folic acid supplementation normalizes the endothelial progenitor cell transcriptome of patients with type 1 diabetes: a case-control pilot study. Cardiovasc Diabetol. 2009;8:47. doi:10.1186/1475-2840-8-47
7. Gaulton KJ, Ferreira T, Lee Y, et al. Genetic fine mapping and genomic annotation defines causal mechanisms at type 2 diabetes susceptibility loci. Nat Genet. 2015;47(12):1415–1425. doi:10.1038/ng.3437
8. Kaizer EC, Glaser CL, Chaussabel D, et al. Gene expression in peripheral blood mononuclear cells from children with diabetes. J Clin Endocrinol Metab. 2007;92(9):3705–3711. doi:10.1210/jc.2007-0979
9. Axelsson S, Faresjo M, Hedman M, Ludvigsson J, Casas R. Cryopreserved peripheral blood mononuclear cells are suitable for the assessment of immunological markers in type 1 diabetic children. Cryobiology. 2008;57(3):201–208. doi:10.1016/j.cryobiol.2008.08.001
10. Riquelme MI, Lubovac-Pilav Z. Gene co-expression network analysis for identifying modules and functionally enriched pathways in type 1 diabetes. PLoS One. 2016;11(6):e156006.
11. Liu H, Xu R, Liu X, Sun R, Wang Q. Bioinformatics analysis of gene expression in peripheral blood mononuclear cells from children with type 1 diabetes in 3 periods. Exp Clin Endocrinol Diabetes. 2014;122(8):477–483.
12. Safari-Alighiarloo N, Taghizadeh M, Tabatabaei SM, et al. Identification of new key genes for type 1 diabetes through construction and analysis of protein-protein interaction networks based on blood and pancreatic islet transcriptomes. J Diabetes. 2017;9(8):764–777. doi:10.1111/1753-0407.12483
13. Langfelder P, Horvath S. WGCNA: an R package for weighted correlation network analysis. BMC Bioinformatics. 2008;9:559. doi:10.1186/1471-2105-9-559
14. Subramanian A, Tamayo P, Mootha VK, et al. Gene set enrichment analysis: a knowledge-based approach for interpreting genome-wide expression profiles. Proc Natl Acad Sci U S A. 2005;102(43):15545–15550. doi:10.1073/pnas.0506580102
15. Ernst J, Bar-Joseph Z. STEM: a tool for the analysis of short time series gene expression data. BMC Bioinformatics. 2006;7:191. doi:10.1186/1471-2105-7-191
16. Pan Z, Li L, Fang Q, et al. Analysis of dynamic molecular networks for pancreatic ductal adenocarcinoma progression. Cancer Cell Int. 2018;18:214. doi:10.1186/s12935-018-0718-5
17. Li M, Yang J, Wu FX, Pan Y, Wang J. DyNetViewer: a Cytoscape app for dynamic network construction, analysis and visualization. Bioinformatics. 2018;34(9):1597–1599. doi:10.1093/bioinformatics/btx821
18. Bindea G, Mlecnik B, Hackl H, et al. ClueGO: a Cytoscape plug-in to decipher functionally grouped gene ontology and pathway annotation networks. Bioinformatics. 2009;25(8):1091–1093. doi:10.1093/bioinformatics/btp101
19. Bindea G, Galon J, Mlecnik B. CluePedia Cytoscape plugin: pathway insights using integrated experimental and in silico data. Bioinformatics. 2013;29(5):661–663. doi:10.1093/bioinformatics/btt019
20. Ferrante AJ. The immune cells in adipose tissue. Diabetes Obes Metab. 2013;15(Suppl 3):34–38. doi:10.1111/dom.12154
21. Muller MJ, von Zur MA, Lautz HU, et al. Energy expenditure in children with type I diabetes: evidence for increased thermogenesis. BMJ. 1989;299(6697):487–491. doi:10.1136/bmj.299.6697.487
22. Zaiss DM, Bekker CP, Grone A, Lie BA, Sijts AJ. Proteasome immunosubunits protect against the development of CD8 T cell-mediated autoimmune diseases. J Immunol. 2011;187(5):2302–2309. doi:10.4049/jimmunol.1101003
23. Kim H, Seed B. The transcription factor MafB antagonizes antiviral responses by blocking recruitment of coactivators to the transcription factor IRF3. Nat Immunol. 2010;11(8):743–750. doi:10.1038/ni.1897
24. Hou J, Li Y, Ren X, et al. Similar aquaporin9 and MAPK expression profiles in the liver of types 1 and 2 diabetes mellitus. Horm Metab Res. 2018;50(5):414–421. doi:10.1055/s-0043-123470
25. Wei H, Hu Q, Wu J, et al. Molecular mechanism of the increased tissue uptake of trivalent inorganic arsenic in mice with type 1 diabetes mellitus. Biochem Biophys Res Commun. 2018;504(2):393–399. doi:10.1016/j.bbrc.2018.06.029
26. Zhang Z, Hu X, Qi X, et al. Resolvin D1 promotes corneal epithelial wound healing and restoration of mechanical sensation in diabetic mice. Mol Vis. 2018;24:274–285.
27. Nurten E, Vogel M, Michael KT, et al. Omentin-1 and NAMPT serum concentrations are higher and CK-18 levels are lower in children and adolescents with type 1 diabetes when compared to healthy age, sex and BMI matched controls. J Pediatr Endocrinol Metab. 2018;31(9):959–969. doi:10.1515/jpem-2018-0353
28. Luger D, Silver PB, Tang J, et al. Either a Th17 or a Th1 effector response can drive autoimmunity: conditions of disease induction affect dominant effector category. J Exp Med. 2008;205(4):799–810. doi:10.1084/jem.20071258
29. Bi X, Li F, Liu S, et al. omega-3 polyunsaturated fatty acids ameliorate type 1 diabetes and autoimmunity. J Clin Invest. 2017;127(5):1757–1771. doi:10.1172/JCI87388
30. Hofmann MA, Schiekofer S, Kanitz M, et al. Insufficient glycemic control increases nuclear factor-kappa B binding activity in peripheral blood mononuclear cells isolated from patients with type 1 diabetes. Diabetes Care. 1998;21(8):1310–1316. doi:10.2337/diacare.21.8.1310
31. Schiekofer S, Galasso G, Andrassy M, et al. Glucose control with insulin results in reduction of NF-kappaB-binding activity in mononuclear blood cells of patients with recently manifested type 1 diabetes. Diabetes Obes Metab. 2006;8(5):473–482. doi:10.1111/j.1463-1326.2006.00524.x
32. Devaraj S, Dasu MR, Rockwood J, et al. Increased toll-like receptor (TLR) 2 and TLR4 expression in monocytes from patients with type 1 diabetes: further evidence of a proinflammatory state. J Clin Endocrinol Metab. 2008;93(2):578–583. doi:10.1210/jc.2007-2185
33. Grishman EK, White PC, Savani RC. Toll-like receptors, the NLRP3 inflammasome, and interleukin-1beta in the development and progression of type 1 diabetes. Pediatr Res. 2012;71(6):626–632. doi:10.1038/pr.2012.24
Supplementary materials
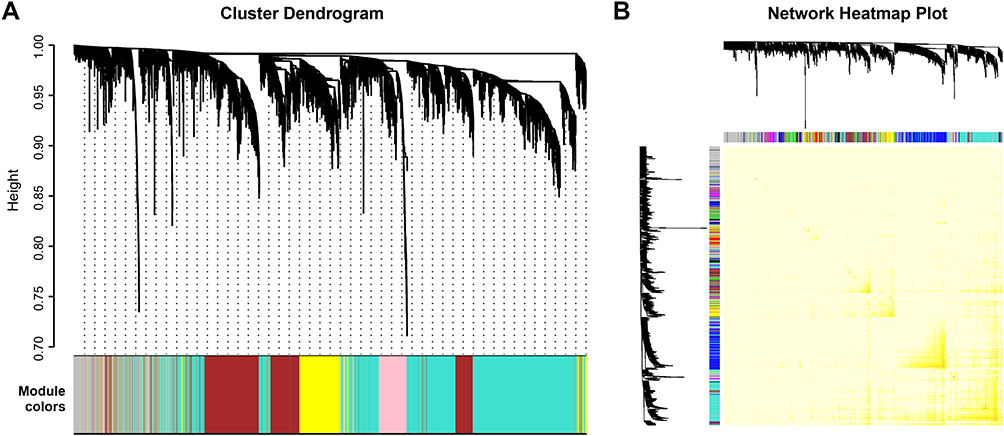 | Figure S1 Construction of coexpression gene modules by weighted correlation network analysis. (A) Construction of coexpression modules based on a dynamic branch-cutting method. The merge cut height is 0.25. The gray module contains the unassigned genes. (B) Heatmap plot of topological overlap in the gene network. Colors in the matrix represent the degree of topological overlap. The gene dendrogram and module assignment are shown along the left and top. |
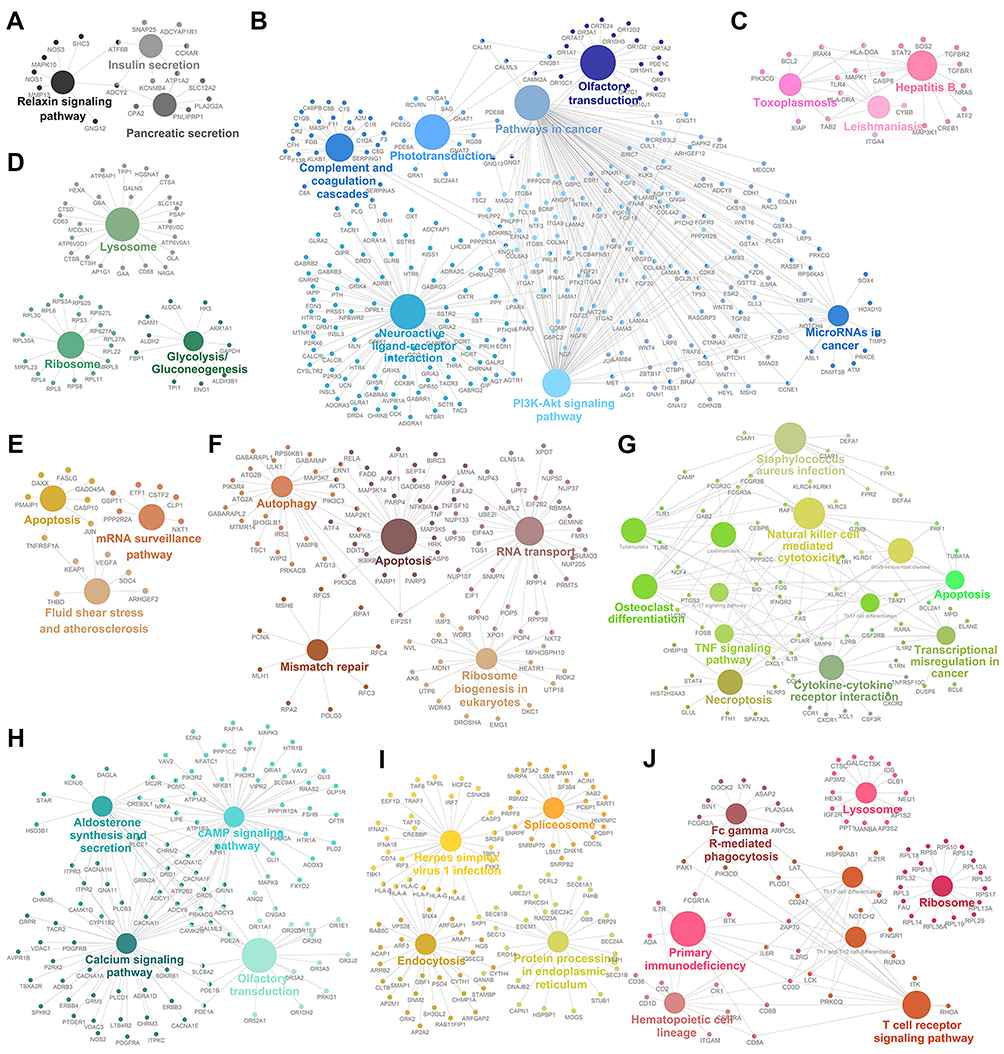 | Figure S2 Gene annotation enrichment analysis of the Kyoto Encyclopedia of Genes and Genomes (KEGG) pathway in different modules. (A) Black module. (B) Blue module. (C) Pink module. (D) Green module. (E) Tan module. (F) Brown module. (G) Green–yellow module. (H) Turquoise module. (I) Yellow module. (J) Red module. |
 © 2019 The Author(s). This work is published and licensed by Dove Medical Press Limited. The
full terms of this license are available at https://www.dovepress.com/terms
and incorporate the Creative Commons Attribution
- Non Commercial (unported, 3.0) License.
By accessing the work you hereby accept the Terms. Non-commercial uses of the work are permitted
without any further permission from Dove Medical Press Limited, provided the work is properly
attributed. For permission for commercial use of this work, please see paragraphs 4.2 and 5 of our Terms.
© 2019 The Author(s). This work is published and licensed by Dove Medical Press Limited. The
full terms of this license are available at https://www.dovepress.com/terms
and incorporate the Creative Commons Attribution
- Non Commercial (unported, 3.0) License.
By accessing the work you hereby accept the Terms. Non-commercial uses of the work are permitted
without any further permission from Dove Medical Press Limited, provided the work is properly
attributed. For permission for commercial use of this work, please see paragraphs 4.2 and 5 of our Terms.