Back to Journals » Cancer Management and Research » Volume 10
Identification of differentially expressed miRNAs in early-stage cervical cancer with lymph node metastasis across The Cancer Genome Atlas datasets
Authors Chen Q ![]() , Zeng X, Huang D, Qiu X
, Zeng X, Huang D, Qiu X
Received 10 August 2018
Accepted for publication 9 November 2018
Published 28 November 2018 Volume 2018:10 Pages 6489—6504
DOI https://doi.org/10.2147/CMAR.S183488
Checked for plagiarism Yes
Review by Single anonymous peer review
Peer reviewer comments 2
Editor who approved publication: Dr Beicheng Sun
Qian Chen,1 Xiaoyun Zeng,2 Dongping Huang,2 Xiaoqiang Qiu2
1Department of Research, Affiliated Tumor Hospital of Guangxi Medical University, Nanning, Guangxi, China; 2Department of Epidemiology, School of Public Health, Guangxi Medical University, Nanning, Guangxi, China
Background and aim: Previous studies have suggested that lymph node metastasis (LNM) in early-stage cervical cancer (CESC) may affect the prognosis of patients and the outcomes of subsequent adjuvant therapy. However, research focused on miRNA expression in early-stage CESC patients with LNM remains limited. Therefore, it is necessary to identify prognostic miRNAs and determine their molecular mechanisms.
Methods: We evaluated the differentially expressed genes in early-stage CESC patients with LNM compared to patients without LNM and evaluated the prognostic significance of these differentially expressed genes by analyzing a public dataset from The Cancer Genome Atlas. Potential molecular mechanisms were investigated by gene ontology, the Kyoto Encyclopedia of Genes and Genomes, and protein–protein interaction network analyses.
Results: According to the The Cancer Genome Atlas data, hsa-miR-508, hsa-miR-509-2, and hsa-miR-526b expression levels were significantly lower in early-stage CESC patients with LNM than in patients without LNM. A multivariate analysis suggested that three miRNAs were prognostic factors for CESC (P<0.05). The target genes were identified to be involved in the MAPK, cAMP, PI3K/Akt, mTOR, and estrogen cancer signaling pathways. Protein–protein interaction network analysis showed that TP53, MMP1, NOTCH1, SMAD4, and NFKB1 were the most significant hub proteins.
Conclusion: Our results indicate that hsa-miR-508, hsa-miR-509-2, and hsa-miR-526b may be potential diagnostic biomarkers for early-stage CESC with LNM, and serve as prognostic predictors for patients with CESC.
Keywords: lymph nodes, miRNAs, prognosis, uterine cervical neoplasms
Introduction
Cervical cancer (CESC) is one of the leading etiologies of malignant tumor deaths in woman aged 20–39 years. According to the National Center for Health Statistics, in 2017, there were 12,820 estimated new cases of CESC and 4,210 estimated deaths caused by CESC in America.1 In fact, CESC deaths in developing countries account for 90% of the world’s total death toll, causing severe public health problems and financial burden.2 Some studies have shown that miRNAs are associated with the development and prognosis of CESC.3–5 Previous studies have reported that lymph node metastasis (LNM) in early-stage CESC influences the patient’s survival and outcomes of subsequent adjuvant therapy, but there is limited research on the relationship between LNM and miRNAs in early-stage CESC.6–9 Therefore, it is meaningful to study the molecular mechanisms of CESC and identify miRNA markers for individualized treatment plans and prognostic prediction of CESC.
miRNAs are small noncoding RNAs of ~22 nucleotides in length that play regulatory roles in RNA silencing.10 miRNAs are involved in regulating 30% of human genes.11 Through the regulation of target genes, miRNAs play a role in cell cycle regulation, cell proliferation, apoptosis, drug resistance, and other biological processes (BPs).12–17 Additionally, miRNAs are stable in tissue, blood, and urine.18–20 Therefore, miRNAs show promise for use in the diagnosis and treatment of CESC.
The Cancer Genome Atlas (TCGA) contains genomic and proteomic data from more than 20 tumor types, with the benefits of a large sample size, a unified testing platform, and complete follow-up information; moreover, an increasing number of studies utilize data from this database.3,5,21–23 High-throughput dataset analysis may provide a useful method for the identification of hub genes and patterns in CESC. In this study, we analyzed the differences in miRNA expression patterns between early-stage CESC patients with LNM [LNM(+)] and without LNM [LNM(−)]. Additionally, we analyzed the prognostic value of these miRNAs (hsa-miR-508, hsa-miR-509-2, and hsa-miR-526b) and their possible mechanisms of action, which may offer new insight for improving CESC treatment and patient survival. Based on our results, hsa-miR-508, hsa-miR-509-2, and hsa-miR-526b may be potential diagnostic biomarkers and prognostic indicators of CESC.
Materials and methods
CESC patients in TCGA
The information and miRNA data for 307 patients with CESC were obtained from the TCGA database (https://cancergenome.nih.gov/). The exclusion criteria were as follows: 1) information on LNM was not provided or not applicable; 2) the clinical stage was not stage IA2–IIA (International Federation of Gynecology and Obstetrics 2009 criteria); and 3) the clinical data were incomplete. A total of 145 patients with early-stage CESC in the training group were used to analyze differentially expressed genes (DEGs). In addition, 275 CESC patients in the validation group were used to evaluate the prognosis of CESC.
miRNA expression data analyses
The miRNA expression analyses were performed using the “edgeR” package in R.24 From a total of 1,046 miRNAs, 422 miRNAs were detected in at least two cohorts, and miRNAs with no ID on miRBase21 or with a mean expression <3 raw counts were removed. Each individual miRNA was log2-transformed for further analysis. All DEGs were considered significant if the absolute fold changes were more than 1.5 and the P-value was <0.05.
Prediction of miRNA target genes
To date, miRWalk2.0 is the only comprehensive archive that can be accessed for free, providing the largest available predictive and experimental miRNA–target interaction data and offering novel and unique features.25 Target genes of three miRNAs were predicted based on the miRWalk database, and overlapped genes among the miRanda, PITA, and Targetscan databases were selected. A P-value<0.05 represented statistical significance.
GO, KEGG, and PPI network analyses
Gene ontology (GO) and the Kyoto Encyclopedia of Genes and Genomes (KEGG) analyses are the common methods for studying the functions and pathways associated with large-scale genome data or transcriptional data. GO and KEGG enrichment analyses were performed using BiNGO 3.0.3 and DAVID 6.8.26,27 The protein–protein interaction (PPI) networks were analyzed through the STRING 10.5 database and Molecular Complex Detection (MCODE) 1.5.1.28,29 The network was further visualized using Cytoscape 3.6.1.30
Statistical analyses
The data are shown as the mean ± SD or as the median. Chi-square tests were used to assess differences in race, tumor grade, and tumor status between the LNM(+) and LNM(−) cohorts. Other data, such as age and smoking history, were evaluated using independent-sample t-tests. Kaplan–Meier survival analyses and univariate and multivariate Cox proportional risk regression analyses were conducted to compare miRNA levels (high- and low-expression levels) and prognosis.
The data were analyzed using GraphPad Prism 5.0 (La Jolla, CA, USA) and R software, and a P-value <0.05 was considered statistically significant.
Results
The effect of lymph node status on the survival of CESC patients
This study involved 145 patients with early-stage CESC, including 32 LNM(+) patients and 113 LNM(−) patients. The clinical data of these patients are presented in Table 1. Indeed, there were no significant differences in age, race, smoking history, or tumor grade between the LNM(+) and LNM(−) patients. Survival analysis showed that the survival time of the LNM(+) group was shorter than that of the LNM(−) group (P<0.05; Figure 1).
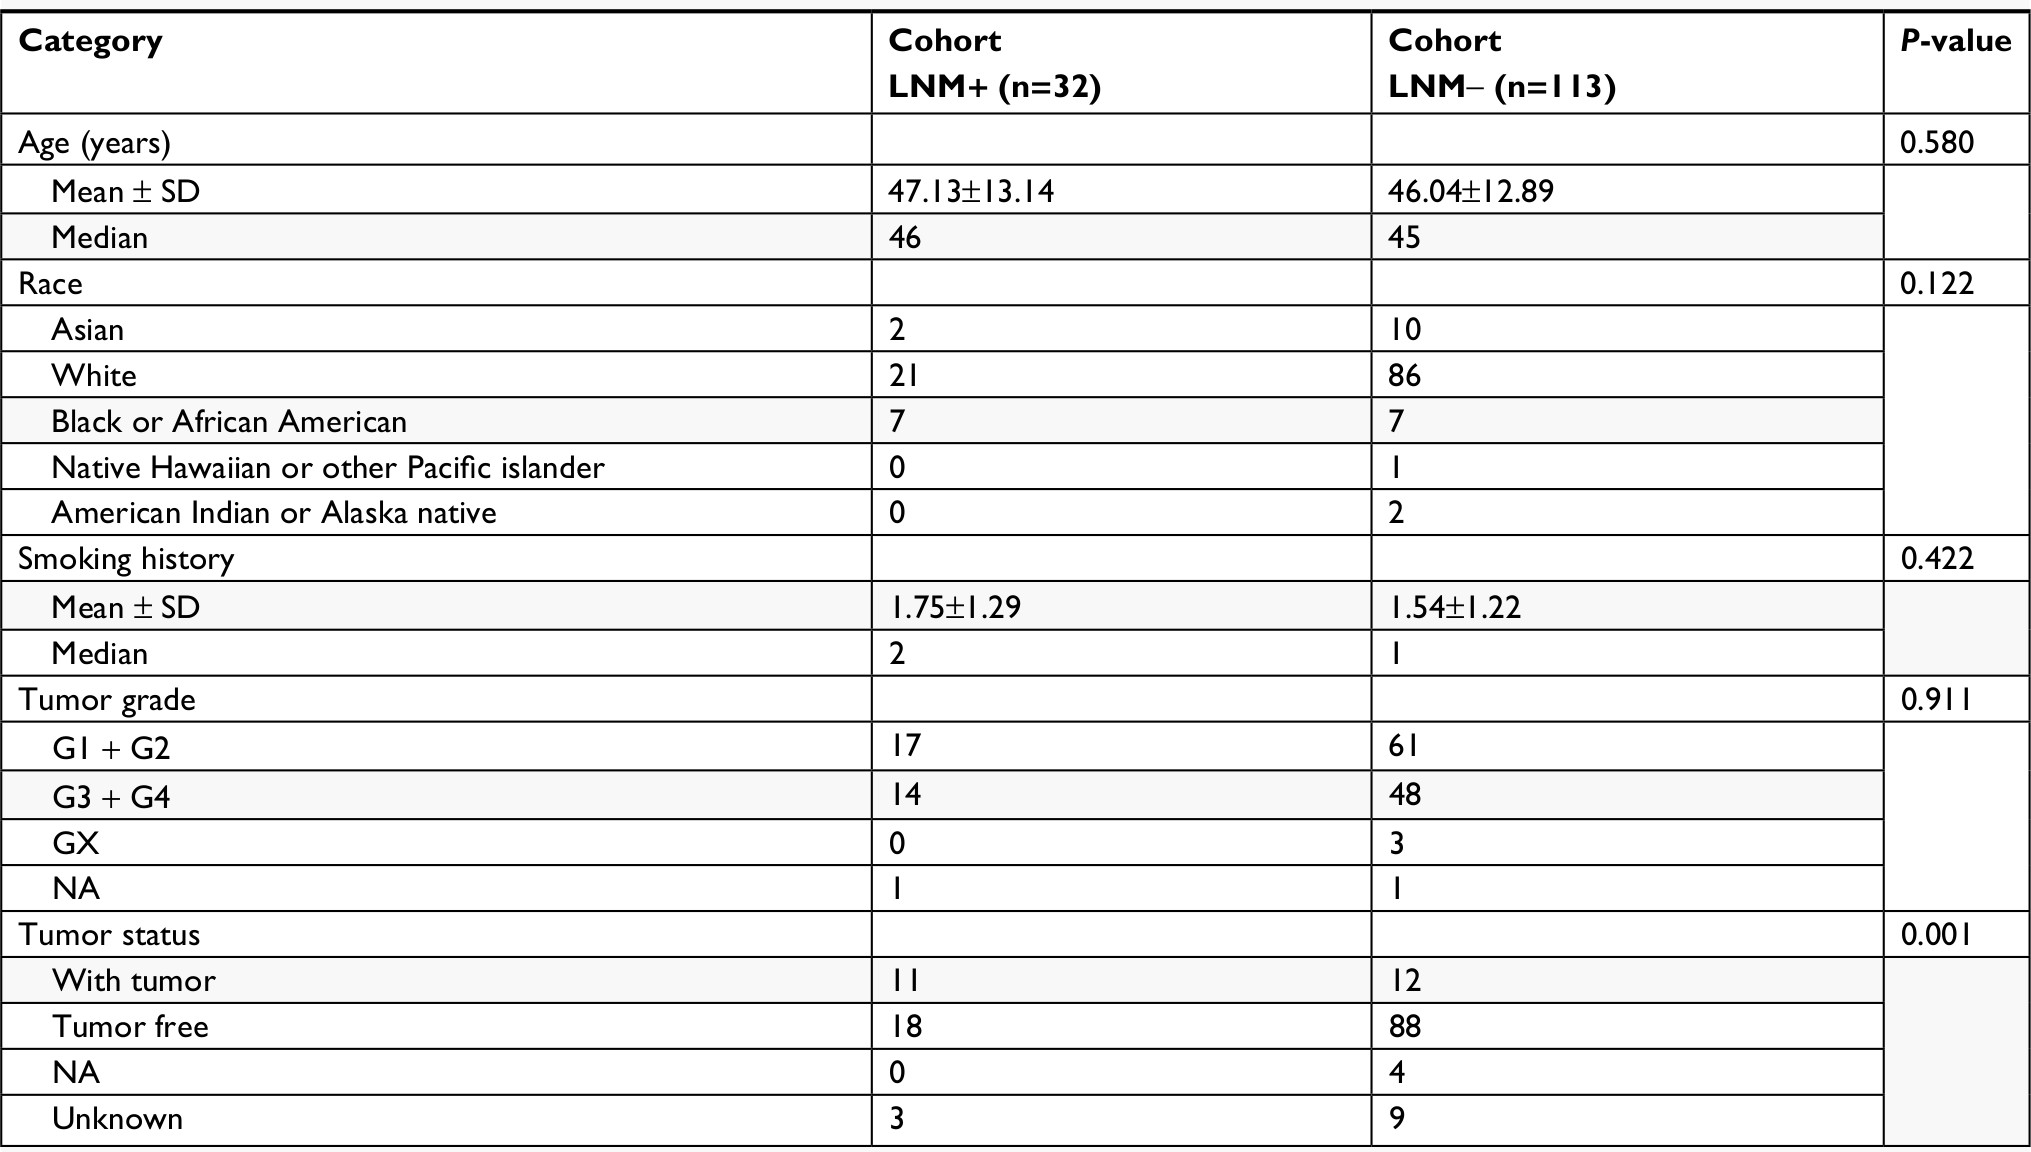 | Table 1 Clinical characteristics of patients with early-stage CESC Abbreviations: CESC, cervical cancer; LNM, lymph node metastasis; NA, not available. |
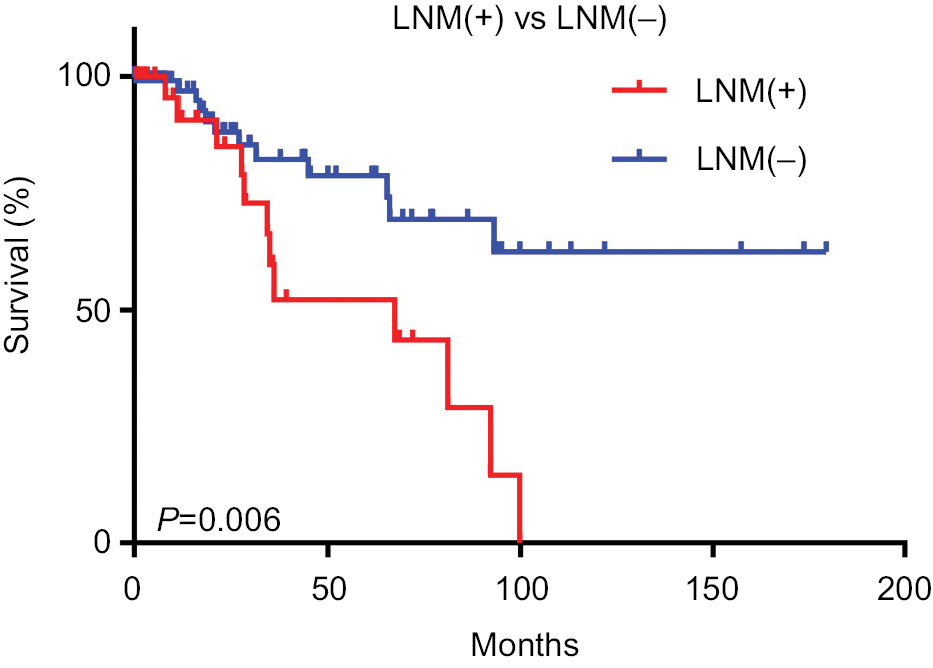 | Figure 1 Survival analysis of early-stage LNM(+) and LNM(−) cervical cancer patients. Note: Kaplan–Meier survival curves show that LNM(+) was associated with poor prognosis in early-stage CESC patients. Abbreviations: CESC, cervical cancer; LNM, lymph node metastasis. |
Differentially expressed miRNAs in LNM(+) and LNM(−) patients
Comprehensive miRNA profiles of early-stage CESC were generated for LNM(+) and LNM(−) patients. In total, 75 miRNAs were differentially regulated and had a P-value <0.05 and an absolute fold change of more than 1.5 (Supplementary table S1). As shown in Figure 2, of these 75 miRNAs, 24 miRNAs (32.0%) were downregulated in LNM(+) patients, while the remaining 51 (68.0%) miRNAs were upregulated in LNM(+) patients. Seventy-five miRNAs were selected for further analyses.
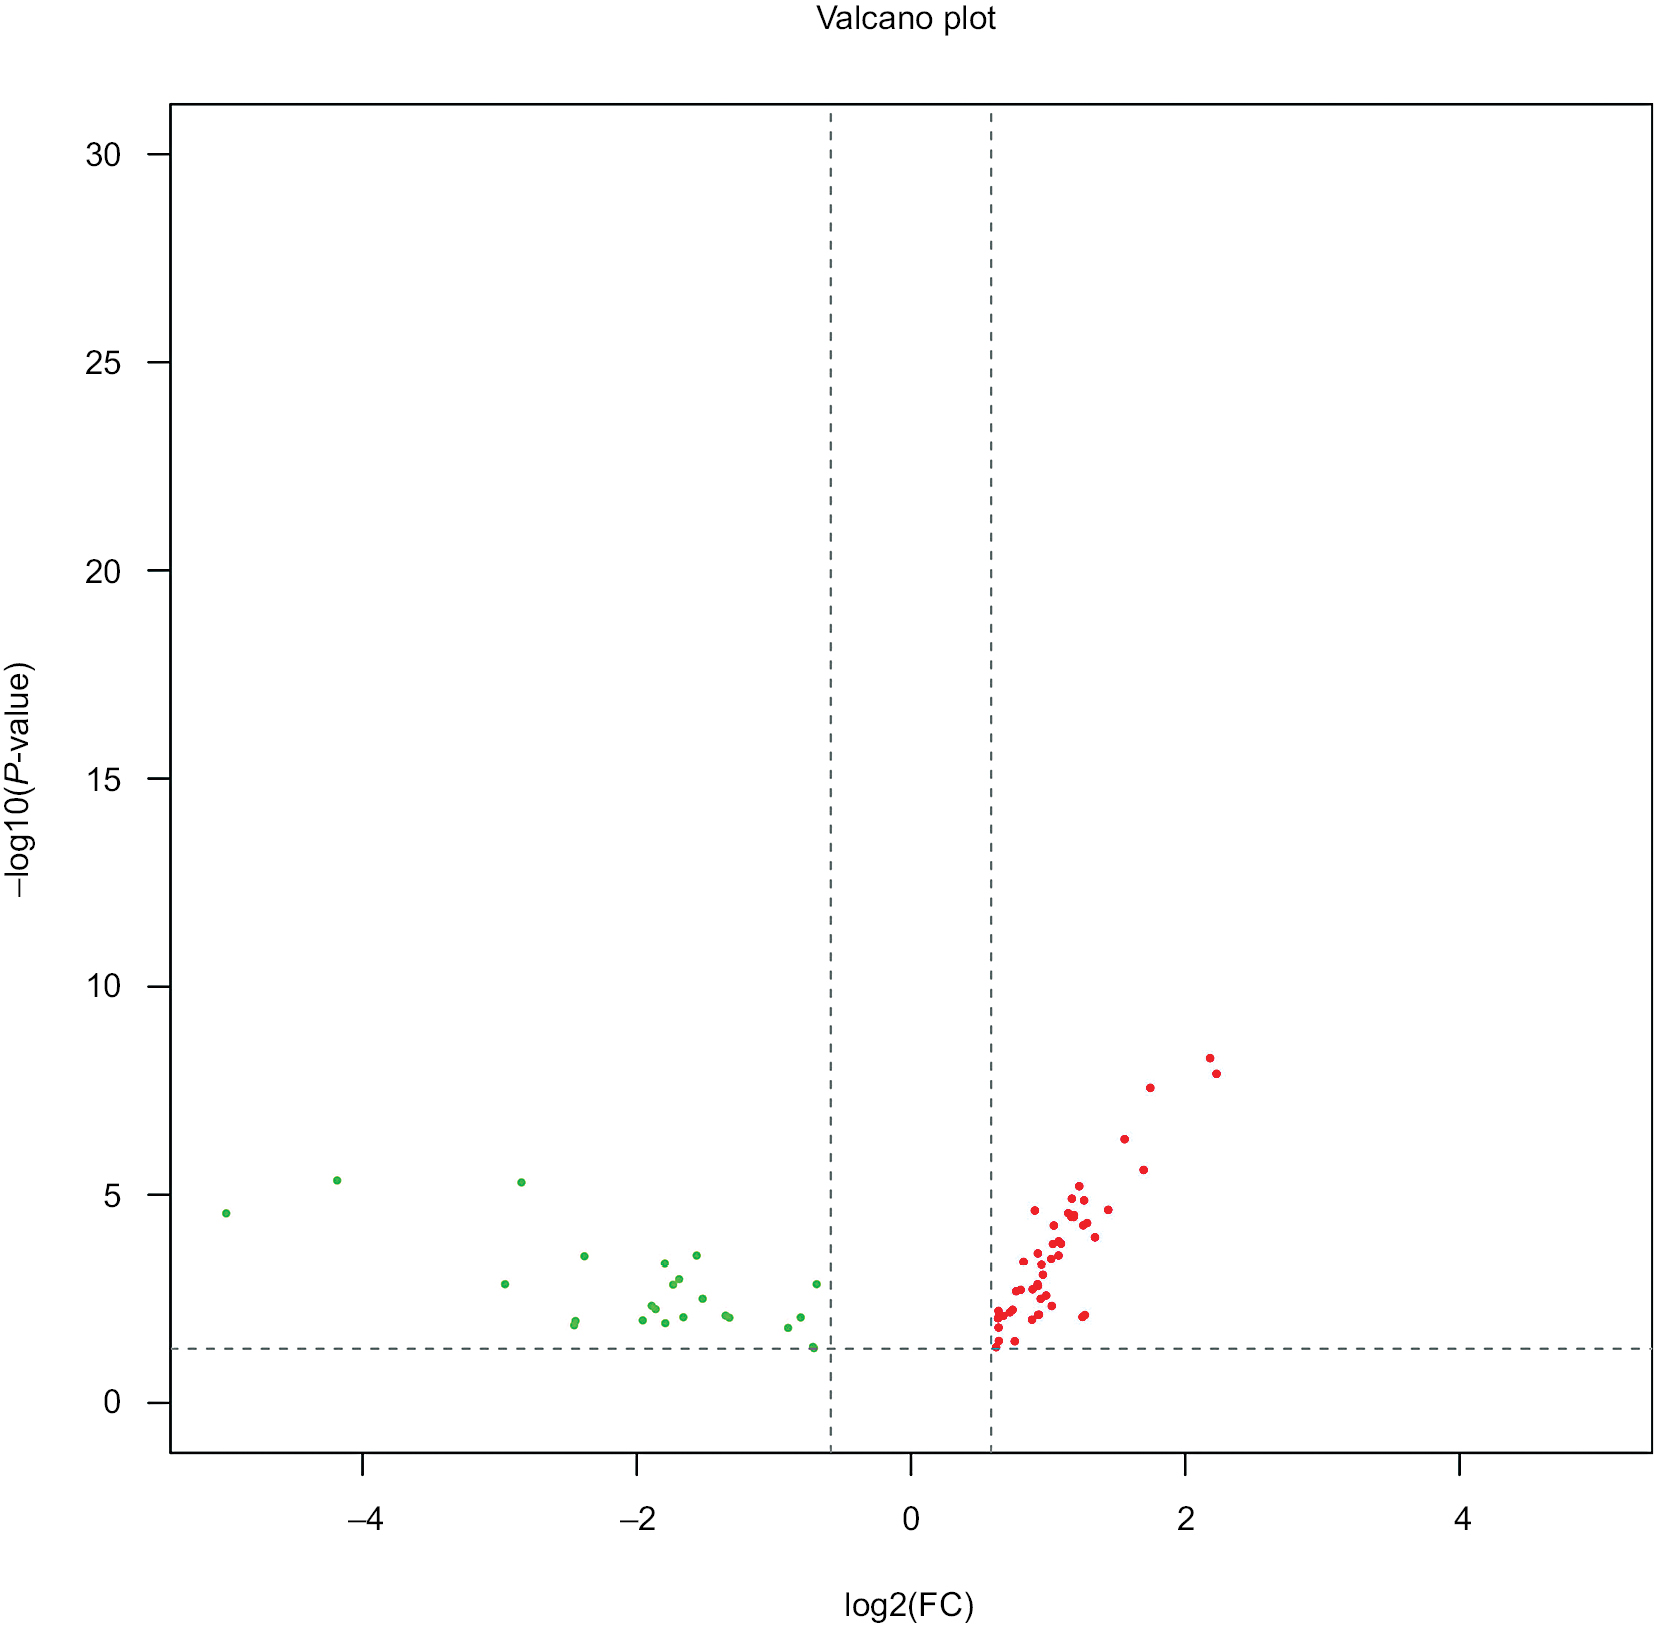 | Figure 2 Differentially expressed miRNAs in LNM(+) patients. Notes: Volcano plots of miRNAs were constructed using fold changes and P-values. The vertical lines correspond to a 1.5-fold change in expression (up or down), and the horizontal line represents P=0.05. The green points on the plot represent the 24 differentially expressed miRNAs that were downregulated in LNM(+) patients, and the red points on the plot represent the 51 differentially expressed miRNAs upregulated in LNM(+) patients. Abbreviation: LNM, lymph node metastasis. |
Identification of miRNAs correlated with the survival of CESC patients
To identify the association between miRNAs and the survival of CESC patients, the overall survival times of 275 CESC patients in the TCGA dataset were analyzed by the Kaplan–Meier method and log-rank tests. The results showed that patients with high hsa-miR-508 or hsa-miR-526b levels had a longer overall survival time than did those with low hsa-miR-508 level or hsa-miR-526b levels (log-rank test: P=0.006, 0.003), as shown in Figure 3. The correlation of hsa-miR-509-2 level with overall survival time in the 275 CESC patients was not significant. The miRNA expression data are shown in Figure 4 and Table 2.
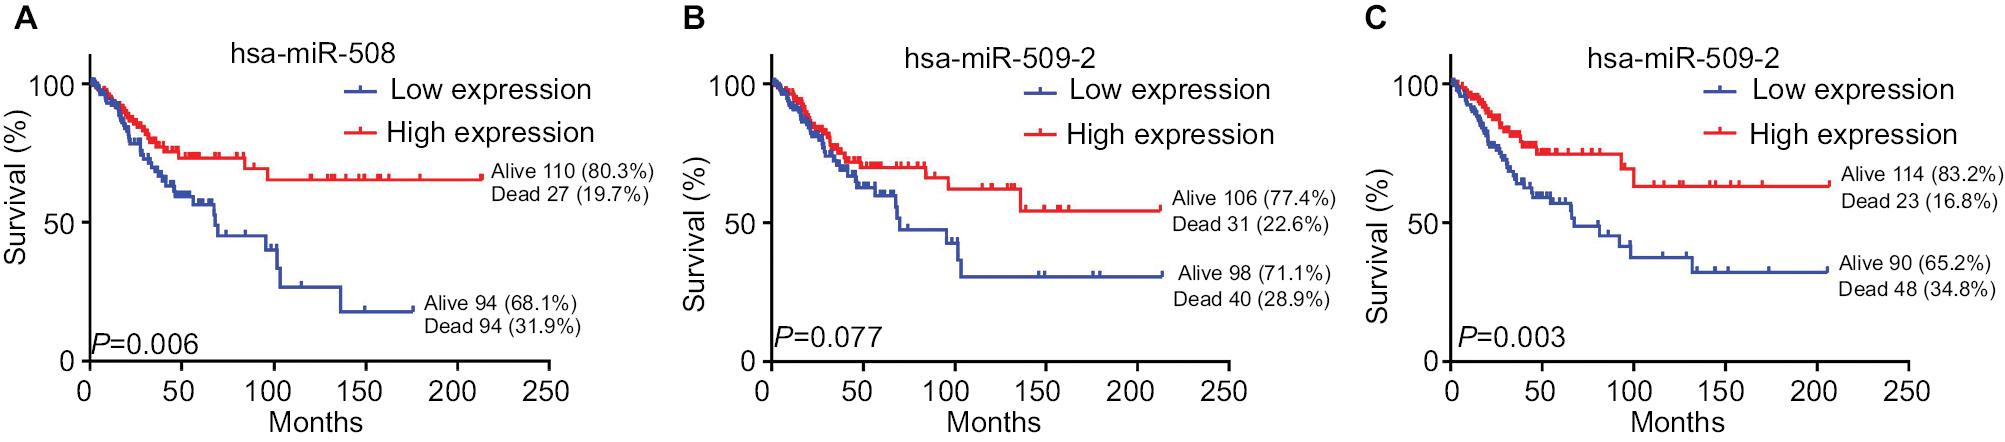 | Figure 3 Kaplan–Meier survival curves of the expression of the three miRNAs of interest in CESC. Notes: Kaplan–Meier survival curves show that low miRNA expression was associated with poor survival in CESC patients. Patients were divided into high and low levels according to the median of each miRNA. (A) hsa-miR-508; (B) hsa-miR-509-2; (C) hsa-miR-526b. Abbreviation: CESC, cervical cancer. |
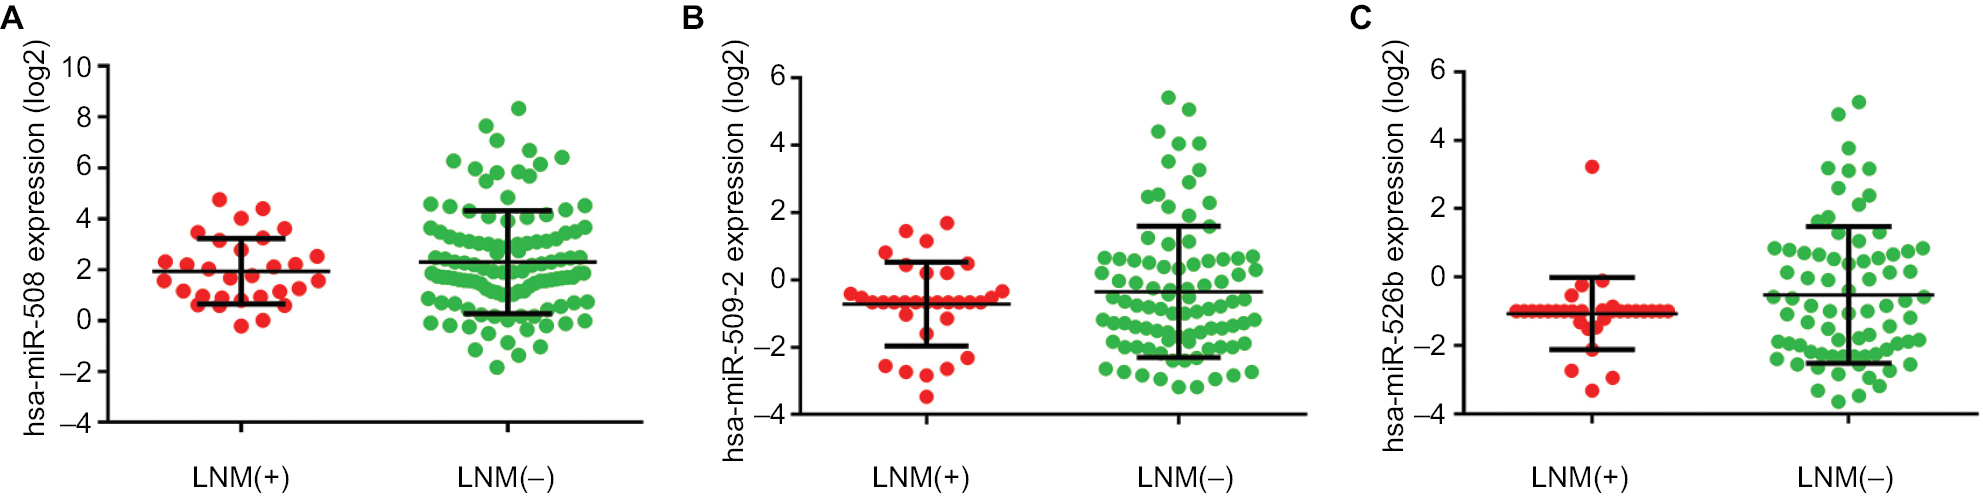 | Figure 4 Differential expression of the three miRNAs of interest in LNM(+) and LNM(−) patients. Notes: (A) The expression levels of hsa-miR-508 in LNM(+) and LNM(−) patients. (B) The expression levels of hsa-miR-509-2 in LNM(+) and LNM(−) patients. (C) The expression levels of hsa-miR-526b in LNM(+) and LNM(−) patients. The expression level values were calculated using log2-transformed values. Abbreviation: LNM, lymph node metastasis. |
 | Table 2 Three downregulated miRNAs in early-stage CESC patients with lymph node metastases Abbreviations: FC, fold change; FDR, false discovery rate ID, miRNA identification. |
Univariate and multivariate Cox regression analyses in CESC patients
The clinical features of age, smoking history, clinical stage, tumor grade, and metastasis were considered in the univariate and multivariate Cox regression analyses to analyze the prognosis of CESC patients. The univariate analysis suggested that there was a significant association between overall survival time and clinical stage (HR: 2.329, 95% CI: 1.423–3.812, P=0.001), hsa-miR-508 (HR: 0.511, 95% CI: 0.315–0.828, P=0.006), and hsa-miR-526b (HR: 0.484, 95% CI: 0.294–0.795, P=0.004). No significant association was observed between overall survival time and age, smoking history, tumor grade, or metastasis. The multivariate analysis suggested that clinical stage (HR: 2.368, 95% CI: 1.414–3.967, P=0.001), hsa-miR-508 (HR: 0.496, 95% CI: 0.298–0.826, P=0.007), hsa-miR-509-2 (HR: 0.596, 95% CI: 0.363–0.980, P=0.041), and hsa-miR-526b (HR: 0.591, 95% CI: 0.350–0.996, P=0.048) were prognostic factors for CESC (Table 3).
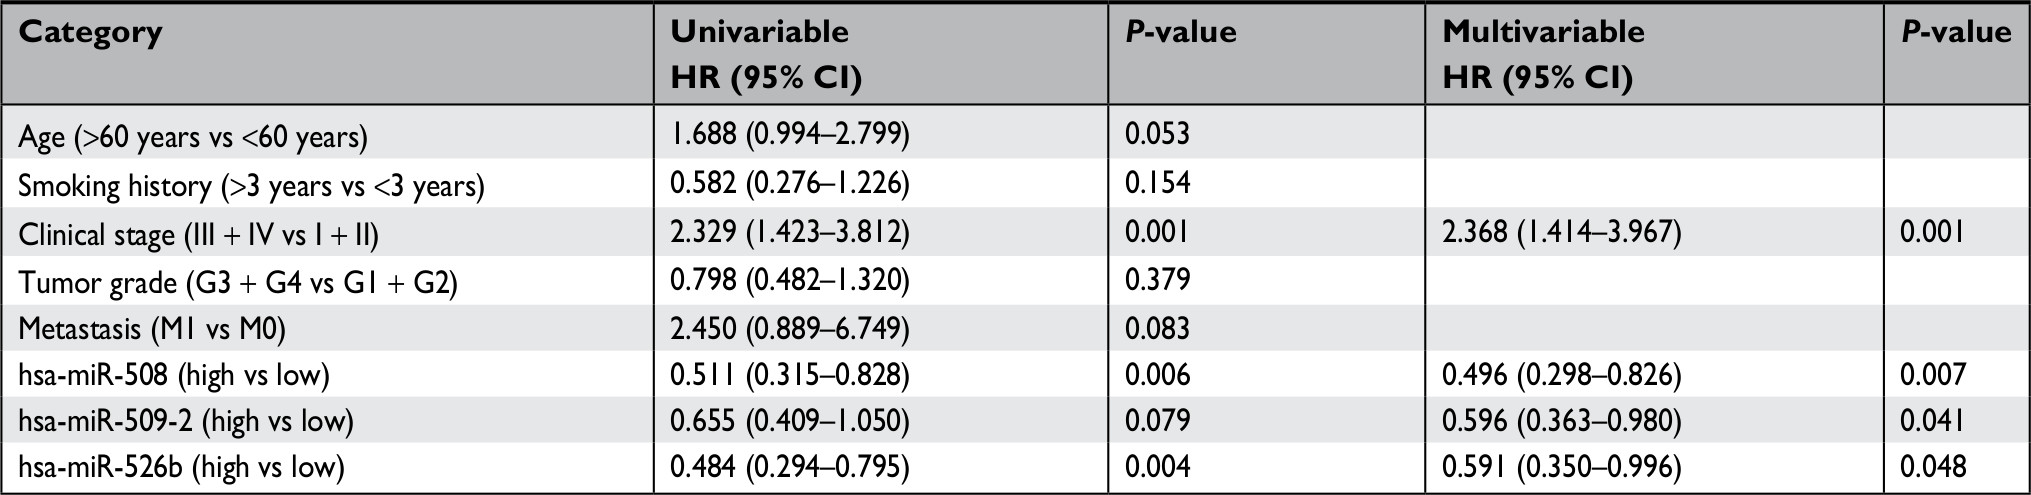 | Table 3 Univariate and multivariate Cox regression analyses in CESC patients Abbreviation: CESC, cervical cancer. |
Functional implication of prognostic miRNA signatures
To further analyze the mechanisms of these miRNAs (hsa-miR-508, hsa-miR-509-2, and hsa-miR-526b) in CESC, we used miRWalk2.0, which identifies overlapping genes between miRanda, PITA, and the Targetscan databases to predict target genes. Then, we performed functional enrichment analysis with GO and KEGG using BiNGO and DAVID. The GO BP terms were remarkably enriched in epithelial cell development, regulation of cell shape, neuronal migration, and so on. For the GO cellular component (CC) terms, the target genes were concentrated in the cortical actin cytoskeleton, postsynaptic density, and so on. The molecular function (MF) category was focused on steroid hormone receptor activity, NOTCH binding, and so on (Figure 5, Table 4). In addition, the KEGG pathways were mostly enriched in cancer pathways, including the MAPK, cAMP, PI3K/Akt, mTOR, and estrogen signaling pathways (Figure 6, Table 5). The GO network was illustrated as an interaction network using the Cytoscape plug-in BiNGO, which maps the main functional categories of a given gene set in the GO hierarchy. As shown in Figure 7, the regulation of cellular and primary metabolic processes was important in the BP network. In the CC network, the cell and intracellular components were in core positions (Figure 8). Additionally, the ion, cation, metal ion, and zinc ion binding components were significant in the MF network (Figure 9).
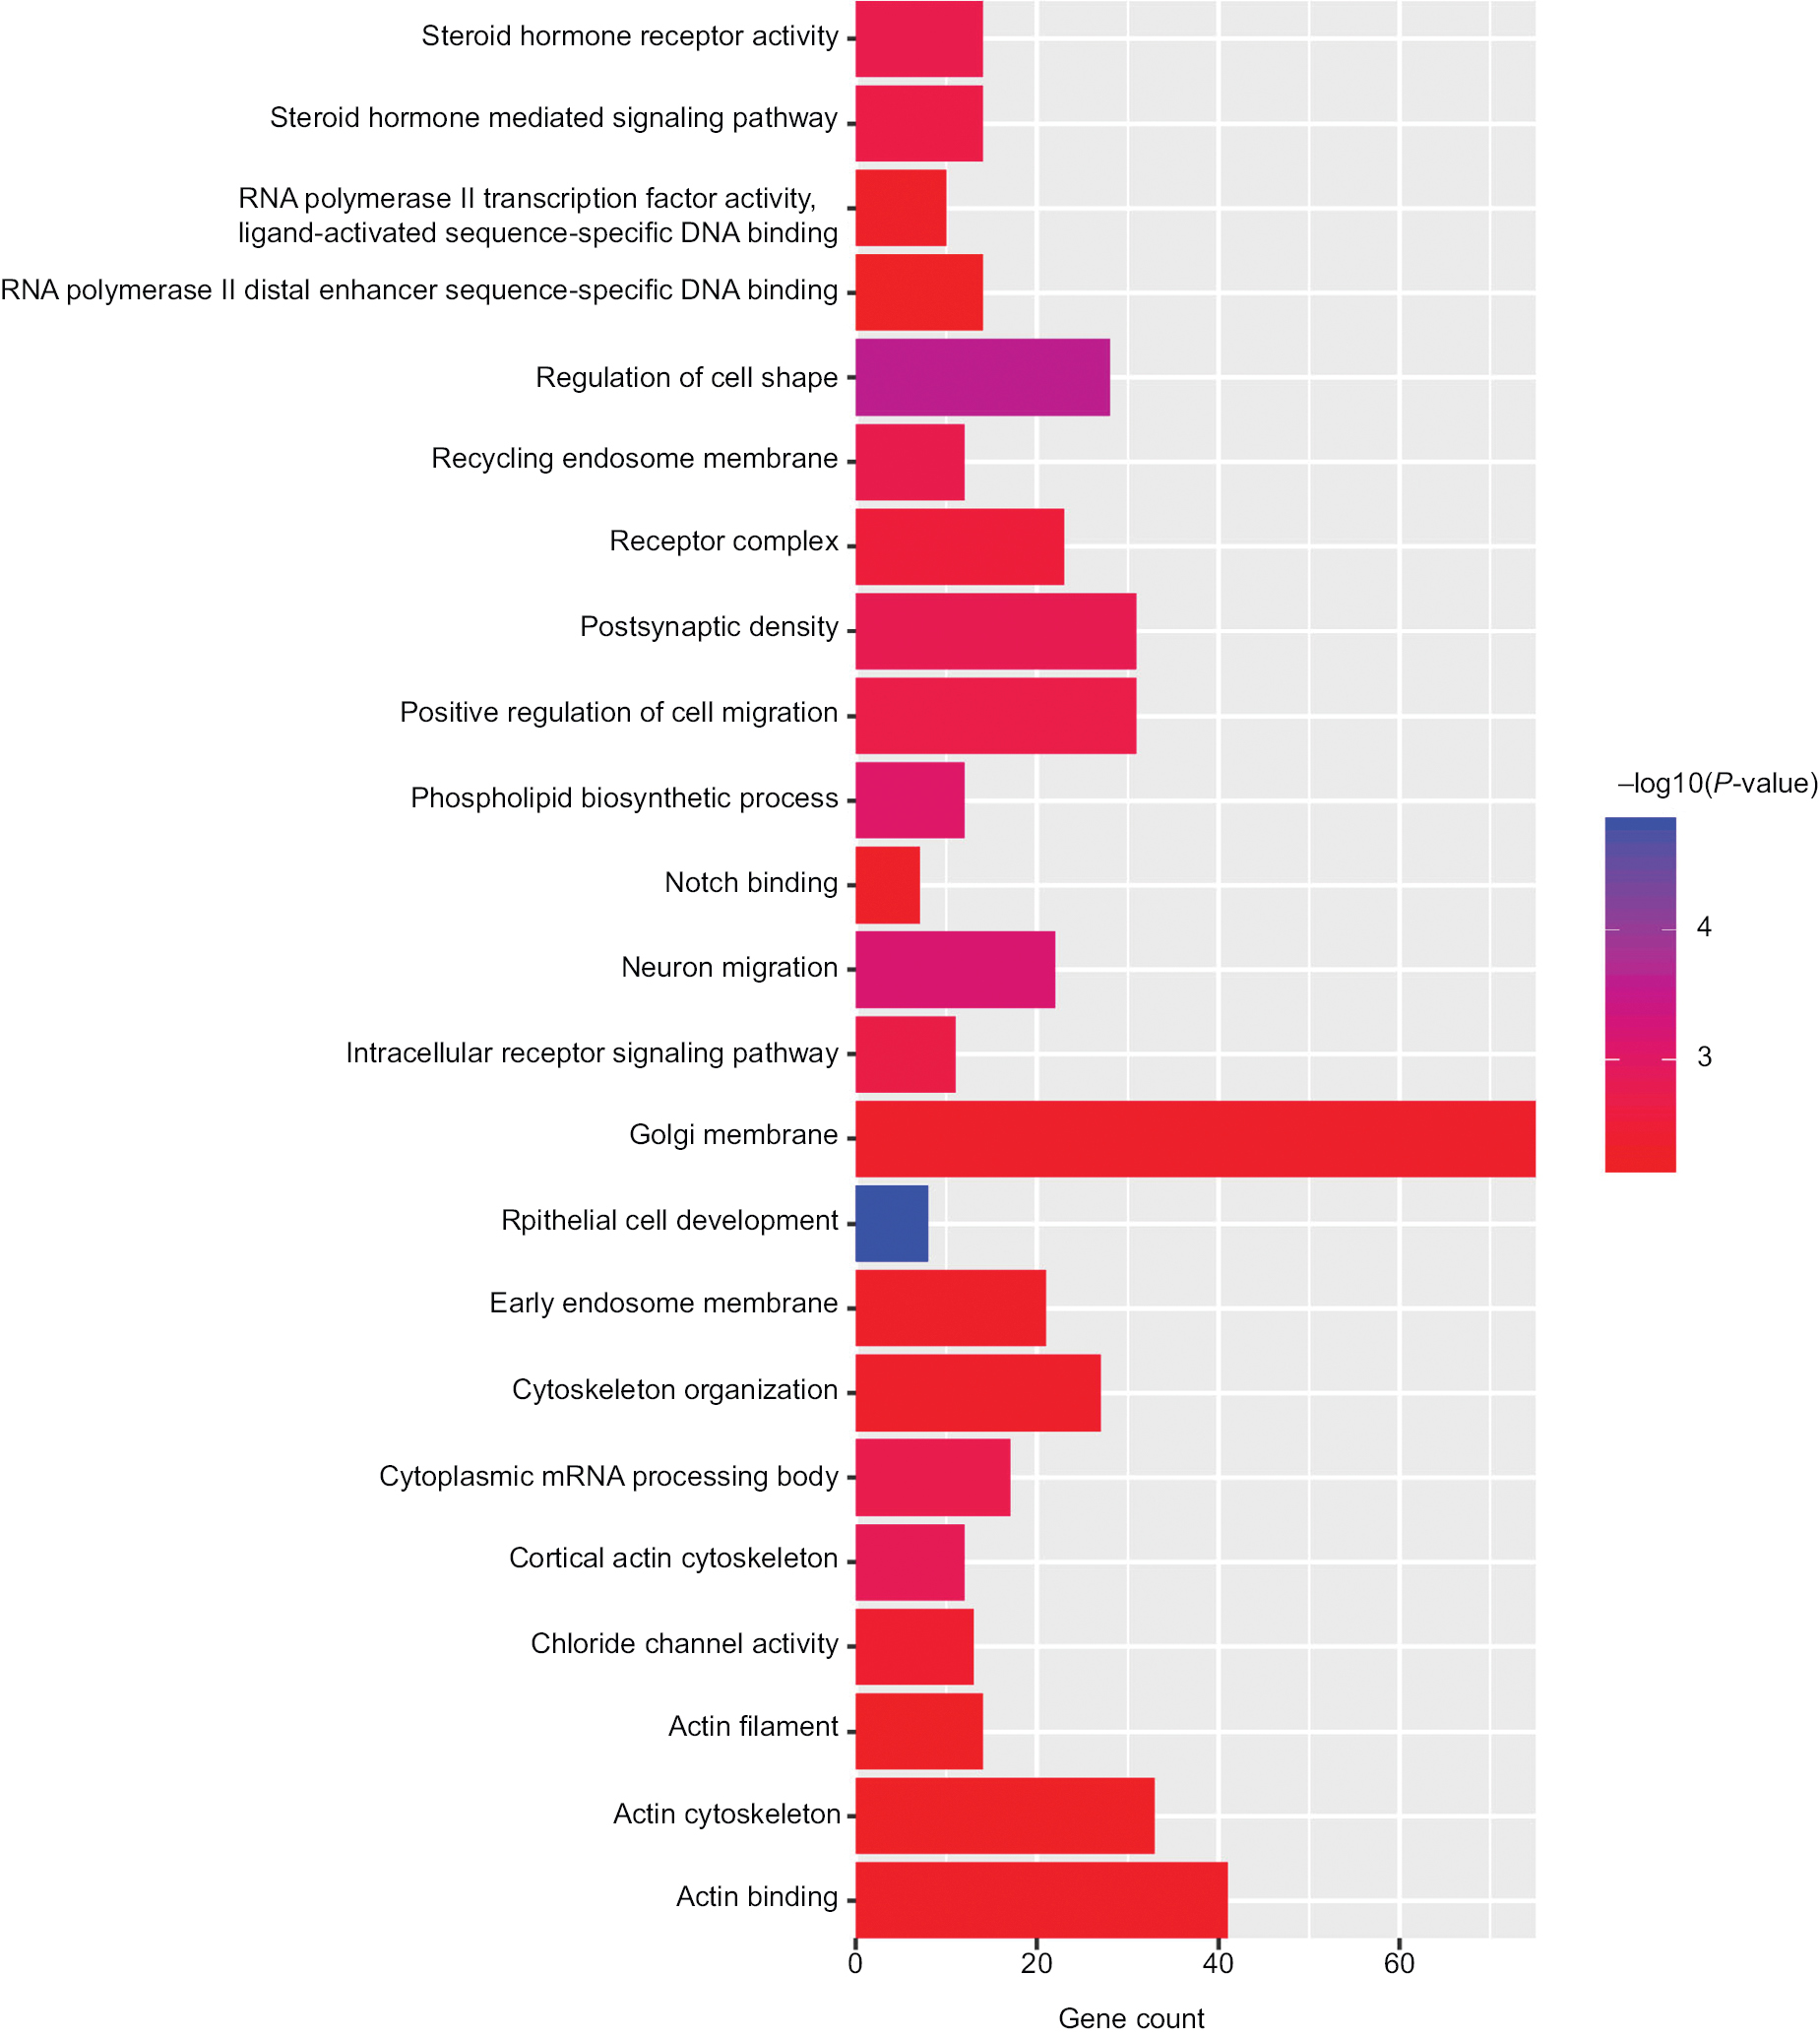 | Figure 5 GO terms for the target genes of three miRNAs using DAVID. Abbreviation: GO, gene ontology. |
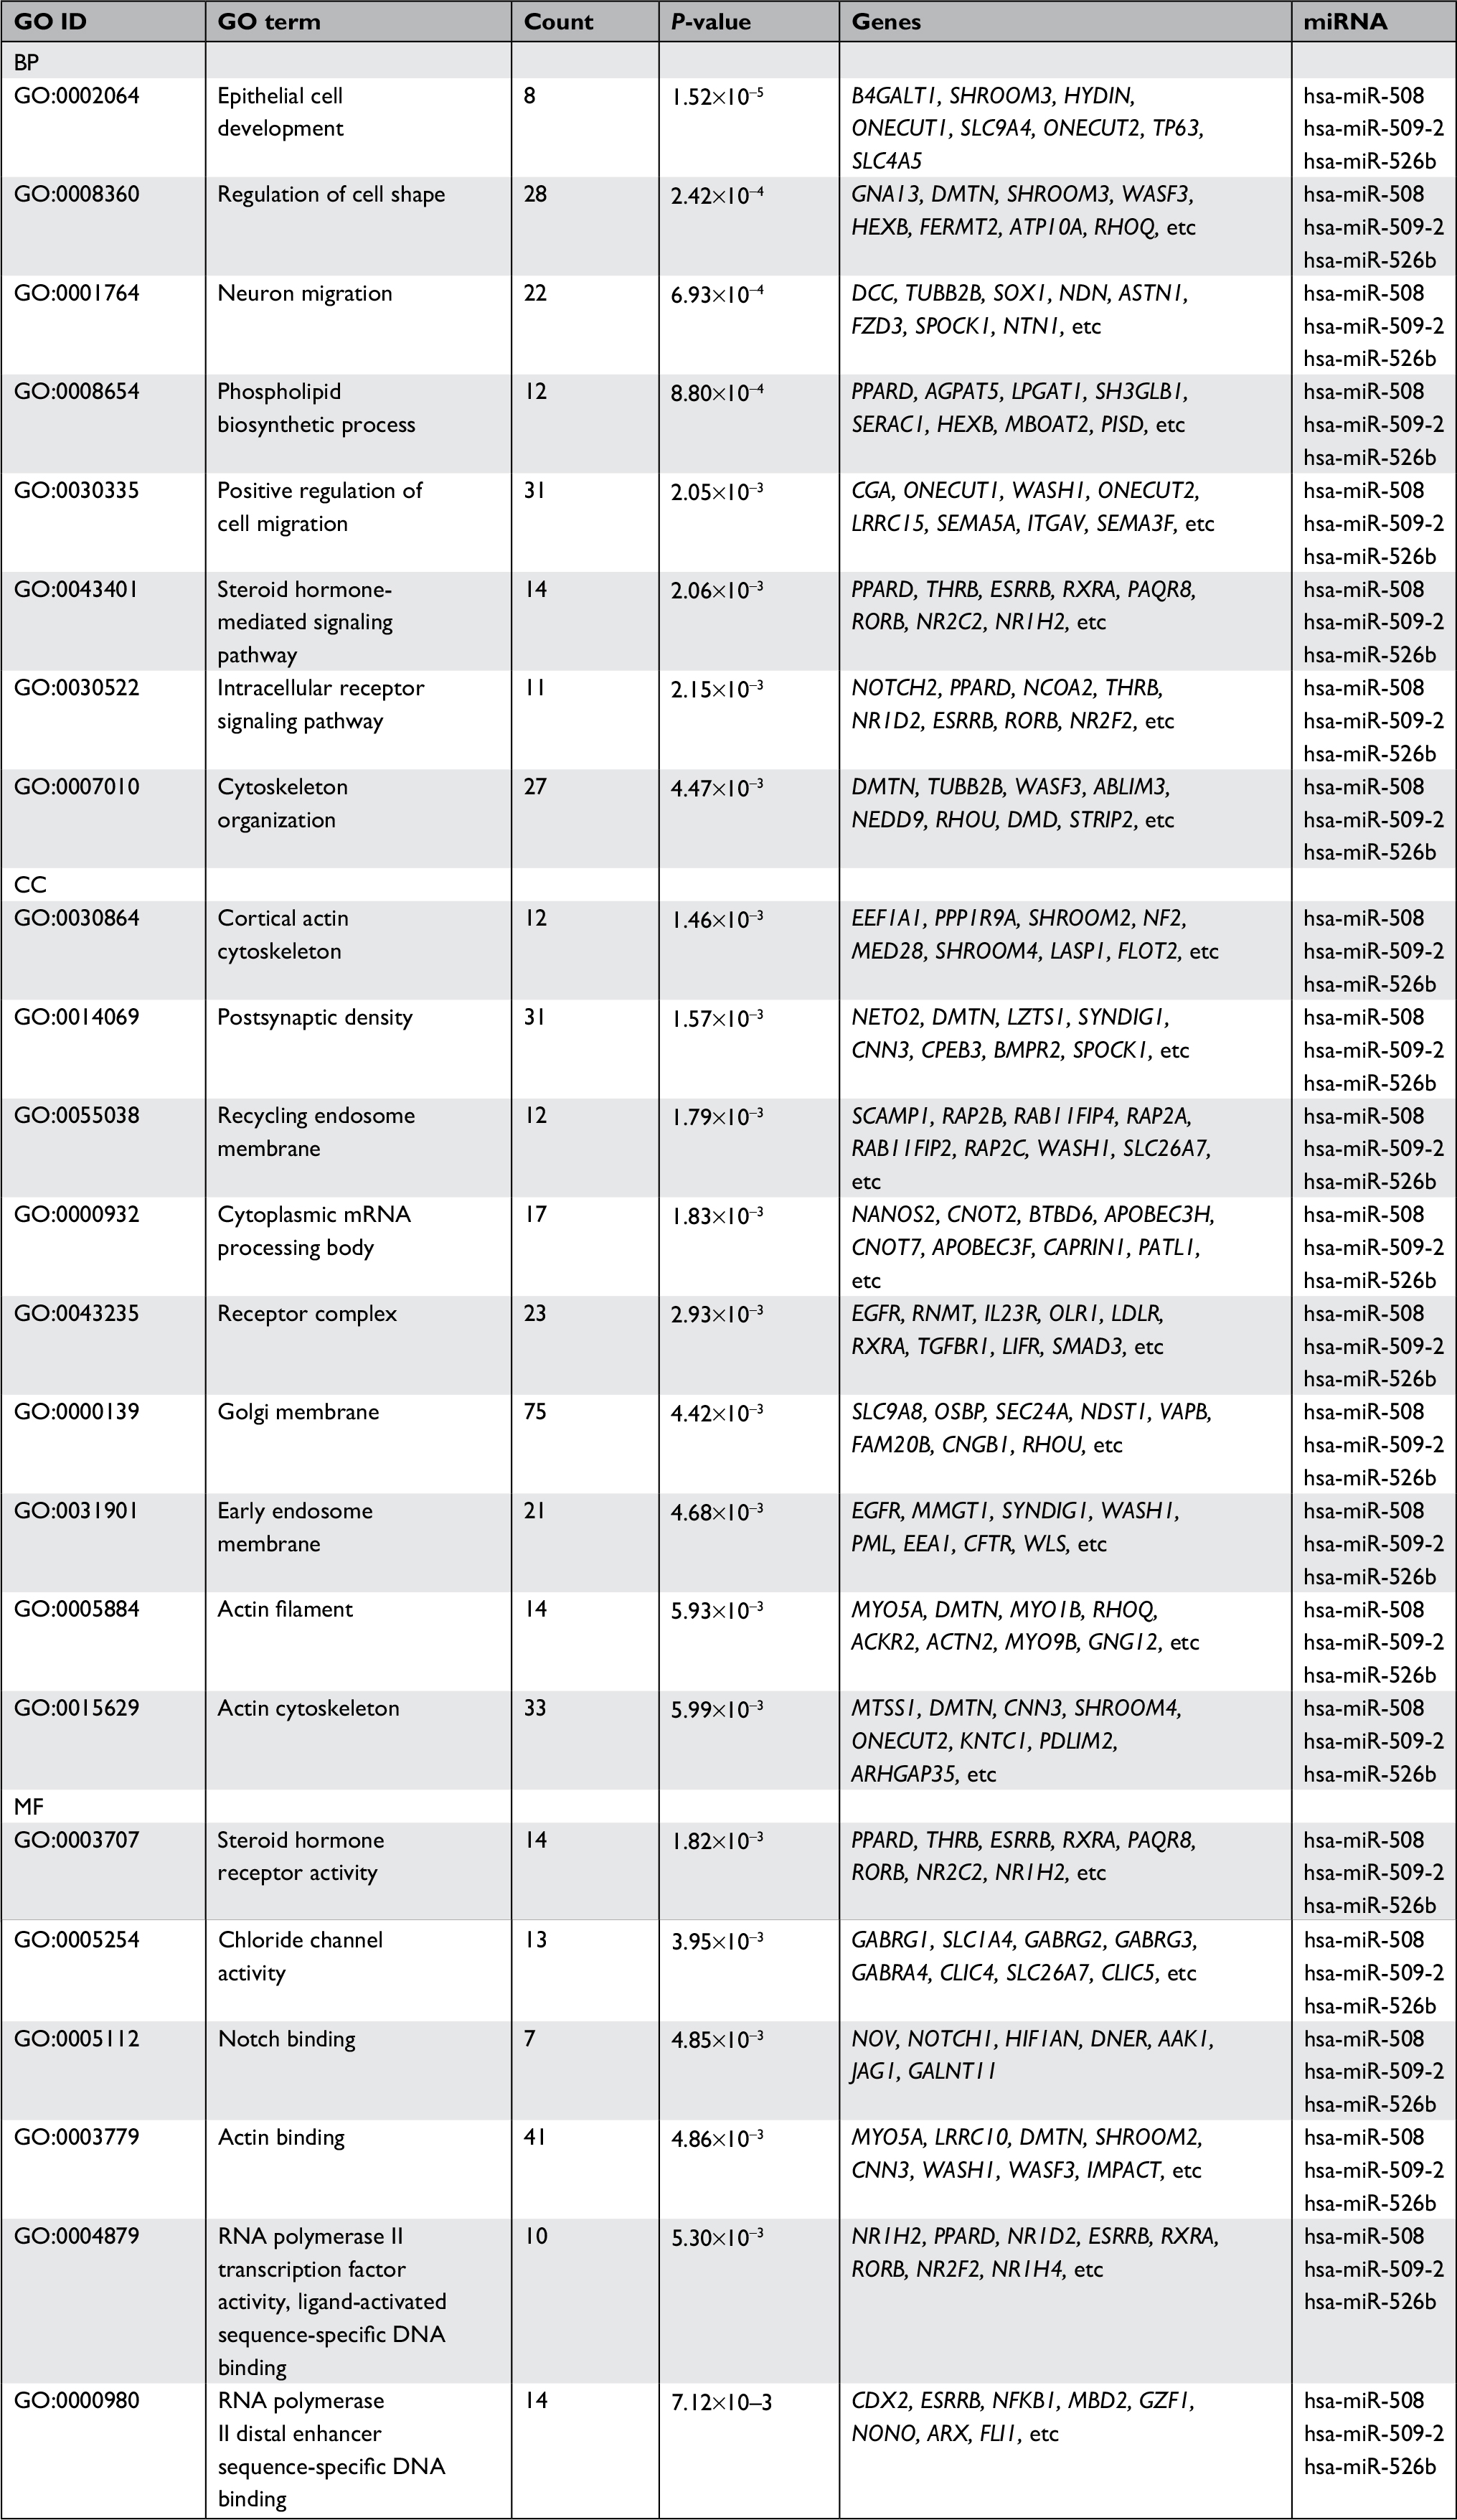 | Table 4 GO terms enriched in target genes Abbreviations: BP, biological process; CC, cellular component; GO, gene ontology; MF, molecular function. |
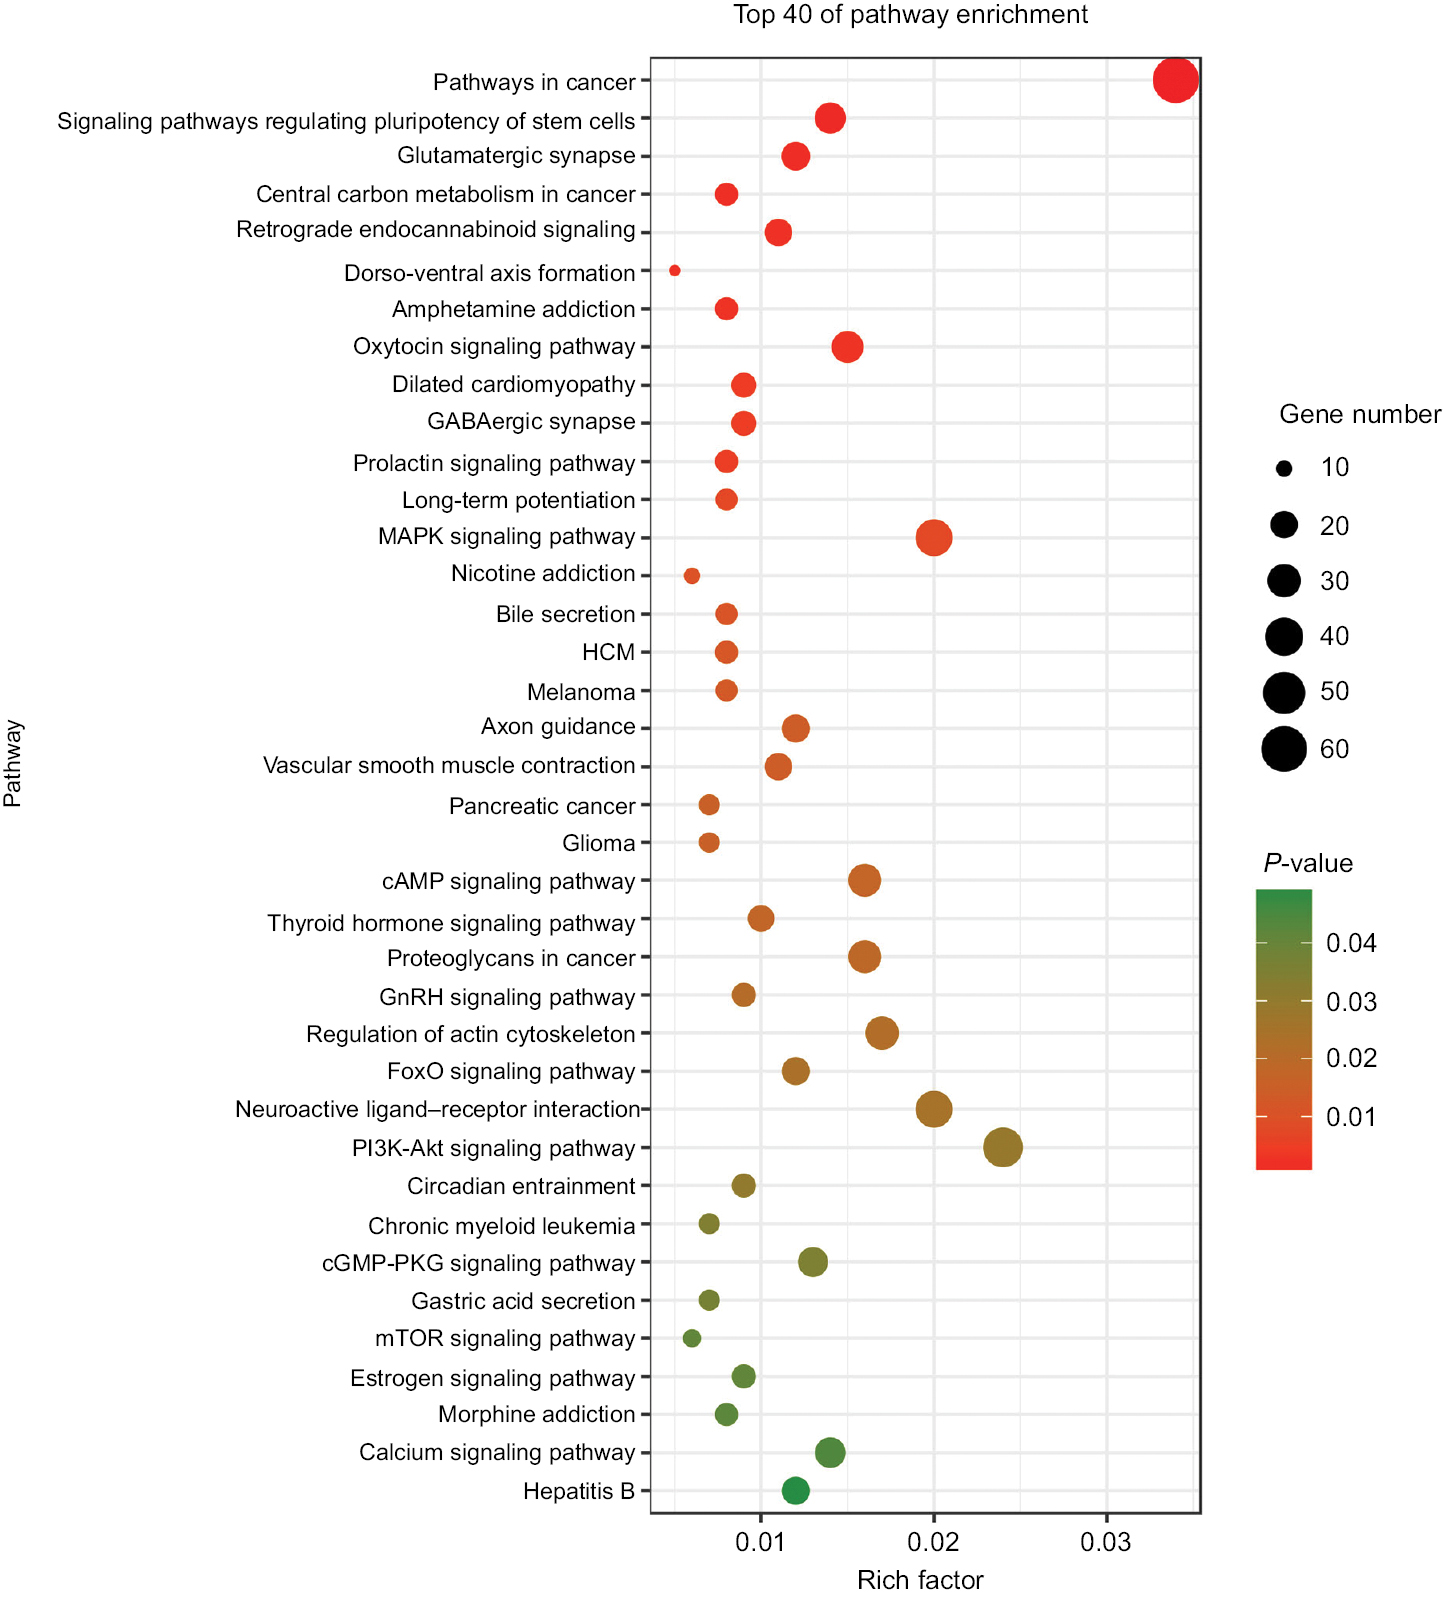 | Figure 6 KEGG pathways for the target genes of three miRNAs using DAVID. Abbreviations: HCM, hypertrophic cardiomyopathy; KEGG, Kyoto Encyclopedia of Genes and Genomes. |
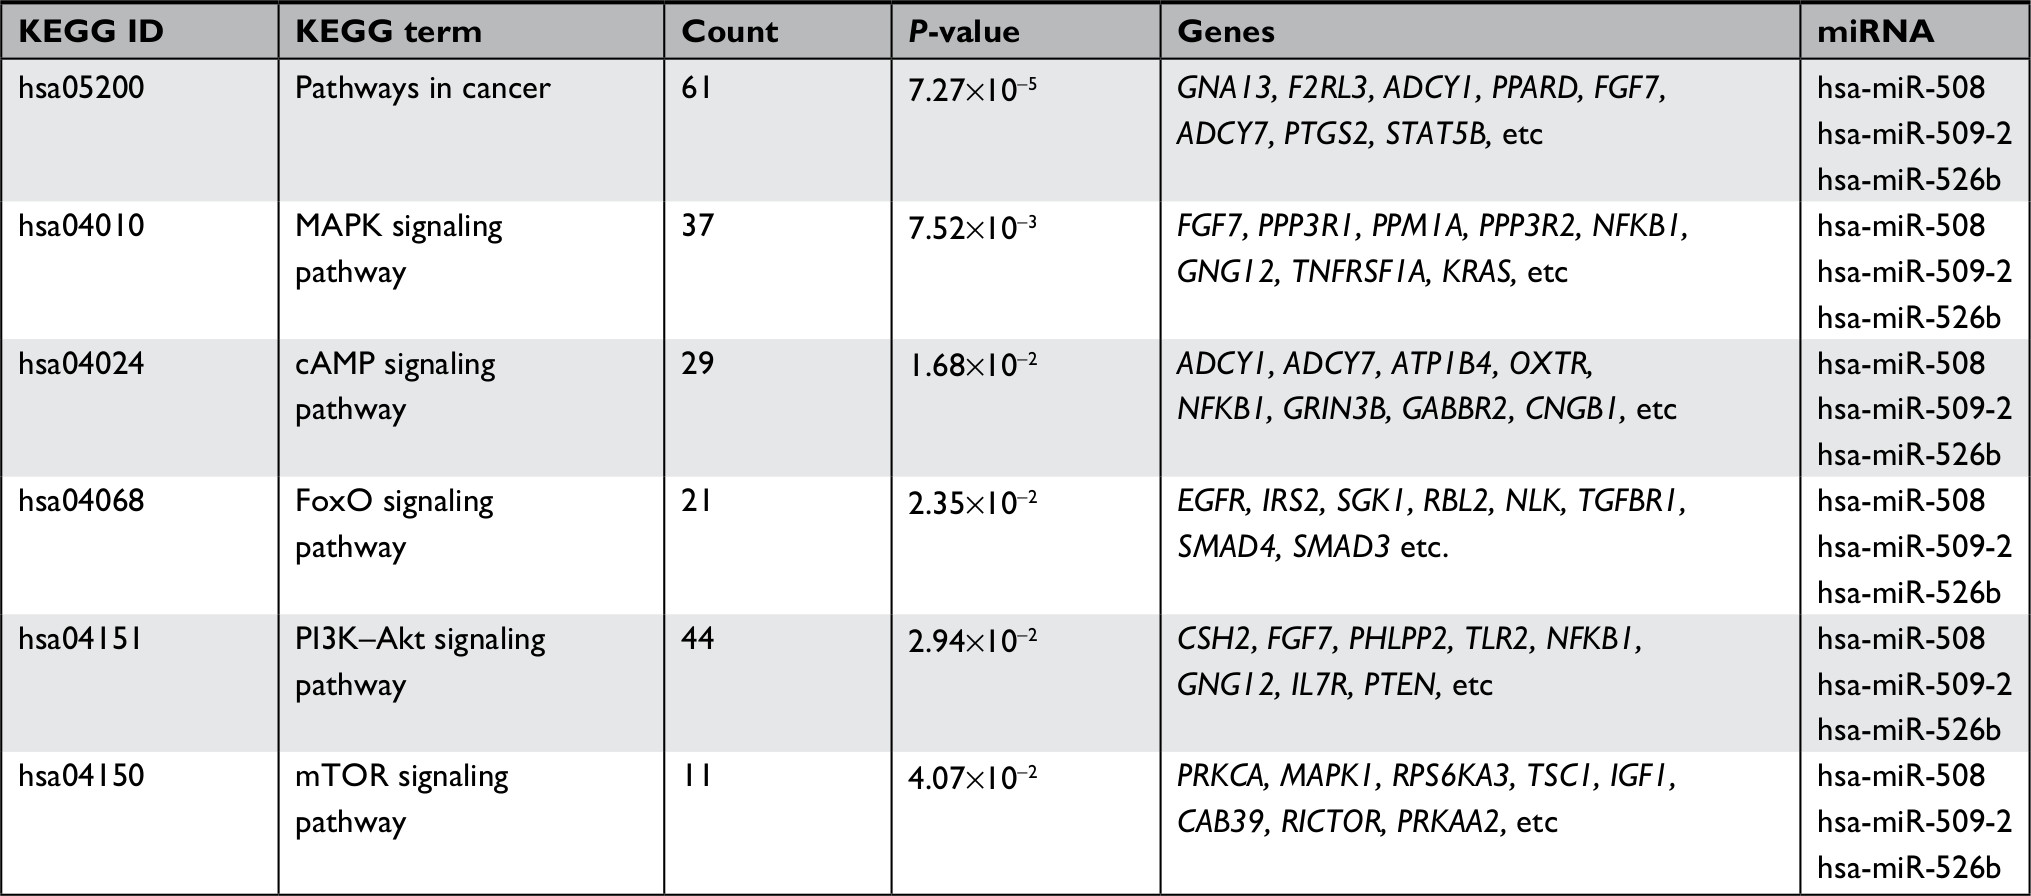 | Table 5 KEGG pathways enriched in target genes Abbreviation: KEGG, Kyoto Encyclopedia of Genes and Genomes. |
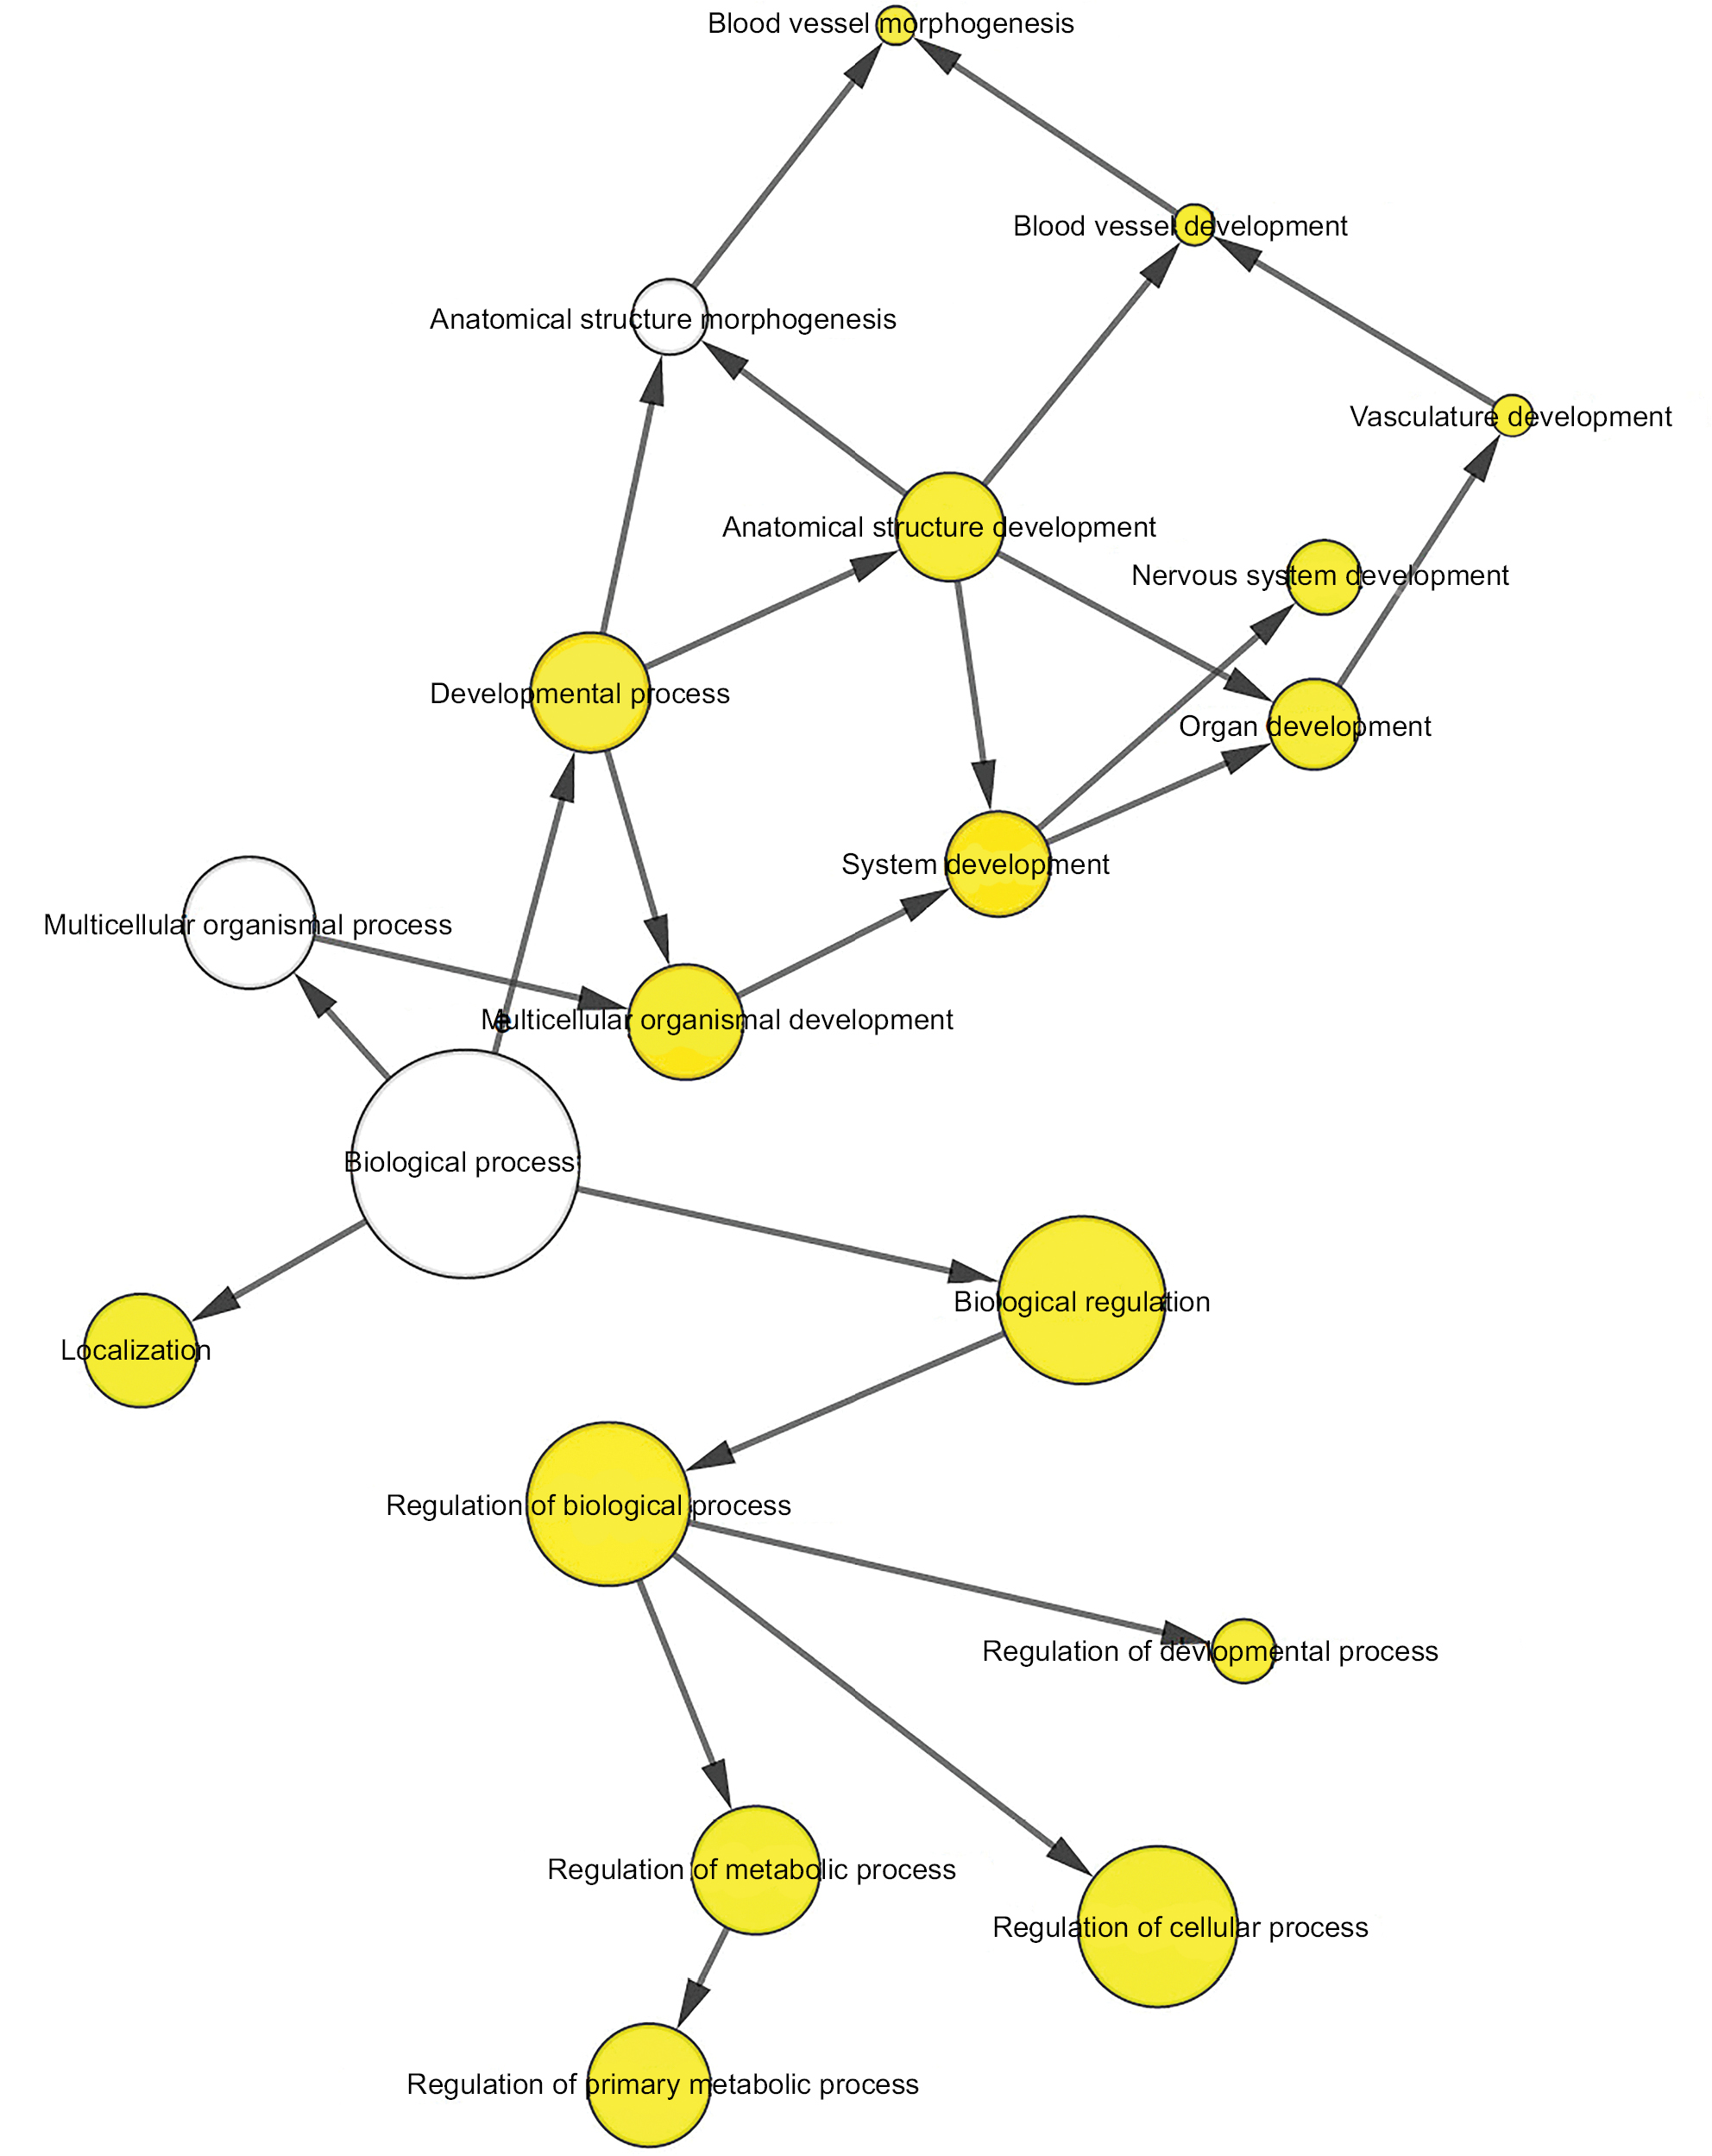 | Figure 7 The BP network showed as an interaction network using the Cytoscape plug-in BiNGO. Notes: Color depth represented the degree of enrichment of GO terms. The significance of enrichment is represented by yellow color (P<0.05). Abbreviations: BP, biological process; GO, gene ontology. |
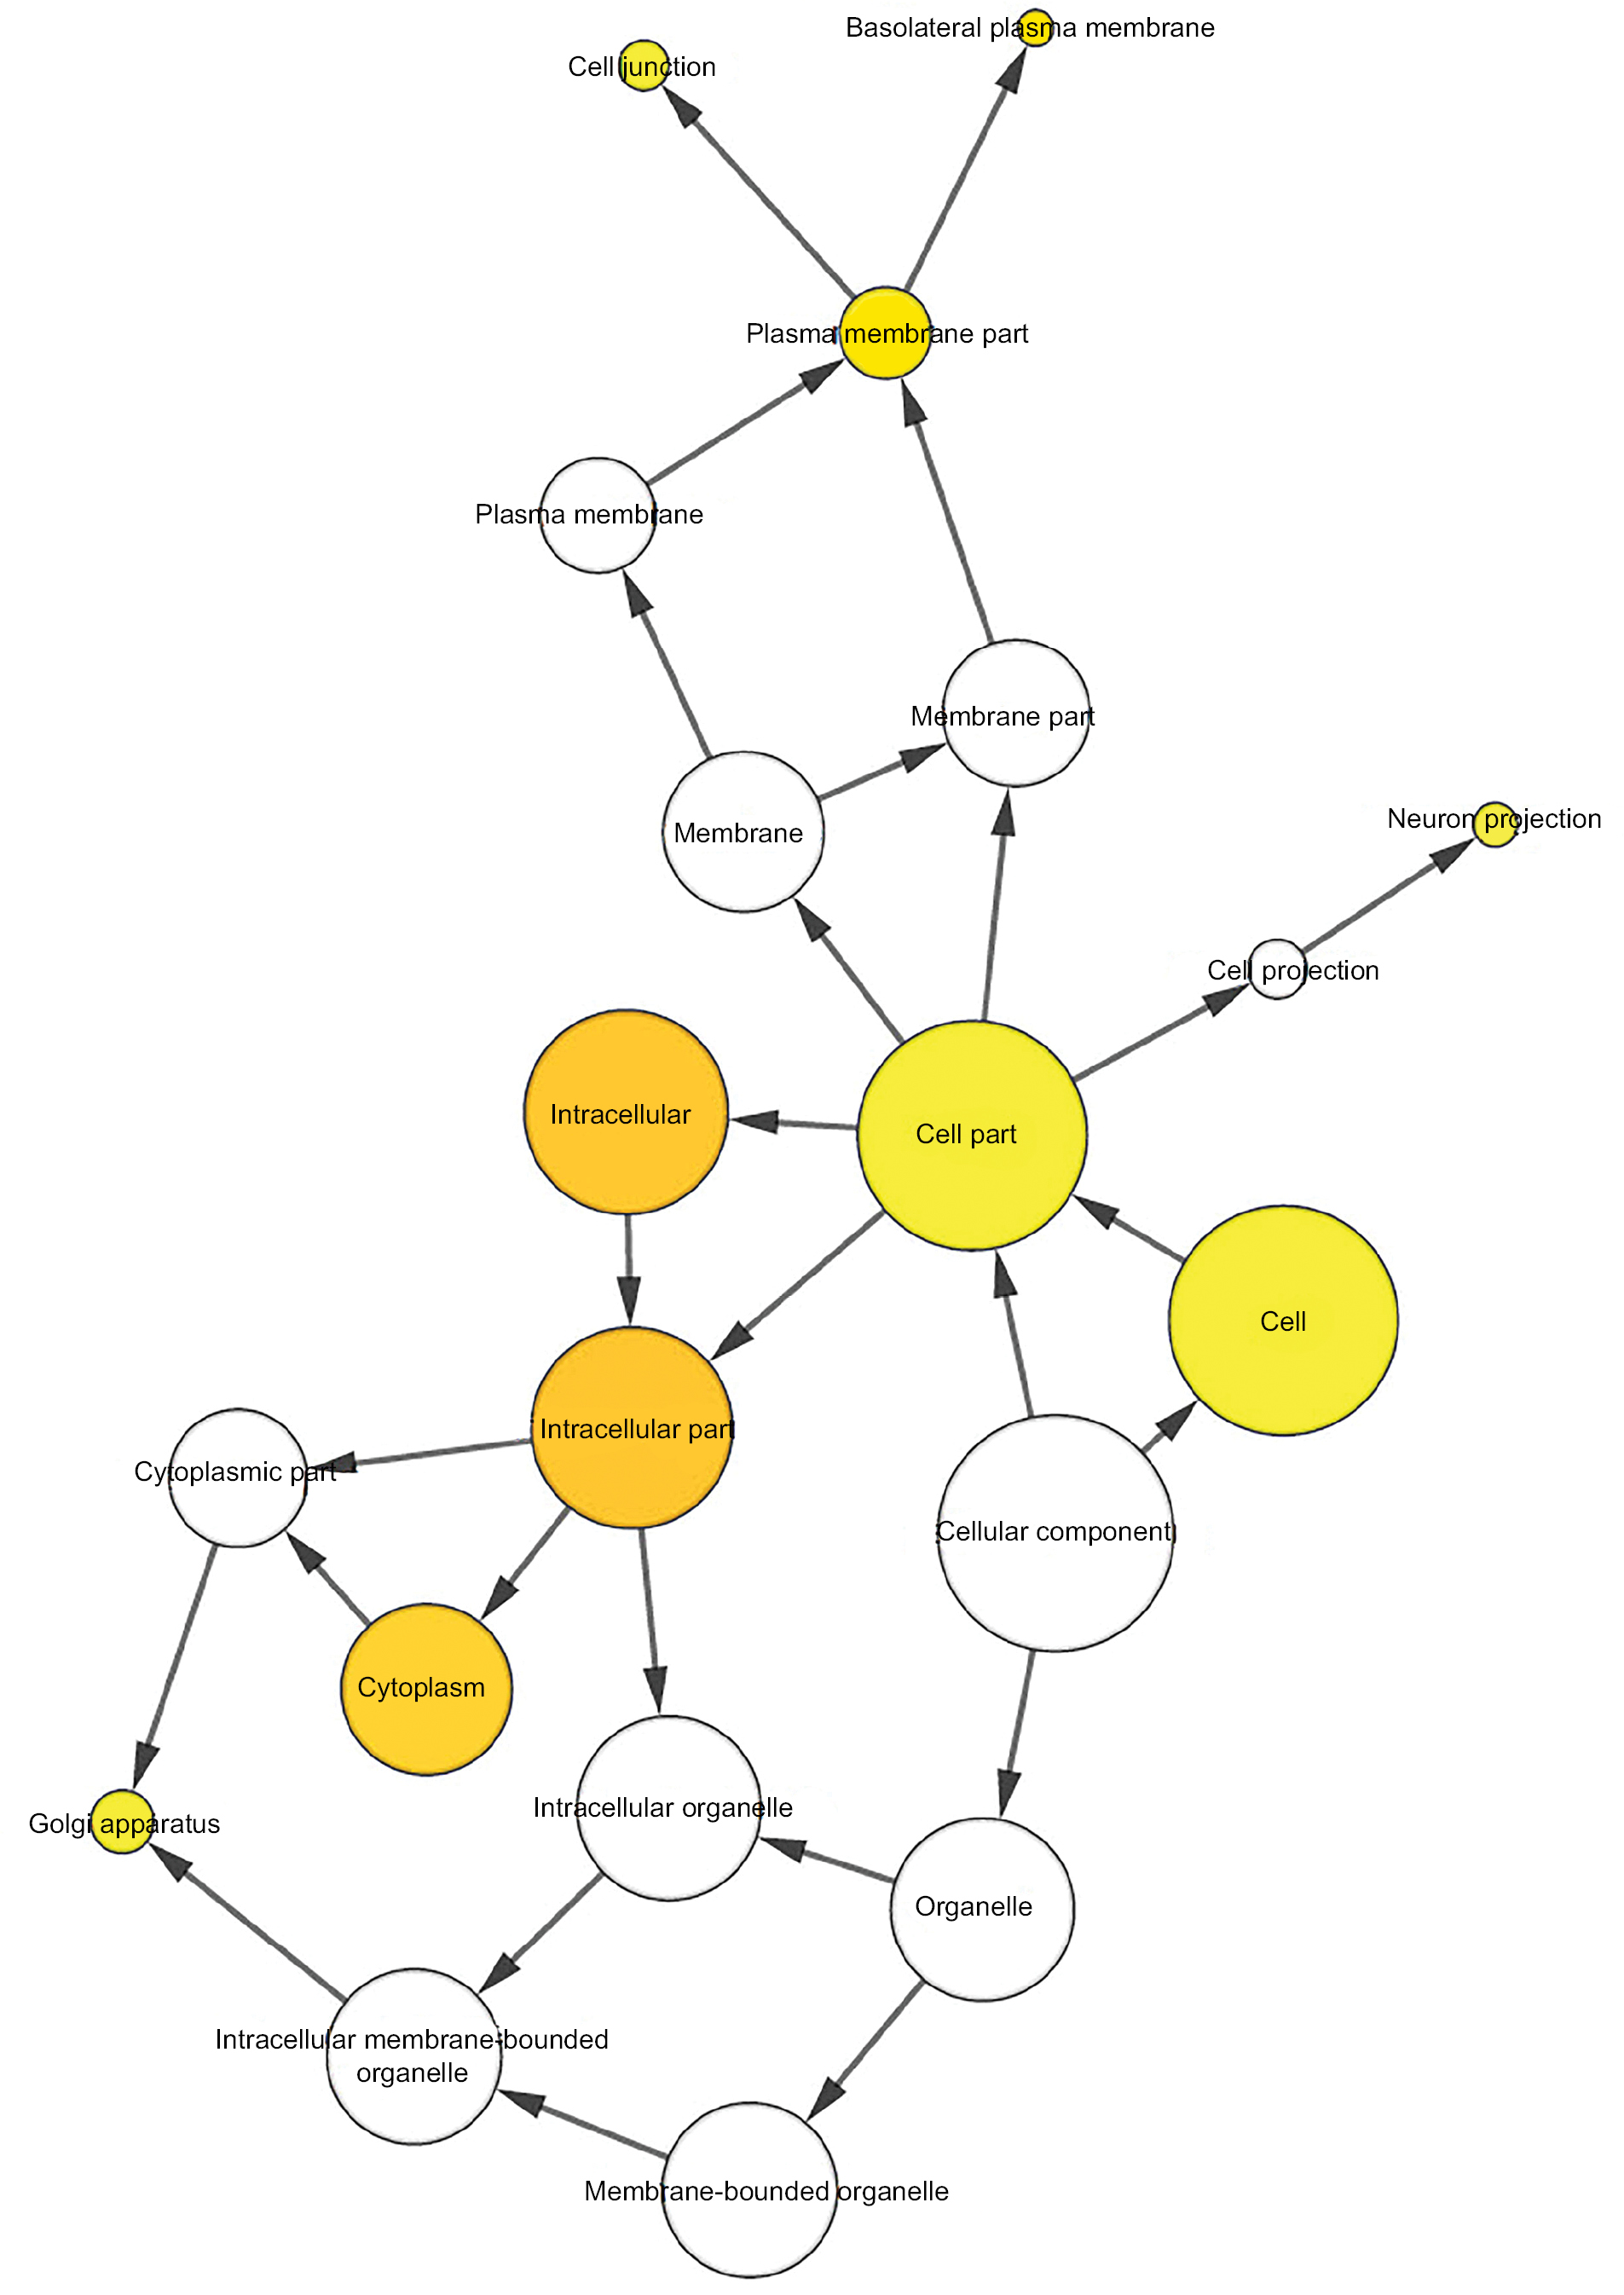 | Figure 8 The CC network showed as an interaction network using the Cytoscape plug-in BiNGO. Notes: Color depth represented the degree of enrichment of GO terms. The significance of enrichment is represented by yellow color (P<0.05). Abbreviations: CC, cellular component; GO, gene ontology. |
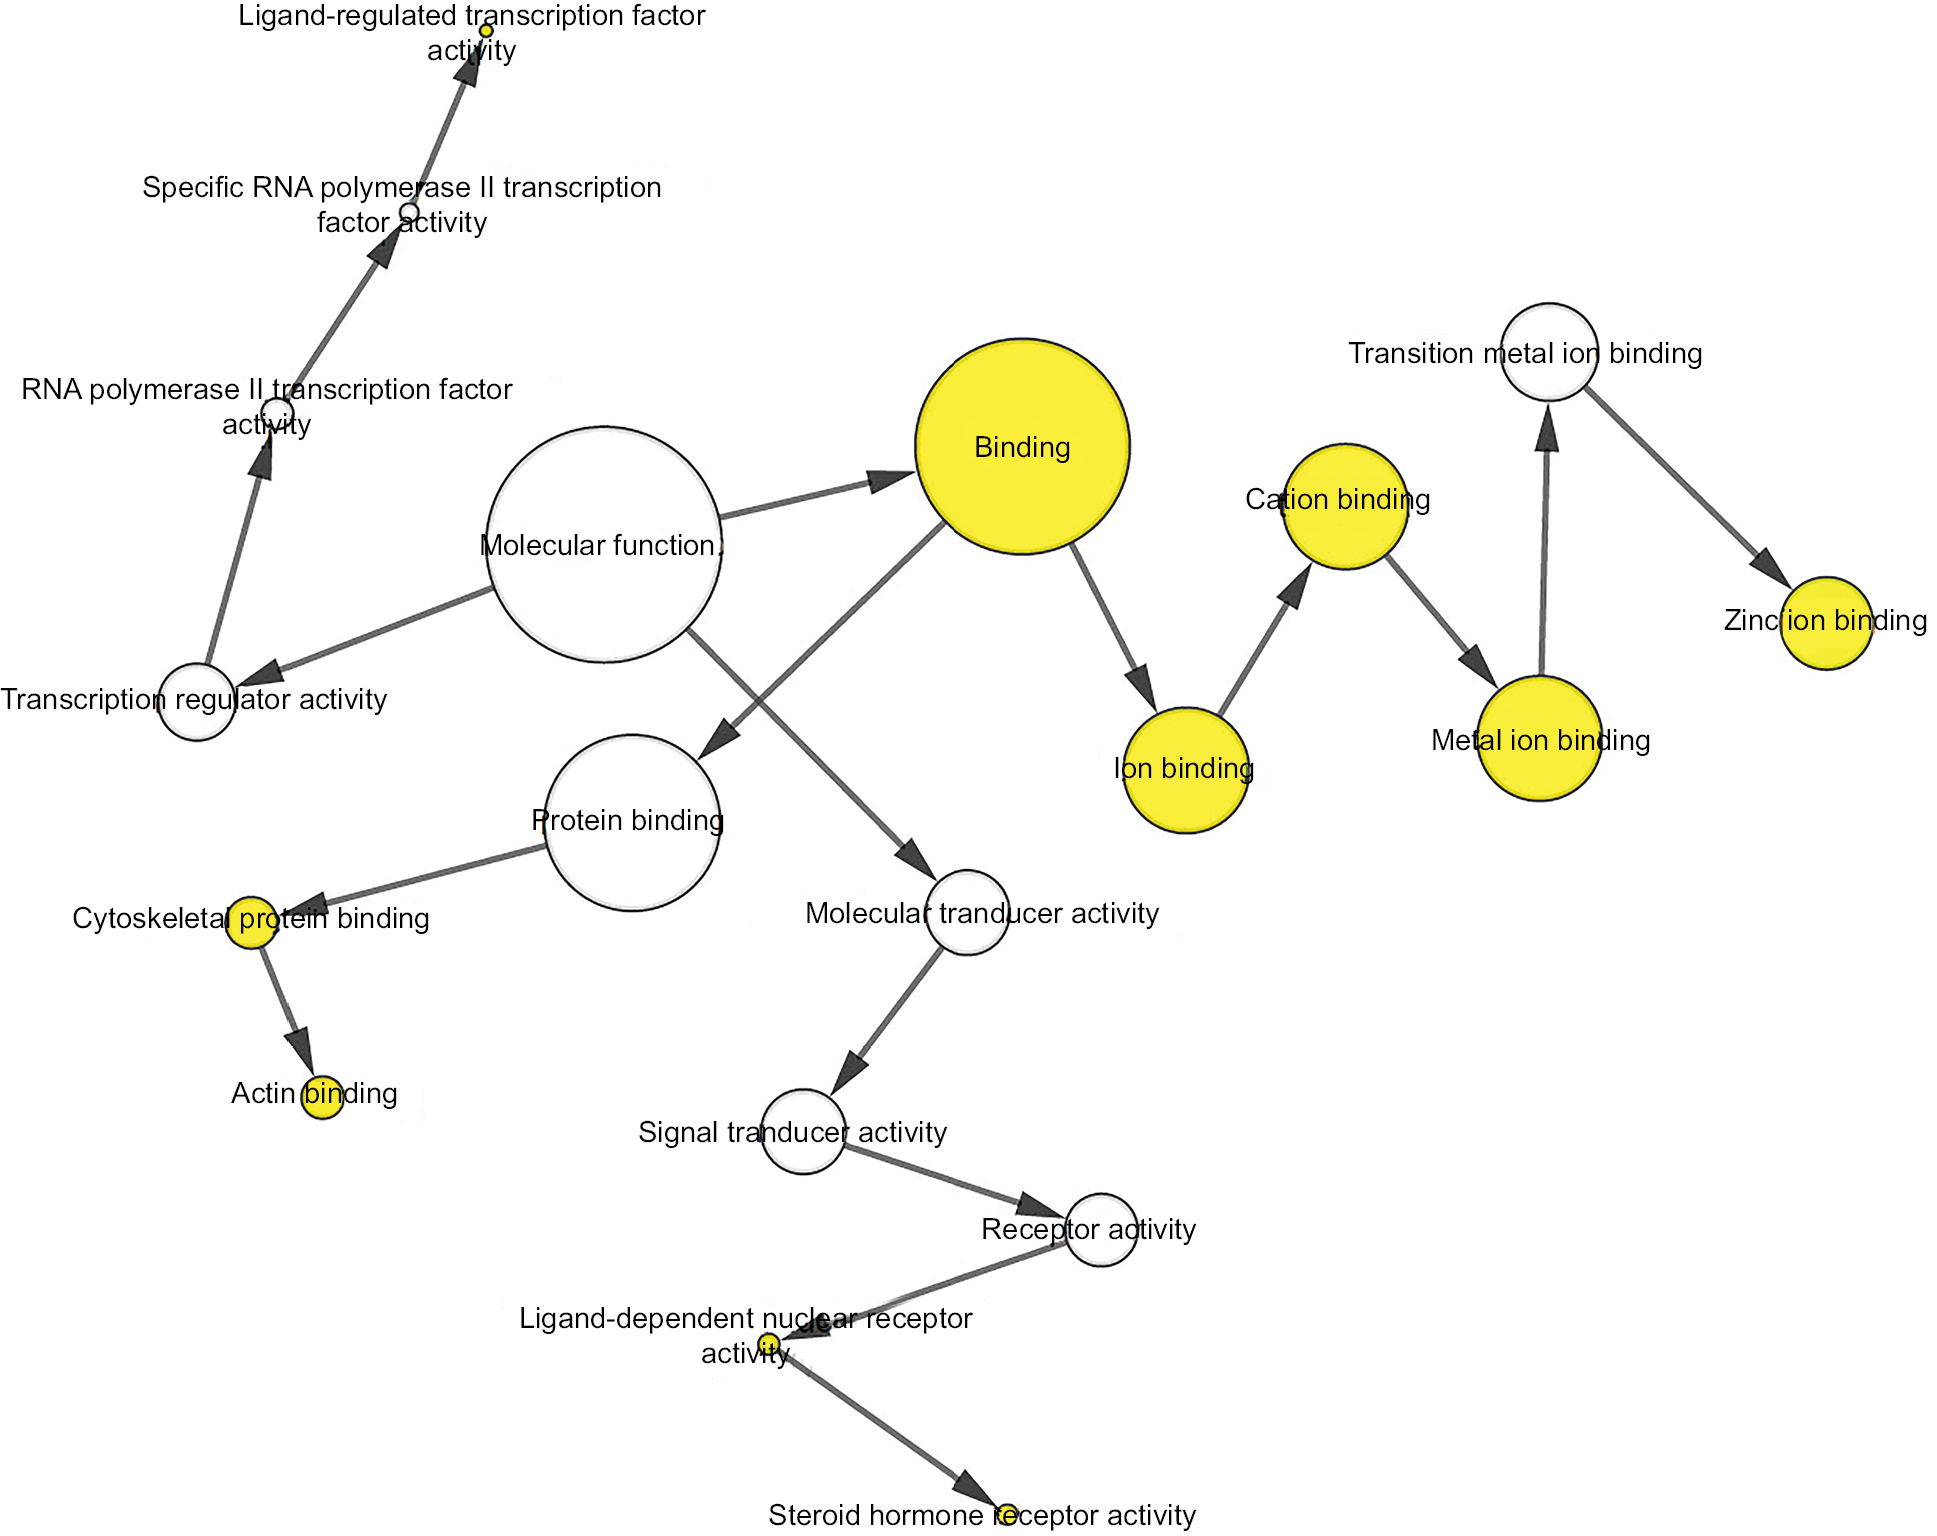 | Figure 9 The MF network showed as an interaction network using the Cytoscape plug-in BiNGO. Notes: Color depth represented the degree of enrichment of GO terms. The significance of enrichment is represented by yellow color (P<0.05). Abbreviations: GO, gene ontology; MF, molecular function. |
Selection of hub proteins
The PPI network of target genes was analyzed according to the STRING database, including 956 nodes and 3,448 edges. Then, we used the MCODE plug-in in Cytoscape software to build the core module, which consist of 29 nodes and 95 edges (MCODE score: 7.000). The highly connected node with the highest height is considered the hub protein of the network. A total of 29 proteins were selected as the most significant hub proteins, including TP53 (a target of hsa-miR-508, hsa-miR-509-2, and hsa-miR-526b), MMP1 (a target of hsa-miR-509-2 and hsa-miR-526b), NOTCH1 (a target of hsa-miR-509-2), SMAD4 (a target of hsa-miR-508 and hsa-miR-526b), and NFKB1 (a target of hsa-miR-508), which might be associated with LNM in early-stage CESC (Figure 10).
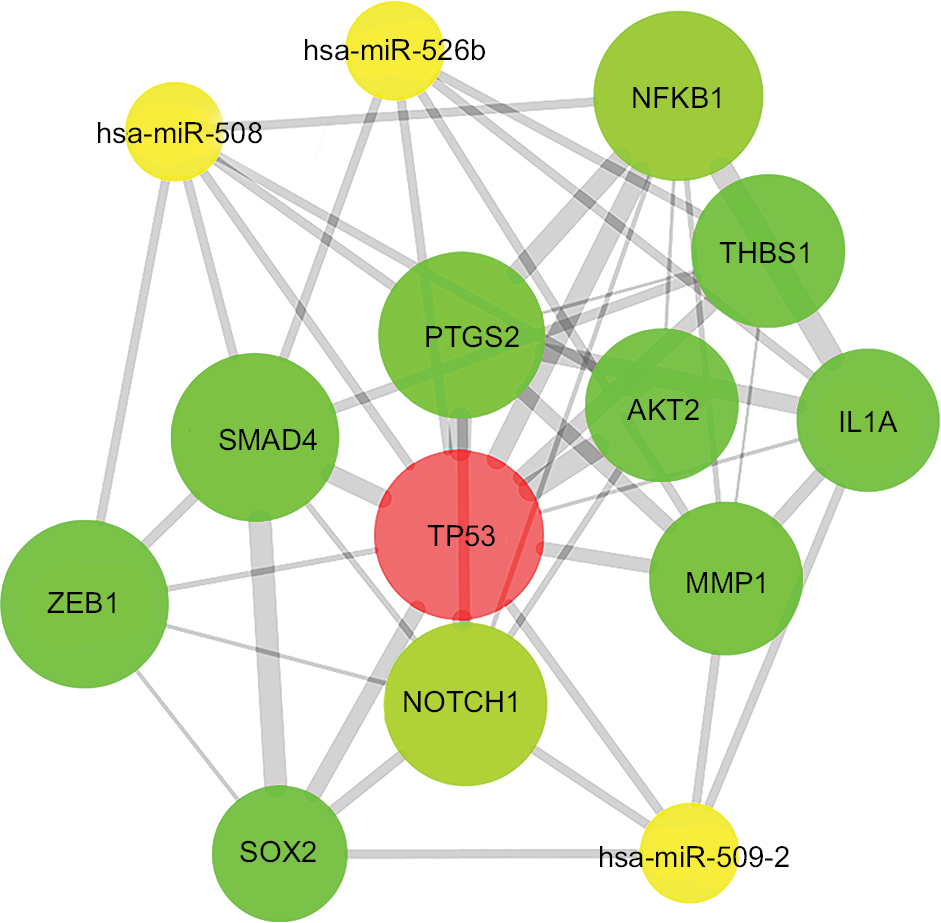 | Figure 10 PPI network of hub proteins. Notes: The MCODE was conducted to screen modules of the PPI network with a degree cutoff =2, node score cutoff =0.2, k-core =2, and maximum depth =100. Abbreviation: PPI, protein–protein interaction. |
Discussion
CESC is one of the major primary gynecological tumors that affect women’s health. In developing countries, the 5-year overall survival rate is only 46%, which is far lower than that of developed countries.2 LNM in the early stage affects the prognosis of CESC.6 Therefore, it is necessary to identify prognostic miRNAs and determine their molecular mechanisms. In this study, we found that hsa-miR-508, hsa-miR-509-2, and hsa-miR-526b were downregulated in LNM(+) patients and could effectively evaluate the prognosis of CESC. Moreover, we explained the potential mechanisms via GO and KEGG enrichment and PPI network analyses of target genes.
As far as we know, there is limited research on the role of these three miRNAs (hsa-miR-508, hsa-miR-509-2, and hsa-miR-526b) in CESC. We first demonstrated that three miRNAs were downregulated in early-stage CESC LNM(+) patients and influenced the prognosis of CESC through bioinformatics analysis. In a recent study, Liu et al reported that hsa-miR-508 is an independent, protective prognostic factor of glioma, and functional tests confirmed that overexpression of hsa-miR-508 inhibits the migration of glioma cells, which was similar to the results of our study.31 In gastric cancer, hsa-miR-508 inhibits the invasion of gastric cancer cells by targeting S-phase kinase-associated protein 2.32 Huang et al also found that hsa-miR-508 expression is downregulated in gastric carcinogenesis cell lines and plays a major role as a tumor suppressor gene in gastric cancer.33 Moreover, miRNA microarray profiling showed that hsa-miR-508 expression is downregulated in lymph node metastatic tissues.34 In addition, Zhai et al indicated that hsa-miR-508 inhibits renal cell cancer cell invasion and migration.35 hsa-miR-509 serves as a cancer suppressor gene in various cancers, such as lung cancer, breast cancer, renal cell cancer, and pancreatic cancer.36–40 hsa-miR-509 can inhibit tumor cell invasion and migration through target genes. Using bioinformatics analysis, hsa-miR-509 was found to be downregulated in breast cancer and brain metastasis compared to primary cancer and was shown to play a role in suppressing brain metastasis by regulating the RhoC-TNF-α network in both in vivo and in vitro experiments.41 Additionally, low expression levels of hsa-miR-509 were associated with poor outcomes in pancreatic cancer patients.39 hsa-miR-526b can inhibit tumor progression by targeting MMP1.42 Meanwhile, Zhang et al found that hsa-miR-526b is downregulated in lung cancer, and low expression was associated with poor clinical outcomes through the p53/p21 pathway.43 In colon cancer, hsa-miR-526b was reported to be downregulated in metastatic tissue and to inhibit cell proliferation and invasion by regulating the hub gene HIF-1α.44 Liu et al observed that low hsa-miR-526b expression correlates with poor prognosis in hepatocellular carcinoma and enhanced lung metastasis in mouse lungs via the ERK pathway.45
To investigate the mechanism of LNM in early-stage CESC, we conducted KEGG pathway and GO annotation enrichment analyses and PPI network analyses on three miRNA target genes. Pathway enrichment analysis showed that the target genes were mainly enriched in pathways in cancer, such as MAPK, cAMP, PI3K/Akt, and mTOR pathways. The MAPK pathway has been reported to play a role in the tumor progression of CESC.13,46,47 Zhang et al found that the MAPK pathway was associated with LNM in head and neck cancer.48 Research has shown that the Akt/mTOR pathway is activated in medullary thyroid carcinoma with lymph node metastases.49 In the coexpression regulatory network of target genes, multiple studies have shown that a TP53 gene mutation increases the risk of CESC.50–52 MMP1 has been associated with LNM in esophageal squamous cell cancer,53 lung cancer,54 and gastric cancer.55 Liu et al reported that MMP1 promotes esophageal squamous cell carcinoma cell migration and invasion via the PI3K/Akt pathway.53 In CESC, NOTCH1 has been associated with LNM, and high expression of NOTCH1 indicates a poor prognosis in patients.56 At the same time, Park et al found that NOTCH1 could be a molecular marker of LNM in papillary thyroid cancer.57 In pancreatic and colorectal cancer, SMAD4 was found to be associated with LNM and survival.58,59 Another gene in the network, NFKB1, was reported to increase the risk of LNM in gastric cancer and oral cancer.60,61 These results suggest that the target genes of these three miRNAs play a significant role in LNM in early-stage CESC.
However, there are some deficiencies in our research at present. Although the three miRNAs were downregulated in LNM(+) patients according to the bioinformatics analyses, the original samples need additional validation. Functional tests need to be conducted, and the mechanism of LNM in early-stage CESC needs further study. Our group is currently pursuing some of these research goals.
Conclusion
Using bioinformatics analysis, we have shown for the first time that three miRNAs were downregulated in early-stage CESC LNM(+) patients and are potential prognostic indicators for CESC. In addition, five central genes (TP53, MMP1, NOTCH1, SMAD4, and NFKB1) were found to be directly or indirectly involved in LNM in early-stage CESC. Taken together, the results of the present study suggest that hsa-miR-508, hsa-miR-509-2, and hsa-miR-526b may be potential new diagnostic and prognostic markers for CESC in the future.
Acknowledgments
The work was financially supported by grant from the National Natural Science Foundation of China (grant no. 81360440 and 81660563). The work was done at Department of Research, Affiliated Tumor Hospital of Guangxi Medical University.
Disclosure
The authors report no conflicts of interest in this work.
References
Siegel RL, Miller KD, Jemal A. Cancer statistics, 2017. CA Cancer J Clin. 2017;67(1):7–30. | ||
Torre LA, Islami F, Siegel RL, Ward EM, Jemal A. Global cancer in women: burden and trends. Cancer Epidemiol Biomarkers Prev. 2017;26(4):444–457. | ||
Xu Z, Zhou Y, Shi F, et al. Investigation of differentially-expressed microRNAs and genes in cervical cancer using an integrated bioinformatics analysis. Oncol Lett. 2017;13(4):2784–2790. | ||
Poudyal D, Herman A, Adelsberger JW, et al. A novel microRNA, hsa-miR-6852 differentially regulated by interleukin-27 induces necrosis in cervical cancer cells by downregulating the FoxM1 expression. Sci Rep. 2018;8(1):900. | ||
Gao C, Zhou C, Zhuang J, et al. MicroRNA expression in cervical cancer: novel diagnostic and prognostic biomarkers. J Cell Biochem. 2018;119(8):7080–7090. | ||
Nanthamongkolkul K, Hanprasertpong J. Predictive factors of pelvic lymph node metastasis in early-stage cervical cancer. Oncol Res Treat. 2018;41(4):194–198. | ||
Taarnhøj GA, Christensen IJ, Lajer H, et al. Risk of recurrence, prognosis, and follow-up for Danish women with cervical cancer in 2005–2013: a national cohort study. Cancer. 2018;124(5):943–951. | ||
Zhou J, Zhang WW, Wu SG, et al. The impact of examined lymph node count on survival in squamous cell carcinoma and adenocarcinoma of the uterine cervix. Cancer Manag Res. 2017;9:315–322. | ||
Fleming ND, Frumovitz M, Schmeler KM, et al. Significance of lymph node ratio in defining risk category in node-positive early stage cervical cancer. Gynecol Oncol. 2015;136(1):48–53. | ||
Ha M, Kim VN. Regulation of microRNA biogenesis. Nat Rev Mol Cell Biol. 2014;15(8):509–524. | ||
Lewis BP, Burge CB, Bartel DP. Conserved seed pairing, often flanked by adenosines, indicates that thousands of human genes are microRNA targets. Cell. 2005;120(1):15–20. | ||
He L, Hannon GJ. MicroRNAs: small RNAs with a big role in gene regulation. Nat Rev Genet. 2004;5(7):522–531. | ||
Li ZH, Li L, Kang LP, Wang Y. MicroRNA-92a promotes tumor growth and suppresses immune function through activation of MAPK/ERK signaling pathway by inhibiting PTEN in mice bearing U14 cervical cancer. Cancer Med. 2018;7(7): 3118–3131. | ||
Wang F, Shan S, Huo Y, et al. MiR-155-5p inhibits PDK1 and promotes autophagy via the mTOR pathway in cervical cancer. Int J Biochem Cell Biol. 2018;99:91–99. | ||
Li GC, Cao XY, Li YN, et al. MicroRNA-374b inhibits cervical cancer cell proliferation and induces apoptosis through the p38/ERK signaling pathway by binding to JAM-2. J Cell Physiol. 2018;233(9):7379–7390. | ||
Dong J, Wang Q, Li L, Xiao-Jin Z. Upregulation of long non-coding RNA small nucleolar RNA host gene 12 contributes to cell growth and invasion in cervical cancer by acting as a sponge for MiR-424-5p. Cell Physiol Biochem. 2018;45(5):2086–2094. | ||
Geretto M, Pulliero A, Rosano C, Zhabayeva D, Bersimbaev R, Izzotti A. Resistance to cancer chemotherapeutic drugs is determined by pivotal microRNA regulators. Am J Cancer Res. 2017;7(6):1350–1371. | ||
Wang WT, Zhao YN, Yan JX, et al. Differentially expressed microRNAs in the serum of cervical squamous cell carcinoma patients before and after surgery. J Hematol Oncol. 2014;7:6. | ||
Yu J, Wang Y, Dong R, Huang X, Ding S, Qiu H. Circulating microRNA-218 was reduced in cervical cancer and correlated with tumor invasion. J Cancer Res Clin Oncol. 2012;138(4):671–674. | ||
Guelfi G, Cochetti G, Stefanetti V, et al. Next generation sequencing of urine exfoliated cells: an approach of prostate cancer microRNAs research. Sci Rep. 2018;8(1):7111. | ||
Bezrookove V, Nosrati M, Miller JR, et al. Role of elevated PHIP copy number as a prognostic and progression marker for cutaneous melanoma. Clin Cancer Res. 2018;24(17):4119–4125. | ||
Zill OA, Banks KC, Fairclough SR, et al. The landscape of actionable genomic alterations in cell-free circulating tumor DNA from 21,807 advanced cancer patients. Clin Cancer Res. 2018;24(15):3528–3538. | ||
Liu M, Zhang L, Li H, et al. Integrative epigenetic analysis reveals therapeutic targets to the DNA methyltransferase inhibitor guadecitabine (SGI-110) in hepatocellular carcinoma. Hepatology. 2018;68(4):1412–1428. | ||
Robinson MD, Mccarthy DJ, Smyth GK. edgeR: a bioconductor package for differential expression analysis of digital gene expression data. Bioinformatics. 2010;26(1):139–140. | ||
Dweep H, Gretz N. miRWalk2.0: a comprehensive atlas of microRNA–target interactions. Nat Methods. 2015;12(8):697. | ||
Huang Daw, Sherman BT, Lempicki RA. Systematic and integrative analysis of large gene lists using DAVID bioinformatics resources. Nat Protoc. 2009;4(1):44–57. | ||
Maere S, Heymans K, Kuiper M. BiNGO: a Cytoscape plugin to assess overrepresentation of gene ontology categories in biological networks. Bioinformatics. 2005;21(16):3448–3449. | ||
Szklarczyk D, Morris JH, Cook H, et al. The STRING database in 2017: quality-controlled protein-protein association networks, made broadly accessible. Nucleic Acids Res. 2017;45(D1):D362–D368. | ||
Bader GD, Hogue CW. An automated method for finding molecular complexes in large protein interaction networks. BMC Bioinformatics. 2003;4:2. | ||
Shannon P, Markiel A, Ozier O, et al. Cytoscape: a software environment for integrated models of biomolecular interaction networks. Genome Res. 2003;13(11):2498–2504. | ||
Liu YH, Li B, Meng FG, Qiu L. MiR-508-5p is a prognostic marker and inhibits cell proliferation and migration in glioma. Eur Rev Med Pharmacol Sci. 2017;21(1):76–81. | ||
Duan X, Bai J, Wei J, Li Z, Liu X, Xu G. MicroRNA-508-5p suppresses metastasis in human gastric cancer by targeting S-phase kinase-associated protein 2. Mol Med Rep. 2017;16(2):2163–2171. | ||
Huang T, Kang W, Zhang B, et al. miR-508-3p concordantly silences NFKB1 and RELA to inactivate canonical NF-κB signaling in gastric carcinogenesis. Mol Cancer. 2016;15:9. | ||
Wang Z, Wang J, Yang Y, et al. Loss of has-miR-337-3p expression is associated with lymph node metastasis of human gastric cancer. J Exp Clin Cancer Res. 2013;32:76. | ||
Zhai Q, Zhou L, Zhao C, et al. Identification of miR-508-3p and miR-509-3p that are associated with cell invasion and migration and involved in the apoptosis of renal cell carcinoma. Biochem Biophys Res Commun. 2012;419(4):621–626. | ||
Wang P, Deng Y, Fu X. MiR-509-5p suppresses the proliferation, migration, and invasion of non-small cell lung cancer by targeting YWHAG. Biochem Biophys Res Commun. 2017;482(4):935–941. | ||
Zhang G, Liu Z, Han Y, Wang X, Yang Z. Overexpression of miR-509 increases apoptosis and inhibits invasion via suppression of tumor necrosis factor-α in triple-negative breast cancer Hs578T cells. Oncol Res. 2016;24(4):233–238. | ||
Zhang WB, Pan ZQ, Yang QS, Zheng XM. Tumor suppressive miR-509-5p contributes to cell migration, proliferation and antiapoptosis in renal cell carcinoma. Ir J Med Sci. 2013;182(4):621–627. | ||
Hiramoto H, Muramatsu T, Ichikawa D, et al. miR-509-5p and miR-1243 increase the sensitivity to gemcitabine by inhibiting epithelial-mesenchymal transition in pancreatic cancer. Sci Rep. 2017;7(1):4002. | ||
Song YH, Wang J, Nie G, et al. MicroRNA-509-5p functions as an anti-oncogene in breast cancer via targeting SOD2. Eur Rev Med Pharmacol Sci. 2017;21(16):3617–3625. | ||
Xing F, Sharma S, Liu Y, et al. miR-509 suppresses brain metastasis of breast cancer cells by modulating RhoC and TNF-α. Oncogene. 2015;34(37):4890–4900. | ||
Kim KH, Jung JY, Son ED, Shin DW, Noh M, Lee TR. miR-526b targets 3’ UTR of MMP1 mRNA. Exp Mol Med. 2015;47:e178. | ||
Zhang ZY, Fu SL, Xu SQ, et al. By downregulating Ku80, hsa-miR-526b suppresses non-small cell lung cancer. Oncotarget. 2015;6(3):1462–1477. | ||
Zhang R, Zhao J, Xu J, Wang J, Jia J. miR-526b-3p functions as a tumor suppressor in colon cancer by regulating HIF-1α. Am J Transl Res. 2016;8(6):2783–2789. | ||
Liu X, Yang L, Tu J, et al. MicroRNA-526b servers as a prognostic factor and exhibits tumor suppressive property by targeting Sirtuin 7 in hepatocellular carcinoma. Oncotarget. 2017;8(50):87737–87749. | ||
Hua FF, Liu SS, Zhu LH, et al. MiRNA-338-3p regulates cervical cancer cells proliferation by targeting MACC1 through MAPK signaling pathway. Eur Rev Med Pharmacol Sci. 2017;21(23):5342–5352. | ||
Tao L, Zhang CY, Guo L. MicroRNA-497 accelerates apoptosis while inhibiting proliferation, migration, and invasion through negative regulation of the MAPK/ERK signaling pathway via RAF-1. J Cell Physiol. 2017. | ||
Zhang X, Hunt JL, Landsittel DP, et al. Correlation of protease-activated receptor-1 with differentiation markers in squamous cell carcinoma of the head and neck and its implication in lymph node metastasis. Clin Cancer Res. 2004;10(24):8451–8459. | ||
Tamburrino A, Molinolo AA, Salerno P, et al. Activation of the mTOR pathway in primary medullary thyroid carcinoma and lymph node metastases. Clin Cancer Res. 2012;18(13):3532–3540. | ||
Klug SJ, Ressing M, Koenig J, et al. TP53 codon 72 polymorphism and cervical cancer: a pooled analysis of individual data from 49 studies. Lancet Oncol. 2009;10(8):772–784. | ||
Ojesina AI, Lichtenstein L, Freeman SS, et al. Landscape of genomic alterations in cervical carcinomas. Nature. 2014;506(7488):371–375. | ||
Tornesello ML, Buonaguro L, Buonaguro FM. Mutations of the TP53 gene in adenocarcinoma and squamous cell carcinoma of the cervix: a systematic review. Gynecol Oncol. 2013;128(3):442–448. | ||
Liu M, Hu Y, Zhang MF, et al. MMP1 promotes tumor growth and metastasis in esophageal squamous cell carcinoma. Cancer Lett. 2016;377(1):97–104. | ||
Fang S, Jin X, Wang R, et al. Polymorphisms in the MMP1 and MMP3 promoter and non-small cell lung carcinoma in North China. Carcinogenesis. 2005;26(2):481–486. | ||
Kamata I, Ishikawa Y, Akishima-Fukasawa Y, et al. Significance of lymphatic invasion and cancer invasion-related proteins on lymph node metastasis in gastric cancer. J Gastroenterol Hepatol. 2009;24(9):1527–1533. | ||
Yousif NG, Sadiq AM, Yousif MG, Al-Mudhafar RH, Al-Baghdadi JJ, Hadi N. Notch1 ligand signaling pathway activated in cervical cancer: poor prognosis with high-level JAG1/Notch1. Arch Gynecol Obstet. 2015;292(4):899–904. | ||
Park HS, Jung CK, Lee SH, et al. Notch1 receptor as a marker of lymph node metastases in papillary thyroid cancer. Cancer Sci. 2012;103(2):305–309. | ||
Jiang H, He C, Geng S, et al. RhoT1 and Smad4 are correlated with lymph node metastasis and overall survival in pancreatic cancer. PLoS One. 2012;7(7):e42234. | ||
Tanaka T, Watanabe T, Kazama Y, et al. Loss of Smad4 protein expression and 18qLOH as molecular markers indicating lymph node metastasis in colorectal cancer – a study matched for tumor depth and pathology. J Surg Oncol. 2008;97(1):69–73. | ||
Arisawa T, Tahara T, Shiroeda H, et al. Functional promoter polymorphisms of NFKB1 influence susceptibility to the diffuse type of gastric cancer. Oncol Rep. 2013;30(6):3013–3019. | ||
Lin SC, Liu CJ, Yeh WI, Lui MT, Chang KW, Chang CS. Functional polymorphism in NFKB1 promoter is related to the risks of oral squamous cell carcinoma occurring on older male areca (betel) chewers. Cancer Lett. 2006;243(1):47–54. |
Supplementary material
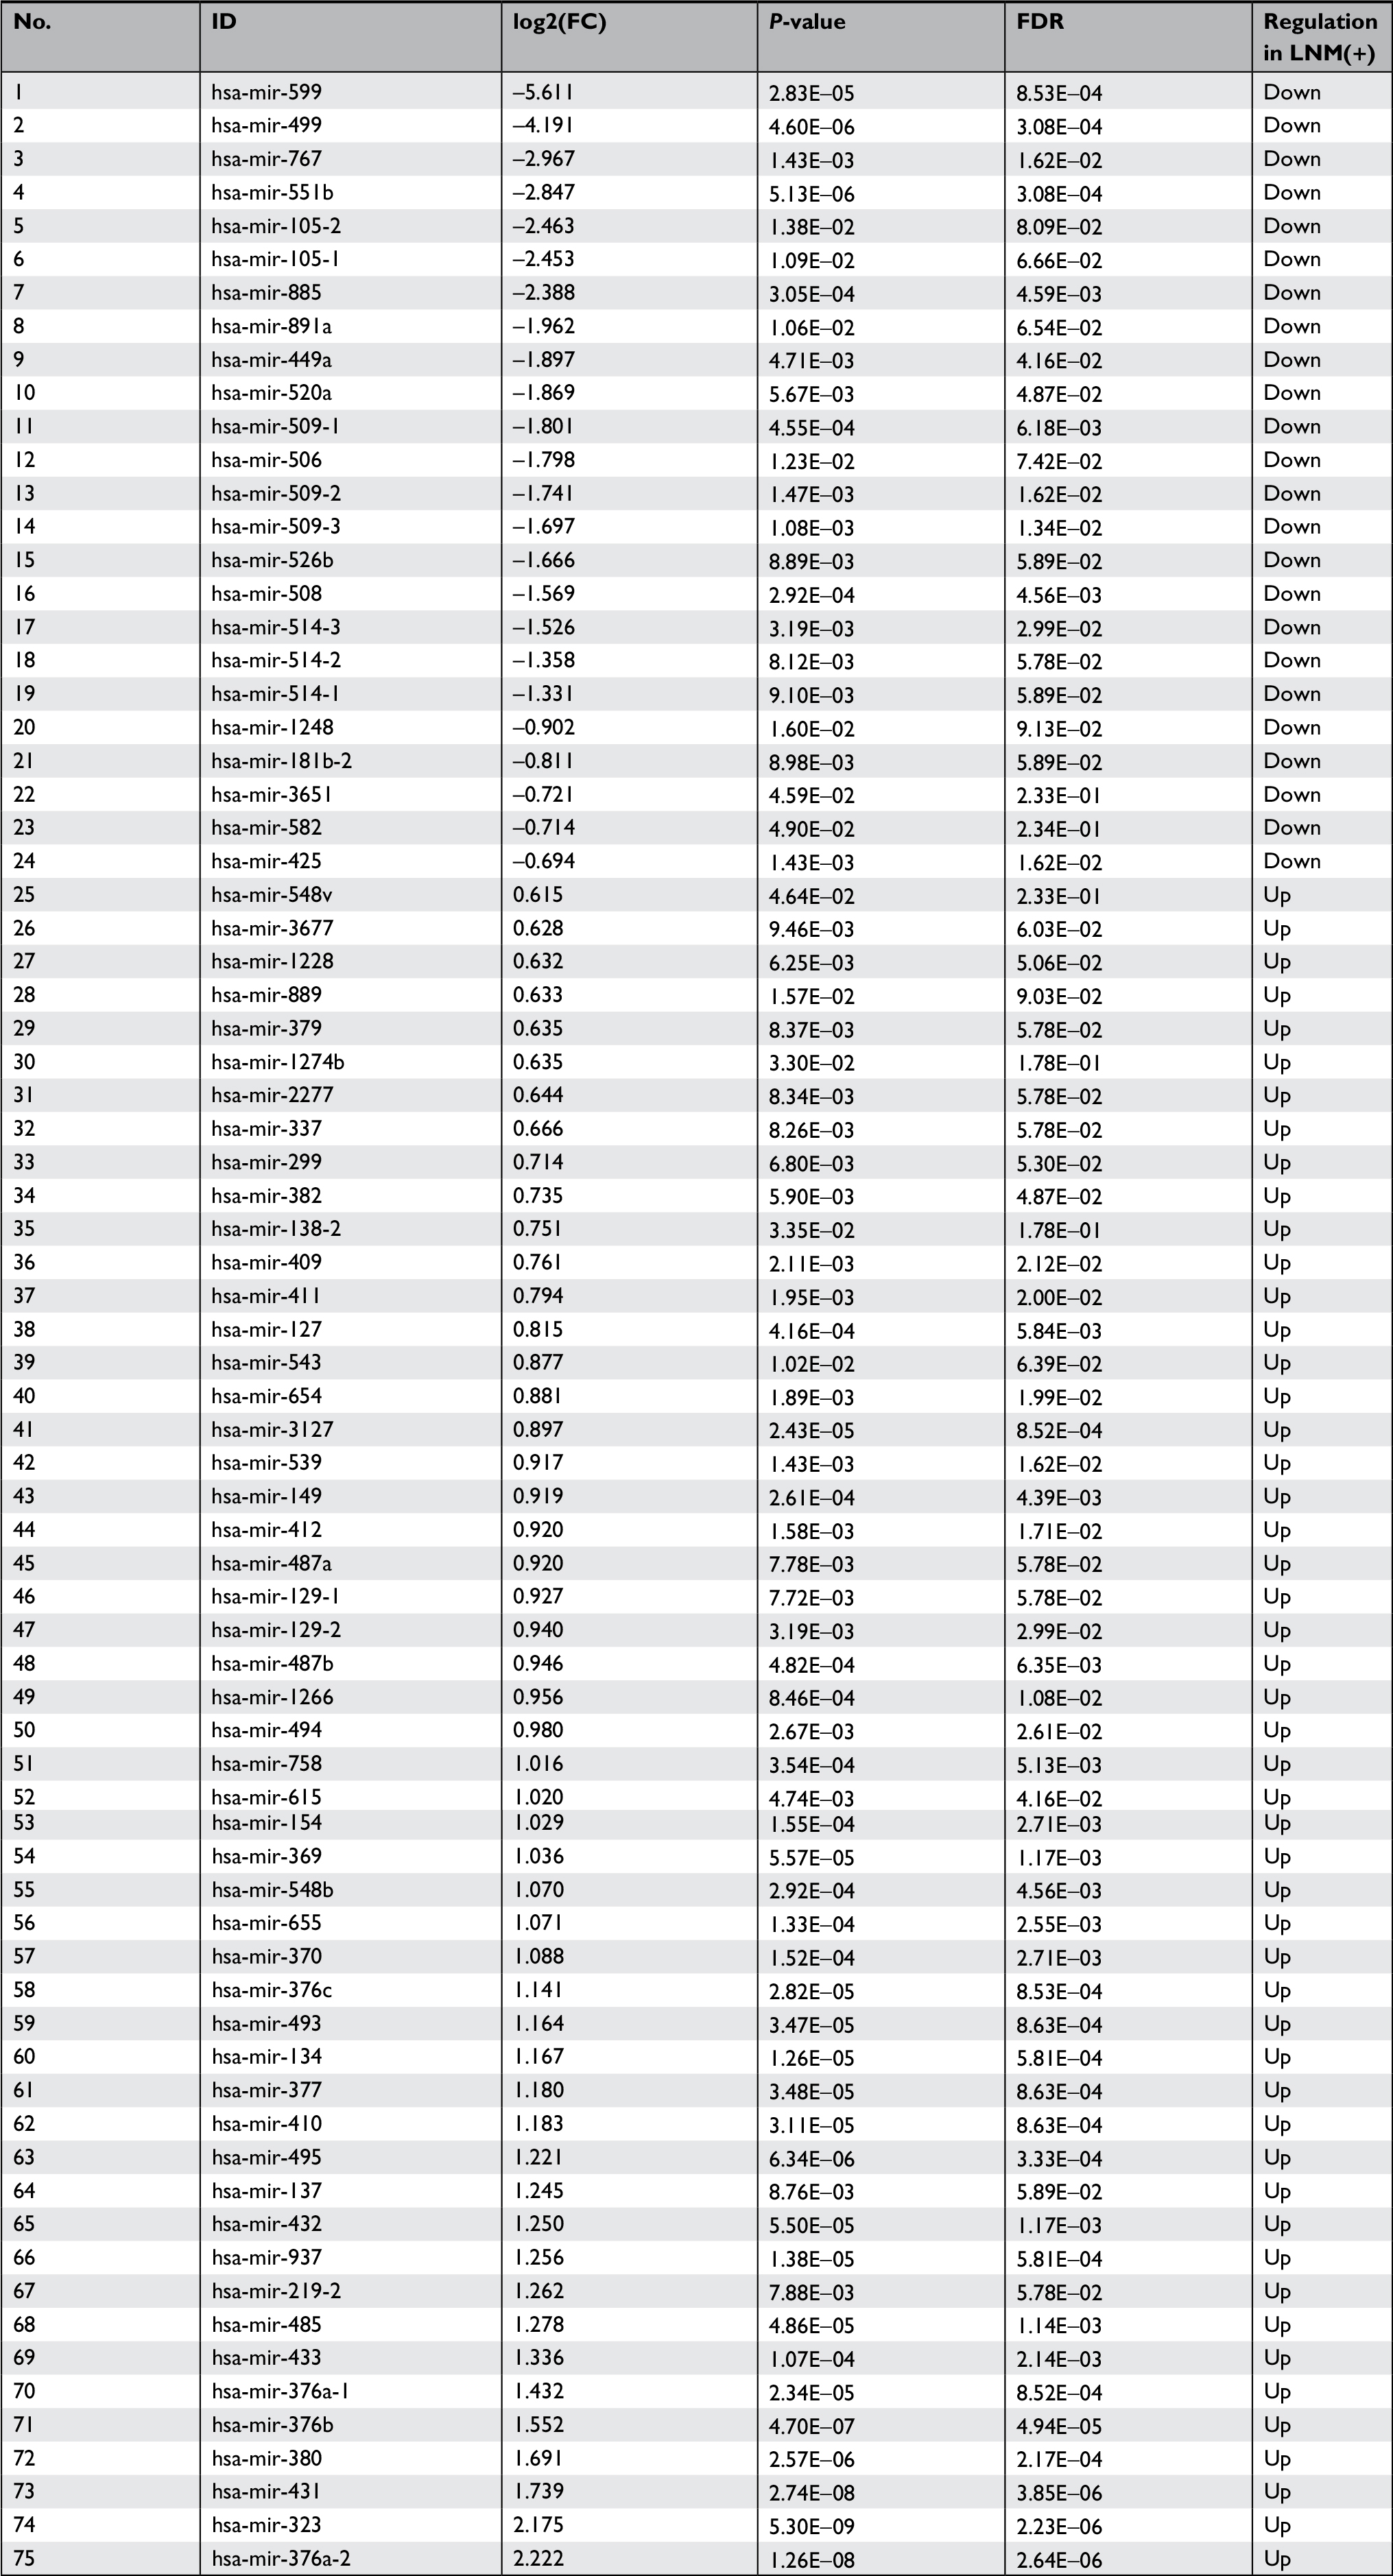 | Table S1 Differentially expressed microRNAs in LNM(+) and LNM(−) patients Abbreviations: ID, miRNA ID; FC, fold change; FDR, false discovery rate. |
 © 2018 The Author(s). This work is published and licensed by Dove Medical Press Limited. The
full terms of this license are available at https://www.dovepress.com/terms
and incorporate the Creative Commons Attribution
- Non Commercial (unported, 3.0) License.
By accessing the work you hereby accept the Terms. Non-commercial uses of the work are permitted
without any further permission from Dove Medical Press Limited, provided the work is properly
attributed. For permission for commercial use of this work, please see paragraphs 4.2 and 5 of our Terms.
© 2018 The Author(s). This work is published and licensed by Dove Medical Press Limited. The
full terms of this license are available at https://www.dovepress.com/terms
and incorporate the Creative Commons Attribution
- Non Commercial (unported, 3.0) License.
By accessing the work you hereby accept the Terms. Non-commercial uses of the work are permitted
without any further permission from Dove Medical Press Limited, provided the work is properly
attributed. For permission for commercial use of this work, please see paragraphs 4.2 and 5 of our Terms.