Back to Journals » Journal of Inflammation Research » Volume 16
Identification of Critical Modules and Biomarkers of Ulcerative Colitis by Using WGCNA
Authors Yuan Y, Li N, Fu M, Ye M
Received 10 January 2023
Accepted for publication 28 March 2023
Published 17 April 2023 Volume 2023:16 Pages 1611—1628
DOI https://doi.org/10.2147/JIR.S402715
Checked for plagiarism Yes
Review by Single anonymous peer review
Peer reviewer comments 2
Editor who approved publication: Professor Ning Quan
Yifan Yuan,1,2,* Na Li,1,2,* Mingyue Fu,1,2,* Mei Ye1,2
1Department of Gastroenterology, Zhongnan Hospital, Wuhan University, Wuhan, Hubei, 430071, China; 2Hubei Clinical Centre and Key Laboratory of Intestinal and Colorectal Diseases, Zhongnan Hospital, Wuhan University, Wuhan, Hubei, 430071, China
*These authors contributed equally to this work
Correspondence: Mei Ye, Email [email protected]
Background: Ulcerative colitis (UC) is a chronic inflammatory disease of the colon and rectum that has no exact cause and is characterized by relapsing and remitting episodes. We aimed to find biomarkers of UC and its causes.
Methods: We got GSE73661 from the GEO database and used WGCNA to find DEGs that were expressed in the same way in both normal and UC samples. To identify the co-expression modules, we used Weighted Gene Co-Expression Network Analysis. Next, we selected genes that were both DEGs and parts of main modules. Later, three datasets were used to find the hub genes, and qRT-PCR was utilized to confirm the in-silico findings. Additionally, we analyzed the connection between the hub genes and the filtration of immune cells in UC. Using the databases, we made predictions about the miRNAs and lncRNAs that regulate the hub genes and predicted possible therapeutic drugs.
Results: We found 822 DEGs and three main modules related to immunity, endoplasmic reticulum, and metabolism. Using another three datasets and human samples to confirm the mRNA expression of these genes in UC patients, XBP1 and PLPP1 were selected as hub genes, and had excellent diagnostic potential. According to the findings of the immune infiltration, patients with UC exhibited a larger proportion of immune cells. And hub genes, particularly XBP1, were closely linked to a number of immune cell infiltrations. Based on the databases and hub genes, a lncRNA-miRNA-mRNA network, including two miRNAs (miR-214-3p and miR-93-5p), two hub genes, and 124 lncRNAs, and potential therapeutic medicine were identified.
Conclusion: We found two new genes, XBP1 and PLPP1, that are involved in UC and can help diagnose and measure the disease. XBP1 also relates to clinical scores and immune cells. We suggested a gene network and possible drugs based on them.
Keywords: ulcerative colitis, hub genes, biomarkers, bioinformatics analysis, ceRNA regulatory network
Introduction
Chronic, recurring, and etiologically mysterious, ulcerative colitis (UC) is an inflammatory bowel disease (IBD) affecting the colon and rectum.1 Mucosal inflammation in UC patients often starts in the rectum and spreads to the proximal colon.2 Studies have found that, in the twenty-first century, the incidence of UC has stabilized in developed countries; however, it has increased rapidly in many newly industrialized countries.3,4 UC is likely caused by a mix of unknown genetic, environmental, microbial, or immune responses, but the precise reason why the sickness occurs is not yet understood.5 The process of diagnosing UC uses clinical, laboratory, imaging, endoscopic, and histology criteria.6 Unfortunately, even clinical experts sometimes fail to make a definite diagnosis. The conventional treatment consists of 5-aminosalicylate, corticosteroids, and immunomodulators.7 Since the beginning of the twenty-first century, in moderate-to-severe UC patients, various biological treatments and small compounds have shown effectiveness.8 Despite breakthroughs in therapy, by the end of the year, only around 40% of patients achieve clinical remission, and 20–30% of individuals still need surgery over the course of the illness.9–11
The capacity to utilize markers to identify the kind of UC, its severity, prognosis, and drug response has been a long-held objective of clinical researchers.12 Erythrocyte sedimentation rate (ESR), C-reactive protein (CRP), and fecal calprotectin (FC) are the inflammatory markers that have been looked into the most. While established serological biomarkers like CRP and ESR are affordable and simple to use UC biomarkers, their poor connection with endoscopic state and histological activity limits their usage.13 Despite its sensitivity, FC is not a diagnostically reliable measure of gastrointestinal inflammation. FC concentrations may also differ between stool samples collected on the same day and across days.14 So far, research on many new serum indicators, such as leucine-rich A-2 glycoprotein, trefoil factor 3, high mobility group box 1 protein, soluble ST2, neutrophil gelatinase-associated lipocalin, matrix metalloproteinases, and others, has not led to any clear conclusions.15 Tissue markers seem to be reliable and useful at the moment, and they may help doctors figure out the severity and prognosis of a disease and start treatment early. Biomarkers, on the other hand, may help doctors figure out how well a therapy is working and predict UC recurrence after surgery. Understanding what causes UC is important for coming up with cures, and a high degree of sensitivity and specificity, as well as reliable, repeatable, standardized, easily accessible, and well-understood tissue markers, are needed.
The fast development of gene microarray technology and bioinformatic analysis has made it possible for scientists to look at the expression of thousands of genes. This has helped them learn more about how genes affect the pathophysiology of disease. High-throughput sequencing tools have recently offered unparalleled insight into disease processes and biomarker discovery.16 We acquire microarray datasets from GEO to investigate differentially expressed genes (DEGs) between healthy and UC intestinal mucosal tissues. The molecular process that results in UC was then determined by doing an enrichment analysis of Kyoto Encyclopedia of Genes and Genomes (KEGG) pathways and Gene Ontology (GO) keywords. The hub genes were then confirmed in databases and on our own human samples. A regulatory network for competitive endogenous RNA (ceRNA) was developed with the use of hub genes and Cytoscape. And we made predictions about possible therapeutic agents for treating UC via the DSigDB database. To sum up, PLPP1 and XBP1 were identified as two hub genes that might serve as biomarkers for UC. Both were very informative for diagnosis and linked to illness severity in clinical settings.
Materials and Methods
Data Source
The GEO database (https://www.ncbi.nlm.nih.gov/geo/) was used to find out the messenger RNA (mRNA) expression level in the colon tissue of UC patients.17 Finally, our research contained datasets on intestinal mucosal expression from UC patients, including GSE73661, GSE48958, GSE16879, GSE75214, GSE11223 and GSE92415.18–23 Table 1 summarizes the data for the six datasets.
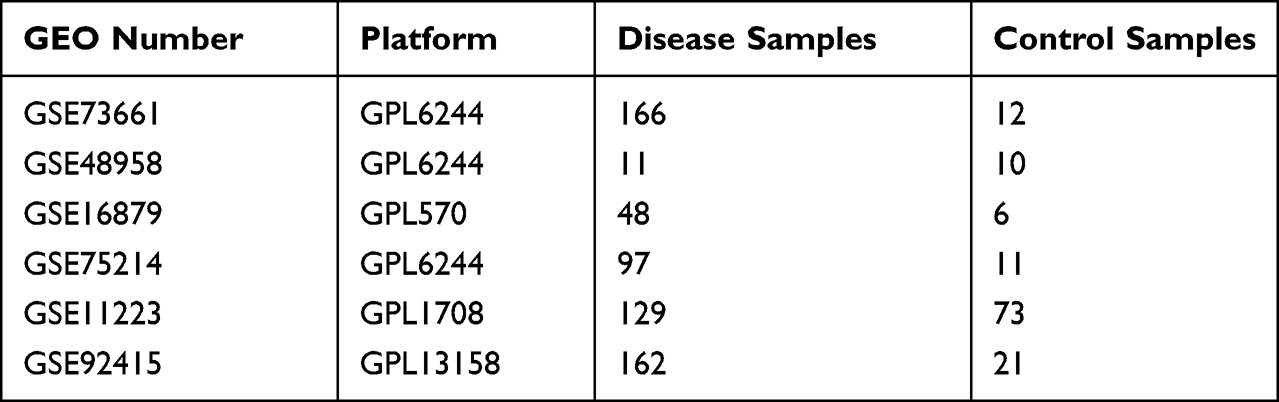 |
Table 1 A Summary of Microarray Information |
Weighted Gene Co-Expression Network Analysis (WGCNA)
WGCNA may reveal disease-related gene networks and co-expressed gene modules with important biological implications.24 The top 25% of the most variable genes were selected for the WGCNA analysis since the remainder of the more than 20,000 sequenced genes in the GEO dataset did not alter in expression across samples. During the process of transforming the weighted adjacency matrix into the topological overlap matrix, the nodes of the matrix were organized into a cluster tree using a hierarchical clustering approach (Figure S1).25 Millions of genes are put into modules based on how they are expressed, and each module has genes that have a common expression pattern.
 |
Figure 1 Study flow chart for this work. |
Differential Expressed Genes Associated with UC
Differential gene analysis was carried out by us using the “limma” package,26 with an adjusted P value < 0.05 and a |log2 fold change| > 1 as the criteria for detecting DEGs in the dataset comparing diseased and control samples. Finally, we used “VennDiagram” to look for overlap between core module genes and DEGs.27
Functional Enrichment Analysis
After finding genes that are common, we carried out the functional enrichment analysis with the help of the “clusterProfiler”.28 The KEGG enrichment study identifies likely biological pathways and functions related to the target, whereas the GO research focuses on the target’s biological process, cellular composition, and molecular function. Furthermore, using a q-value < 0.05, highly enriched words and pathways were found. The possible role of the diagnostic genes was determined using the gene set enrichment analysis (GSEA) and reference gene sets were retrieved using the Molecular Signature Database.29 If the P value was less than 0.05, we regarded it as significant.
Specimen Collection
Between December 2020 and May 2022, eight people with active ulcerative colitis were collected from Zhongnan Hospital, Wuhan University (Wuhan, China). Histopathological detection was used to diagnose patients. Furthermore, no patients were given immunosuppressants, steroids, or biologic medicines. For the sake of comparison, eight healthy volunteers of similar age and gender were recruited. In order to preserve the acquired tissue samples, liquid nitrogen was employed. The Ethics Review Committee of Zhongnan Hospital and the Institutional Review Board of the Clinical Research Center all gave their blessing to the gathering of patient samples.
RNA Extraction and Quantitative Reverse Transcription PCR (qRT-PCR)
We did a univariate regression analysis in R to find the most important genes in the DEGs. Then, we chose the top 5 DEGs, including MT1M, BACE2, ASPHD2, PLPP1, and XBP1, to verify in human samples. Tissue total RNA was isolated from tissues using Trizol (Invitrogen, USA) and reverse transcribed with a TOYOBO ReverTra Ace kit (TOYOBO, Japan). The expression of GAPDH, a housekeeping gene, was determined by real-time PCR (qRT-PCR) using a Biorad CFX96 Real-Time PCR System (Biorad, USA). TSINGKE Biological Technology was responsible for developing the primers (Wuhan, China).
The following is a list of the primer sequences:
GAPDH-F 5′GTCTCCTCTGACTTCAACAGCG3′
GAPDH-R 5′ACCACCCTGTTGCTGTAGCCAA3′
MT1M-F 5′GAGATCTCCAGCCTTACCGC3′
MT1M-R 5′AGGAGCAGCAGCTCTTCTTG3′
BACE2-F 5′GACGAGAACTCCAGCAGGTCAT3′
BACE2-R 5′ACCGATCACCAGCGCATTTGTG3′
ASPHD2-F 5′GAGCACTATGGACCCACCAACA3′
ASPHD2-R 5′GAGTCATCAAAGAGAAGGCAGCG3′
PLPP1-F 5′TGGAGCGATGTGTTGACTGGAC3′
PLPP1-R 5′GCAGAGTTGTATGAGAGTCCTCC3′
XBP1-F 5′CTGCCAGAGATCGAAAGAAGGC3′
XBP1-R 5′CTCCTGGTTCTCAACTACAAGGC3′
Analysis of ROC Curves for Hub Genes
Boxplots made with the “ggplot2” R software showed how much hub genes were being expressed in both UC and control samples.30 Each candidate hub gene was tested using a receiver operating characteristic (ROC) curve to guarantee its precision. For ROC curve analysis, the “pROC” software was utilized.31 It was shown that genes with an area under the curve larger than 0.70 might provide diagnostic benefit for illness.
Immune Infiltration Analysis
The immunological microenvironment is made up of many different components, such as mesenchymal tissues, inflammatory cells, immune cells, fibroblasts, and a wide variety of cytokines and chemokines. The investigation of immune cell infiltration is essential for understanding disease progression and treatment response in UC. To determine the percentages of 22 different kinds of immune cells in the GSE73661 samples, we utilized the CIBERSORT methodology.32 Spearman correlation testing was performed on invading immune cells and hub genes using the “corrplot” program.
GeneMANIA Analysis and Potential Therapeutic Drug Prediction for Hub Genes
GeneMANIA, a database for the creation of protein-protein interaction networks, is accessible at http://www.genemania.org. This database illustrates the functional network between genes and promotes investigation into their functions.33 The website offers a variety of bioinformatics research approaches, including physical interaction, gene enrichment analysis, gene co-location, gene co-expression, and website prediction, and allows users to choose the data sources of gene nodes. GeneMANIA was used to generate the core gene network for the mechanism analysis. Potential future therapeutic medicines for UC were predicted using the DSigDB database (http://tanlab.ucdenver.edu/DSigDB),34 with a false discovery rate of 0.05 and a composite score of more than 3000 being selected as criteria.
Prediction of miRNAs and lncRNAs Associated with Hub Genes
MicroRNAs (miRNAs) control protein translation by binding the target mRNA’s 3’ untranslated region.35 In the ceRNA network, we used miRNAs to link target mRNAs to their respective long non-coding RNAs (lncRNAs). Starbase (https://starbase.sysu.edu.cn/starbase2/index.php), miRTarBase (https://mirtarbase.cuhk.edu.cn/), and TargetScan (http://www.targetscan.org/vert_72/) databases predicted hub gene miRNAs, which were intersected.36–38 Additional usage of Starbase for stringent prediction of miRNA-lncRNA interactions.36 The collected miRNAs, lncRNAs, and target genes were used to construct a Cytoscape regulatory network.39
Statistical Analysis
Our research data was analyzed statistically using Prism (GraphPad Software, La Jolla, CA). T-test and Kruskal–Wallis were used to check for statistical significance. ns, no significance; * means P < 0.05; ** means P < 0.01; *** means P < 0.001; **** means P < 0.0001.
Results
WGCNA Analysis and DEGs Identification in UC
Figure 1 depicts the study flow. In the dataset GSE73661, the WGCNA identified a total of 10 modules in which genes had similar co-expression characteristics. Using the Spearman correlation coefficient between modules and characteristics to figure out important module (Figures 2A and B). Due to their high level of association with UC, the blue, turquoise, and brown colors were selected as crucially important modules. The “limma” software was used for the next step, which was to detect 822 DEGs (Figure 2C). A Venn diagram was utilized to compare the genes implicated in order to better examine the overlap in target modules. In addition, 372, 315, and 92 DEGs were identified as the blue DEGs, turquoise DEGs, and brown DEGs, respectively (Figure 2D).
 |
Figure 2 Weighted gene co-expression network analysis (WGCNA) and identification of differential expressed genes (DEGs). (A) Hierarchical clustering of UC genes that are expressed similarly. (B) Module–trait relationships in UC. The relevant P value and correlation coefficient are listed in each cell. (C) DEGs between the control and UC groups are shown on a volcano plot. (D) Venn diagram shows genes identified from the intersection of DEGs and significant module genes in WGCNA. |
Functional Enrichment Analysis of Common Genes
To determine the most probable role of the DEGs in the three target modules, we carried out a GO and KEGG enrichment analysis via the “clusterProfiler” program. According to the GO analysis findings, blue DEGs were abundant in fatty acid metabolic process, lipid catabolic process, and organic acid transmembrane (Figure 3A). And the KEGG analysis showed that these genes were highly associated with the bile acid degradation pathway, the nitric oxide metabolism pathway, and the PPAR signaling pathway (Figure 3B). In addition, the GO keywords were found to be considerably enriched in turquoise DEGs, including leukocyte migration, wound healing, endoplasmic reticulum lumen, and cytokine activity (Figure 3C). TNF signaling pathway, cytokine-cytokine receptor interaction, and PI3K-Akt signaling pathway were the KEGG pathways enriched by shared genes (Figure 3D). Interferon-gamma protein-lipid complex response, humoral immune response, and peptidoglycan binding were shown to be significant GO terms for brown DEGs (Figure 3E). And the brown DEGs’ KEGG pathway was shown to be abundant in NOD-like receptor signaling, the HIF-1 signaling pathway, and the chemokine signaling pathway (Figure 3F). Functional enrichment analysis revealed that these DEGs were associated with immunology, endoplasmic reticulum (ER), and metabolism.
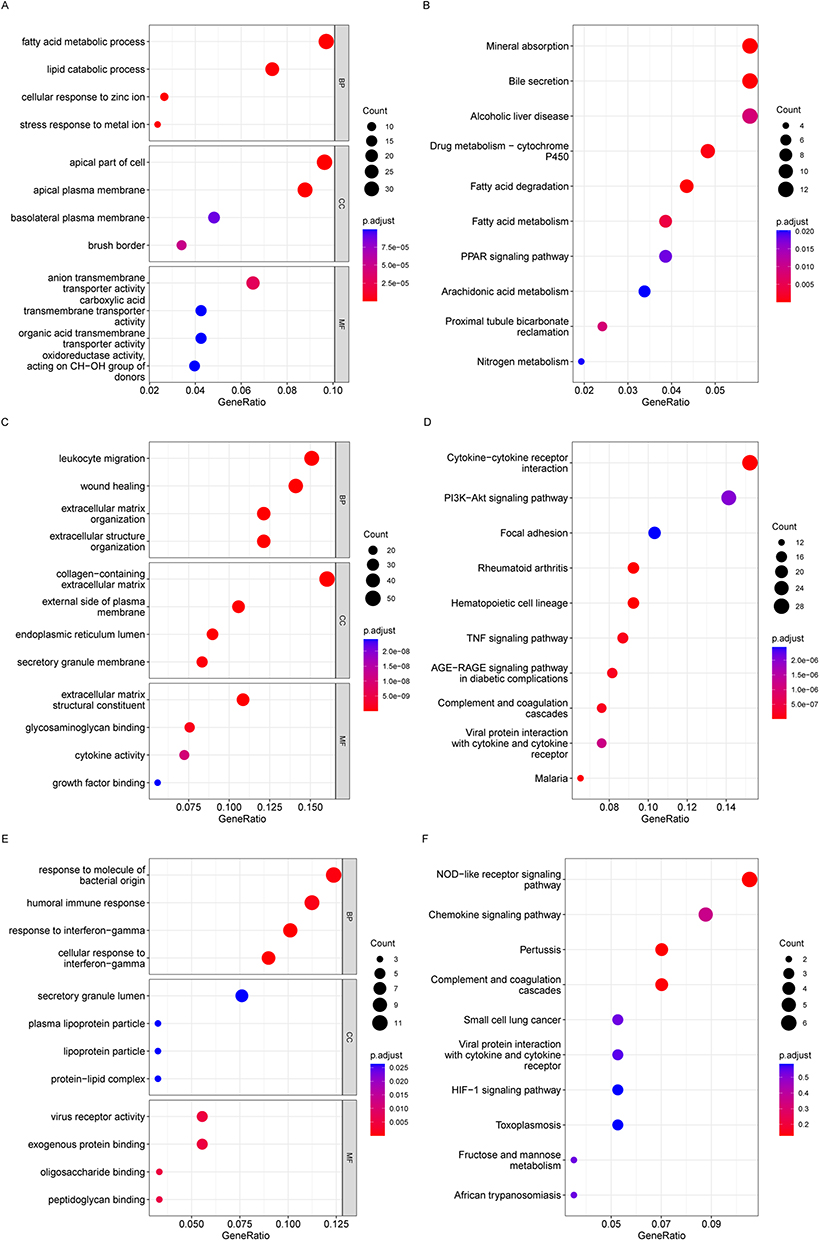 |
Figure 3 Enriched GO terms in (A) blue module-DEGs, (C) turquoise module-DEGs and (E) brown module-DEGs. Enriched KEGG terms in (B) blue DEGs, (D) turquoise DEGs and (F) brown DEGs. GO, Gene Ontology; BP, biological process; CC, cellular component; MF, molecular function; KEGG, Kyoto Encyclopedia of Genes and Genomes. |
Identification of Hub Genes and the Clinical Significance
Subsequently, the univariate regression analysis was conducted to find out the most important genes in these significant modules related DEGs and selected the top 5 DEGs, including MT1M, BACE2, ASPHD2, PLPP1, and XBP1, for further analysis (Table 2). We next used qRT-PCR to check their mRNA expression in UC patients and three other datasets retrieved from GEO to confirm their differential expression (Figures 4A-E and S2). Finally, PLPP1 and XBP1 were defined as the two hub genes. In GSE73661, the area under the curve for PLPP1, XBP1, and the combination were 0.986, 0.991, and 0.994 showing that the hub genes can function as UC biomarkers (Figure 5A). Analysis of ROC curves for the external validation sets GSE48958, GSE16879, and GSE75214 also showed that hub genes had perfect diagnostic values (Figures 5B–D).
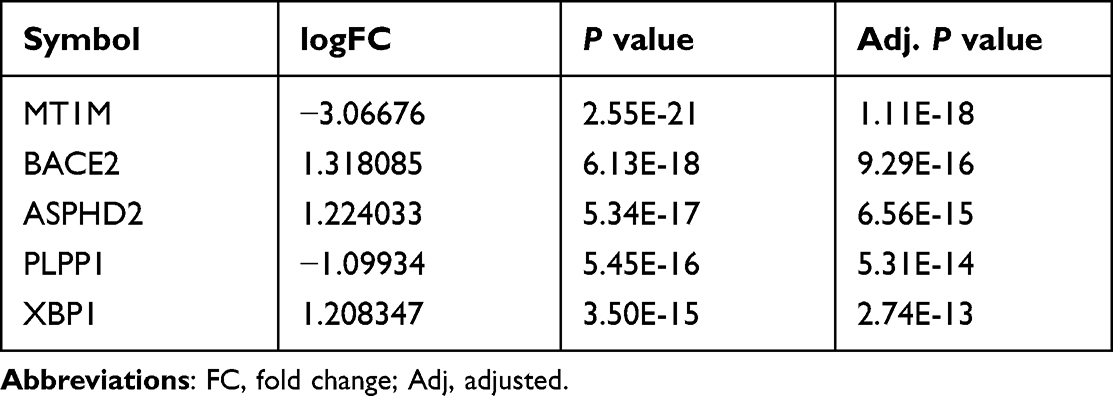 |
Table 2 The Top 5 DEGs in Univariate Analysis |
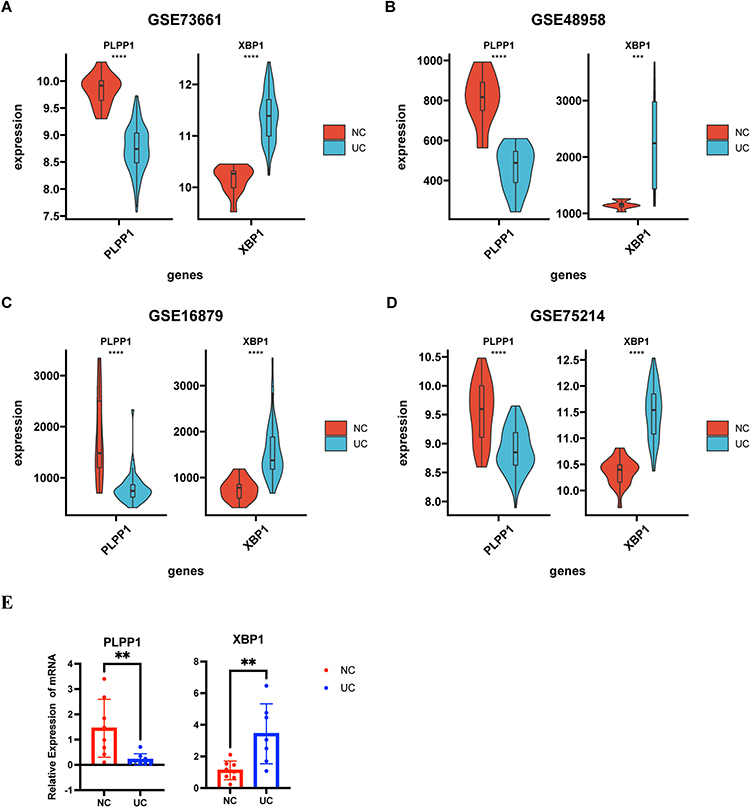 |
Figure 4 The identification of hub genes. The expressions of PLPP1 and XBP1 in (A) GSE73661, (B) GSE48958, (C) GSE16879, and (D) GSE75214. (E) qRT-PCR validation of the PLPP1 and XBP1. *** means P < 0.001; **** means P < 0.0001. |
 |
Figure 5 The receiver operating characteristic curve analysis of hub genes in (A) GSE73661, (B) GSE48958, (C) GSE16879, and (D) GSE75214. |
To further determine whether hub genes are related to clinical severity, we obtained datasets from the GEO database that recorded patient-related disease activity. We observed that in the GSE73661 dataset, XBP1 was significantly lower in the mild group (Mayo scores 0 and 1) than in the moderate-severe group (Mayo scores 2 and 3) among different endoscopic Mayo score groups (Figure 6A). And in the GSE11223 and GSE92415 datasets, according to the ulcerative colitis endoscopic activity index and Mayo index, we found that XBP1 also had a good ability to distinguish between mild and moderate-to-severe UC (Figures 6C and E). However, PLPP1 does not show the ability. So, we next performed the Spearman analysis on the XBP1 and related clinical scores, and the results suggested that XBP1 was positively correlated with UC-related clinical activity scores (Figures 6B, D and F). In summary, both XBP1 and PLPP1 have strong diagnostic power, and XBP1 also has a good ability to distinguish disease activity levels.
 |
Figure 6 The expression levels of hub genes in different disease degrees were different in (A) GSE73661, (C) GSE11223, and (E) GSE92415. The correlation between XBP1 expression level and clinical scores in (A) GSE73661, (C) GSE11223, and (E) GSE92415. ns, no significance; * means P < 0.05;** means P < 0.01;**** means P < 0.0001. |
Immune Cell Infiltration in UC
Because immune-related genes might play a role in the cause of UC, we looked into how the immune system works by measuring immune cell infiltration. As a result, we employed the CIBERSORT technique to calculate the percentage of immune cells present in the UC healthy subjects. When compared to normal samples, UC patients showed a higher proportion of resting T cells CD4 memory, macrophages M0, activated dendritic cells (DCs), T cells follicular helper, resting natural killer (NK) cells, neutrophils, macrophages M1, activated mast cells, and activated T cells CD4 memory. While T cells regulatory (Tregs), T cells CD8, resting mast cells, activated NK cells, and macrophages M2 infiltrated less compared with control samples (Figure 7A). This shows how important immunology is in the development of UC.
 |
Figure 7 Immune cell infiltration analysis. (A) 22 distinct immune cell subtype compositions in both UC and normal tissue samples. (B) Correlation between XBP1 and PLPP1 with immune infiltrating cells. ns, no significance; * means P < 0.05, ** means P < 0.01; *** means P < 0.001; **** means P < 0.0001. |
Using Spearman analysis, we investigated whether or not hub genes were linked to immune cell infiltration. According to correlation analysis, XBP1 has a very positive relationship with Macrophages M0, resting NK cells, resting memory T cells, Macrophages M1, activated memory T cells CD4, and neutrophils, and a significantly negative relationship with Monocytes, activated NK cells, T cells CD8, Tregs, and resting Mast cells. In contrast, T cells follicular helper, activated DCs, activated T cells CD4 memory, resting NK cells, Neutrophils, and activated Mast cells were negatively correlated with PLPP1, and only the resting Mast cells and activated positive NK cells were posively corrlated (Figure 7B).
GeneMANIA, GSEA, and Potential Therapeutic Drugs for 2 Hub Genes
Figure 8A displays the PPI network and related activities for the two key genes, PLPP1 and XBP1. GeneMANIA research demonstrates that these mechanisms are tightly linked to the endoplasmic reticulum unfolded protein response (UPR). Then, the hub genes were next investigated using GSEA, and the findings revealed that both were substantially enriched in the metabolism of xenobiotics by cytochrome P450, the cytokine-cytokine receptor interaction, the NOD-like receptor signaling pathway, and the JAK-STAT signaling pathway in the high-expression gene group (Figures 8B and C). The above results showed that hub genes are related to endoplasmic reticulum stress, immunity, and metabolism. This is consistent with the current mainstream mechanism of UC pathogenesis, which further suggests their possible role in UC pathogenesis. Finally, using hub genes, the Enrichr platform is utilized to find candidate compounds for UC. Table 3 displays the top 10 compounds from the DSigDB database that could influence the expression of 2 hub genes.
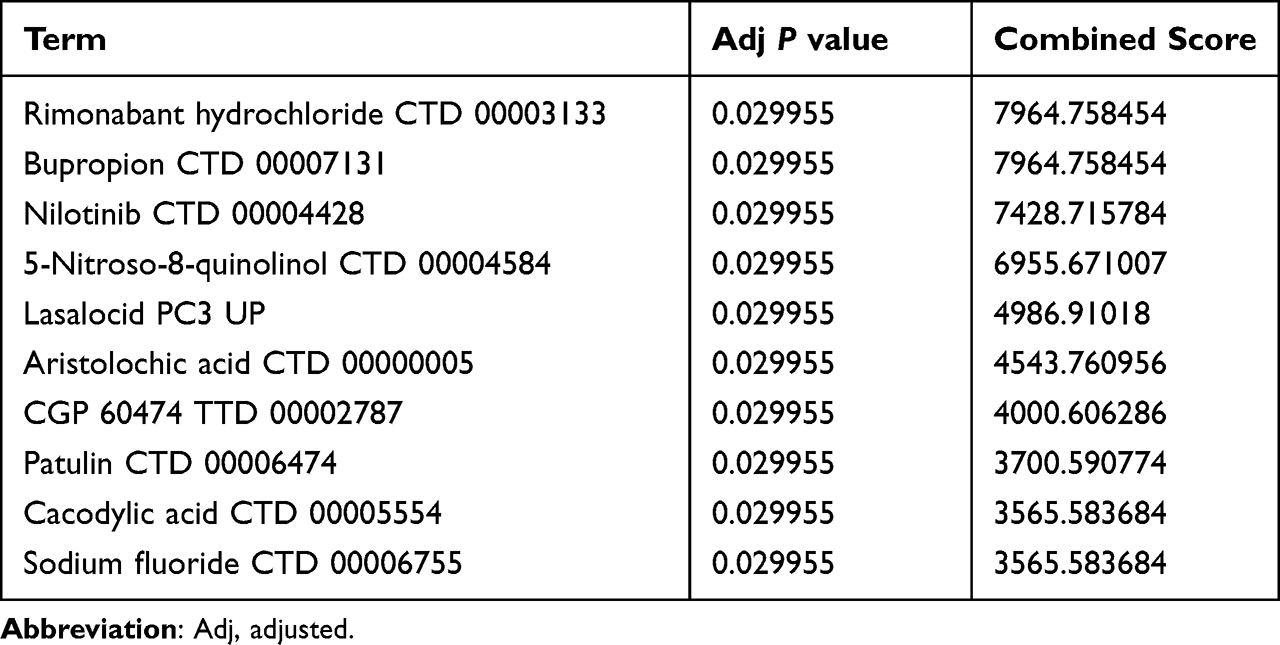 |
Table 3 Potential Top Drug Compounds for UC |
 |
Figure 8 (A) The protein-protein interaction network of XBP1 and PLPfP1.The gene set enrichment analysis for (B) PLPP1 and (C) XBP1. |
Integrated ceRNA Network Construction
Gene expression is regulated in various ways by miRNAs and lncRNAs. The ceRNA is a new regulatory mechanism by which lncRNA may reduce gene silence by separating miRNAs from mRNAs by competitive combination with miRNA via miRNA response regions.40,41 The miRNAs of the 2 hub genes were predicted via the TargetScan, miRTarBase, and Starbase, and the following investigation used the overlapping miRNAs, miR-93-5p and miR-214-3p (Figure S3). The lncRNA-miRNA-2 hub 2040709gene interaction network was established, involving two hub genes PLPP1and XBP1, 2 miRNAs (miR-93-5p and miR-214-3p), and 124 lncRNAs (Figure 9A). The hub gene XBP1 and some lncRNAs, including NEAT1, VASH1-AS1, AC068338.2, AC093227.1, XIST, EPB41L4A-AS1, AC092171.5, PVT1, and OLMALINC, interacted with two miRNAs (Figure 9B). However, these findings need further validation.
 |
Figure 9 (A) The integrated lncRNA-miRNA-hub genes network and (B) the center of the network. Red circle: hub gene. Yellow circle: lncRNA. Blue circle: miRNA. |
Discussion
Research in bioinformatics has helped us get a better understanding of complex diseases and has led to the identification of a number of genes that have a key role in the pathogenesis of UC. This analysis uncovered a total of 822 DEGs and three significant modules. The overlapping genes between the significant modules and DEGs were associated with the fatty acid metabolic process, cytokine activity, lipid catabolic process, and humoral immune response, according to the GO analysis. These genes were shown to be enriched in the cytokine-cytokine receptor interaction, the PPAR signaling pathway, the TNF signaling pathway, and the PI3K-Akt signaling pathway via the KEGG pathway analysis. Our findings are comparable with those of several other studies comparing treatment-naive UC patients to those in deep remission and healthy individuals,42 and lipid metabolic dysfunction are also found in the animal model of IBD.43,44 In UC, many immune processes are messed up, including those that deal with cellular and humoral immune responses.45 Through the PPAR-signaling pathway, matrine may reduce dextran sodium sulfate (DSS)-induced colitis.46 Previous research has also shed light on the complex roles PI3K-Akt signaling plays in the development of UC.47–49 Anti-TNF medication has been licensed for UC and has changed the therapeutic landscape by enabling better patient response and remission rates.50 Using the datasets and qRT-PCR, we finally obtained two hub genes, PLPP1 and XBP1, both of which had a high diagnostic value, and XBP1 was related to clinic severity.
PLPP1, localized on the plasma membrane, belongs to the PLPP family, which can hydrolyze various sphingosine 1-phosphate (S1P) and lipid phosphates covering lysophosphatidate (LPA) in the Mg2+-independent and N-ethylmaleimide-insensitive pathway.51 PLPP1 mediates the extracellular hydrolysis and cellular uptake of lipid mediators, participating in the regulation of signal transduction in different cellular processes, Zhao et al52,53 discovered that PLPP1 hydrolyzed exogenous S1P and facilitated the conversion of extracellular S1P to intracellular S1P, and overexpression of PLPP1 reduced LPA-induced nuclear translocation of NF-κB and phosphorylation of IκB while nearly completely inhibiting IL-8 release. S1P-mediated emergence and development of IBD is a relatively mature field of research, which can promote inflammation by inducing lymphocyte migration and activating the NF-κB pathway.54,55 Nonetheless, the impact of LPA on IBD has not been agreed upon. In DSS-induced chronic colitis mice, Dong et al reported that blocking the autotaxin-LPA axis reduced inflammation by suppressing the development of Th17 cells.56 But Kaya et al57 discovered L-Phenylalanine to be an endogenous ligand of G protein-coupled receptor 35, which they confirmed to play a critical role in intestinal homeostasis and reducing inflammation in DSS-induced acute colitis. However, it remains to be shown if PLPP1 can influence inflammation in UC by degrading extracellular LPA and S1P. In our investigation, we discovered that PLPP1 expression was significantly lower in UC patients than in healthy individuals, which indicated its positive association with inflammation. However, its exact mechanism in UC needs to be further explored.
XBP1 is a basic-region leucine zipper transcription factor that is required for MHC class II gene expression, plasma cell generation, and liver growth. In addition, XBP1 is a substrate for inositol requiring enzyme 1 (IRE1) and is essential for the response to endoplasmic reticulum stress (ERS).58 Properly folded and post-translationally modified proteins perform the correct function, and ERS is caused by too many unfolded and wrongly folded proteins because the ER cannot fold them as well as it used to.59 Evolutionarily, the most conservative is IRE1, which is activated by ERS and leads to the removal of an intron from XBP1. The spliced XBP1 protein acts as a potent trans-activator to control UPR gene expression by translocating into nucleus and binding to target sequences.60,61 Through excessive triggering autophagy dysregulation and activating pro-inflammatory signaling pathways like JNK signaling and NF-κB signaling, ERS is a major contribution to the pathophysiology of IBD.62,63 A. Kaser et al64 found a connection between XBP1, ERS, and IBD. They found that intestinal epithelium-specific deletion of XBP1 induced spontaneous small intestinal inflammation and resulted in increased susceptibility to experimental colitis and may be associated with the susceptibility and severity of IBD. Therefore, UPR can regulate intestinal repair in physiological processes, but when ERS exceeds the range of UPR regulation, it will lead to the occurrence and development of UC, accompanied by the overexpression of XBP1. And XBP1 demonstrated an amazing capacity to diagnose and differentiate the severity of UC, providing further evidence that ERS is a highly promising therapeutic point.
Additionally, we found a notable immune cell composition difference between UC and control samples. M1 macrophages were shown to be considerably greater in the UC patients compared to volunteers, but M2 macrophages were the reverse. This fits with the fact that pro-inflammatory M1 macrophages are involved in UC, not anti-inflammatory M2 macrophages.65 Th1 and Th17 immune responses are driven by M1 macrophage-produced inflammatory cytokines such as IL-1, IL-12, and IL-23, which exacerbate epithelial injury.66 Furthermore, we found lower levels of intestinal CD8+ T cell infiltration in UC patients. Since 1998, researchers have theorized that CD8+ T lymphocytes are involved in the progression of IBD.67 However, the significance of CD8+ in IBD has remained ambiguous till now, with some studies revealing anti-inflammatory capabilities,68,69 while others showed inflammation promotion.70,71 There are two possible explanations for the disparity: one is the diverse origin of CD8+ T cells (such as lamina propria, intestinal mucosa, and peripheral blood mononuclear cells), and the other is fundamental variations in CD8+ T cell subgroups.72 The correlation analysis revealed that PLPP1 and XBP1 are associated with a wide range of immune cells. Surprisingly, XBP1 was shown to have a considerable positive relationship with the infiltration of macrophages M0 and M1, as well as a significant negative connection with CD8+ T cells. However, very little study has been done on the impact that these genes have on the immune cells of people with UC. The results of our study provide new information on the possible functions of the two hub genes in immunological regulation. Therefore, further research is necessary to investigate the function that immune cells play in the progression of UC.
CeRNA has just recently been identified as a crucial factor in the formation of IBD.73,74 We hypothesized a putative ceRNA network with hub genes using the dataset. MiR-93-5p was identified as a putative essential miRNA in UC in a recent bioinformation study.75 In vitro experiments have shown that miR-214-3p downregulation may contribute to the progression of UC by affecting STAT6.76 Importantly, we discovered that 9 lncRNAs facilitated crosstalk between the two miRNAs. In addition, the lncRNAs XIST and NEAT1 have been linked to the process of inflammation in UC.77–79 The predicted lncRNA XIST, together with two essential miRNAs, may all play important roles in UC progression. Nonetheless, the ceRNA mechanisms underlying UC remained mostly unclear, demanding more study.
Our research, however, had certain drawbacks. For starters, we only looked at a few key modules and the genes connected with them, which may have left out possible UC genes. Second, the datasets utilized in this study include samples that have been treated with biological agents. It is still uncertain if these medicines have any effect on gene expression. Furthermore, we did not investigate the exact processes by which hub genes, lncRNAs, and miRNAs affect UC. Finally, the number of human samples is limited. Consequently, more clinical samples and further experiments will be required in the near future to validate our results.
Conclusion
In conclusion, our findings identified new targets, including XBP1 and PLPP1, that may be implicated in the development of UC and might be used as effective diagnostic biomarkers of UC. And XBP1 was highly correlated with clinical scores and a variety of immune cells. We hypothesized a ceRNA network and predicted potential therapeutic drugs based on them. However, more study is necessary to identify their biofunction in UC.
Data Sharing Statement
All of the information utilized in this investigation may be found in the public domain at the Gene Expression Omnibus (GEO, https://www.ncbi.nlm.nih.gov/geo/). With a reasonable request, the corresponding author will provide access to the R code used in this work.
Ethics Approval and Consent to Participate
This research was approved by the ethics review committee of the Zhongnan Hospital (Scientific Ethical Approval No.2019020). All patients signed an informed consent form, and all procedures involving human participants were conducted in accordance with the principles of the Declaration of Helsinki.
Acknowledgments
The authors would like to thank all the investigators of the GSE73661, GSE48958, GSE16879, GSE75214, GSE11223, and GSE92415, involved in the present study for sharing the data online and the volunteers involved in the project.
Author Contributions
All authors made a significant contribution to the work reported, whether that is in the conception, study design, execution, acquisition of data, analysis and interpretation, or in all these areas; took part in drafting, revising or critically reviewing the article; gave final approval of the version to be published; have agreed on the journal to which the article has been submitted; and agree to be accountable for all aspects of the work.
Funding
There is no funding to report.
Disclosure
The authors declare that they have no competing interests.
References
1. Kobayashi T, Siegmund B, Le Berre C, et al. Ulcerative colitis. Nat Rev Dis Primers. 2020;6(1):74.
2. Hibi T, Ogata H. Novel pathophysiological concepts of inflammatory bowel disease. J Gastroenterol. 2006;41(1):10–16.
3. Ng SC, Shi HY, Hamidi N, et al. Worldwide incidence and prevalence of inflammatory bowel disease in the 21st century: a systematic review of population-based studies. Lancet. 2017;390(10114):2769–2778.
4. Mak WY, Zhao M, Ng SC, Burisch J. The epidemiology of inflammatory bowel disease: east meets west. J Gastroenterol Hepatol. 2020;35(3):380–389.
5. Zhang YZ, Li YY. Inflammatory bowel disease: pathogenesis. World J Gastroenterol. 2014;20(1):91–99.
6. Magro F, Gionchetti P, Eliakim R, et al. Third European Evidence-based Consensus on Diagnosis and Management of Ulcerative Colitis. Part 1: definitions, Diagnosis, Extra-intestinal Manifestations, Pregnancy, Cancer Surveillance, Surgery, and Ileo-anal Pouch Disorders. J Crohns Colitis. 2017;11(6):649–670.
7. Harbord M, Eliakim R, Bettenworth D, et al. Third European Evidence-based Consensus on Diagnosis and Management of Ulcerative Colitis. Part 2: current Management. J Crohns Colitis. 2017;11(7):769–784.
8. Lasa JS, Olivera PA, Danese S, Peyrin-Biroulet L. Efficacy and safety of biologics and small molecule drugs for patients with moderate-to-severe ulcerative colitis: a systematic review and network meta-analysis. lancet Gastroenterol Hepatol. 2022;7(2):161–170.
9. Hirten RP, Sands BE. New Therapeutics for Ulcerative Colitis. Annu Rev Med. 2021;72:199–213.
10. Baker DM, Folan AM, Lee MJ, Jones GL, Brown SR, Lobo AJ. A systematic review and meta-analysis of outcomes after elective surgery for ulcerative colitis. Colorectal Dis. 2021;23(1):18–33.
11. Cosnes J, Gower-Rousseau C, Seksik P, Cortot A. Epidemiology and natural history of inflammatory bowel diseases. Gastroenterology. 2011;140(6):1785–1794.
12. Meuwis MA, Fillet M, Geurts P, et al. Biomarker discovery for inflammatory bowel disease, using proteomic serum profiling. Biochem Pharmacol. 2007;73(9):1422–1433.
13. Yoon JY, Park SJ, Hong SP, Kim TI, Kim WH, Cheon JH. Correlations of C-reactive protein levels and erythrocyte sedimentation rates with endoscopic activity indices in patients with ulcerative colitis. Dig Dis Sci. 2014;59(4):829–837.
14. Lasson A, Stotzer PO, Öhman L, Isaksson S, Sapnara M, Strid H. The intra-individual variability of faecal calprotectin: a prospective study in patients with active ulcerative colitis. J Crohns Colitis. 2015;9(1):26–32.
15. Nakov R. New markers in ulcerative colitis. Clin Chim Acta. 2019;497:141–146.
16. Di Narzo AF, Brodmerkel C, Telesco SE, et al. High-Throughput Identification of the Plasma Proteomic Signature of Inflammatory Bowel Disease. J Crohns Colitis. 2019;13(4):462–471.
17. Barrett T, Wilhite SE, Ledoux P, et al. NCBI GEO: archive for functional genomics data sets--update. Nucleic Acids Res. 2013;41:D991–D995.
18. Arijs I, De Hertogh G, Lemmens B, et al. Effect of vedolizumab (anti-α4β7-integrin) therapy on histological healing and mucosal gene expression in patients with UC. Gut. 2018;67(1):43–52.
19. Van der Goten J, Vanhove W, Lemaire K, et al. Integrated miRNA and mRNA expression profiling in inflamed colon of patients with ulcerative colitis. PLoS One. 2014;9(12):e116117.
20. Arijs I, De Hertogh G, Lemaire K, et al. Mucosal gene expression of antimicrobial peptides in inflammatory bowel disease before and after first infliximab treatment. PLoS One. 2009;4(11):e7984.
21. Vancamelbeke M, Vanuytsel T, Farré R, et al. Genetic and Transcriptomic Bases of Intestinal Epithelial Barrier Dysfunction in Inflammatory Bowel Disease. Inflamm Bowel Dis. 2017;23(10):1718–1729.
22. Noble CL, Abbas AR, Cornelius J, et al. Regional variation in gene expression in the healthy colon is dysregulated in ulcerative colitis. Gut. 2008;57(10):1398–1405.
23. Sandborn WJ, Feagan BG, Marano C, et al. Subcutaneous golimumab induces clinical response and remission in patients with moderate-to-severe ulcerative colitis. Gastroenterology. 2014;146(1):85–95.
24. Langfelder P, Horvath S. WGCNA: an R package for weighted correlation network analysis. BMC Bioinform. 2008;9:559.
25. Song L, Langfelder P, Horvath S. Comparison of co-expression measures: mutual information, correlation, and model based indices. BMC Bioinform. 2012;13:328.
26. Ritchie ME, Phipson B, Wu D, et al. limma powers differential expression analyses for RNA-sequencing and microarray studies. Nucleic Acids Res. 2015;43(7):e47.
27. Chen H, Boutros PC. VennDiagram: a package for the generation of highly-customizable Venn and Euler diagrams in R. BMC Bioinform. 2011;12:35.
28. Yu G, Wang LG, Han Y, He QY. clusterProfiler: an R package for comparing biological themes among gene clusters. OMICS. 2012;16(5):284–287.
29. Subramanian A, Tamayo P, Mootha VK, et al. Gene set enrichment analysis: a knowledge-based approach for interpreting genome-wide expression profiles. Proc Natl Acad Sci U S A. 2005;102(43):15545–15550.
30. Villanueva RAM, Chen ZJ. ggplot2: elegant Graphics for Data Analysis. Measurement. 2019;173:160–167.
31. Robin X, Turck N, Hainard A, et al. pROC: an open-source package for R and S+ to analyze and compare ROC curves. BMC Bioinform. 2011;12:77.
32. Newman AM, Liu CL, Green MR, et al. Robust enumeration of cell subsets from tissue expression profiles. Nat Methods. 2015;12(5):453–457.
33. Warde-Farley D, Donaldson SL, Comes O, et al. The GeneMANIA prediction server: biological network integration for gene prioritization and predicting gene function. Nucleic Acids Res. 2010;38:W214–220.
34. Yoo M, Shin J, Kim J, et al. DSigDB: drug signatures database for gene set analysis. Bioinformatics. 2015;31(18):3069–3071.
35. He L, Hannon GJ. MicroRNAs: small RNAs with a big role in gene regulation. Nat Rev Genet. 2004;5(7):522–531.
36. Li JH, Liu S, Zhou H, Qu LH, Yang JH. starBase v2.0: decoding miRNA-ceRNA, miRNA-ncRNA and protein-RNA interaction networks from large-scale CLIP-Seq data. Nucleic Acids Res. 2014;42:D92–97.
37. Huang HY, Lin YC, Li J, et al. miRTarBase 2020: updates to the experimentally validated microRNA-target interaction database. Nucleic Acids Res. 2020;48(D1):D148–d154.
38. Agarwal V, Bell GW, Nam J-W, Bartel DP. Predicting effective microRNA target sites in mammalian mRNAs. eLife. 2015;4:654.
39. Shannon P, Markiel A, Ozier O, et al. Cytoscape: a software environment for integrated models of biomolecular interaction networks. Genome Res. 2003;13(11):2498–2504.
40. An Y, Furber KL, Ji S. Pseudogenes regulate parental gene expression via ceRNA network. J Cell Mol Med. 2017;21(1):185–192.
41. Tay Y, Rinn J, Pandolfi PP. The multilayered complexity of ceRNA crosstalk and competition. Nature. 2014;505(7483):344–352.
42. Diab J, Hansen T, Goll R, et al. Lipidomics in Ulcerative Colitis Reveal Alteration in Mucosal Lipid Composition Associated With the Disease State. Inflamm Bowel Dis. 2019;25(11):1780–1787.
43. Ye J, Haskey N, Dadlani H, et al. Deletion of mucin 2 induces colitis with concomitant metabolic abnormalities in mice. Am J Physiol Gastrointest Liver Physiol. 2021;320(5):G791–g803.
44. Kwon J, Lee C, Heo S, Kim B, Hyun CK. DSS-induced colitis is associated with adipose tissue dysfunction and disrupted hepatic lipid metabolism leading to hepatosteatosis and dyslipidemia in mice. Sci Rep. 2021;11(1):5283.
45. Uzzan M, Martin JC, Mesin L, et al. Ulcerative colitis is characterized by a plasmablast-skewed humoral response associated with disease activity. Nat Med. 2022;28(4):766–779.
46. Yao H, Shi Y, Yuan J, Sa R, Chen W, Wan X. Matrine protects against DSS-induced murine colitis by improving gut barrier integrity, inhibiting the PPAR-α signaling pathway, and modulating gut microbiota. Int Immunopharmacol. 2021;100:108091.
47. Liu CS, Xia T, Luo ZY, et al. Network pharmacology and pharmacokinetics integrated strategy to investigate the pharmacological mechanism of Xianglian pill on ulcerative colitis. Phytomedicine. 2021;82:153458.
48. Dong L, Du H, Zhang M, et al. Anti-inflammatory effect of Rhein on ulcerative colitis via inhibiting PI3K/Akt/mTOR signaling pathway and regulating gut microbiota. Phytother Res. 2022;36(5):2081–2094.
49. Wang X, Xu L, Wang T, et al. Pulsatilla decoction alleviates colitis by enhancing autophagy and regulating PI3K‑Akt‑mTORC1 signaling pathway. Mol Med Rep. 2022;25(3):342.
50. Raine T, Bonovas S, Burisch J, et al. ECCO Guidelines on Therapeutics in Ulcerative Colitis: medical Treatment. J Crohns Colitis. 2022;16(1):2–17.
51. Brindley DN, Waggoner DW. Phosphatidate phosphohydrolase and signal transduction. Chem Phys Lipids. 1996;80(1–2):45–57.
52. Zhao Y, Usatyuk PV, Cummings R, et al. Lipid phosphate phosphatase-1 regulates lysophosphatidic acid-induced calcium release, NF-kappaB activation and interleukin-8 secretion in human bronchial epithelial cells. Biochem J. 2005;385(Pt 2):493–502.
53. Zhao Y, Kalari SK, Usatyuk PV, et al. Intracellular generation of sphingosine 1-phosphate in human lung endothelial cells: role of lipid phosphate phosphatase-1 and sphingosine kinase 1. J Biol Chem. 2007;282(19):14165–14177.
54. Sukocheva OA, Furuya H, Ng ML, et al. Sphingosine kinase and sphingosine-1-phosphate receptor signaling pathway in inflammatory gastrointestinal disease and cancers: a novel therapeutic target. Pharmacol Ther. 2020;207:107464.
55. Verstockt B, Vetrano S, Salas A, Nayeri S, Duijvestein M, Vande Casteele N. Sphingosine 1-phosphate modulation and immune cell trafficking in inflammatory bowel disease. Nat Rev Gastroenterol Hepatol. 2022;19(6):351–366.
56. Dong YL, Duan XY, Liu YJ, et al. Autotaxin-Lysophosphatidic Acid Axis Blockade Improves Inflammation by Regulating Th17 Cell Differentiation in DSS-Induced Chronic Colitis Mice. Inflammation. 2019;42(5):1530–1541.
57. Kaya B, Doñas C, Wuggenig P, et al. Lysophosphatidic Acid-Mediated GPR35 Signaling in CX3CR1(+) Macrophages Regulates Intestinal Homeostasis. Cell Rep. 2020;32(5):107979.
58. Glimcher LH. XBP1: the last two decades. Ann Rheum Dis. 2010;69(Suppl 1):i67–71.
59. Bánhegyi G, Baumeister P, Benedetti A, et al. Endoplasmic reticulum stress. Ann N Y Acad Sci. 2007;1113:58–71.
60. Calfon M, Zeng H, Urano F, et al. IRE1 couples endoplasmic reticulum load to secretory capacity by processing the XBP-1 mRNA. Nature. 2002;415(6867):92–96.
61. Glimcher LH, Lee AH, Iwakoshi NN. XBP-1 and the unfolded protein response (UPR). Nat Immunol. 2020;21(9):963–965.
62. Qiao D, Zhang Z, Zhang Y, et al. Regulation of Endoplasmic Reticulum Stress-Autophagy: a Potential Therapeutic Target for Ulcerative Colitis. Front Pharmacol. 2021;12:697360.
63. Eugene SP, Reddy VS, Trinath J. Endoplasmic Reticulum Stress and Intestinal Inflammation: a Perilous Union. Front Immunol. 2020;11:543022.
64. Kaser A, Lee AH, Franke A, et al. XBP1 links ER stress to intestinal inflammation and confers genetic risk for human inflammatory bowel disease. Cell. 2008;134(5):743–756.
65. Kühl AA, Erben U, Kredel LI, Siegmund B. Diversity of Intestinal Macrophages in Inflammatory Bowel Diseases. Front Immunol. 2015;6:613.
66. Friedrich M, Pohin M, Powrie F. Cytokine Networks in the Pathophysiology of Inflammatory Bowel Disease. Immunity. 2019;50(4):992–1006.
67. Müller S, Lory J, Corazza N, et al. Activated CD4+ and CD8+ cytotoxic cells are present in increased numbers in the intestinal mucosa from patients with active inflammatory bowel disease. Am J Pathol. 1998;152(1):261–268.
68. Ménager-Marcq I, Pomié C, Romagnoli P, van Meerwijk JP. CD8+CD28- regulatory T lymphocytes prevent experimental inflammatory bowel disease in mice. Gastroenterology. 2006;131(6):1775–1785.
69. Endharti AT, Okuno Y, Shi Z, et al. CD8+CD122+ regulatory T cells (Tregs) and CD4+ Tregs cooperatively prevent and cure CD4+ cell-induced colitis. J Immunol. 2011;186(1):41–52.
70. Nancey S, Holvöet S, Graber I, et al. CD8+ cytotoxic T cells induce relapsing colitis in normal mice. Gastroenterology. 2006;131(2):485–496.
71. Rabe H, Malmquist M, Barkman C, et al. Distinct patterns of naive, activated and memory T and B cells in blood of patients with ulcerative colitis or Crohn’s disease. Clin Exp Immunol. 2019;197(1):111–129.
72. Casalegno Garduño R, Däbritz J. New Insights on CD8(+) T Cells in Inflammatory Bowel Disease and Therapeutic Approaches. Front Immunol. 2021;12:738762.
73. Nie J, Zhao Q. Lnc-ITSN1-2, Derived From RNA Sequencing, Correlates With Increased Disease Risk, Activity and Promotes CD4(+) T Cell Activation, Proliferation and Th1/Th17 Cell Differentiation by Serving as a ceRNA for IL-23R via Sponging miR-125a in Inflammatory Bowel Disease. Front Immunol. 2020;11:852.
74. Liu H, Li T, Zhong S, Yu M, Huang W. Intestinal epithelial cells related lncRNA and mRNA expression profiles in dextran sulphate sodium-induced colitis. J Cell Mol Med. 2021;25(2):1060–1073.
75. Hu W, Fang T, Chen X. Identification of Differentially Expressed Genes and miRNAs for Ulcerative Colitis Using Bioinformatics Analysis. Front Genet. 2022;13:914384.
76. Li JA, Wang YD, Wang K, et al. Downregulation of miR-214-3p May Contribute to Pathogenesis of Ulcerative Colitis via Targeting STAT6. Biomed Res Int. 2017;2017:8524972.
77. Ma M, Pei Y, Wang X, Feng J, Zhang Y, Gao MQ. LncRNA XIST mediates bovine mammary epithelial cell inflammatory response via NF-κB/NLRP3 inflammasome pathway. Cell Prolif. 2019;52(1):e12525.
78. Li F, Liu H, Fu J, et al. Knockdown of long non-coding RNA NEAT1 relieves inflammation of ulcerative colitis by regulating the miR-603/FGF9 pathway. Exp Ther Med. 2022;23(2):131.
79. Ni S, Liu Y, Zhong J, Shen Y. Inhibition of LncRNA-NEAT1 alleviates intestinal epithelial cells (IECs) dysfunction in ulcerative colitis by maintaining the homeostasis of the glucose metabolism through the miR-410-3p-LDHA axis. Bioengineered. 2022;13(4):8961–8971.
 © 2023 The Author(s). This work is published and licensed by Dove Medical Press Limited. The
full terms of this license are available at https://www.dovepress.com/terms
and incorporate the Creative Commons Attribution
- Non Commercial (unported, 3.0) License.
By accessing the work you hereby accept the Terms. Non-commercial uses of the work are permitted
without any further permission from Dove Medical Press Limited, provided the work is properly
attributed. For permission for commercial use of this work, please see paragraphs 4.2 and 5 of our Terms.
© 2023 The Author(s). This work is published and licensed by Dove Medical Press Limited. The
full terms of this license are available at https://www.dovepress.com/terms
and incorporate the Creative Commons Attribution
- Non Commercial (unported, 3.0) License.
By accessing the work you hereby accept the Terms. Non-commercial uses of the work are permitted
without any further permission from Dove Medical Press Limited, provided the work is properly
attributed. For permission for commercial use of this work, please see paragraphs 4.2 and 5 of our Terms.
Recommended articles
Bioinformatics Analysis and Experimental Validation of Mitochondrial Autophagy Genes in Knee Osteoarthritis
Tang K, Sun L, Chen L, Feng X, Wu J, Guo H, Zheng Y
International Journal of General Medicine 2024, 17:639-650
Published Date: 23 February 2024
PANoptosis and Autophagy-Related Molecular Signature and Immune Landscape in Ulcerative Colitis: Integrated Analysis and Experimental Validation
Lu J, Li F, Ye M
Journal of Inflammation Research 2024, 17:3225-3245
Published Date: 20 May 2024
Predictive Value of Albumin to Fibrinogen Ratio and CALLY Index for Diagnosis of Ulcerative Colitis and Mucosal Healing After Vedolizumab Treatment
Su K, Xiao S, Wang M, Wang K, Fan Q, Sha S, Cheng Y, Liu X, Shi H
Journal of Inflammation Research 2025, 18:589-600
Published Date: 14 January 2025
Identification of Senescence-Related Genes for the Prediction of Ulcerative Colitis Based on Interpretable Machine Learning Models
Ma J, Chen C, Wang N, Fang T, Liu Y, He P, Dong W
Journal of Inflammation Research 2025, 18:3431-3447
Published Date: 10 March 2025
Ulcerative Colitis: Advances in Pathogenesis, Biomarkers, and Therapeutic Strategies
Bu S, Cheng X, Chen M, Yu Y
Pharmacogenomics and Personalized Medicine 2025, 18:219-238
Published Date: 5 September 2025