
Back to Journals » Journal of Inflammation Research » Volume 19
Identification of Chondrocyte Stemness-Associated Biomarkers in Osteoarthritis Using Bioinformatics and Machine Learning Approaches
Authors Xie S  , Liu M, Wang Y, Cao S, Yang Y , Chen R, Gao T, Ma J, Lv Z, Song Y
Received 27 October 2025
Accepted for publication 26 January 2026
Published 11 February 2026 Volume 2026:19 565577
DOI https://doi.org/10.2147/JIR.S565577
Checked for plagiarism Yes
Review by Single anonymous peer review
Peer reviewer comments 2
Editor who approved publication: Dr Ujjwol Risal
Siyi Xie,1,2 Meiling Liu,1,2 Yuzhong Wang,1 Shuxing Cao,1 Yiming Yang,2 Ruixue Chen,2 Tianlin Gao,1,2 Jun Ma,2,3 Zhe Lv,4 Yongzhou Song1– 3
1Department of Orthopedics, The Second Hospital of Hebei Medical University, Shijiazhuang, Hebei Province, People’s Republic of China; 2Hebei Medical University-National University of Ireland Galway Stem Cell Research Center, Hebei Medical University, Shijiazhuang, Hebei Province, People’s Republic of China; 3Hebei Technology Innovation Center for Stem Cell and Regenerative Medicine, Shijiazhuang, Hebei Province, People’s Republic of China; 4The Second Hospital of Hebei Medical University, Shijiazhuang, Hebei Province, People’s Republic of China
Correspondence: Yongzhou Song; Zhe Lv, The Second Hospital of Hebei Medical University, Shijiazhuang, Hebei Province, 050017, People’s Republic of China, Email [email protected]; [email protected]
Introduction: Osteoarthritis (OA) represents a prevalent degenerative joint condition, in which chondrocyte dysfunction plays a key role in disease progression. Although accumulating evidence underscores the importance of cellular stemness regulation in OA development, systematic screening of related biomarkers has been insufficient. The current study sought to discover and validate potential biomarkers through bioinformatics and machine learning (ML), offering novel perspectives for early detection and therapeutic intervention in OA.
Methods: The present study examined six OA-related transcriptomic profiles from the Gene Expression Omnibus (GEO) to discover and validate stemness-associated biomarkers. Differentially expressed genes (DEGs) were selected and analyzed for enriched biological functions. OA-related modules were determined via weighted gene coexpression network analysis (WGCNA). Key stemness-related genes were selected using ML algorithms, including support vector machine (SVM), random forest (RF), extreme gradient boosting (XGBoost), and the least absolute shrinkage and selection operator (LASSO) regression. Receiver operating characteristic (ROC) analysis was implemented to determine diagnostic accuracy. Utilizing single-sample gene set enrichment analysis (ssGSEA), the link with immune cell infiltration was examined. Ultimately, immunohistochemistry was employed for experimental validation.
Results: Intersection analysis identified 56 stemness-related DEGs in OA cartilage. WGCNA analysis yielded 7 modules significantly associated with stemness genes, and a combined screening approach identified 60 candidate genes. Using four machine learning algorithms—SVM, LASSO, XGBoost, and RF—four feature genes were ultimately determined (WWP2, CDKN1A, IL11, and CRTAC1), among which WWP2, CDKN1A, and CRTAC1 showed significant differential expression between OA and normal samples and demonstrated good diagnostic performance in both the training and validation cohorts (AUC > 0.7). ssGSEA analysis revealed that the expression of these three genes was significantly correlated with specific immune cell subpopulations. Immunohistochemistry further confirmed that WWP2 and CDKN1A were downregulated in OA tissues, whereas CRTAC1 was upregulated.
Conclusion: Through bioinformatics analysis and IHC validation, we identified three stemness-associated biomarker genes (WWP2, CDKN1A, CRTAC1) in OA. These findings may provide meaningful implications for future clinical assessment, treatment, and research on OA.
Keywords: osteoarthritis, cellular stemness, machine learning, biomarkers, chondrocytes
Introduction
As a common degenerative joint disorder, osteoarthritis (OA) predominantly involves the knee joint in middle-aged and older populations. Worldwide, the prevalence of knee OA among individuals aged ≥40 years is 22.9%, with approximately 86.7 million cases reported in adults aged ≥20 years in 2020.1 OA progression involves inflammatory, mechanical, and metabolic mechanisms that result in the breakdown of articular cartilage, synovial membrane, subchondral bone, and surrounding periarticular structures.2 As a major contributor to disability among older individuals, OA markedly impairs quality of life and imposes considerable socioeconomic burdens.3 Current treatments mainly emphasize weight management and administration of nonsteroidal anti-inflammatory drugs (NSAIDs) to delay progression; total joint replacement is often required in advanced stages.4,5 However, the exact pathogenesis remains unclear, and halting cartilage degradation remains a key therapeutic challenge. Systematic investigation of gene expression profiles and activation states in cartilage is crucial for elucidating OA pathology, advancing molecular diagnostics, and developing targeted therapies.
Stemness refers to the ability of cells to self-renew and differentiate into multiple cell types, encompassing stem cells and their progeny.6 Mesenchymal stem/progenitor cells (MSCs/MPCs) exhibit robust clonal self-renewal capacity and multipotent differentiation potential.6 Several studies have identified stem/progenitor cells in human articular cartilage,7–10 which display stem cell-like immunophenotypes and chondrogenic potential, and can respond to tissue injury through enhanced migratory activity. Compared with exogenous cell transplantation, endogenous cells within damaged cartilage may be more suitable for tissue regeneration, as they are already present in the native tissue and retain activity, thus potentially reducing safety risks.11 Moreover, in vitro cultured chondrocytes from OA patients maintain the expression of the stemness marker PRG4, while NANOG and POU5F1 expression remains stable, suggesting the biological feasibility of investigating chondrocyte stemness in the context of OA.12
Accumulating evidence indicates that stemness-related regulation plays a crucial role in cartilage repair and disease progression in OA. For instance, Caldwell et al13 observed in Nfat1⁻/⁻ and wild-type mouse cartilage defect models that Nuclear Factor of Activated T-cells 1 (NFAT1) suppresses chondrocyte hypertrophy, endochondral ossification, and catabolic responses during cartilage repair, thereby delaying post-traumatic osteoarthritis progression. This finding suggests that NFAT1 regulation helps maintain chondrocyte stemness and promotes cartilage regeneration. Additionally, in OA rat models, fibroblast growth factor 18 (FGF18) significantly stimulates cartilage formation and repair;14 in vitro studies further demonstrate that FGF18 improves cartilage structure and cell numbers by promoting proteoglycan and type II collagen synthesis, enhancing chondrocyte proliferation, inhibiting apoptosis, and increasing cartilage thickness.15
Although bioinformatics and machine learning (ML) have emerged as important and complementary tools in biomedical research, enabling high-dimensional analysis, pattern recognition, and predictive modeling of complex biological data, current OA biomarker studies based on multi-omics data mainly focus on inflammation or extracellular matrix (ECM)-related genes,16,17 while biomarkers associated with chondrocyte stemness remain poorly characterized. Furthermore, research strategies that integrate OA omics data, stemness feature assessment, and tissue-level validation are still limited.
Based on this background, the present study integrates multi-omics data with machine learning approaches to systematically identify stemness-associated chondrocyte biomarkers in OA and validate them at the tissue level, aiming to explore their potential roles in OA pathogenesis and progression, and to provide novel theoretical insights and candidate targets for early diagnosis and personalized therapy. Specifically, microarray and RNA sequencing data were integrated, and machine learning methods—including random forest (RF), least absolute shrinkage and selection operator (LASSO) regression, support vector machine (SVM), and extreme gradient boosting (XGBoost)—together with differential expression analysis, immune infiltration analysis, and weighted gene co-expression network analysis (WGCNA) were applied to identify OA stemness-associated biomarkers, providing potential targets for early diagnosis and individualized treatment.
Figure 1 illustrates the analytical workflow.
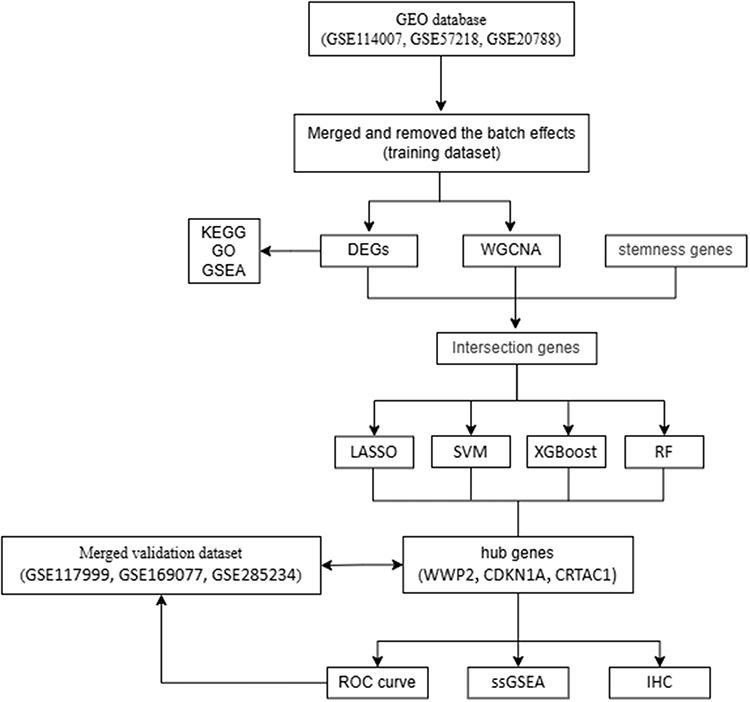 |
Figure 1 Analytical workflow. |
Material and Methods
Information Collection and Processing
Six OA-related transcriptomic datasets (GSE114007, GSE57218, GSE207881, GSE117999, GSE285234, GSE169077) were acquired from the Gene Expression Omnibus (GEO) database (https://www.ncbi.nlm.nih.gov/geo/). The validation set (GSE117999/GSE169077/GSE285234) contained 22 OA and 21 normal samples, while the training set (GSE114007/GSE57218/GSE207881) incorporated 31 normal and 116 OA cartilage samples (Table 1).
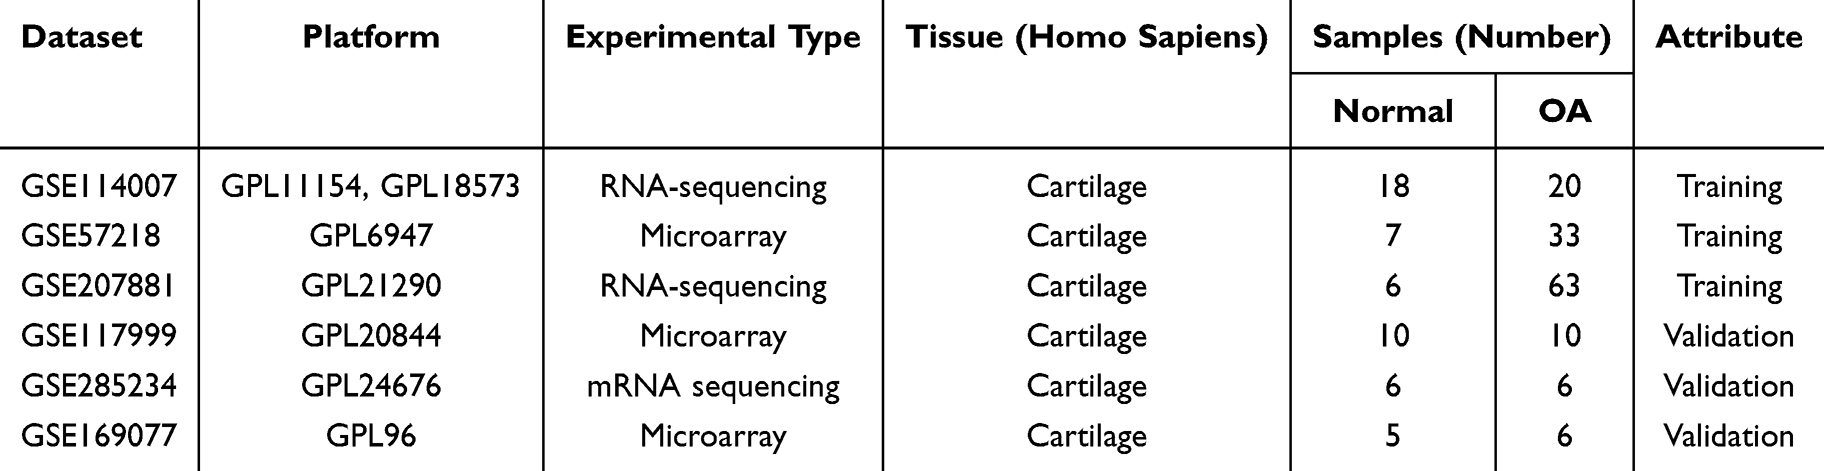 |
Table 1 Descriptive Statistics |
Routine preprocessing methods were implemented for the GEO datasets, including probe-to-gene symbol conversion (retaining the probe with the highest variance for each gene), background correction and normalization using “limma”, and batch effect removal via “sva”.18 Two-dimensional PCA clustering visually confirmed successful batch effect correction across samples.
Stemness Gene Compilation
Stemness-associated genes were systematically curated through multi-source integration: (1) Extraction of “STEMNESS” gene sets from MSigDB; (2) Literature-validated marker screening via GeneCards using keywords (eg, “stemness markers”); (3) Cross-referencing these sources with functional evidence to select high-confidence candidates for downstream analyses.
Functional Enrichment Analysis
Using the R package “clusterProfiler”, Gene ontology (GO) and Kyoto encyclopedia of genes and genomes (KEGG) analyses were performed19 (significance threshold: P < 0.05). Findings were visualized with “enrichplot”, “ggplot2”, and “GOplot”. Gene Set Enrichment Analysis (GSEA) identified significant pathway differences (P < 0.05, |NES| > 1, FDR < 0.25) per GSEA guidelines.
WGCNA Analysis
The WGCNA package was employed to build coexpression networks and determine gene modules linked to OA. After clustering the samples and detecting outliers, the ideal soft threshold (β) was selected utilizing the pickSoftThreshold function to transform the similarity matrices into adjacency matrices. Hierarchical clustering with dynamic tree cutting (minModuleSize=100) identified coexpression modules, which were color-coded. Module-trait correlation analysis pinpointed OA-relevant modules, followed by intersection analysis with stemness genes using Venn diagrams.
ML-Based Feature Gene Selection
This study employed four ML methods for feature gene selection: LASSO regression was performed utilizing the R package “glmnet”20 (binary response, alpha = 1), where the optimal λ was selected through tenfold cross-validation to identify variables with nonzero regression coefficients. The SVM-RFE algorithm21 was implemented employing the “e1071” and “caret” packages. The feature subset yielding the lowest classification error was identified via tenfold cross-validation. An XGBoost model22 was constructed using the “xgboost” package (maximum depth of three, four iterations). The dataset was split into a training set (60%) and a testing set (40%) to evaluate variable importance. A random forest model23 was built utilizing the “randomForest” package (500 trees, 61 of which were used), and variable importance was assessed based on the decrease in the Gini coefficient. Lastly, a Venn diagram was created to integrate the characteristic genes identified by the four methods.
Development of a Nomogram Model Based on Feature Genes
ROC curves were used to evaluate the predictive potential of the identified feature genes as biomarkers, with the area under the curve (AUC) quantifying their diagnostic performance. Based on the expression profiles of the feature genes, a nomogram model was constructed using the “rms” package in R to predict the risk of OA.
To comprehensively assess the predictive performance and robustness of the model, multiple evaluation metrics were further applied, including the area under the precision–recall curve (AUPRC), F1 score, balanced accuracy, Matthews correlation coefficient (MCC), as well as sensitivity and specificity, thereby providing a systematic evaluation of the model’s classification capability and clinical applicability.
Analysis of Immune Cell Infiltration
Activity differences and immune cell infiltration between OA and normal articular tissues were analyzed through the single-sample gene set enrichment analysis (ssGSEA) via the “GSVA” package. Key gene-immune cell correlations were visualized via the “ggpubr” and “ggExtra” packages, revealing unique features of the OA immune microenvironment.
OA Animal Model Validation
To verify the in vivo expression of the characteristic genes, six male C57BL/6 mice aged 6–8 weeks (purchased from Beijing Huafukang Biotechnology Co., Ltd.) were used to establish an OA model. The mice were randomly assigned to an OA group (n = 3) and a control group (n = 3) using a simple randomization method, in which each mouse was assigned a number and group allocation was determined by a random number table All mice were housed in a specific pathogen-free (SPF) environment at the Animal Experiment Center of the Second Hospital of Hebei Medical University, under controlled conditions (temperature 22 ± 1 °C, humidity 50 ± 10%, 12 h light/dark cycle) with free access to food and water, and routine health monitoring was performed.
In the OA group, the right hind limb of each mouse underwent anterior cruciate ligament transection (ACLT) to induce OA. The anterior cruciate ligament (ACL) was transected without damaging other joint structures, thereby triggering OA through abnormal mechanical loading. The control group underwent the same surgical incision and ACL exposure, followed by suturing without transection. Postoperatively, mice were closely monitored for activity, feeding, and wound healing, and each mouse received analgesic treatment with ibuprofen and prophylactic penicillin to prevent infection. Four weeks after surgery, mice were euthanized by cervical dislocation, and right knee cartilage tissues were harvested for subsequent analyses. All procedures were conducted in strict accordance with relevant animal experimental ethical guidelines and regulations.
Histological and Immunohistochemical Analysis
Mouse right knee joints were harvested and immersed in 4% paraformaldehyde for 48 h for fixation. Subsequently, the samples were decalcified at room temperature in a solution containing 25% EDTA for three weeks. Then, the tissues were embedded in paraffin. The paraffin-embedded tissue blocks were sectioned at 5-μm thickness and then deparaffinized and rehydrated. For histological evaluation, hematoxylin and eosin (H&E) staining and Safranin O-Fast green staining were performed to evaluate the tissue morphology and identify differences between experimental groups. Two independent observers, blinded to the experimental groups, evaluated the samples using the Osteoarthritis Research Society International (OARSI) scoring system.24
For immunohistochemical analysis, paraffin-embedded tissues were sectioned at 5 μm thickness and then baked. Deparaffinized sections were processed for antigen retrieval utilizing EDTA and citrate buffer, then treated at 37°C for 10 min with endogenous peroxidase blocker, and incubated with 10% goat serum at 37°C for 20 min to minimize nonspecific binding. All primary antibodies used were commercially validated, including rabbit anti-WWP2 (FineTest, Wuhan, China; Cat# FNab09535, 1:100), rabbit anti-CDKN1A (FineTest, Wuhan, China; Cat# FNab06067, 1:100), and rabbit anti-CRTAC1 (BOSTER, Wuhan, China; Cat# A10445-1, 1:100), were applied. The slides were incubated overnight (approximately 12–16 h) at 4°C in a humidified chamber. Subsequently, they were incubated at 37°C with suitable secondary antibodies for 60 min, followed by 3,3′-diaminobenzidine (DAB)-based chromogenic detection and hematoxylin counterstaining.
Statistical Analysis
Statistical evaluations were implemented by leveraging GraphPad Prism 9 and R software (version 4.4.2). An independent samples t-test was employed to compare gene expression differences between the control group and the OA group. Data visualization was conducted using GraphPad Prism 9, with P < 0.05 indicating statistical significance. Values were displayed as mean ± standard deviation (SD).
Results
GEO Data Processing
We integrated GSE114007, GSE57218, and GSE207881 as the training set (31 normal/116 OA cartilage samples) and GSE117999, GSE169077, GSE285234 as the validation set (21 normal/22 OA samples). Figure 2 displays gene expression distributions (box plots) and principal component analysis (PCA) visualizations to illustrate the impact of batch effect adjustment.
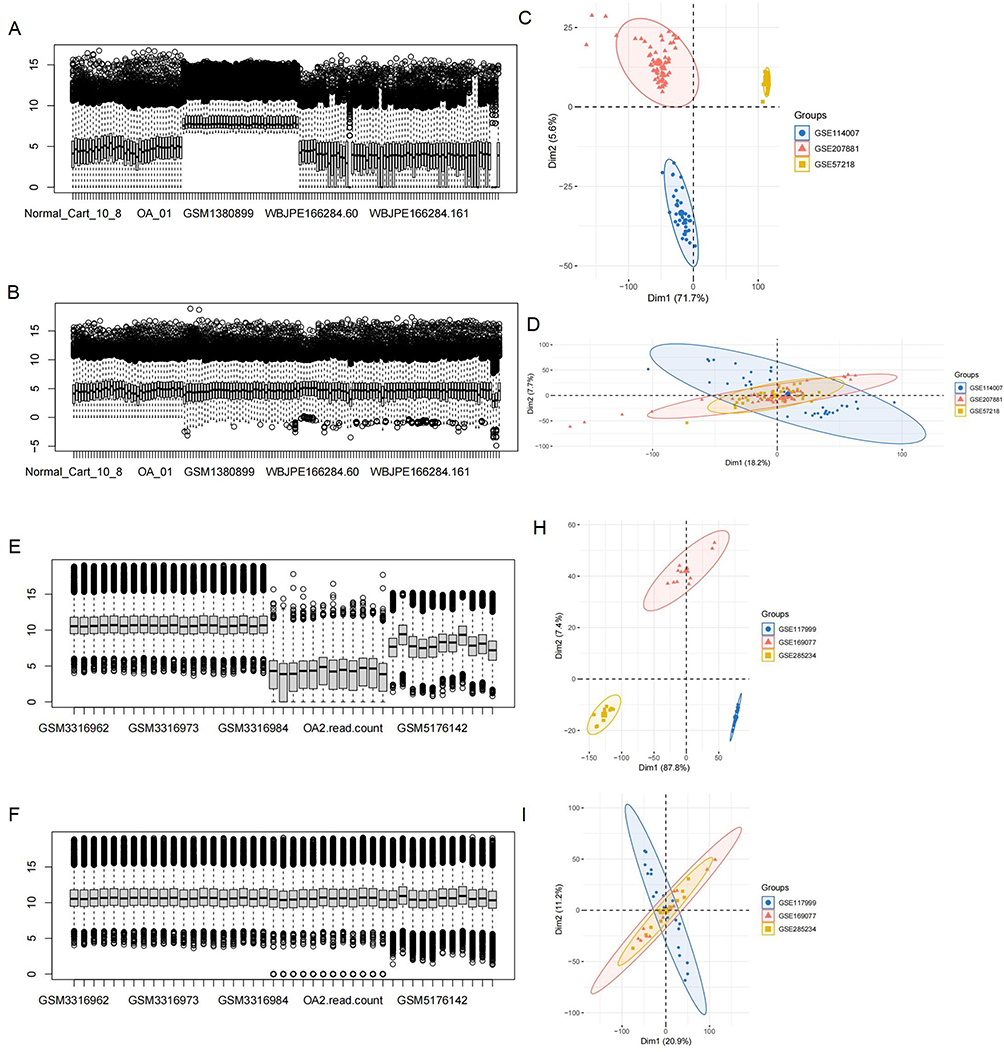 |
Figure 2 Data processing. (A) Pre-batch correction boxplot of training set. (B) Post-batch correction boxplot of training set. (C) PCA plot prior to batch correction (training set). (D) PCA plot following batch correction (training set). (E and F) Corresponding boxplots for the validation set before and after correction. (H and I) PCA plots for the validation set before and after batch correction. Post-correction analyses demonstrated reduced inter-batch variation. |
Identification of DEGs
The training set revealed 1,465 DEGs (415 downregulated and 1,050 upregulated) between normal and OA samples. A volcano plot visualized these DEGs (Figure 3A). Intersection analysis identified 56 DEGs-stemness genes (Figure 3B).
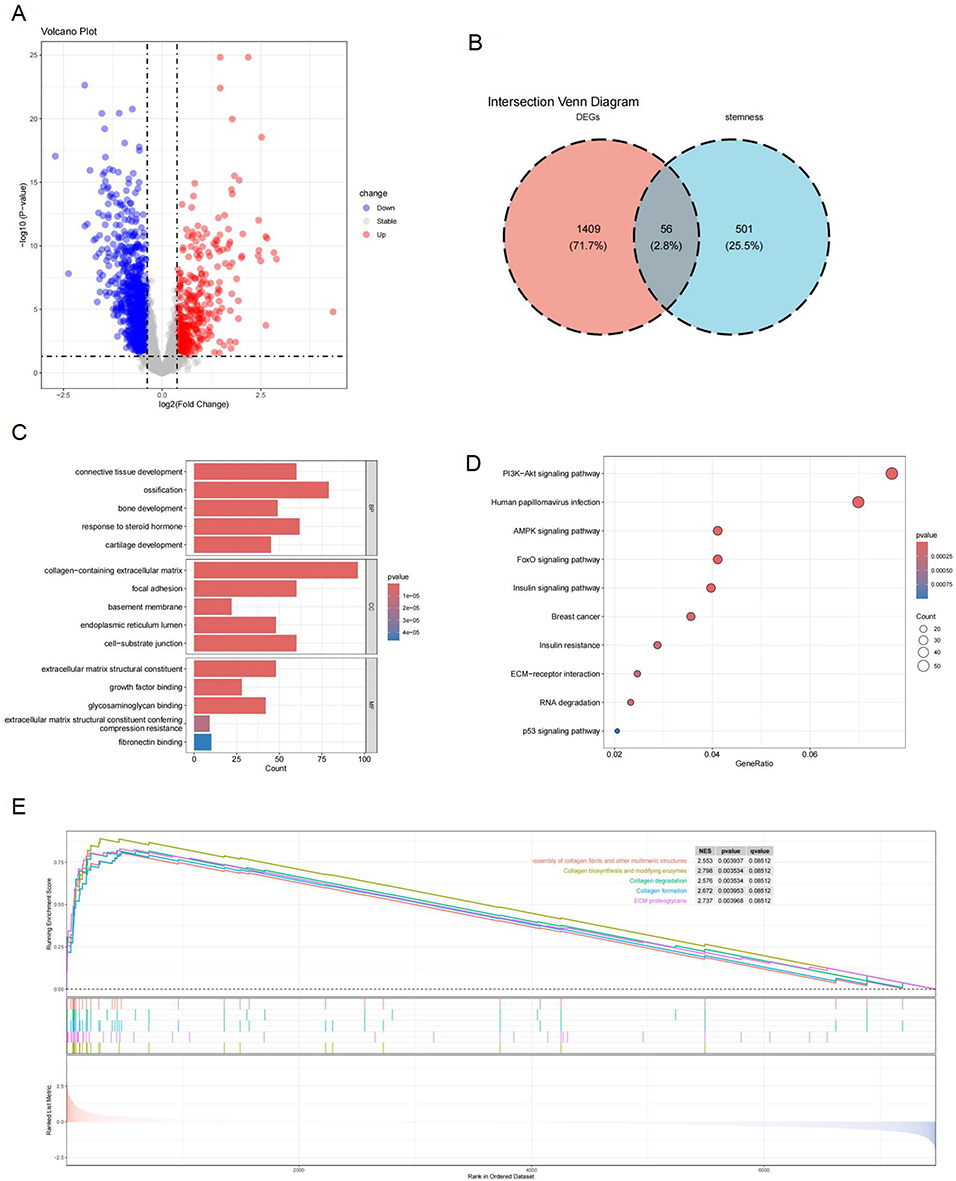 |
Figure 3 Functional enrichment analysis and DEG identification. (A) Volcano plot displaying DEGs. (B) Venn diagram showing DEGs-stemness genes intersection. (C) GO enrichment bar plot. (D) KEGG enrichment bubble plot. (E) GSEA results. Abbreviations: DEG, differentially expressed genes; GSEA, gene set enrichment analysis; GO, Gene Ontology; KEGG, Kyoto Encyclopedia of Genes and Genomes. |
Functional Enrichment Analysis of DEGs
To better understand the functions of the differentially expressed OA-related genes, GO and KEGG pathway functional enrichment analyses were performed. The GO analysis revealed the primary roles of these genes in biological processes (BP), cellular components (CC), and molecular functions (MF). In BP, the DEGs were enriched in ossification, response to steroid hormone, and connective tissue development. In CC, they were significantly enriched in extracellular matrix components containing collagen, focal adhesion sites, and cell-substrate attachment structures. In MF, the DEGs were linked to structural components of the extracellular matrix, glycosaminoglycan binding, and growth factor binding (Figure 3C). KEGG enrichment analysis indicated that the DEGs were primarily enriched in the phosphatidylinositol 3-kinase (PI3K)-Akt signaling cascade, pathways related to human papillomavirus (HPV) infection, AMP-activated protein kinase (AMPK) signaling, and Forkhead box O (FoxO) signaling (Figure 3D).
GSEA enables a thorough and organized analysis of functional pathway and biological behavior disparities between groups utilizing entire gene expression datasets. By performing GSEA on the whole transcriptome, we observed significant activation of the Wnt, calcium, and transforming growth factor (TGF)-β signaling pathways, cell adhesion molecules, and ECM-receptor interactions in the OA group (Figure 3E). Functional and pathway enrichment analyses offer a comprehensive and structured insight into DEGs’ biological roles in OA, highlighting the critical involvement of the identified signaling pathways in OA development, cell function, and inflammation.
WGCNA Analysis
Sample clustering and scale-free topology fit index calculation were implemented utilizing the “WGCNA” package on the training set. At the soft threshold β=6, the network achieved a scale-free topology fit index of 0.85 (Figure 4A). Dynamic tree cutting identified 13 gene modules (Figure 4B). Module-trait correlation analysis revealed the MEpink module as most strongly associated with OA (r=0.52, p=2e-11) (Figure 4C), showing a marked association of module membership (MM) with gene significance (GS) (Figure 4D). Intersection analysis identified seven WGCNA-stemness genes from the MEpink module (Figure 4E).
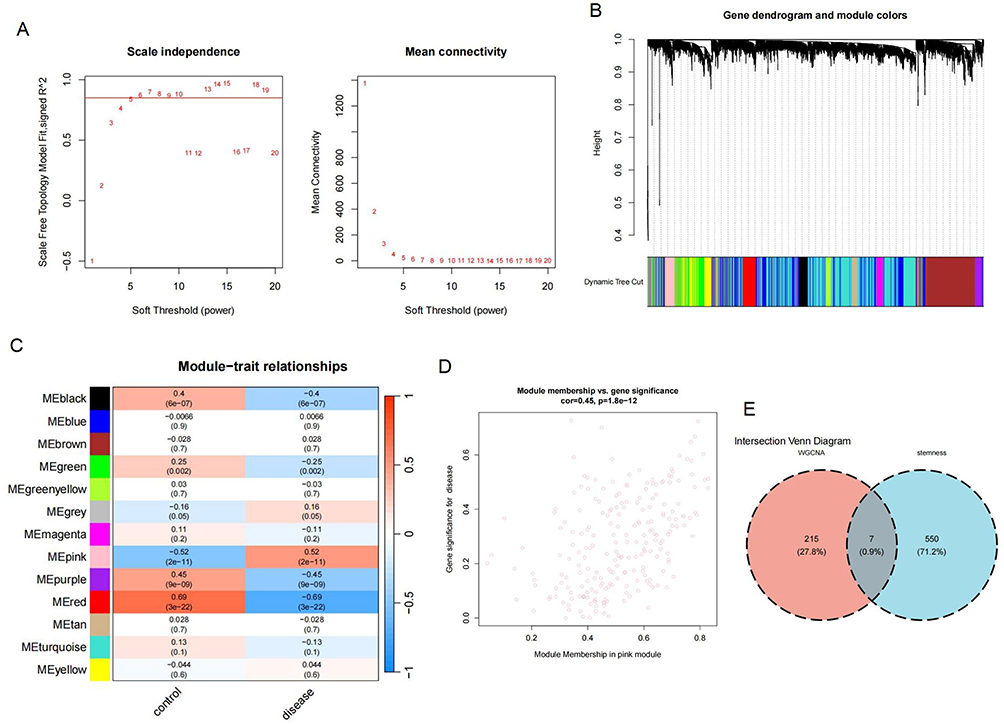 |
Figure 4 Development of WGCNA. (A) Scale-free topology fit index and average gene connectivity across varying soft-thresholding powers. (B) Hierarchical clustering dendrogram of genes according to topological overlap, with colors representing coexpression modules. (C) Module-trait relationship heatmap showing correlation and significance between modules and OA. The MEpink module exhibited the strongest correlation with OA. (D) Scatter plot of GS versus MM in the MEpink module. (E) Venn diagram illustrating the overlap between MEpink module genes and stemness genes. |
ML-Based Feature Gene Selection
Based on stemness-related genes identified through differential analysis and WGCNA, we employed an integrated multi-machine learning strategy for feature gene selection. First, LASSO regression was applied for initial dimensionality reduction, selecting 18 genes with relatively high predictive performance (Figure 5A and B). Subsequently, a SVM model was constructed to further refine the feature set by minimizing classification error and maximizing model accuracy, resulting in 9 core genes (Figure 5C and D).
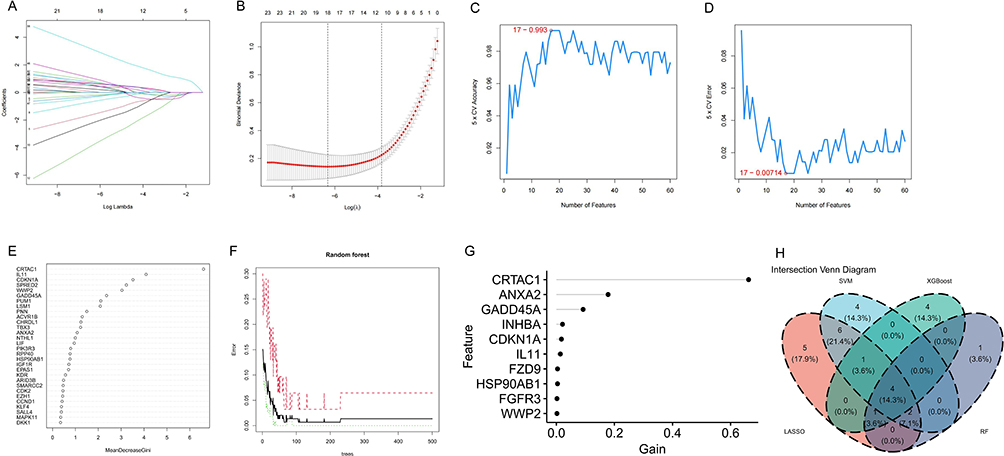 |
Figure 5 ML-based screening of feature genes. (A) LASSO regression coefficient distribution. (B) Log(λ) confidence intervals in the LASSO model. (C) SVM-RFE classification accuracy. (D) SVM-RFE error rate. (E) Importance ranking of 30 genes using MeanDecreaseGini values. (F) Relationship between RF trees and model error. (G) Feature importance from XGBoost. (H) Venn diagram of the four ML algorithms. |
To enhance the robustness and reproducibility of feature selection, XGBoost and RF algorithms were applied in parallel. For the RF model, 8 key genes were selected based on feature importance scores (importance score > 2), while for XGBoost, 10 key genes were identified according to feature gain values (gain > 0.001) (Figure 5E–G). These thresholds were pre-specified based on the distribution of feature importance within each model, ensuring that only features contributing significantly to predictive performance were retained, rather than arbitrarily selecting a fixed number of genes.
Finally, cross-validation across the four algorithms—LASSO, SVM, RF, and XGBoost—identified 4 representative feature genes that consistently showed stability across models: WWP2, CDKN1A, IL11, and CRTAC1 (Figure 5H).
Diagnostic Value of the Characteristic Gene Set
This study systematically evaluated the diagnostic and prognostic potential of four feature genes (WWP2, CDKN1A, IL11, and CRTAC1) in OA. In the training set, all four genes exhibited significant expression differences between normal and OA samples (Figure 6A), with individual AUC values exceeding 0.700. A logistic regression model constructed based on these feature genes demonstrated superior diagnostic performance (AUC = 0.985; Figure 6B and E).
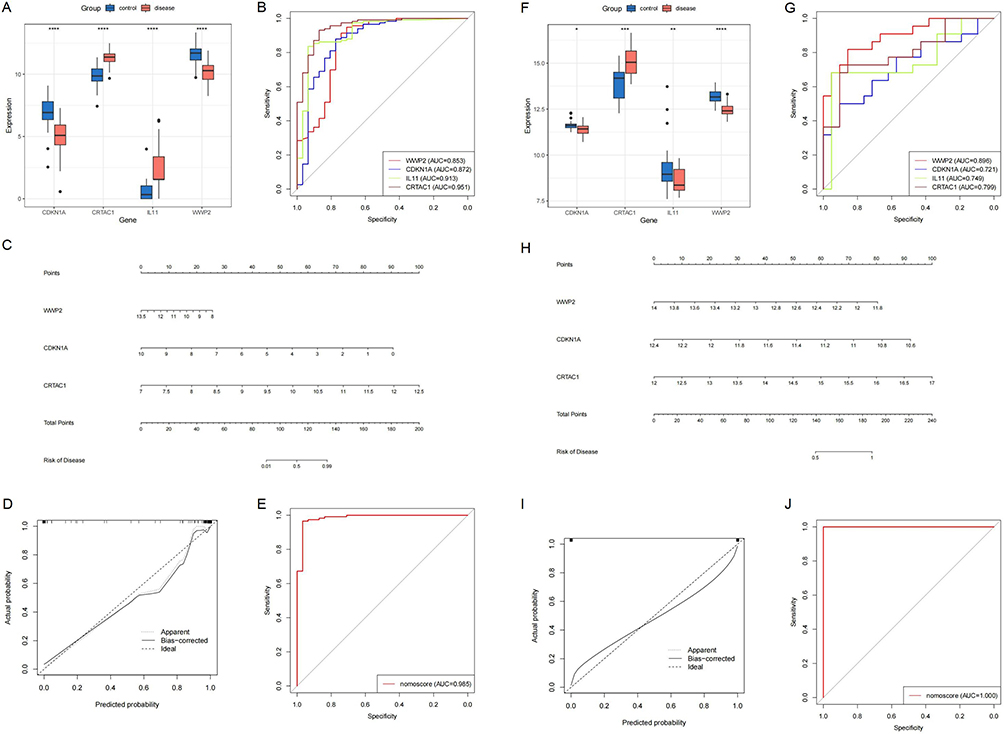 |
Figure 6 Development and assessment of the OA diagnostic model using stemness-associated biomarkers. (A) Differential expression analysis of characteristic genes (training set). (B) AUC values of characteristic genes (training set). (C) Nomogram model (training set). (D) Calibration curve (training set). (E) AUC value of the diagnostic model (training set). (F) Differential expression analysis of characteristic genes (validation set). (G) AUC values of characteristic genes (validation set). (H) Nomogram model (validation set). (I) Calibration curve (validation set). (J) AUC value of the diagnostic model (validation set). |
In the independent validation set, the differential expression patterns of these four genes were further confirmed (Figure 6F). Among them, WWP2, CDKN1A, and CRTAC1 showed consistent expression trends in OA individuals. All genes retained strong diagnostic value in the validation cohort (AUC > 0.700), and the logistic regression model achieved optimal predictive performance (AUC = 1.000; Figure 6G and J). Furthermore, calibration curves (Figure 6D and I) and a nomogram model (Figure 6C and H) constructed based on three key genes (WWP2, CDKN1A, and CRTAC1) demonstrated favorable predictive accuracy, goodness-of-fit, and potential clinical applicability, providing a reliable quantitative tool for OA risk assessment.
To further comprehensively evaluate the predictive performance and robustness of the model, multiple complementary metrics were applied, including AUPRC, F1 score, balanced accuracy, and MCC, as well as sensitivity and specificity. As shown in Table 2, the model maintained stable and consistent performance across these stringent evaluation criteria.
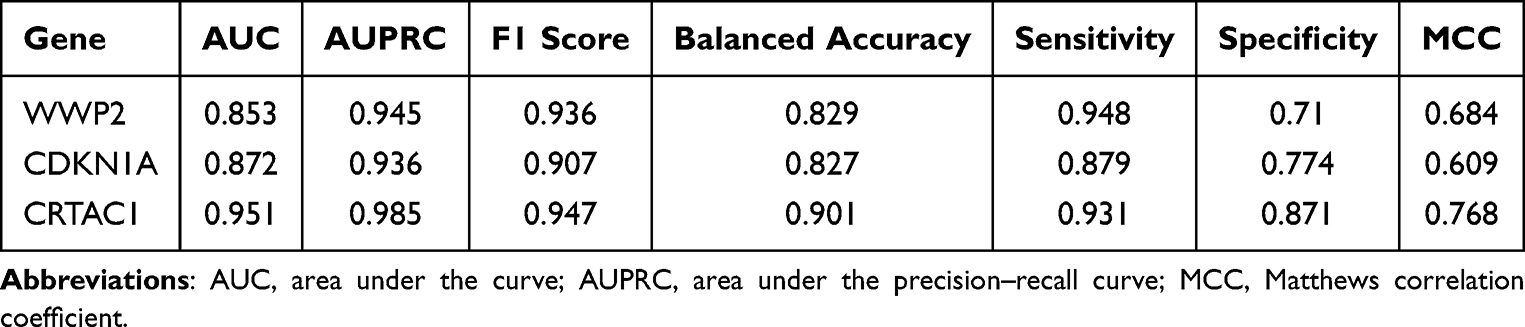 |
Table 2 Diagnostic Performance of Individual Feature Genes Evaluated Using Multiple Classification Metrics |
Specifically, all feature genes achieved high AUPRC values (0.936–0.985), indicating that the strong diagnostic performance was not an artifact of class imbalance but reflected a favorable balance between precision and recall. The balanced accuracy ranged from 0.827 to 0.901, suggesting robust classification performance across both majority and minority classes. In terms of classification characteristics, the model exhibited high sensitivity (0.879–0.948), indicating effective identification of OA samples, while specificity also remained at a relatively high level (0.710–0.871), reflecting reliable discrimination of normal samples. Consistently positive and substantial MCC values (0.609–0.768) further confirmed the overall reliability and stability of the predictive model when accounting for true and false classifications.
Notably, CRTAC1 demonstrated the most prominent overall performance, with an MCC of 0.768 and an AUPRC of 0.985, highlighting its superior classification consistency and stability and further underscoring its potential clinical utility as a biomarker for OA.
Immune Infiltration Analysis
Using the ssGSEA algorithm, we observed significantly lower infiltration of memory and immature B cells, eosinophils, Th17 cells, CD56dim NK cells, activated CD4 T, CD8 T, and B cells, central memory CD8 T cells, and Th1 cells in OA samples, while gamma delta T cells, immature dendritic cells, regulatory T cells, and effector memory CD4 T cells showed marked increases (Figure 7A and B).
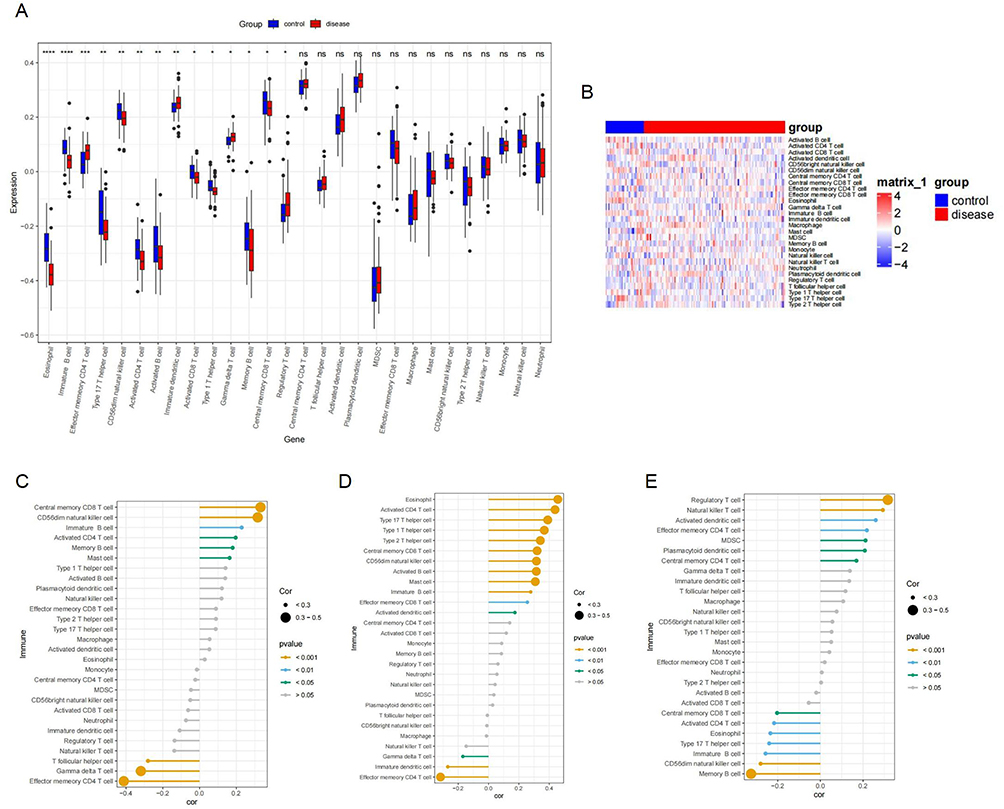 |
Figure 7 Assessment of immune cell infiltration using ssGSEA. (A) Box plot showing the infiltration levels of 28 immune cell types in normal cartilage and OA cartilage samples. (B) Clustered heatmap displaying the differential abundance of 28 immune cell populations in normal versus OA cartilage tissues. (C) Association of immune cell infiltration with WWP2 expression levels. (D) Association of CDKN1A expression with infiltrating immune cells. (E) Correlation between CRTAC1 expression and immune cell abundance. Significance levels: *P < 0.05, **P < 0.01, ***P < 0.001. |
Furthermore, the association of the expression levels of WWP2, CDKN1A, and CRTAC1 with immune cell infiltration was examined. Correlation analysis indicated that WWP2 expression was positively correlated with central memory CD8 T cells and CD56dim natural killer cells, and inversely linked to effector memory CD4 T cells and gamma delta T cells (Figure 7C). CDKN1A showed positive correlations with eosinophils, activated CD4 T cells, type 17 T helper cells, type 1 T helper cells, type 2 T helper cells, central memory CD8 T cells, CD56dim natural killer cells, activated B cells, and mast cells, while exhibiting a negative correlation with effector memory CD4 T cells (Figure 7D). CRTAC1 expression demonstrated an inverse relationship with memory B cells and a positive association with regulatory T cells (Figure 7E).
Immunohistochemistry (IHC) Staining for Verification of OA Biomarker Expression in Cartilage Tissue
Initial histological evaluation of cartilage from control and OA groups was conducted using H&E staining and Safranin O-Fast green staining, with lesion severity assessed via the OARSI scoring system (Figure 8A and B). The normal group displayed preserved cartilage architecture, while the OA group showed marked degeneration, including erosion of the superficial articular cartilage, decreased chondrocyte numbers, disorganized cell arrangement and loss of proteoglycans.
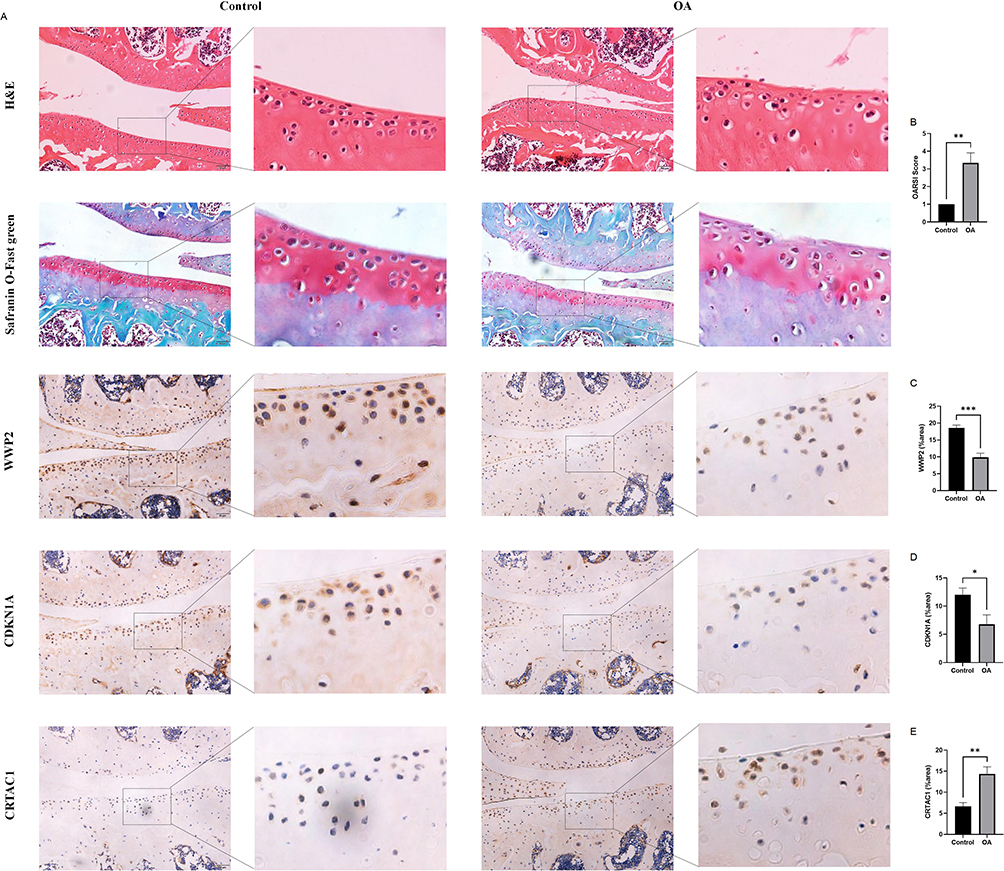 |
Figure 8 Validation of biomarkers. (A) H&E staining, Safranin O-Fast green staining and immunohistochemical analysis of WWP2, CDKN1A, and CRTAC1 in two groups. (B) OARSI scores of mouse knee joints in two groups. (C) Quantitative analysis of WWP2 expression in two groups. (D) Quantitative analysis of CDKN1A expression in two groups. (E) Quantitative analysis of CRTAC1 expression in two groups. Scale bar = 50 μm. Statistical significance: *P < 0.05, **P < 0.01, and ***P < 0.001. |
To confirm the protein abundance of OA-related biomarkers in cartilage tissue, IHC was performed to examine group-specific differences in key marker expression. The IHC results demonstrated that, compared to the normal group, the expression of WWP2 and CDKN1A was significantly downregulated in OA cartilage (Figure 8A, C and D), while CRTAC1 expression was markedly upregulated (Figure 8A and E). These findings align with the molecular trends predicted by our earlier bioinformatics analysis.
Discussion
This study aims to systematically identify key biomarkers associated with chondrocyte stemness in OA. By integrating multi-omics data and applying machine learning approaches, we analyzed OA cartilage from genetic, functional, and immune infiltration perspectives, and identified three prominently upregulated feature genes. These genes not only exhibit strong diagnostic potential but may also play crucial roles in OA pathogenesis, providing novel candidate targets for early diagnosis and intervention.
A total of 1,465 DEGs were identified, with 56 overlapping stemness-related genes. WGCNA analysis revealed seven hub genes associated with stemness. Functional enrichment suggested their involvement in immune-inflammatory pathways. Merging these gene sets yielded 60 candidate genes. Using four ML algorithms (LASSO, SVM, XGBoost, and RF), four diagnostic markers: WWP2, CDKN1A, IL11, and CRTAC1 were detected. The logistic regression model constructed using these genes exhibited excellent diagnostic accuracy, with AUC values of 1.000 (validation set) and 0.985 (training set). Notably, WWP2, CDKN1A, and CRTAC1 exhibited consistent dysregulation in OA. A nomogram model incorporating these genes demonstrated strong predictive accuracy, clinical applicability, and goodness-of-fit, establishing it as a reliable OA risk assessment tool. These findings highlight the diagnostic potential of WWP2, CDKN1A, and CRTAC1 in OA.
WWP2 is a WW domain-containing E3 ubiquitin ligase belonging to the C2-WW-HECT (NEDD4) family, which regulates multiple biological processes via ubiquitination.25 Research demonstrates that WWP2 contributes significantly to OA pathophysiology, with its transcriptional levels in cartilage being epigenetically regulated.26,27 Mokuda et al28 discovered that WWP2 expression is significantly downregulated in human OA cartilage, consistent with our findings. WWP2 levels were markedly reduced in OA samples than in normal ones. Mechanistically, WWP2 interacts with SOX9, translocating to the nucleus and modulating SOX9 transcriptional activity.29 Notably, while certain risk alleles are linked to elevated WWP2 expression in human cartilage, WWP2 knockout (KO) in mouse models of age-related and surgically induced OA increases catabolic markers (eg, RUNX2, ADAMTS5).28 Additionally, WWP2 is identified as the host gene of microRNA-140 (miR-140), which is abundantly expressed in cartilage tissue and is differentially regulated in preserved versus damaged OA cartilage.27 Evidence suggests a potential synergistic relationship between miR-140 and the C-terminal WWP2 transcript (WWP2-C/isoform 2).30 Current research on WWP2 and cell stemness remains limited, warranting further investigation.
The CDKN1A gene encodes p21/WAF1/CIP1, a cyclin-dependent kinase inhibitor and major downstream effector of p53, which controls cell cycle advancement by inhibiting CDKs.31,32 Under normal conditions, CDKN1A is highly expressed in non-proliferating adult chondrocytes, suggesting a role in maintaining cartilage homeostasis.33 In OA, its downregulation may disrupt cell cycle control, impairing cartilage stability and repair.33 CDKN1A-KO OA mice exhibit severe pathology, including increased osteoclast invasion and elevated MMP expression.34 Notably, CDKN1A levels negatively correlate with chondrogenic potential—p21 deletion enhances cartilage formation in adult35 and pluripotent36 stem cells. CDKN1A-KO mice show enhanced auricular cartilage regeneration37 and spontaneous full-thickness cartilage repair.38 Additionally, CDKN1A expression is inversely correlated with the chondrogenic capacity of synovial MSCs.35 In the current study, CDKN1A was substantially downregulated in OA compared to normal controls.
CRTAC1 (cartilage acidic protein 68/tenascin-like protein) is a cartilage-specific extracellular matrix protein serving as a biomarker for chondrocytes, osteoblasts, and mesenchymal stem cells.39 Studies show that plasma CRTAC1 levels strongly correlate with OA progression, functioning not only as a predictive biomarker40–43 but also improving diagnostic accuracy when combined with aggrecan and neurocan.42 Mechanistically, CRTAC1 is upregulated by pro-inflammatory cytokines (IL-1β, TNF-α)44 and may mediate inflammation, promoting cartilage catabolism while suppressing anabolism.45 Notably, CRTAC1 exhibits sex-specific effects in OA: its deletion prevents OA progression in female mice but not males,45 and elevated plasma levels significantly associate with total joint replacement risk in postmenopausal women,46 indicating its promise as a precision treatment target for female OA. Additionally, CRTAC1 predicts outcomes of autologous chondrocyte implantation,47 highlighting its prognostic value. Future studies should validate its predictive role in male populations and explore its utility in preoperative screening to identify high-risk patients and optimize treatment strategies.47,48
Despite the strong performance of the diagnostic model developed in this study, several limitations remain. First, multiple OA cartilage datasets were integrated to enhance statistical power. Although batch effect correction was applied to mitigate technical differences, residual heterogeneity among samples may still affect expression consistency, and such integration may inadvertently suppress biologically relevant signals. Second, this study primarily relied on publicly available datasets, with a limited sample size, potentially restricting statistical robustness and reproducibility. Therefore, larger population cohorts and carefully designed prospective studies are warranted to validate these findings. Moreover, in vivo experimental validation was limited to IHC analysis in a small number of mice. Given the heterogeneity of cartilage degeneration, sampling bias may influence biomarker expression across different samples.
Methodologically, to reduce algorithmic bias from relying on a single model and improve the robustness of candidate gene selection, multiple ML algorithms were applied in parallel rather than a single approach. To address potential complexity and overfitting associated with multi-algorithm strategies, an intersection-based gene selection approach was further employed, enhancing the consistency and interpretability of the selected genes. Unlike previous studies that relied solely on single stemness analyses or simple consensus strategies, this study established a multidimensional screening framework constrained by stemness features, integrating differential expression, stemness relevance, and immune-related characteristics during candidate gene selection. This strategy not only improves the stability of the results but also reinforces their biological relevance, providing a scalable approach for systematically identifying key genes with both stemness regulatory potential and immunological significance.
Clinically, prior studies mainly focused on late-stage knee osteoarthritis patients (Kellgren–Lawrence grades 3–4) who respond poorly to hyaluronic acid (HA) treatment.49 This population predominantly comprises elderly individuals with limited conservative treatment options and a higher likelihood of requiring early surgical intervention. Our results indicate that intra-articular injection of carboxymethyl-chitosan (CM-C) can significantly improve short-term pain and functional outcomes, although its efficacy gradually diminishes over time, suggesting that CM-C is more likely to serve as a temporary or bridging therapy rather than a long-term standalone treatment. In this context, precisely defining the “difficult-to-treat” OA patient population is crucial for exploring molecular biomarkers with predictive and stratification value.
Based on our findings, stemness-related biomarkers (eg, WWP2, CDKN1A, and CRTAC1) show potential clinical applications in this specific patient population, including identifying individuals who respond poorly to conventional viscoelastic supplementation, selecting candidates more suitable for regenerative medicine or biomaterial-based interventions (such as CM-C), and dynamically monitoring therapeutic response to guide the optimal timing of repeat interventions. Future studies could systematically associate these gene features and their related immune infiltration patterns with clinical outcome metrics under CM-C or similar treatments (eg, pain relief, functional improvement, and delayed surgery), thereby facilitating a shift from empirically driven to phenotype-driven personalized management of knee OA. Within this framework, individualized therapy encompasses not only the precise selection of non-surgical interventions but also optimization of retreatment intervals to maximize the benefits of conservative therapy and improve overall patient quality of life.
In conclusion, WWP2, CDKN1A, and CRTAC1 may serve as potential candidate biomarkers for OA, providing new references for early diagnosis and mechanistic studies. However, given the limited sample size and the lack of extensive functional validation, they are not yet ready for direct application in clinical decision-making or individualized therapy. Future work should integrate larger population cohorts, systematic in vitro and in vivo mechanistic studies, and prospective clinical validation to fully assess the robustness and potential translational value of these genes.
Conclusion
Through bioinformatics and ML approaches, this study identified three key stemness-associated genes (WWP2, CDKN1A, and CRTAC1) in OA and constructed a performance logistic regression diagnostic model using these genes. The current study highlights these genes’ differential expression in OA tissues and suggests their possible involvement in the immune microenvironment. These observations may enhance the comprehension of molecular pathways involved in OA pathogenesis. They could also point to possible avenues for identifying biomarkers for early detection or exploring therapeutic targets. Further validation is warranted in future studies.
Abbreviations
ACL, anterior cruciate ligament; AUC, area under the curve; AUPRC, area under the precision–recall curve; BP, biological processes; CC, cellular components; CM-C, carboxymethyl-chitosan; DEGs, differentially expressed genes; ECM, extracellular matrix; FGF18, fibroblast growth factor 18; GEO, Gene Expression Omnibus; GO, Gene Expression Omnibus; GS, gene significance; GSEA, Gene Set Enrichment Analysis; H&E, hematoxylin and eosin; IHC, immunohistochemistry; KEGG, Kyoto Encyclopedia of Genes and Genomes; KO, knockout; LASSO, least absolute shrinkage and selection operator; MCC: Matthews correlation coefficient; MF, molecular functions; ML, machine learning; MM, module membership; NFAT1, Nuclear Factor of Activated T-cells 1; OA, osteoarthritis; OARSI, Osteoarthritis Research Society International; RF, random forest; ROC, receiver operating characteristic; ssGSEA, single-sample gene set enrichment analysis; SVM, support vector machine; WGCNA, weighted gene co-expression network analysis; XGBoost, extreme gradient boosting.
Data Sharing Statement
The original data of the study are appended to the article. Further inquiries can be addressed directly to the corresponding author.
Ethics Statement
The animal data involved in this study were approved by the Scientific Research Ethics Committee of the Second Hospital of Hebei Medical University (Approval No: 2024-AE389) and strictly adhered to the ARRIVE guidelines. The human data used are publicly available and, in accordance with Article 32 of China’s “Measures for Ethical Review of Life Science and Medical Research Involving Humans,” are exempt from ethical review.
Author Contributions
Siyi Xie: Writing – original draft, Conceptualisation, Writing – review and editing. Meiling Liu: Data curation, Writing – review and editing. Yuzhong Wang and Shuxing Cao: Methodology, Writing – review and editing. Yiming Yang, Ruixue Chen and Tianlin Gao: Formal Analysis, Writing–review and editing. Jun Ma: Investigation, Writing–review and editing. Zhe Lv: Supervision, Writing–review and editing. Yongzhou Song: Supervision, Funding acquisition, Writing–review and editing. All authors gave final approval of the version to be published; have agreed on the journal to which the article has been submitted; and agree to be accountable for all aspects of the work.
Funding
The work was supported by grants from Hebei Province Key R&D Plan Project (No. 22377752D), the Innovation & Development Medical Cooperation Program of Hengrui-Hebei (No. HR202502049), Medical Science Research Project of Hebei Province (No. 20210934; No. 20230486), He bei Governmental Project for Outstanding Clinical Researcher (No. ZF2024052).
Disclosure
The authors have no relevant financial or non-financial interests to disclose.
References
1. Cui A, Li H, Wang D, Zhong J, Chen Y, Lu H. Global, regional prevalence, incidence and risk factors of knee osteoarthritis in population-based studies. EClinicalMedicine. 2020;29–30:100587. doi:10.1016/j.eclinm.2020.100587
2. Hunter DJ, Bierma-Zeinstra S. Osteoarthritis. Lancet. 2019;393(10182):1745–17. doi:10.1016/s0140-6736(19)30417-9
3. Collaborators GBD. Global, regional, and National Burden of osteoarthritis, 1990–2020 and Projections to 2050: a Systematic Analysis for the Global Burden of Disease Study 2021. Lancet Rheumatol. 2023;5(9):e508–e522. doi:10.1016/s2665-9913(23)00163-7.
4. Kolasinski SL, Neogi T, Hochberg MC, et al. American College of Rheumatology/Arthritis Foundation Guideline for the Management of Osteoarthritis of the Hand, Hip, and Knee. Arthritis Rheumatol. 2020;72(2):220–233. doi:10.1002/art.41142
5. Katz JN, Arant KR, Loeser RF. Diagnosis and treatment of Hip and knee osteoarthritis. JAMA. 2021;325(6):568–578. doi:10.1001/jama.2020.22171
6. Lanza RP, Atala A. Essentials of Stem Cell Biology. Elsevier-Academic Press, Cop; 2014.
7. Pretzel D, Linss S, Rochler S, et al. Relative percentage and zonal distribution of mesenchymal progenitor cells in human osteoarthritic and normal cartilage. Arthritis Res Ther. 2011;13(2):R64. doi:10.1186/ar3320
8. Fickert S, Fiedler J, Brenner RE. Identification of subpopulations with characteristics of mesenchymal progenitor cells from human osteoarthritic cartilage using triple staining for cell surface markers. Arthritis Res Ther. 2004;6(5):R422. doi:10.1186/ar1210
9. Rikkers M, Korpershoek JV, Levato R, Malda J, Yang X. Progenitor Cells in Healthy and Osteoarthritic Human Cartilage Have Extensive Culture Expansion Capacity while Retaining Chondrogenic Properties. Cartilage. 2021;13(2_suppl):129S–142S. doi:10.1177/19476035211059600
10. Mazor M, Lespessailles E, Best TM, Ali M, Toumi H. Gene Expression and Chondrogenic Potential of Cartilage Cells: osteoarthritis Grade Differences. Int J Mol Sci. 2022;23(18):10610. doi:10.3390/ijms231810610
11. Schminke B, Miosge N. Cartilage Repair In Vivo: the Role of Migratory Progenitor Cells. Curr Rheumatol Rep. 2014;16(11). doi:10.1007/s11926-014-0461-4
12. De luca P, Kouroupis D, Viganò M, et al. Human Diseased Articular Cartilage Contains a Mesenchymal Stem Cell-Like Population of Chondroprogenitors with Strong Immunomodulatory Responses. J Clin Med. 2019;8:423. doi:10.3390/jcm8040423
13. Caldwell KL, Wang J. Cell-based articular cartilage repair: the link between development and regeneration. Osteoarthritis Cartilage. 2015;23:351–362. doi:10.1016/j.joca.2014.11.004
14. Moore EE, Bendele AM, Thompson DL, et al. Fibroblast growth factor-18 stimulates chondrogenesis and cartilage repair in a rat model of injury-induced osteoarthritis. Osteoarthritis Cartilage. 2005;13:623–631. doi:10.1016/j.joca.2005.03.003
15. Gigout A, Guehring H, Froemel D, et al. Sprifermin (rhFGF18) enables proliferation of chondrocytes producing a hyaline cartilage matrix. Osteoarthritis Cartilage. 2017;25:1858–1867. doi:10.1016/j.joca.2017.08.004
16. Yu J, Xiao L, Yan Z, et al. Integrated analysis of the transcriptome and proteome reveals that ABI3BP is involved in the pathogenesis of osteoarthritis. J Proteomics. 2025;323:105554. doi:10.1016/j.jprot.2025.105554
17. Zhao D, Zeng L, Liang G, et al. Transcriptomic analyses and machine-learning methods reveal dysregulated key genes and potential pathogenesis in human osteoarthritic cartilage. Bone Joint Res. 2024;13(2):66–82. doi:10.1302/2046-3758.132.bjr-2023-0074.r1
18. Leek JT, Johnson WE, Parker HS, Jaffe AE, Storey JD. The sva package for removing batch effects and other unwanted variation in high-throughput experiments. Bioinformatics. 2012;28(6):882–883. doi:10.1093/bioinformatics/bts034
19. Yu G, Wang LG, Han Y, He QY. clusterProfiler: an R Package for Comparing Biological Themes Among Gene Clusters. OMICS. 2012;16(5):284–287. doi:10.1089/omi.2011.0118
20. Tibshirani R. Regression shrinkage and selection via the lasso: a retrospective. J R Stat Soc Series B Stat Methodol. 2011;73:273–282. doi:10.1111/j.1467-9868.2011.00771.x
21. Lin X, Li C, Zhang Y, Su B, Kuang Y, Wei H. Selecting Feature Subsets Based on SVM-RFE and the Overlapping Ratio with Applications in Bioinformatics. Molecules. 2017;23:52. doi:10.3390/molecules23010052
22. Chen T, Guestrin C XGBoost: a Scalable Tree Boosting System.
23. Motamedi F, Pérez-Sánchez H, Mehridehnavi A, Fassihi A, Ghasemi F. Accelerating Big Data Analysis through LASSO-Random Forest Algorithm in QSAR Studies. Bioinformatics. 2022;38:469–475. doi:10.1093/bioinformatics/btab659
24. Glasson SS, Chambers MG, Van Den Berg WB, Little CB. The OARSI histopathology initiative – recommendations for histological assessments of osteoarthritis in the mouse. Osteoarthritis Cartilage. 2010;18(3):S17–S23. doi:10.1016/j.joca.2010.05.025
25. Wang X, Ma L, Zhang S, Song Q, He X, Wang J. WWP2 ameliorates oxidative stress and inflammation in atherosclerotic mice through regulation of PDCD4/HO-1 pathway. Acta Biochim Biophys Sin (Shanghai). 2022;54(8):1057–1067. doi:10.3724/abbs.2022091
26. den Hollander W, Ramos YFM, Bomer N, et al. Transcriptional Associations of Osteoarthritis-Mediated Loss of Epigenetic Control in Articular Cartilage. Arthritis Rheumatol. 2015;67(8):2108–2116. doi:10.1002/art.39162
27. de Almeida RC, Ramos YFM, Mahfouz A, et al. RNA sequencing data integration reveals an miRNA interactome of osteoarthritis cartilage. Ann Rheum Dis. 2019;78(2):270–277. doi:10.1136/annrheumdis-2018-213882
28. Mokuda S, Nakamichi R, Matsuzaki T, et al. Wwp2 maintains cartilage homeostasis through regulation of Adamts5. Nat Commun. 2019;10(1). doi:10.1038/s41467-019-10177-1
29. Nakamura Y, Yamamoto K, He X, et al. Wwp2 is essential for palatogenesis mediated by the interaction between Sox9 and mediator subunit 25. Nat Commun. 2011;2(1). doi:10.1038/ncomms1242
30. Rice SJ, Beier F, Young DA, Loughlin J. Interplay between genetics and epigenetics in osteoarthritis. Nat Rev Rheumatol. 2020;16(5):268–281. doi:10.1038/s41584-020-0407-3
31. Engeland K. Cell cycle regulation: p53-p21-RB signaling. Cell Death Differ. 2022;29(5):1–15. doi:10.1038/s41418-022-00988-z
32. Wade Harper J. The p21 Cdk-interacting protein Cip1 is a potent inhibitor of G1 cyclin-dependent kinases. Cell. 1993;75(4):805–816. doi:10.1016/0092-8674(93)90499-g
33. Gang X, Xu H, Si L, et al. Treatment effect of CDKN1A on rheumatoid arthritis by mediating proliferation and invasion of fibroblast-like synoviocytes cells. Clin Exp Immunol. 2018;194(2):220–230. doi:10.1111/cei.13161
34. Kihara S, Hayashi S, Hashimoto S, et al. Cyclin-Dependent Kinase Inhibitor-1-Deficient Mice Are Susceptible to Osteoarthritis Associated With Enhanced Inflammation. J Bone Miner Res. 2018;33(12):2242. doi:10.1002/jbmr.3613
35. Masson AO, Hess R, O’Brien K, et al. Increased levels of p21(CIP1/WAF1) correlate with decreased chondrogenic differentiation potential in synovial membrane progenitor cells. Mech Ageing Dev. 2015;149:31–40. doi:10.1016/j.mad.2015.05.005
36. Diekman BO, Thakore PI, O’Connor SK, et al. Knockdown of the Cell Cycle Inhibitor p21 Enhances Cartilage Formation by Induced Pluripotent Stem Cells. Tissue Eng Part A. 2014;21(7–8):1261–1274. doi:10.1089/ten.tea.2014.0240
37. Bedelbaeva K, Snyder A, Gourevitch D, et al. Lack of p21 expression links cell cycle control and appendage regeneration in mice. Proc Natl Acad Sci. 2010;107(13):5845. doi:10.1073/pnas.1000830107
38. Jablonski CL, Besler BA, Ali J, Krawetz RJ. p21−/− Mice Exhibit Spontaneous Articular Cartilage Regeneration Post-Injury. Cartilage. 2019;13(2_suppl):1608S–1617S. doi:10.1177/1947603519876348
39. Steck E, Bräun J, Pelttari K, Kadel S, Kalbacher H, Richter W. Chondrocyte secreted CRTAC1: a glycosylated extracellular matrix molecule of human articular cartilage. Matrix Biol. 2007;26(1):30–41. doi:10.1016/j.matbio.2006.09.006
40. Kang Z, Zhang J, Liu W, et al. Plasma Proteomic Profiles Predict Individual Future Osteoarthritis Risk. Arthritis Rheumatol. 2025;2025:43143. doi:10.1002/art.43143
41. Szilagyi IA, Vallerga CL, Boer CG, Schiphof D, Ikram MA, Sita. Plasma proteomics identifies CRTAC1 as a biomarker for osteoarthritis severity and progression. Lara D Veeken. 2022;62(3):1286–1295. doi:10.1093/rheumatology/keac415
42. Styrkarsdottir U, Lund SH, Thorleifsson G, et al. Cartilage Acidic Protein 1 in Plasma Associates With Prevalent Osteoarthritis and Predicts Future Risk as Well as Progression to Joint Replacements: results From the UK Biobank Resource. Arthritis Rheumatol. 2022;75(4):544–552. doi:10.1002/art.42376
43. Styrkarsdottir U, Lund SH, Saevarsdottir S, et al. The CRTAC1 Protein in Plasma Is Associated With Osteoarthritis and Predicts Progression to Joint Replacement: a Large-Scale Proteomics Scan in Iceland. Arthritis Rheumatol. 2021;73(11):2025–2034. doi:10.1002/art.41793
44. Li Y, Xu L, Olsen BR. Lessons from genetic forms of osteoarthritis for the pathogenesis of the disease. Osteoarthritis Cartilage. 2007;15(10):1101–1105. doi:10.1016/j.joca.2007.04.013
45. Ge X, Ritter SY, Tsang K, Shi R, Takei K, Aliprantis AO. Sex-Specific Protection of Osteoarthritis by Deleting Cartilage Acid Protein 1. PLoS One. 2016;11(7):e0159157. doi:10.1371/journal.pone.0159157
46. Garnero P, Gineyts E, Rousseau JC, Sornay-Rendu E, Chapurlat RD. Plasma Cartilage Acidic Protein 1 Measured by ELISA Is Associated With the Progression to Total Joint Replacement in Postmenopausal Women. J Rheumatol. 2023;51(2):176–180. doi:10.3899/jrheum.2023-0684
47. Hulme CH, Peffers MJ, Roberts S, Gallacher P, Jermin P, Wright KT. Proteomic Analyses of Autologous Chondrocyte Implantation Plasma Highlight Cartilage Acidic Protein 1 as a Candidate for Preclinical Screening. Am J Sports Med. 2023;51(6):1422–1433. doi:10.1177/03635465231156616
48. Ungsudechachai T, Honsawek S, Jittikoon J, Udomsinprasert W. Clusterin Is Associated with Systemic and Synovial Inflammation in Knee Osteoarthritis. Cartilage. 2020;13(1_suppl):1557S–1565S. doi:10.1177/1947603520958149
49. Manocchio N, Pirri C, Ljoka C, et al. Long-Term Efficacy of Carboxymethyl-Chitosan in Advanced Knee Osteoarthritis: a Twelve-Month Follow-Up Study on Non-Responders to Hyaluronic Acid. Biomedicines. 2025;13:270. doi:10.3390/biomedicines13020270
 © 2026 The Author(s). This work is published and licensed by Dove Medical Press Limited. The
full terms of this license are available at https://www.dovepress.com/terms
and incorporate the Creative Commons Attribution
- Non Commercial (unported, 4.0) License.
By accessing the work you hereby accept the Terms. Non-commercial uses of the work are permitted
without any further permission from Dove Medical Press Limited, provided the work is properly
attributed. For permission for commercial use of this work, please see paragraphs 4.2 and 5 of our Terms.
© 2026 The Author(s). This work is published and licensed by Dove Medical Press Limited. The
full terms of this license are available at https://www.dovepress.com/terms
and incorporate the Creative Commons Attribution
- Non Commercial (unported, 4.0) License.
By accessing the work you hereby accept the Terms. Non-commercial uses of the work are permitted
without any further permission from Dove Medical Press Limited, provided the work is properly
attributed. For permission for commercial use of this work, please see paragraphs 4.2 and 5 of our Terms.
Recommended articles


The Level of Histone Deacetylase 4 is Associated with Aging Cartilage Degeneration and Chondrocyte Hypertrophy
Dong Z, Ma Z, Yang M, Cong L, Zhao R, Cheng L, Sun J, Wang Y, Yang R, Wei X, Li P
Journal of Inflammation Research 2022, 15:3547-3560
Published Date: 16 June 2022
Recent Advances in Reactive Oxygen Species (ROS)-Responsive Polyfunctional Nanosystems 3.0 for the Treatment of Osteoarthritis
Ding DF, Xue Y, Wu XC, Zhu ZH, Ding JY, Song YJ, Xu XL, Xu JG
Journal of Inflammation Research 2022, 15:5009-5026
Published Date: 31 August 2022
Effects of Immune Cells and Cytokines on Different Cells in OA
Luo P, Yuan Q, Wan X, Yang M, Xu P
Journal of Inflammation Research 2023, 16:2329-2343
Published Date: 30 May 2023
The Hippo-YAP Signaling Pathway in Osteoarthritis and Rheumatoid Arthritis
Li M, Zhang FJ, Bai RJ
Journal of Inflammation Research 2024, 17:1105-1120
Published Date: 19 February 2024
Comprehensive Analysis of Programmed Cell Death-Related Genes in Diagnosis and Synovitis During Osteoarthritis Development: Based on Bulk and Single-Cell RNA Sequencing Data
Zhou J, Jiao S, Huang J, Dai T, Xu Y, Xia D, Feng Z, Chen J, Li Z, Hu L, Meng Q
Journal of Inflammation Research 2025, 18:751-778
Published Date: 17 January 2025