")
Back to Journals » Journal of Hepatocellular Carcinoma » Volume 10
Identification of a Novel Ferroptosis-Related Gene Signature for Predicting Prognosis and Responsiveness to Immunotherapy in Hepatocellular Carcinoma
Authors Wang Q, Wang B, Ma X, Zhuang H, Xie Z, Tang C , Tan W, Yang L, Shang C , Chen Y
Received 10 November 2022
Accepted for publication 25 December 2022
Published 10 January 2023 Volume 2023:10 Pages 1—16
DOI https://doi.org/10.2147/JHC.S395563
Checked for plagiarism Yes
Review by Single anonymous peer review
Peer reviewer comments 2
Editor who approved publication: Dr David Gerber
Qingbin Wang,1,2,* Bingkun Wang,1,2,* Xiaowu Ma,1,2 Hongkai Zhuang,1,2 Zhiqin Xie,1,2 Chenwei Tang,1,2 Wenliang Tan,1,2 Lei Yang,1,2 Changzhen Shang,1,2 Yajin Chen1,2
1Guangdong Provincial Key Laboratory of Malignant Tumor Epigenetics and Gene Regulation, Sun Yat-sen Memorial Hospital, Sun Yat-Sen University, Guangzhou, People’s Republic of China; 2Department of Hepatobiliary Surgery, Sun Yat-sen Memorial Hospital, Sun Yat-sen University, Guangzhou, People’s Republic of China
*These authors contributed equally to this work
Correspondence: Changzhen Shang; Yajin Chen, Department of Hepatobiliary Surgery, Sun Yat-sen Memorial Hospital, Sun Yat-sen University, Guangzhou, People’s Republic of China, Tel +86 13711279678, Email [email protected]; [email protected]
Purpose: Ferroptosis has been reported to regulate multiple biological behaviors. However, the prognostic and oncologic values of ferroptosis-related genes (FRGs) have not been comprehensively elucidated in hepatocellular carcinoma (HCC). Here, we aimed to construct FRGs-associated signature for stratification of the prognosis of HCC patients.
Methods: A list of FRGs was generated from FerrDb. Public databases were used to extract expression matrices and clinical information. TCGA cohort was randomly divided into a training set and a validation set. Prognostic signature for Overall Survival (OS) was established in training set and validated in internal cohorts (TCGA validation set and entire set) and external cohort (ICGC cohort). Additionally, the role of signature in HCC was well investigated by analysis of mutations, gene set enrichment analysis (GSEA), analysis of immune infiltrates, and analysis of response to immune checkpoint blockade (ICB) treatment. The oncogenic effects of ZFP69B on HCC were also investigated in vitro.
Results: We identified 12 FRGs-based signature for OS with LASSO regression. Patients were partitioned into different risk groups based on the signature. Overall, patients in different groups had different prognosis. The signature independently predicted OS in multivariate Cox regression analyses. Anti-tumor immune cells including activated CD8 T cells, cytolytic activity, and Th1 cells were negatively correlated with risk score in both TCGC and ICGC cohorts. Furthermore, low-risk patients responded better to ICB than high-risk patients. In addition, knockdown of ZFP69B reduced proliferation, migration, and invasion, and promoted erastin-induced ferroptosis of HCC cells.
Conclusion: We developed a prognostic signature based on FRGs to predict OS of HCC patients. And the signature may facilitate clinicians in identifying those who are likely to benefit from ICIs. The results also indicated that ZFP69B might regulate the process of ferroptosis and could be used as a novel potential target for HCC.
Keywords: ferroptosis, hepatocellular carcinoma, immunotherapy, overall survival, signature
Introduction
Liver cancer is the sixth most common cancer worldwide and has become the third leading cause of cancer-related deaths in 2020.1 Hepatocellular carcinoma (HCC), the most commonly diagnosed type of primary liver cancer, accounts for about 90% of all liver cancer cases.2 Despite considerable progress in HCC treatment such as surgical resection, liver transplantation and immune checkpoint inhibitors (ICIs) based therapy, prognosis of patients with HCC remains dismal. ICIs represent a promising treatment but only a small number of patients respond to immunotherapy.3 Therefore, it is an urgent need to identify new biomarkers or develop prognosis models for the prediction of OS and response to immunotherapy.
Ferroptosis is a novel type of regulatory cell death due to abnormal accumulation of lipid reactive oxygen species and iron overload.4 Inducing ferroptosis of tumor cells has been considered a promising therapeutic approach.5 Sorafenib, a first-line drug for advanced HCC patients, has shown the potential to induce ferroptosis. Ferroptosis is involved in the toxic effect of sorafenib on HCC cells and the resistance of HCC cells to sorafenib.6,7 Other therapeutic agents, including low-density lipoprotein docosahexaenoic acid nanoparticles and haloperidol, also promote ferroptosis in HCC cells.8,9 Some progress has been made in elucidating the regulatory mechanism of ferroptosis in HCC. The activation of p62-Keap1-Nrf2 pathway up-regulates ferritin heavy chain 1 (FTH1), which inhibits ferroptosis in HCC cells by accumulating and transporting Fe2+.10 As a negative regulator of ferroptosis, Metallothionein-1G could increase sorafenib resistance of HCC cells and ultimately lead to poor prognosis for patients with HCC.6 Liang et al built a FRGs-based signature for HCC patients based on only 60 FRGs, with AUC of 0.8 and 0.668 for 1- and 3-year.11 Similarly, Du et al integrated 2483 immunity-related genes (IRGs) with only 60 FRGs to build a prognostic signature for HCC.12 A recent study constructed a signature predicting the prognosis of HCC patients from 279 FRGs and 952 IRGs.13 However, its signature contained many genes (n = 27), limiting its role in clinical practice. Previous studies investigating FRG-related signatures have mainly focused on elucidating the prognostic predictive performance of the prognostic signatures. However, they lack clinical utility and experimental validation.
In this study, through multiple bioinformatics analyses, a novel prognostic signature for OS was established, validated, and comprehensively investigated in HCC. In this signature, we identified ZFP69B as the key predictor of prognosis based on regression coefficients. And the oncogenic effects of ZFP69B on HCC were also explored.
Materials and Methods
Data Acquisition
The work flow is shown in Figure S1. Firstly, from the Cancer Genome Atlas (TCGA, https://portal.gdc.cancer.gov/), we obtained the RNA-sequencing data (FPKM) of 374 HCC and 50 normal samples. Clinicopathological data were obtained from the cBioPortal (https://www.cbioportal.org/). After excluding patients with missing OS or OS < 3 days and metastatic samples, we obtained TCGA cohort (n = 364) for further analysis. External dataset (n = 230) was derived from the ICGC data portal (https://dcc.icgc.org/). Based on the FerrDb database, we defined genes promoting or preventing ferroptosis and demonstrated the occurrence of ferroptosis as FRGs.14
Differentially Expressed Analysis and Univariate Cox Regression
We extracted expression matrices of FRGs from the TCGA. Differentially expressed FRGs (DE-FRGs) were identified among 364 tumor tissues and 50 normal tissues. The adjusted p < 0.05 was considered statistically significant. To identify prognosis-associated FRGs, we implemented univariate Cox regression analysis of OS with the “survival” package of the R software. To select OS-related FRGs, p < 0.05 was used as a cut-off value. Intersection of DE-FRGs and OS-related FRGs was taken for downstream analyses. We defined them as OS-genes.
Construction and Validation of OS Signature
HCC patients were randomly divided into training set and validation set in a 6:4 ratio. The entire set (n = 364) comprised a training set (n = 228) and a validation set (n = 136). To build a ferroptosis prognostic signature, LASSO Cox regression was carried out in the OS training set using the “glmnet” package in R. The TCGA validation set, entire set, and ICGC cohort were evaluated for predictive performance. The risk score was calculated according to the following formula: Risk score = expgene 1*βgene 1 + expgene 2*βgene 2 + … expgene n*βgene n (the expgene is the FPKM value of FRGs, the βgene is the LASSO regression coefficient). Patients were then stratified into different risk subgroups according to their median risk score. To evaluate the predictive power of the signature, the Kaplan–Meier survival curve and time-dependent ROC curve analysis were performed using the “survival” package and “timeROC” package, respectively. We also assessed the association between clinicopathological factors and risk score.
Development and Validation of Predictive Nomograms
Firstly, the relationship between clinicopathological factors and risk score in TCGA and ICGC cohorts for OS was further explored. Then, using univariate and multivariate Cox regressions, independent predictors were identified from the FRGs signature and clinicopathological variables, including age, gender, race, family history of cancer, serum AFP, total bilirubin, albumin, adjacent hepatitis, fibrosis, vascular invasion, T stage, TNM stage, tumor grade, and Child-Pugh classification. The results were presented as a forest plot. Based on the “rms” and “survival” packages, we built nomograms to predict 1-, 3-, and 4-year OS based on the results of univariate and multivariate Cox regressions, our clinical knowledge, and predictors identified from previously published articles. Calibration curves and C-indexes were utilized to evaluate the performance of the nomograms.
Mutation and GSEA Analysis
MAF files of somatic mutation were also derived from TCGA database. The “maftools” package in R was utilized to analyze and visualize differences in somatic variants between different risk subgroups.15 We identified differentially mutated genes in the two groups.
GSEA was performed to further assess the differences in possible biological pathways between different risk groups. First, the “limma” package in R was used for differential expression analysis in two risk groups. We obtained log fold-change (logFC) of all mRNAs and used it to rank these genes. Then, using “clusterprofiler” package and “enrichplot” package in R, GSEA analysis was performed and visualized.16
Transcriptional changes in well-known suppressors of ferroptosis (SOFs), such as ATF4, ELAVL1, FTH1, GPX4, NFE2L2, SQSTM1, SLC7A11, VDAC2, and so on, were also explored in the different risk groups.4,10,17–21
Immune Cell Infiltration Analysis and Differential Expression Analysis for Immune Checkpoints
We quantified the abundance of 18 immune-related terms using gene set variation analysis (GSVA).22,23 Immune infiltration in different risk groups was shown with box plots. The lollipop and scatter plots were generated to show the association between immune cell infiltration level and risk score.
The expressions of PD-1, PD-L1, B7-H3, CTLA4, HAVCR2, LAG3, CD47, and CD80 between different risk groups were compared. The correlation between expressions of immune checkpoints and risk score was also investigated.
IPS Analysis and TIDE Score
Based on immunomodulators, MHC molecules, suppressor cells, and effector cells, immunophenoscore (IPS) was calculated and normalized within 0–10 range, with higher scores representing higher immunoreactivity.24 From The Cancer Immunome Atlas, we downloaded the IPSs of patients in different groups.24 Additionally, the ImmuCellAI database can be utilized to forecast the therapeutic response to ICB.25 Tumor Immune Dysfunction and Exclusion (TIDE) algorithm was also utilized to predict potential ICB response.26
Clinical Specimen
In total, 77 pairs of tumor and adjacent normal tissues from HCC patients undergoing surgical resection were obtained from Sun Yat-sen Memorial Hospital. The Ethics Committee of Sun Yat-Sen Memorial Hospital reviewed and approved this work. All participants in this study signed informed consent forms.
Cell Culture and Transfection
Obtained from the Cell Bank of the Chinese Academy of Sciences (Shanghai, China), HuH7 and other HCC cell lines were cultured in DMEM (Thermo Fisher Scientific, Waltham, MA, USA) with 10% fetal bovine serum (FBS; Shanghai ExCell Bio, Inc., Shanghai, China) and incubated with 5% CO2 at 37°C. ZFP69B siRNA (si1-2) and negative control siRNA (RiboBio, Shanghai, China) were transfected into HuH7 cells. Knockdown sequences of ZFP69B were as follows: si#1, 5’-CAAAUGUAAUAAGCUAGAATT-3’; si#2, 5’-GCUUACUCAACAUGUUAGATT-3’.
RNA Extraction and Quantitative Real-Time PCR (qRT-PCR)
EZ-press RNA Purification Kit (EZBioscience, Roseville, USA) was utilized to extract total RNA from cell lines or tissues. Reverse transcription was carried out using 5X RT Master Mix (Accurate Biotechnology Co., Ltd., Hunan, China). RT-PCR was performed on all the samples to quantify the relative expression level of our target gene. The following primers were used: ZFP69B, 5’-CAGACATCCTTCATCGCTTAC-3’ (forward) and 5’-GCTTTCTCACATACCCTACATTC-3’ (reverse); GAPDH, 5’-AGAAGGCTGGGGCTCATTTG-3’ (forward), and 5’-AGGGGCCATCCACAGTCTTC-3’ (reverse).
Cell Proliferation Assay
5-Ethynyl-20-Deoxyuridine (EdU) cell proliferation staining was carried out with the BeyoClick™ EdU-488 kit (Beyotime, Shanghai, China). Briefly, in 24-well plates, HuH7 cells (3 × 10⁴ cells/well) were seeded and cultured for 24 h in DMEM with 10% FBS. Subsequently, incubation with EdU for 2 h, fixation with paraformaldehyde for 15 min, and permeation with 0.3% Triton X-100 for another 15 min were performed. After 30 min of incubation with Click Reaction Mixture, cells were incubated with Hoechst 33,342 for 10 min.
Transwell Assays
Cell suspensions (5 × 10⁴ cells) were added to the upper transwell chamber (BIOFIL, Guangzhou, China) and incubated with 20% FBS for 24 h to examine cell migration. Transwell membranes were coated with Matrigel (Corning, NY, USA) and incubated for 24 h to examine cell invasion. Then, cells that migrated or invaded to the bottom chamber were fixed with paraformaldehyde and stained with crystal violet. Microscope was used to quantify the migrated and invaded cells.
Western Blot
Radio immunoprecipitation assay (RIPA) lysis buffer (CWBIO, Beijing, China) was utilized to extract protein from cultured cells, and a bicinchoninic acid assay kit (CWBIO) was utilized to measure its concentration. Western blotting was carried out as previously described.27 Membranes were incubated overnight at 4 °C with primary antibodies. The following antibodies were used: anti-ACSL4 (A20414) from ABclonal, anti-COX2 (#12282) from Cell Signaling Technology, anti-SLC7A11 (ab175186) and anti-GPX4 (ab125066) from Abcam, and anti-GADPH from Beijing Ray Antibody Biotech. Then, the membranes were reacted with secondary anti-rabbit/mouse antibodies (EpiZyme, Shanghai, China). The enhanced chemiluminescence method (EpiZyme) was used to visualize target proteins with G: BOX Chemi XT4 (Syngene, UK).
Detection of Malondialdehyde (MDA), Lipid ROS, and Total ROS Level
MDA concentration was measured following kit instructions (ab287860, Abcam). Briefly, cells were plated in 10-cm dishes, treated with siRNA for 24h and treated with erastin (10μM, Selleck, Houston, Texas, USA) for another 24 h. And cells were lysed by ice-cold homogenizing buffer for 10 min, followed by centrifugation at 3000 g for 10 min at 4°C. Concentrated HCl was used until pH 1.5 was reached. The supernatant was hydrolyzed for 80 min at 60 °C. Next, 150 µL concentrated HCl and 650 µL Developer Mix were added to 200 µL hydrolyzed samples and incubated at 45 °C for 60 min. After this incubation period, samples were centrifuged at 9000 g and RT for 10 min. Then, blue supernatant was collected and 200 µL of each sample was transferred into a 96-well plate. Absorbance at OD 586 nm was measured at RT in end-point mode. MDA concentration was then calculated from a standard curve.
2,7-Dichlorodihydrofluorescein (DCFH-DA, APExBIO, Houston, Texas, USA) diacetate and C11-BODIPY (Thermo Fisher Scientific) were used to detect the intracellular ROS levels and lipid ROS. In brief, cells were plated in 6-well plates treated with siRNA for 24h and treated with erastin for another 24 h. Then, the cells were incubated with DCFH-DA or C11-BODIPY for 20 min. The fluorescence intensity of ROS and the percent of C11-BODIPY positive cells were analyzed by flow cytometry.
Statistical Analysis
Statistical analysis of the bioinformatic data and experimental data in this study was performed using R software 3.6.2 (Vienna, Austria), SPSS 25.0 (IBM Corporation, Armonk, NY, USA) and GraphPad Prism 8.0 (San Diego, CA, USA). It was considered statistically significant when p < 0.05.
Results
Constructing FRGs Prognostic Signature in TCGA Training Set
We obtained a list of 259 FRGs from FerrDb. In the TCGA dataset, we identified 240 FRGs based on the annotation file downloaded from the “GENCODE” website. Then, we obtained 189 DE-FRGs among 364 HCC and 50 normal samples. The 240 FRGs in the OS cohort were then analyzed using univariate Cox regression to identify ferroptosis-related prognostic genes (Table S1). Finally, we found that 89 FRGs were significantly correlated with OS. We identified 82 OS-genes in the intersection of DEGs and ferroptosis-related prognostic genes (Figure 1A).
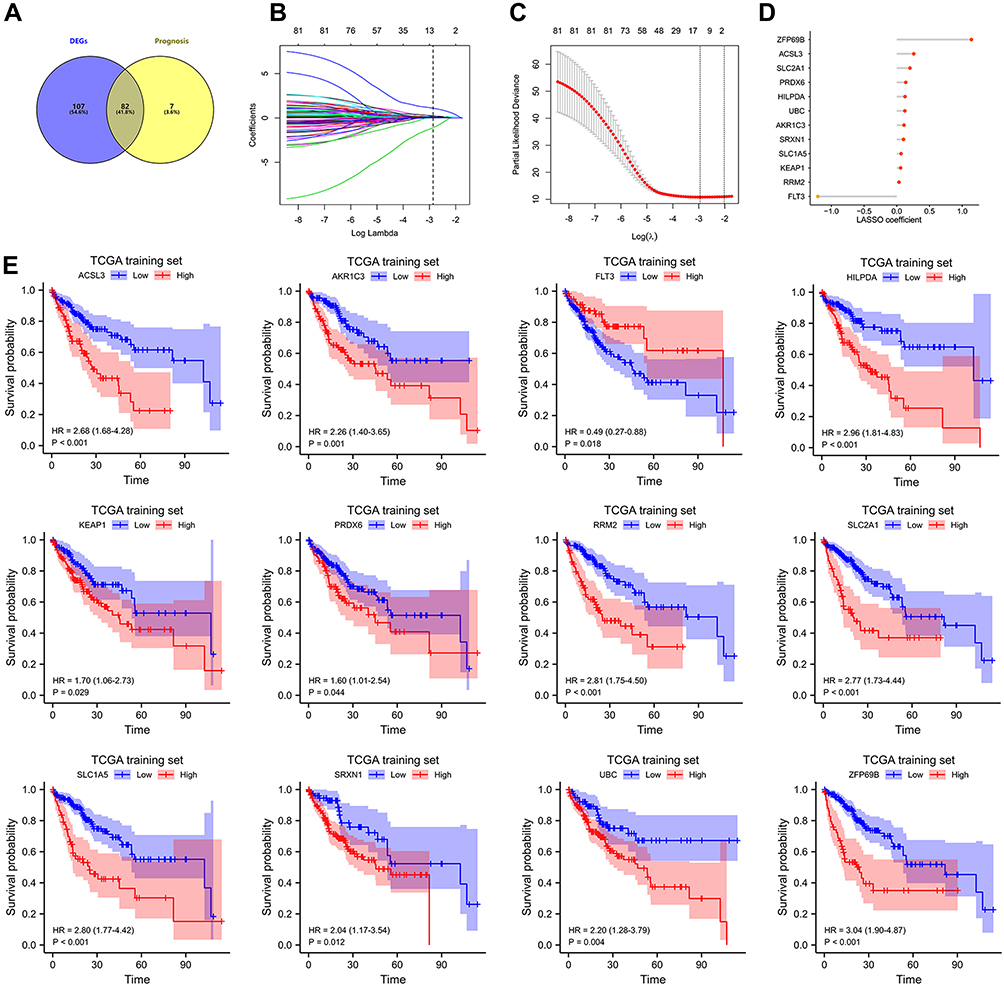 |
Figure 1 Construction of FRGs prognostic signature in TCGA training set. (A) The 82 overlapping genes analyzed by differentially expressed analysis and univariate Cox regression analysis are called OS-gene. (B–C) the least absolute shrinkage and selection operator (LASSO) regression were performed in OS training set with the penalty parameter estimated by 15-fold cross-validation. (D) Lollipop diagrams of LASSO coefficient for OS signature. (E) The KM survival curve for 12 FRGs in TCGA training set. |
To build a prognostic signature for HCC patients, LASSO Cox analysis was utilized to identify candidate genes (Figure 1B and C). OS signature containing 12 FRGs (Figure 1D) was generated. Of these, 11 were significantly associated with shorter OS in the TCGA training set, including ACSL3, AKR1C3, HILPDA, KEAP1, PRDX6, RRM2, SLC2A1, SLC1A5, SRXN1, UBC, ZFP69B, whereas FLT3 was significantly associated with longer OS (Figure 1E). Results in the TCGA validation, TCGA entire set, and ICGC cohort were also broadly similar to those (Figures S2–S4). The risk score for each patient was calculated according to the following formula: risk score = expSLC2A1*0.201 + expSRXN1*0.102 + expFLT3*(−1.205) + expUBC*0.124 + expRRM2*0.035 + expHILPDA*0.126 + expKEAP1*0.059 + expACSL3*0.260 + expPRDX6*0.137 + expZFP69B*1.140 + expAKR1C3*0.110 + expSLC1A5*0.066. Patients in OS training set were divided into different groups on the basis of their median risk score. Figure 2A displays the distribution of risk score and survival time in OS training set. As shown in Figure 2B (p < 0.001), patients in different risk groups demonstrated different prognoses. Time-dependent ROC curves were generated to assess predictive performance, generating AUC values of 0.826, 0.766, and 0.761 for 1-, 3-, and 4-year OS (Figure 2C).
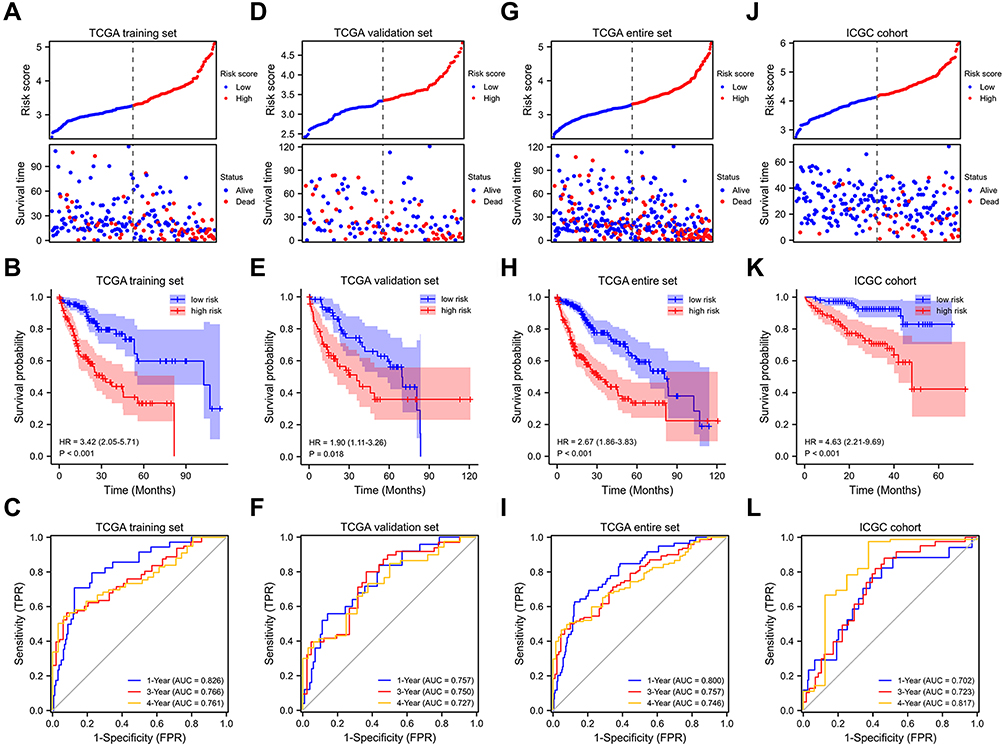 |
Figure 2 Internal and external validation of FRGs prognostic signature. Prognostic stratification analysis, Kaplan–Meier curve analysis and time-dependent ROC curve analysis of the 12 FRGs signature in TCGA training set (A–C), TCGA validation set (D–F), TCGA entire set (G–I) and ICGC cohort (J–L). |
Internal and External Validation of Prognostic Signature
To verify the prognostic performance of the OS signature, risk scores were calculated in different validation cohorts using the formula indicated earlier. Similarly, based on median risk score, patients were assigned to different risk groups. Survival status distribution and risk score are shown in Figure 2D and G, and J. The OS signature demonstrated that patients with higher risk scores had a shorter OS in validation set, entire set, and ICGC cohort (Figure 2E, H and K). From the results, AUC were 0.757, 0.750, and 0.727 for 1-, 3-, and 4-year OS in OS validation set and 0.800, 0.757, and 0.746 in TCGA entire set, respectively (Figure 2F and I). For ICGC cohort, AUC were 0.702, 0.723, and 0.817 for 1-, 3-, and 4-year OS, respectively (Figure 2L). These results all showed that OS signature had good predictive capabilities. Of note, we calculated the AUC value for 1-, 3- and 4-year OS because only 2 patients’ OS was more than 60 months in the ICGC cohort.
Association Between Risk Score and Clinicopathological Factors and Constructing Predictive Nomograms
We assessed the association between different groups and clinicopathological factors. Table S2 showed the clinicopathological characteristics of the samples included in this study. Advanced T stage, TNM staging, and tumor grade were significantly associated with higher risk score in OS training set (Table S3 and Figure 3A–D). Significant differences in risk scores were found among different groups of clinicopathological factors in patients with HCC (Figure 3E–L). In ICGC cohort, advanced TNM stage was significantly associated with higher risk score (Table S4 and Figure S5A and B). For TCGA training set and entire set, risk score and TNM stage were independent predictors of HCC prognosis, whereas risk score was the sole independent predictor in TCGA validation set (Figure 3M–O). In ICGC cohort, risk score, gender, and TNM stage were independent predictors (Figure S5C).
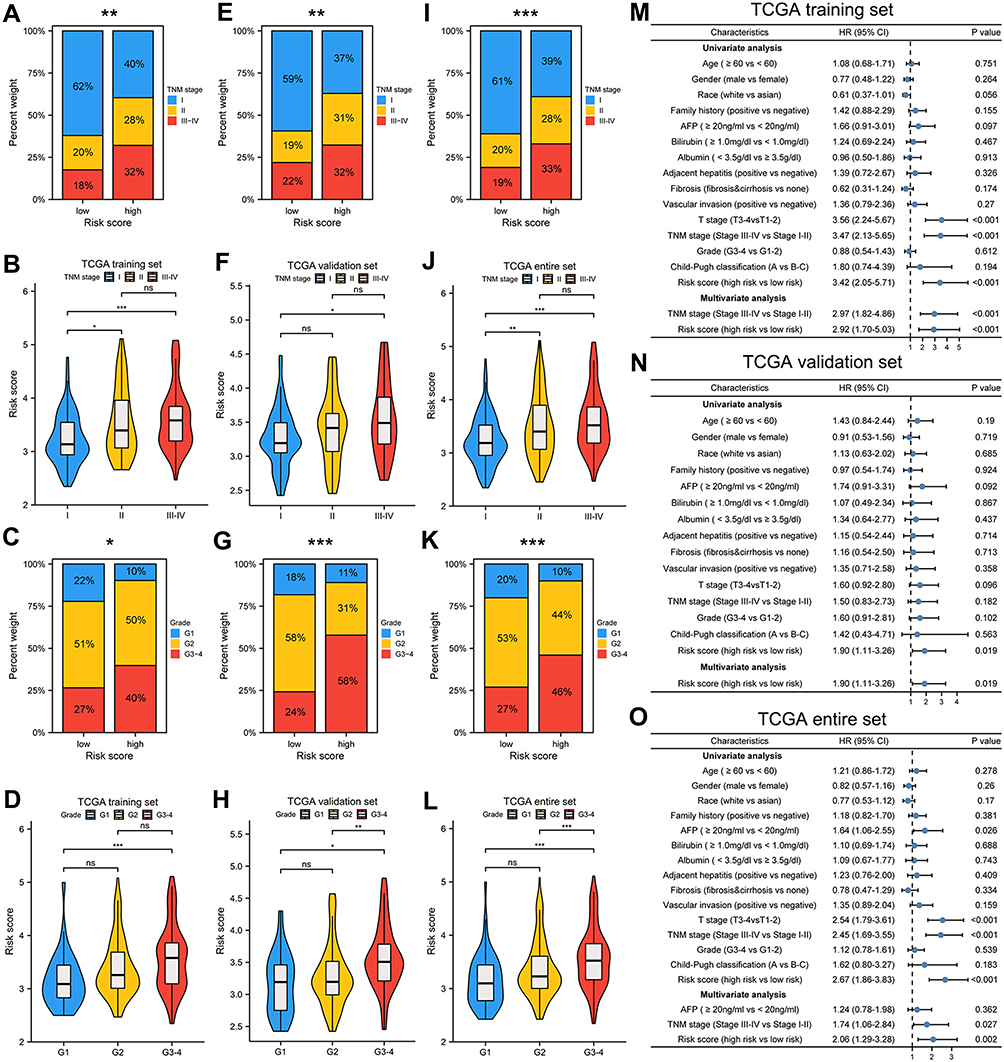 |
Figure 3 Association between risk score and clinicopathological characteristics. Correlation between risk score and TNM stage, histologic grade in in TCGA training set (A–D), TCGA validation set (E–H), TCGA entire set (I–L). Univariate and multivariate Cox regression analyses in different TCGA cohorts (M–O). *p < 0.05, **p < 0.01, ***p < 0.001. |
To provide individualized prediction of OS, nomograms were constructed based on multivariate analysis results and other clinicopathological factors. The nomograms for predicting OS in training set and validation set were plotted based on the following prognostic factors: TNM stage (III & IV vs I & II) and risk score (high risk vs low risk) (Figure S5D and E). The nomogram for predicting OS in TCGA entire set was created based on the following three prognostic factors: AFP (≥20ng/mL vs < 20ng/mL), vascular invasion (positive vs negative), TNM staging and risk score (Figure S5J). Sex and TNM stage were selected for constructing nomogram in ICGC cohort (Figure S5K). Lower total points indicated a better prognosis. The discriminative ability of the nomograms for OS was assessed using the C-index (0.692, 0.657, 0.665, and 0.758 for training, validation, entire set, and ICGC cohort, respectively). The calibration plots are respectively displayed in Figure S5F–I, demonstrating good agreement between the nomograms predicted and actual survival probability.
Mutation Analysis and Pathway Enrichment
We analyzed the association between mutation characteristics and FRGs signature with somatic mutation data from TCGA. The top 20 cumulative mutated genes in different risk groups of TCGA entire set are respectively displayed in Figure 4A and C. We compared the differentially mutated genes in two groups (Figure 4B). In addition, as shown in Figure 4D, a higher prevalence of TP53 mutation (43% vs 15%) was viewed in high-risk group. The mutation status of TP53 was significantly associated with the signature (Figure 4E). Furthermore, whether with TP53 alterations or wild type TP53, patients in the high-risk group had a significantly worse prognosis than those in the low-risk group (Figure 4F and G).
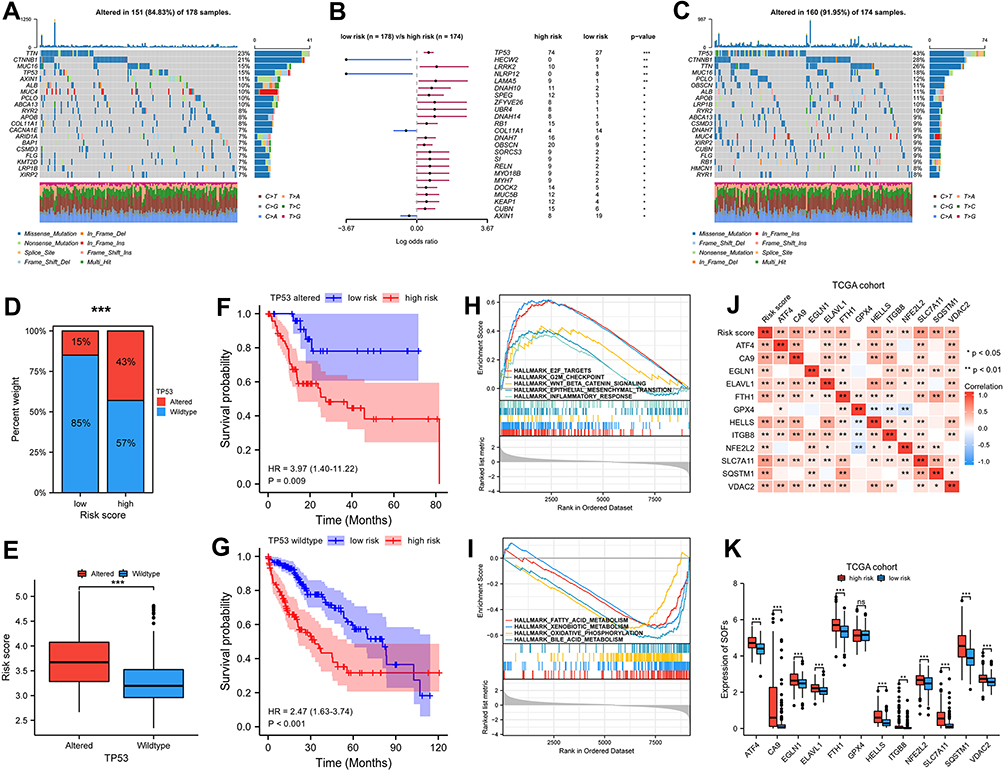 |
Figure 4 Mutation analysis and pathway enrichment in high and low risk group of TCGA cohort. (A and C) Mutation information of top 20 genes in low and high risk group of TCGA cohort. Different colors represented different types of mutations. (B) Differentially mutated genes in two groups for OS with fisher test. (D–G) TP53 mutation status was significantly correlated with risk score, whether with TP53 alterations or wild type TP53, patients in high-risk group had significantly poorer prognosis than patients in low-risk group. (H–I) GSEA enrichment analysis for different risk group in TCGA cohort. (J–K) The correlation between risk score and SOFs and transcriptional changes in SOFs in different subgroups. p-values were showed as follows: *p < 0.05, **p < 0.01, ***p < 0.001. |
Then, GSEA enrichment analyses were performed to discover the possible pathways. The high-risk group from TCGA cohort exhibited the highest enrichment scores for proliferative processes (eg, G2M checkpoint signaling and E2F targets), crucial oncogenic pathways (eg, WNT-beta-catenin signaling and epithelial-mesenchymal-transition signaling), and immune-related processes such as inflammatory response (Figure 4H). Figure 4I shows metabolic processes (eg, fatty acid metabolism, xenobiotic metabolism, and oxidative phosphorylation) were downregulated in the high-risk score subgroup. Similarly, proliferative processes and crucial oncogenic pathways were significantly enriched in high-risk subgroup and low-risk subgroup of ICGC cohort had highly significant enrichment of metabolic processes (Figure S6A and B).
Transcriptional changes in SOFs in different subgroups were also investigated. In addition to GPX4, the remaining SOFs were up-regulated in the high-risk group of the TCGA cohort (Figure 4J and K). ICGC cohort was also used to validate the change in these genes (Figure S6C and D). In addition to GPX4, ITGB8, and NFE2L2, most SOFs were up-regulated in the high-risk group. Overall, these findings suggest ferroptosis is suppressed in the high-risk subgroup.
Differential Abundance of Infiltrating Immune Cells
Stepwise increase in infiltration of pro-tumor immune cells was observed from low- to high-risk groups, including Th2 cells and dendritic cells (plasmacytoid, immature, and activated) (Figure 5A). The lollipop chart demonstrated the correlation between immune cell infiltration level and risk score (Figure 5B). Risk score was significantly negatively correlated with activated CD8 T cell, cytolytic activity, and Th1 cell, and positively with Th2 cells (Figure 5C). Additionally, we found high risk scores were positively correlated with high expression of PD1, CD80, CD47, HAVCR2, CTLA4, and B7-H3 (Figure 5D–F).
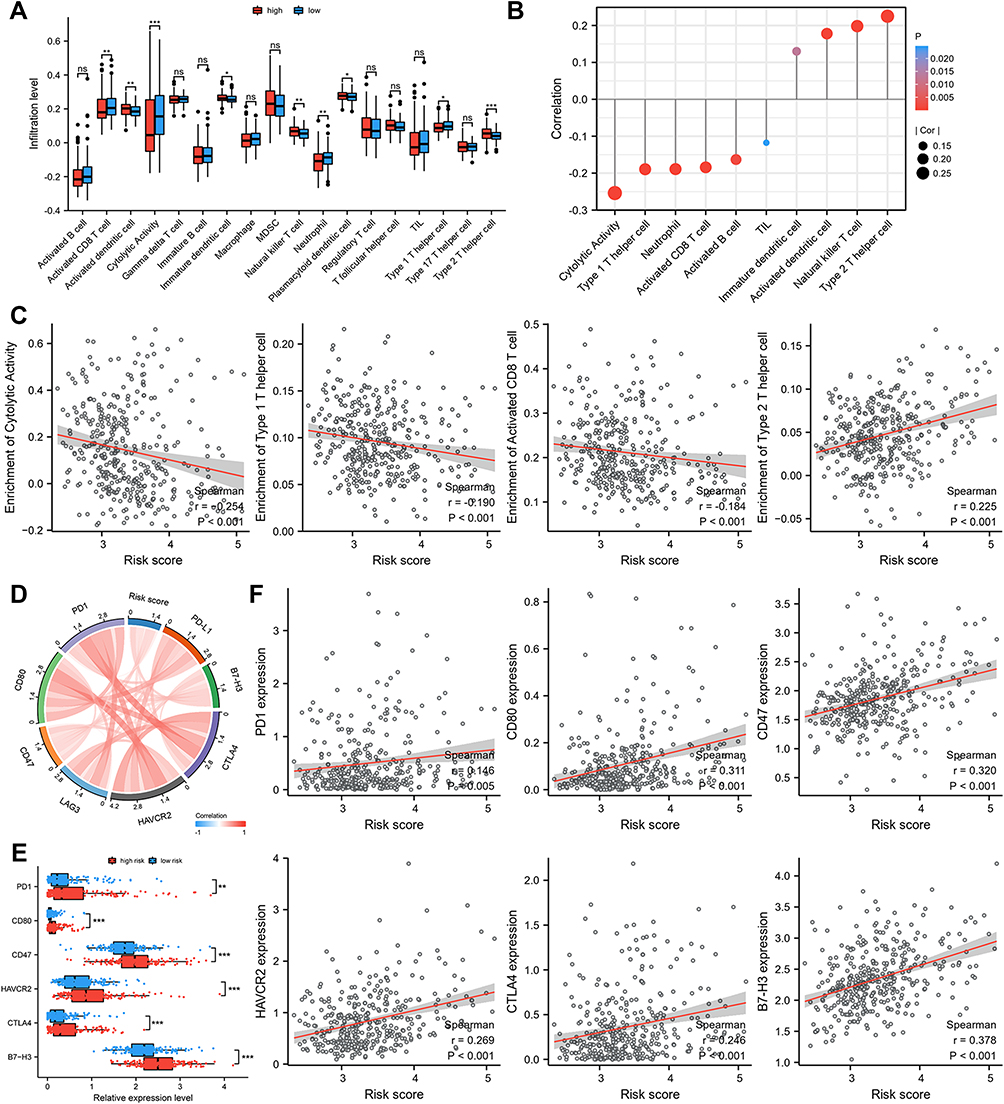 |
Figure 5 The difference of immune cell infiltration and ICIs related-genes in different risk groups. (A) The landscape of 18 immune cell infiltration proportions for TCGA cohort. (B) Correlation between immune cell infiltration level and risk score. (C) Risk score was significantly negatively correlated with activated CD8 T cell, cytolytic activity, and Th1 cell, and positively correlated with Th 2 cell. (D–F) High risk scores were positively correlated with high expression of PD1, CD80, CD47, HAVCR2, CTLA4, and B7-H3. p-values were showed as follows: *p < 0.05, **p < 0.01, ***p < 0.001. |
Similarly, in ICGC cohort, a higher percentage of anti-tumor immune cells infiltrates, such as Cytolytic activity, TIL, Th1 cell, and activated CD8 T cell, were observed in low-risk group (Figure S7A–F). In addition, risk score was positively associated with B7-H3 and CD47 and negatively associated with LAG3 (Figure S7G, I–K). We found higher expression levels of B7-H3 and CD47 and lower expression levels of LAG3 in high-risk group (Figure S7H).
Signature Predicts Immunotherapy Response
To further evaluate the performance of FRGs signature in predicting patient response to ICB therapy, IPS analysis was utilized to evaluate the immunogenicity of HCC patients. Figure 6A shows low-risk subgroup had higher IPS, IPS-CTLA4 and IPS-PD1/PD-L1/PD-L2 scores than high-risk subgroup. Then, ImmuneCellAI was used to forecast the therapeutic response to ICB treatment. In the low-risk group from TCGA cohort, 58% of patients were judged as responsive to ICB therapy compared with only 31% of patients in high-risk subgroup (Figure 6B). Higher risk scores were found in ICB-non-response HCC patients compared with ICB-response HCC patients (Figure 6C). We also assessed immunotherapy responsiveness using TIDE scores. As shown in Figure 6D–E, patients in low-risk group were inclined to have higher immunoreactivity than high-risk group and responders to ICB tended to have lower risk score. Additionally, we found that risk scores were positively associated with TIDE score, T cell exclusion, and enrichment of MDSC but negatively associated with T cell dysfunction (Figure 6F–I). Similarly, in ICGC cohort, more patients from low-risk group were judged as having response to ICB therapy. ICB-non-response HCC patients had higher risk score than ICB responsive group according to ImmuneCellAI (Figure S8A and B). Additionally, patients in low-risk group tended to have higher responses to ICB than in high-risk group (Figure S8C) and responders to ICB inclined to have lower risk score (Figure S8D). We also found risk score was positively associated with TIDE score, T cell exclusion, and enrichment of MDSC and TAM M2, but negatively associated with T cell dysfunction (Figure S8E–L).
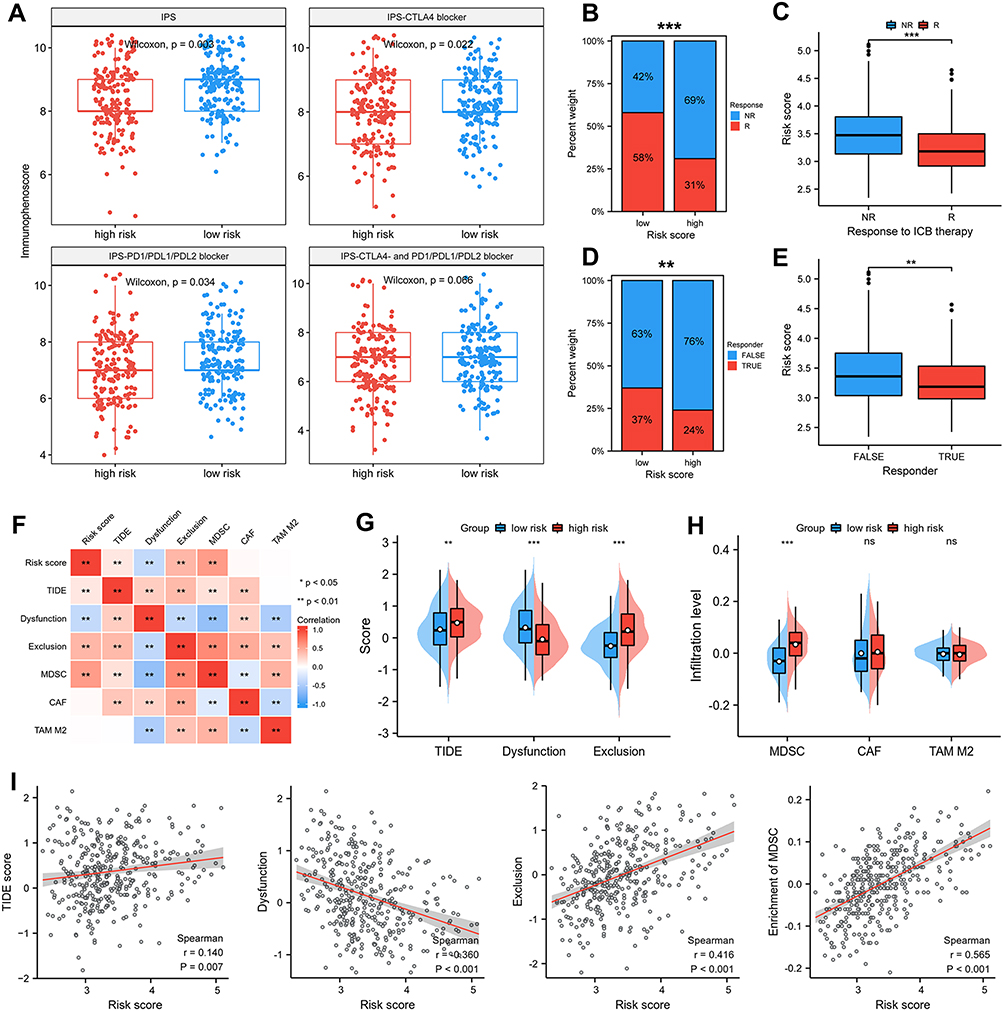 |
Figure 6 Signature predicts immunotherapy response. (A) Difference in IPS based on FRGs signature. Therapeutic response to ICB therapy from ImmuneCellAI (B and C) and TIDE score (D and E). (F–I) Risk scores were positively correlated with TIDE score, T cell exclusion and enrichment of MDSC but negatively correlated with T cell dysfunction. p-values were showed as follows: *p < 0.05, **p < 0.01, ***p < 0.001. |
ZFP69B Promotes HCC Cellular Proliferation, Migration, and Invasion
In this prognostic signature, ZFP69B was the most important predictor of prognosis according to its regression coefficient. Therefore, the role of ZFP69B in HCC was further evaluated. Figure 7A shows that mRNA levels of ZFP69B were significantly higher in 77 HCC tissues than their adjacent normal tissues from our center. We also examined transcriptional levels of ZFP69B in five HCC cell lines and found higher expression in HuH7 than other cell lines (Figure 7B). To analyze the function of ZFP69B, we transfected si-NC and si-ZFP69B (si1 and si2) into HuH7 cells. As shown in Figure 7C, si1 and si2 had good knockdown efficiencies. ZFP69B knockdown significantly inhibited cell proliferation (Figure 7D and E). In addition, transwell assays showed that cellular migration and invasion were significantly suppressed after ZFP69B knockdown (Figure 7F and G).
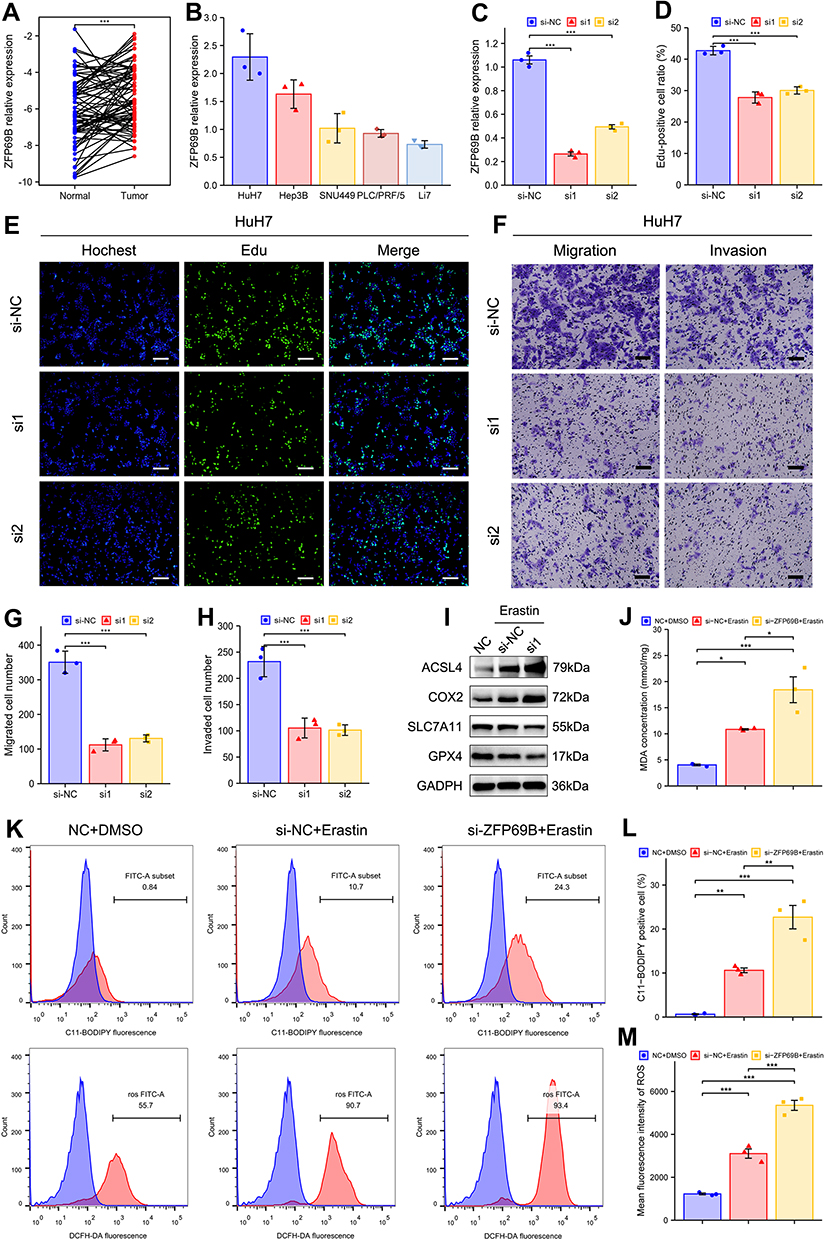 |
Figure 7 ZFP69B promotes HCC cellular proliferation, migration, invasion and erastin-induced ferroptosis. (A) ZFP69B mRNA levels were significantly high than their paired adjacent tissues. (B) Higher ZFP69B expression in Huh7 than other HCC cell lines. (C) The knockdown effect of ZFP69B in HuH7 cell. (D and E) EdU assays demonstrated that knockdown of ZFP69B significantly suppressed the cell proliferation rate in si-ZFP69B groups. Scale bar = 100 µm. (F–H) Transwell assays indicated that cellular migration and invasion abilities were significantly inhibited after ZFP69B knockdown. Scale bar = 100 µm. (I) Western blot assays were employed to measure the expression of ferroptosis-related proteins at protein levels in HuH7 cells. (J) MDA levels in the cell lysates of HuH7 cell were detected by MDA kits. (K–M) Lipid ROS and total ROS levels were analyzed by C11-BODIPY and DCFH-DA with flow cytometry. p-values were showed as follows: *p < 0.05, **p < 0.01, ***p < 0.001. |
ZFP69B Promotes Erastin-Induced Ferroptosis
ZFP69B expression was upregulated in HCC (Figure 7A) so we speculate that it may promote ferroptosis resistance. To determine the role of ZFP69B in ferroptosis, cells were transfected with si1 for 24h and then treated with 10μM erastin for another 24 h. As there are no commercially available antibodies to ZFP69B, we were not able to check its protein level. But as shown in Figure 7C, si1 had a good knock-down efficiency. During erastin-induced ferroptosis, the protein levels of ferroptosis-related markers (SLC7A11, GPX4) decreased dramatically, whereas ACSL4 and COX2 increased, and si-ZFP69B further improved the degree of changes in the protein expression of these markers (Figure 7I). In addition, MDA, lipid ROS, and total ROS levels were also changed after erastin-treated, and si-ZFP69B further enhanced the degree of changes (Figure 7J–M), suggesting that knockdown of ZFP69B increased ferroptosis in HCC cell line.
Discussion
In this study, we constructed signature for predicting OS and established corresponding nomograms. Moreover, the role of signature in immunity was well explored and the prognostic signature could reliably predict response to ICB. Furthermore, knockdown experiments proved ZFP69B could promote HCC cellular proliferation, migration, invasion, and erastin-induced ferroptosis.
The prognostic signature contains 12 genes. SLC2A1-mediated glucose uptake could facilitate lipid peroxidation-dependent ferroptotic death through serial metabolic reactions such as glycolysis and fatty acid synthesis.28 However, another study also showed that SLC2A1 may inhibit ferroptosis.18 FLT3 inhibitors could prevent lipid peroxidation whereas FLT3 promotes ferroptosis.29 RRM2 protects against ferroptosis in HCC cells by sustaining GSH synthesis.30 HILPDA, regulated by HIF2A, promotes ferroptosis in clear cell carcinoma cells.31 Sun et al found that the expression of p62 could inactivate KEAP1, promoting nuclear accumulation of NRF2, which ultimately leads to the suppression of ferroptosis in HCC cells.10 A recent study showed that MUFA activation could promote ferroptosis-resistance in ACSL3-dependent rather than ACSL4-dependent manner.32 MicroRNAs such as miR-137 could inhibit ferroptosis by suppressing the expression of SLC1A5.33 PRDX6 and AKR1C3 inhibit ferroptosis through their antioxidant effect.34,35 Although the expression of ZFP69B, SRXN1, and UBC was upregulated in HCC, their relationship with ferroptosis still needs further exploration.35,36 Although FLT3 could inhibit ferroptosis, its expression was downregulated in high risk group. Therefore, half of the genes involved in the OS signature could inhibit ferroptosis, whereas HILPDA, KEAP1, and SLC1A5 could promote it. In addition, the transcriptional changes of SOFs were significantly up-regulated in high-risk subgroup of different cohorts. These results indicate ferroptosis is suppressed in the high-risk subgroup.
TP53 mutations were more common in high-risk subgroup of the TCGA cohort (43% vs 15%). TP53, a tumor suppressor, could regulate the development of ferroptosis. In lung cancer cell lines, the p53 3KR (K117R, K161R, K162R) acetylation-defective mutant has been reported to induce ferroptosis. In contrast, p53 4KR (K98R and 3KR) and p53 P47S does not trigger ferroptosis.37–39 This suggests that the role of TP53 mutation in the regulation of ferroptosis in HCC needs to be clarified in future studies. GSEA analysis displayed that low-risk group had a highly significant enrichment of metabolic processes, such as fatty acid metabolism, oxidative phosphorylation, and so on. Interestingly, ferroptosis is closely related to lipid metabolism, as it relies on polyunsaturated fatty acids (PUFAs) for oxidation.40 In addition, significant enrichments of cancer-related pathways and immune-related pathways in the high-risk subgroup of TCGA and ICGC cohort, suggest that patients in this group may have a worse prognosis and a potential interaction between ferroptosis and immunity.
A recent study showed that treatment with immunotherapy-activated CD8+ T cells down-regulated SLC3A2 and SLC7A11 expression by releasing interferon γ (IFNγ), thereby affecting the uptake of cystine in cancer cells and promoting lipid peroxidation and ferroptosis. This, in turn, promoted ferroptosis which mediated the anti-tumor effect of immunotherapy.41 These results suggest a potential association between immunotherapy and ferroptosis. Therefore, a comprehensive analysis of the relationship between immunity and ferroptosis was further performed. Results showed that activated CD8 T cell, cytolytic activity, and Th1 cells, well-known anti-tumor immune cells, were negatively correlated with the risk score in TCGA cohort and ICGC cohort, suggesting an immune-suppression status and a higher malignancy in high-risk group. Furthermore, IPS analysis result indicated that the low-risk subgroup of TCGA cohort had higher IPS score, suggesting a higher immunoreactivity and a better response to ICB. Furthermore, the results obtained from the ImmuneCellAI database and TIDE score showed that the low-risk groups in TCGA and ICGC cohort tended to have a good response to ICB. This shows that our prognostic signature can be used to identify suitable treatments for HCC patients. It must be noted that the prediction of immune response is based on ICI monotherapy.25,26 However, combined immunotherapy is a standard treatment as pharmacological treatment for HCC. Our signature will also provide a reference for our choice of combined immunotherapy. In the future, we should further explore the prediction of response to combined immunotherapy.
In further tests, ZFP69B was selected based on regression coefficients to further validate the in vitro results. To date, the functions of ZFP69B in HCC have not been reported. ZFP69B (zinc finger protein 69 homolog B) is a number of Zinc-finger proteins, one of the largest families of DNA-binding proteins. Interestingly, inducible knockdown of ZFP69B repressed the proliferation, migration, and invasion. We observed that patients with HCC had high expression of ZFP69B and it correlated with poor prognosis. So we wanted to know whether ZFP69B correlates with ferroptosis resistance. Our results found that ZFP69B knockdown had higher protein levels of ACSL4 and COX2 and lower protein levels of SLC7A11 and GPX4. In addition, ZFP69B knockdown also increased MDA, lipid ROS and, total ROS levels after erastin-treated. All the results indicate that knockdown of ZFP69B increased erastin-induced ferroptosis in HCC and supports its potential as a novel therapeutic target for the treatment of HCC. Further work exploring the molecular mechanisms underlying this result is needed.
In the future, large-scale and multi-center researches are required to validate the prognostic performance of our prognostic models. Additionally, the association of risk scores with immune infiltrates and immunotherapy requires further investigation.
Conclusion
In conclusion, novel OS signatures based on FRGs were constructed and validated. The prognostic signature showed good prognosis prediction for HCC patients and is expected to help clinicians to identify more aggressive tumors and initiate appropriate individualized treatments. Our results also suggested that ZFP69B might influence the regulation of proliferation, migration, and invasion, and promote erastin-induced ferroptosis in HCC cells, and may act as a therapeutic target for HCC patients.
Abbreviations
EdU, 5-ethynyl-20-deoxyuridine; FRGs, ferroptosis-related genes; GDSC, the genomics of drug sensitivity in cancer; GSEA, gene set enrichment analysis; GSVA, the gene set variation analysis; HCC, hepatocellular carcinoma; IC50, half maximal inhibitory concentration; ICIs, immune checkpoint inhibitors; ICB, immune checkpoint blockade; IPS, immunophenoscore; LASSO, the least absolute shrinkage and selection operator; MATH, mutant-allele tumor heterogeneity;; TIDE score, tumor immune dysfunction and exclusion score; TMB, tumor mutation burden; OS, overall survival; SOFs, suppressors of ferroptosis.
Data Sharing Statement
The datasets for this study can be found in the TCGA (TCGA-LIHC) and ICGC (LIRI-JP).
Ethics Approval and Informed Consent
The studies involving human participants were reviewed and approved by the Ethics Committee of Sun Yat-Sen Memorial Hospital. The patients provided their written informed consent to participate in this study. The study was completed in accordance with the Declaration of Helsinki.
Consent for Publication
The authors have all read and approved this work for publication.
Author Contributions
All authors made a significant contribution to conception, study design, execution, acquisition of data, analysis and interpretation; took part in drafting, revising or critically reviewing the article; gave final approval of the version to be published; have agreed on the journal to which the article has been submitted; and agree to be accountable for all aspects of the work.
Funding
This work was supported by grants from the National Natural Science Foundation of China (No. 81972263, 82072714, and 82103221), the program of Guangdong Provincial Clinical Research Center for Digestive Diseases (2020B1111170004), and China Postdoctoral Science Foundation (2020M683094).
Disclosure
Qingbin Wang and Bingkun Wang are co-first authors for this study. The authors report no conflicts of interest in this work.
References
1. Sung H, Ferlay J, Siegel R, et al. Global cancer statistics 2020: GLOBOCAN estimates of incidence and mortality worldwide for 36 cancers in 185 countries. CA. 2021;71:209.
2. Llovet J, Kelley R, Villanueva A, et al. Hepatocellular carcinoma. Nat Rev Dis Primers. 2021;7(1):6.
3. Federico P, Petrillo A, Giordano P, et al. Immune checkpoint inhibitors in hepatocellular carcinoma: current status and novel perspectives. Cancers. 2020;12(10):3025.
4. Dixon SJ, Lemberg KM, Lamprecht MR, et al. Ferroptosis: an iron-dependent form of nonapoptotic cell death. Cell. 2012;149(5):1060–1072.
5. Qiu Y, Cao Y, Cao W, Jia Y, Lu N. The application of ferroptosis in diseases. Pharmacol Res. 2020;159:104919.
6. Sun X, Niu X, Chen R, et al. Metallothionein-1G facilitates sorafenib resistance through inhibition of ferroptosis. Hepatology. 2016;64(2):488–500.
7. Louandre C, Ezzoukhry Z, Godin C, et al. Iron-dependent cell death of hepatocellular carcinoma cells exposed to sorafenib. Int J Cancer. 2013;133(7):1732–1742.
8. Bai T, Wang S, Zhao Y, Zhu R, Wang W, Sun Y. Haloperidol, a sigma receptor 1 antagonist, promotes ferroptosis in hepatocellular carcinoma cells. Biochem Biophys Res Commun. 2017;491(4):919–925.
9. Ou W, Mulik RS, Anwar A, McDonald JG, He X, Corbin IR. Low-density lipoprotein docosahexaenoic acid nanoparticles induce ferroptotic cell death in hepatocellular carcinoma. Free Radic Biol Med. 2017;112:597–607.
10. Sun X, Ou Z, Chen R, et al. Activation of the p62-Keap1-NRF2 pathway protects against ferroptosis in hepatocellular carcinoma cells. Hepatology. 2016;63(1):173–184.
11. Liang J-Y, Wang D-S, Lin H-C, et al. A novel ferroptosis-related gene signature for overall survival prediction in patients with hepatocellular carcinoma. Int J Biol Sci. 2020;16(13):2430–2441.
12. Du X, Zhang Y. Integrated analysis of immunity- and ferroptosis-related biomarker signatures to improve the prognosis prediction of hepatocellular carcinoma. Front Genet. 2020;11:614888.
13. Liu Y, Zhang X, Zhang J, Tan J, Li J, Song Z. Development and validation of a combined ferroptosis and immune prognostic classifier for hepatocellular carcinoma. Front Cell Dev Biol. 2020;8:596679.
14. Zhou N, Bao J. FerrDb: a manually curated resource for regulators and markers of ferroptosis and ferroptosis-disease associations. Database. 2020;2020. doi:10.1093/database/baaa021
15. Mayakonda A, Lin D, Assenov Y, Plass C, Koeffler H. Maftools: efficient and comprehensive analysis of somatic variants in cancer. Genome Res. 2018;28(11):1747–1756.
16. Yu G, Wang L-G, Han Y, He Q-Y. clusterProfiler: an R package for comparing biological themes among gene clusters. OMICS. 2012;16(5):284–287.
17. Chen D, Fan Z, Rauh M, Buchfelder M, Eyupoglu IY, Savaskan N. ATF4 promotes angiogenesis and neuronal cell death and confers ferroptosis in a xCT-dependent manner. Oncogene. 2017;36(40):5593–5608.
18. Jiang Y, Mao C, Yang R, et al. EGLN1/c-Myc induced lymphoid-specific helicase inhibits ferroptosis through lipid metabolic gene expression changes. Theranostics. 2017;7(13):3293–3305.
19. Zhang Z, Yao Z, Wang L, et al. Activation of ferritinophagy is required for the RNA-binding protein ELAVL1/HuR to regulate ferroptosis in hepatic stellate cells. Autophagy. 2018;14(12):2083–2103.
20. Bai T, Lei P, Zhou H, et al. Sigma-1 receptor protects against ferroptosis in hepatocellular carcinoma cells. J Cell Mol Med. 2019;23(11):7349–7359.
21. Li Z, Jiang L, Chew SH, Hirayama T, Sekido Y, Toyokuni S. Carbonic anhydrase 9 confers resistance to ferroptosis/apoptosis in malignant mesothelioma under hypoxia. Redox Biol. 2019;26:101297.
22. Rooney MS, Shukla SA, Wu CJ, Getz G, Hacohen N. Molecular and genetic properties of tumors associated with local immune cytolytic activity. Cell. 2015;160(1–2):48–61.
23. Bindea G, Mlecnik B, Tosolini M, et al. Spatiotemporal dynamics of intratumoral immune cells reveal the immune landscape in human cancer. Immunity. 2013;39(4):782–795.
24. Charoentong P, Finotello F, Angelova M, et al. Pan-cancer immunogenomic analyses reveal genotype-immunophenotype relationships and predictors of response to checkpoint blockade. Cell Rep. 2017;18(1):248–262.
25. Miao Y-R, Zhang Q, Lei Q, et al. ImmuCellAI: a unique method for comprehensive T-cell subsets abundance prediction and its application in cancer immunotherapy. Adv Sci. 2020;7(7):1902880.
26. Jiang P, Gu S, Pan D, et al. Signatures of T cell dysfunction and exclusion predict cancer immunotherapy response. Nat Med. 2018;24(10):1550–1558.
27. Chen M, Li X, Du B, Chen S, Li Y. Upstream stimulatory factor 2 inhibits erastin-induced ferroptosis in pancreatic cancer through transcriptional regulation of pyruvate kinase M2. Biochem Pharmacol. 2022;205:115255.
28. Song X, Liu J, Kuang F, et al. PDK4 dictates metabolic resistance to ferroptosis by suppressing pyruvate oxidation and fatty acid synthesis. Cell Rep. 2021;34(8):108767.
29. Kang Y, Tiziani S, Park G, Kaul M, Paternostro G. Cellular protection using Flt3 and PI3Kα inhibitors demonstrates multiple mechanisms of oxidative glutamate toxicity. Nat Commun. 2014;5:3672.
30. Yang Y, Lin J, Guo S, et al. RRM2 protects against ferroptosis and is a tumor biomarker for liver cancer. Cancer Cell Int. 2020;20(1):587.
31. Zou Y, Palte MJ, Deik AA, et al. A GPX4-dependent cancer cell state underlies the clear-cell morphology and confers sensitivity to ferroptosis. Nat Commun. 2019;10(1):1617.
32. Magtanong L, Ko P-J, To M, et al. Exogenous monounsaturated fatty acids promote a ferroptosis-resistant cell state. Cell Chem Biol. 2019;26(3):420–432.
33. Luo M, Wu L, Zhang K, et al. miR-137 regulates ferroptosis by targeting glutamine transporter SLC1A5 in melanoma. Cell Death Differ. 2018;25(8):1457–1472.
34. Lu B, Chen X-B, Hong Y-C, et al. Identification of PRDX6 as a regulator of ferroptosis. Acta Pharmacol Sin. 2019;40(10):1334–1342.
35. Dixon SJ, Patel DN, Welsch M, et al. Pharmacological inhibition of cystine-glutamate exchange induces endoplasmic reticulum stress and ferroptosis. Elife. 2014;3:e02523.
36. Yang WS, SriRamaratnam R, Welsch ME, et al. Regulation of ferroptotic cancer cell death by GPX4. Cell. 2014;156(1–2):317–331.
37. Jiang L, Kon N, Li T, et al. Ferroptosis as a p53-mediated activity during tumour suppression. Nature. 2015;520(7545):57–62.
38. Wang S-J, Li D, Ou Y, et al. Acetylation is crucial for p53-mediated ferroptosis and tumor suppression. Cell Rep. 2016;17(2):366–373.
39. Jennis M, Kung C-P, Basu S, et al. An African-specific polymorphism in the TP53 gene impairs p53 tumor suppressor function in a mouse model. Genes Dev. 2016;30(8):918–930.
40. Conrad M, Angeli JPF, Vandenabeele P, Stockwell BR. Regulated necrosis: disease relevance and therapeutic opportunities. Nat Rev Drug Discov. 2016;15(5):348–366.
41. Wang W, Green M, Choi J, et al. CD8 T cells regulate tumour ferroptosis during cancer immunotherapy. Nature. 2019;569(7755):270–274.
 © 2023 The Author(s). This work is published and licensed by Dove Medical Press Limited. The full terms of this license are available at https://www.dovepress.com/terms.php and incorporate the Creative Commons Attribution - Non Commercial (unported, v3.0) License.
By accessing the work you hereby accept the Terms. Non-commercial uses of the work are permitted without any further permission from Dove Medical Press Limited, provided the work is properly attributed. For permission for commercial use of this work, please see paragraphs 4.2 and 5 of our Terms.
© 2023 The Author(s). This work is published and licensed by Dove Medical Press Limited. The full terms of this license are available at https://www.dovepress.com/terms.php and incorporate the Creative Commons Attribution - Non Commercial (unported, v3.0) License.
By accessing the work you hereby accept the Terms. Non-commercial uses of the work are permitted without any further permission from Dove Medical Press Limited, provided the work is properly attributed. For permission for commercial use of this work, please see paragraphs 4.2 and 5 of our Terms.