Back to Journals » OncoTargets and Therapy » Volume 13
Identification and Validation of Reference Genes Selection in Ovarian Cancer Exposed to Hypoxia
Authors Yan W, Xie M, Li R, Hu H, Tang B ![]() , Shen J
, Shen J
Received 14 February 2020
Accepted for publication 26 June 2020
Published 28 July 2020 Volume 2020:13 Pages 7423—7431
DOI https://doi.org/10.2147/OTT.S249733
Checked for plagiarism Yes
Review by Single anonymous peer review
Peer reviewer comments 3
Editor who approved publication: Prof. Dr. Takuya Aoki
Wenying Yan,1 Mei Xie,2 Rong Li,3 Hongmei Hu,3 Biao Tang,3 Jie Shen4
1Department of Gynecology, Wangjiang Hospital, Sichuan University, Chengdu, Sichuan Province, People’s Republic of China; 2Department of Respiratory and Critical Care Medicine, Chengdu Second People’s Hospital, Chengdu, Sichuan Province, People’s Republic of China; 3Department of Gynecology, Sichuan Maternal and Child Health Hospital, Chengdu, Sichuan Province, People’s Republic of China; 4Department of Orthopaedics, The First Hospital Affiliated to AMU (Southwest Hospital), Chongqing, People’s Republic of China
Correspondence: Jie Shen
Department of Orthopaedics, The First Hospital Affiliated to AMU (Southwest Hospital), 30 Gaotan Yanzheng Street, Shapingba District, Chongqing 400038, People’s Republic of China
Email [email protected]
Introduction: Hypoxia-mediated tumor metastasis, progression and drug resistance are major clinical challenges in ovarian cancer. Meanwhile, the genetic basis of these traits is still not clear. RT-qPCR, as an efficient and sensitive gene expression technique, has been widely used for gene analyses, providing a basis for in-depth understanding of molecular changes in different microenvironments. However, there is currently a lack of suitable reference genes to normalize the data associated with hypoxia in ovarian cancer cells.
Methods: A systematic method is needed to select the most suitable reference gene. Here, eight candidate reference genes (GAPDH, β-actin, 18S RNA, TUBB, PPIA, TBP, RPL13A and SDHA) from humans were selected to assess their expression levels in SKOV3 cells under hypoxia. The geNorm and NormFinder programs were utilized to evaluate the expression stabilities of these selected candidate reference genes.
Results: Interestingly, 18S RNA was considered to be an ideal reference gene for the normalization of target gene expression under hypoxic conditions. Furthermore, this result was confirmed in another two ovarian cancer cell line, CAOV3 and OVCAR3 cell line. Finally, these results suggest that appropriate reference genes should be selected before performing gene expression analysis during hypoxic environmental exposure.
Conclusion: 18S RNA can be used as an appropriate reference gene for the study of gene expression in ovarian cancer samples under hypoxia by RT-qPCR.
Keywords: reference genes, ovarian cancer, hypoxia, EMT
Introduction
Among all gynecological malignancies, ovarian cancer has the highest mortality rate and most patients are diagnosed with advanced cancer.1 The metastatic capacity and growth of malignant tumors are highly dependent on the tumor microenvironment. However, although it is recognized that the migration and invasion ability of ovarian tumor cells is a necessary prerequisite for their metastasis, the exact molecular events leading to ovarian tumor cell metastasis have not been well elucidated. These processes involve a change named epithelial–mesenchymal transition (EMT) in the morphology of cuboidal, rigid or cobblestone epithelia into a mesenchymal form.2
In order to study the molecular mechanism of EMT, quantitative gene expression analysis is essential. Due to its high sensitivity, simplicity and specificity, quantitative real-time PCR (RT-qPCR) has become a popular biological tool for detecting gene expression levels.3,4 However, in order to obtain the ideal outcomes for gene expression analysis, minimum requirements of RT-qPCR must be met, which include internal quality control for the mRNA and primers, PCR efficiency determination and appropriate reference gene selection.5 Furthermore, the obtained gene expression profiles are different when using different internal reference genes.3 Therefore, the correct selection of the reference gene ensures the accuracy of the RT-qPCR analysis data.4
In the process of quantitative gene expression analysis, researchers often choose internal reference genes based on their own laboratory experience, literature recommendation or their experience and habits. For example, GAPDH and β-actin were always selected as potential candidate reference genes, based on previous experience. However, previous studies have shown that the expression levels of these housekeeping genes (HKGs) can vary between cell types6–8 and in different experimental conditions.9,10 Therefore, prior to their initial use, the stability of the expression of certain HKGs should be validated first.
The purpose of this research was to select a reliable and stable reference gene for the study of ovarian cancer under hypoxic conditions (1%O2). Two different specific algorithms, geNorm and NormFinder, were utilized to analyze the stabilities of the selected candidate housekeeping genes (GAPDH, β-actin, 18S RNA, TUBB, PPIA, TBP, RPL13A and SDHA) in a human ovarian cancer cell line under exposure to hypoxia using SYBR green RT-qPCR.
Methods and Materials
Cell Culture
The ovarian cancer cell lines performed in this study were SKOV3, CAOV3 and OVCAR3 (ATCC, Rockville, MD, USA). The SKOV3 cells were cultured as monolayer in Dulbecco’s modified Eagle’s medium (DMEM) supplemented with 10% fetal bovine serum (FBS) at 37°C under a 5% CO2 atmosphere. CAOV3 and OVCAR3 cells were maintained in RPMI 1640 and supplemented with 10% FBS. Cells at 70% to 80% confluency in monolayers were starved by culturing them in serum-free medium for 24 h. SKOV3, CAOV3 and OVCAR3 cells were incubated for 24 h under either hypoxic (1% O2) or normoxic (21% O2) conditions.
RNA Samples and cDNA Synthesis
According to the manufacturer’s instructions, 106 cells were used to isolate the total cellular RNA using TRIzol reagent (ThermoFisher Scientific) and the RNA was quantified with NanoDrop microspectrophotometer (ThermoFisher Scientific). cDNA was synthetized from 1.0 μg of total RNA by using the SuperScritp IV VILO kit with ezDNase (ThermoFisher Scientific).
Candidate Genes Used for RT-qPCR
Eight candidate human reference genes, glyceraldehyde-3-phosphate dehydrogenase (GAPDH), β-actin, 18S RNA, β-tubulin (TUBB), ribosomal protein L13 (RPL13A), peptidylprolyl isomerase A (PPIA), succinate dehydrogenase complex, subunit A (SDHA) and TATA box binding protein (TBP), were selected for the evaluation of gene expression stability, and the genes sequences were obtained from the NCBI database linked with the GenBank accession numbers, as shown in Table 1. Specific primers used to amplify the indicated gene were designed by BLAST software in NCBI. Except for those primers for 18S RNA, all primers span an intron to avoid genomic DNA contamination of total RNA. The experimental design was based on the Minimum Information for the Publication of Quantitative Real-Time PCR Experiments (MIQE) guidelines.11
 |
Table 1 Primer Sequence Information for RT-qPCR Amplification |
Real-Time Quantitative PCR with SYBR Green
RT-qPCR was conducted with SYBR Green THUNDERBIRD qPCR Mix (TOYOBO) on a CFX-96 Touch real-time PCR system (Bio-Rad) according to standard protocols. For each reaction, 1 μL of synthetized cDNA was added to 19 μL of reaction mixture containing 8 μL of H2O, 10 μL of SYBR Green mixture and 0.5 μL each of the forward and reverse primers. The thermocycler program was as follows: 3 min at 95°C followed by 40 cycles of 20 s at 95°C, 20 s at 60°C, and 20 s at 72°C. Each run was concluded with a melting curve analysis to assess the quality of the RT-qPCR products by observation of a single peak melt curve, which represented a single product. All experiments were performed in Four technical repetitions in three independent experiments.
Primer Specificity and Amplification Efficiency of the Reference Genes
In order to calculate out the amplification efficiency (E) and correlation coefficient (R2), each candidate reference gene was tested by generating a standard curve by RT-qPCR of serially diluted (1/10, 1/100, 1/1000, 1/10,000, and 1/100,000) cDNA samples; the results were obtained with the equation E (%) = (10−1/slope - 1) × 100.12 A range of 90–110% for the amplification efficiency and an R2 value of 0.98 were considered acceptable (Table 2).
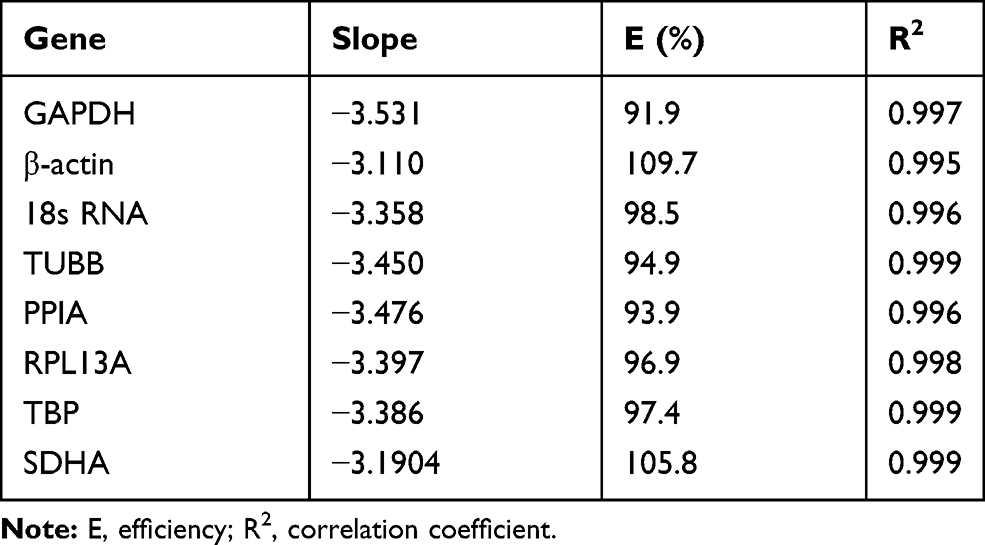 |
Table 2 RT-qPCR Analysis for Determination of the Amplification Efficiency |
Analysis of the Stability of Candidate Genes Expression
geNorm software was utilized to analyze the measurements of gene expression stability (M), and a normalization factor less than 0.15 indicates that the number of reference genes met the requirements and that no housekeeping gene needed to be added.4 According to the M value generated by geNorm, the lower the M value, the more stable the expression of the gene. NormFinder13 aims to find the different genes with the least intragroup and intergroup expression variation and determines the expression stability of each tested candidate reference gene. Finally, according to the ranking of each candidate reference gene in geNorm and NormFinder, a score was determined and used to select the most suitable internal reference gene. The housekeeping gene corresponding to the smallest determination score was the most stable among the eight candidate housekeeping genes.
Confirmation of the Stability of the Selected Reference Gene
Another two ovarian cancer cell lines, CAOV3 and OVCAR3, were used in this experiment to verify whether the selected reference gene was stably expressed in other cell lines under hypoxic conditions. After starvation for 24 h, CAOV3 and OVCAR3 cells were exposed to hypoxia (1% O2) for 24 h, and then RNA sample collection, cDNA synthesis and the analysis of the stability of reference gene expression were conducted as described previously.
Results
Identification of the Specificities and Amplification Efficiencies of the Primers
The expression stability of eight candidate reference genes normoxia or hypoxia were analyzed by a relative quantification method. For each reference gene, the specificity of the primers was also demonstrated by the observation of a single PCR product, which was indicated by a single peak in the melting curve analysis (Figure 1). According to the method described previously,12 the amplification efficiencies of the eight reference genes were calculated out ranged between 93.9% and 109.7%. The correlation coefficients of the standard curves for each gene showed R2 values greater than 0.98 (Table 2).
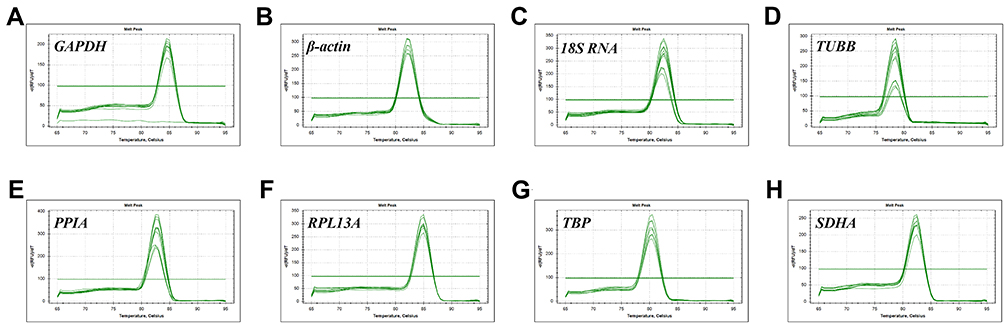 |
Figure 1 (A-H) Melting curves with single peaks generated from all amplifications. Specificity of RT-qPCR showing the amplification of a single product without dimer formation for each candidate housekeeping gene. |
Study on Expression Levels of Candidate Genes in Cells Under Hypoxia Exposure
In order to study the expression stability of candidate genes in hypoxia environment, we first treated the cells with 1% O2, and then detected and evaluated the expression level of these genes in this condition by RT-qPCR and Shapiro–Wilk test (Table 3). The results showed that the value of cyclic quantification (Cq), the number of cycles required to detect the real signal of the sample, varied between 16.78 (PPIA) and 26.18 (SDHA) in normoxic culture (Table 3 and Figure 2A), and between 17.37 (PPIA) and 26.45 (SDHA) in hypoxic culture (Table 3 and Figure 2B). In general, the expression levels of PPIA and RPL13A were higher than other evaluated candidate genes before and after hypoxia exposure (Figure 2), while the expression levels of SDHA and TBP were lower than other candidate genes (Figure 2).
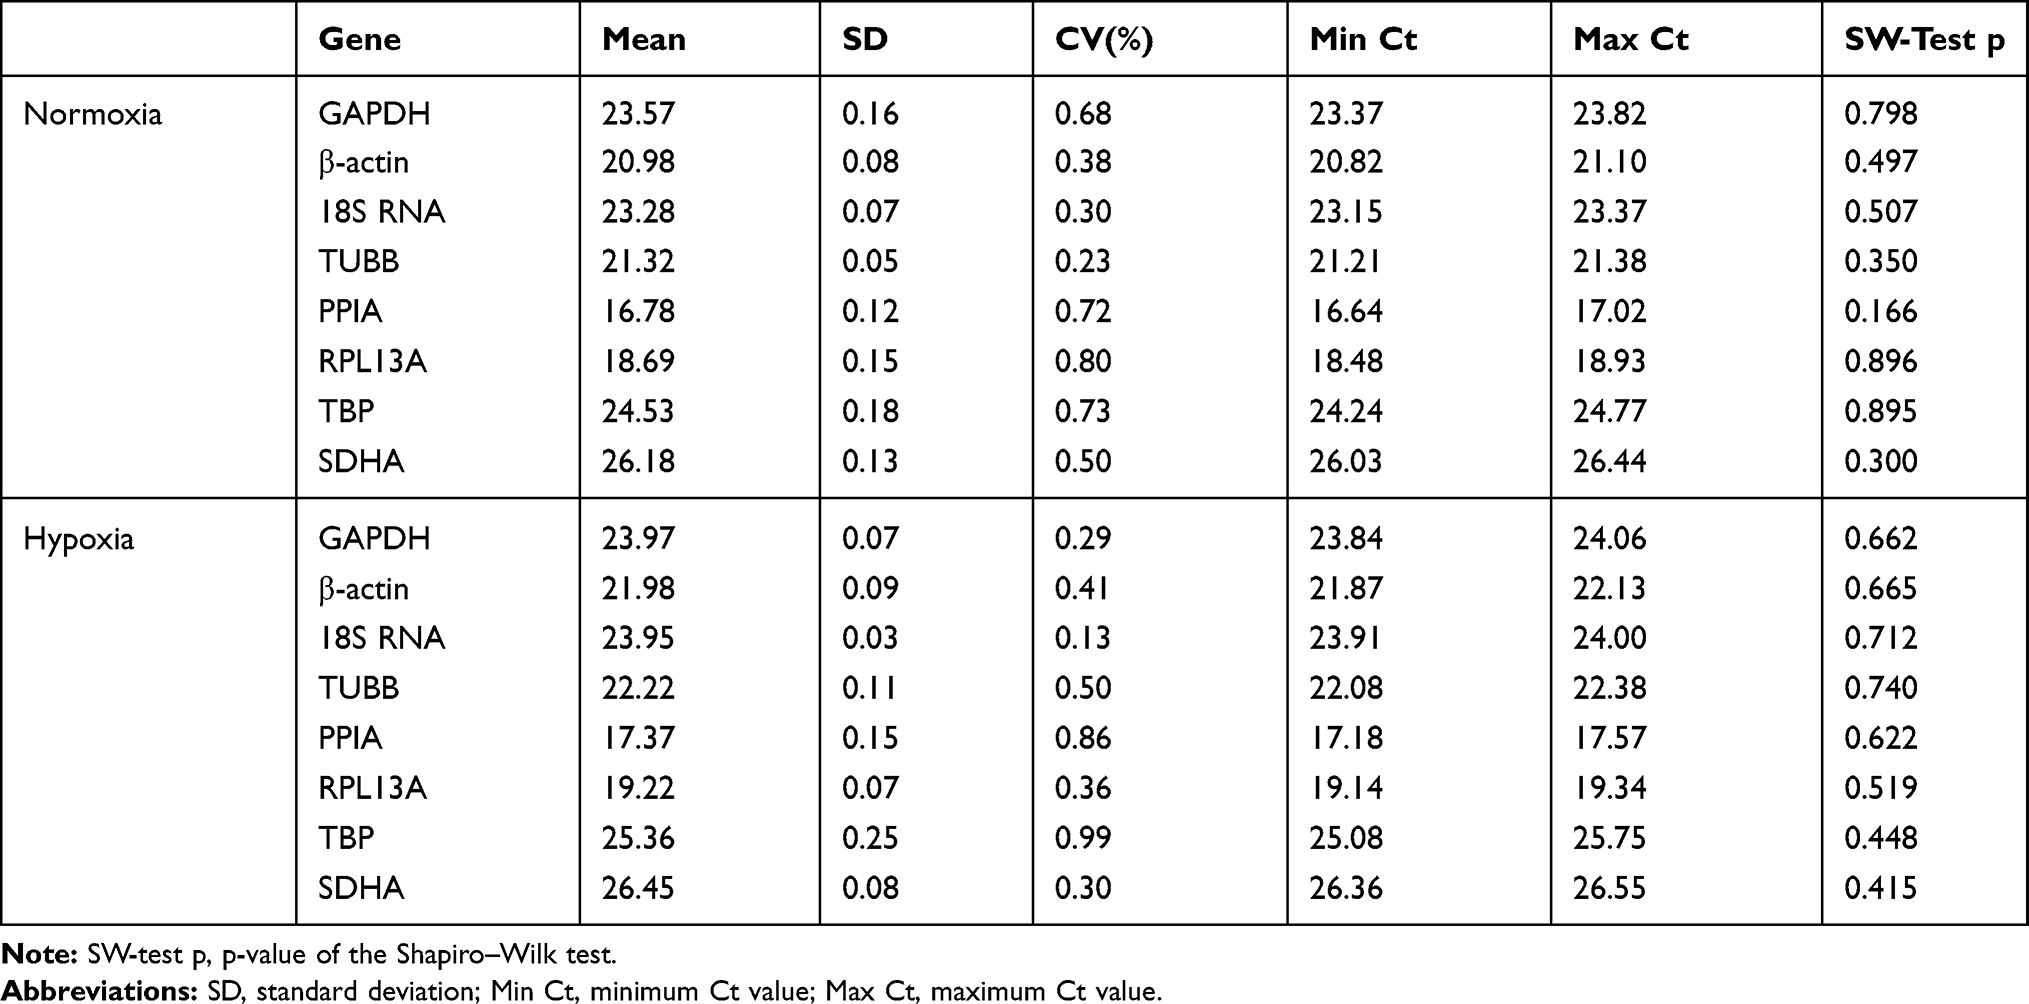 |
Table 3 Descriptive Statistics and Normality Evaluation of the Reference Genes Ct Values in Normoxic and Hypoxic Environment |
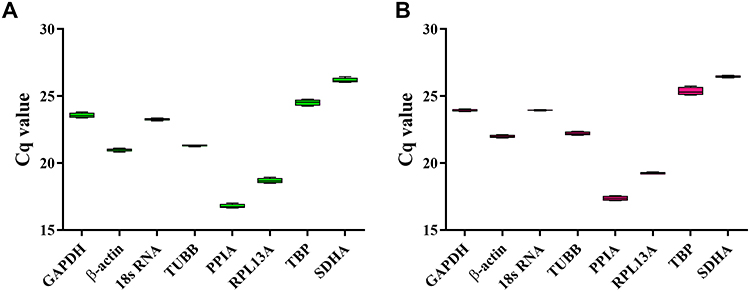 |
Figure 2 Cq value distributions for the candidate housekeeping genes. Boxplots of the Cq values for four samples of cells in normoxic (A) and hypoxic (B) culture conditions for each of the eight candidate reference genes. |
Candidate Reference Genes Stability: geNorm
For accurate gene expression measurements, it is essential to normalize results from the quantitative real-time PCR experiments to a stable reference gene, which is not affected by the experimental conditions. In order to assess the stability of the candidate HKGs, an algorithm named geNorm was utilized to generate the M values to indicate the constancy of the candidate genes.4 The results indicated that the M values for all candidate internal reference genes were less than 1.5 for each sample. Specifically, among the eight candidate HKGs, TUBB and 18S RNA are the most stable expressed genes under the condition of normoxia and hypoxia, respectively (Table 4). Furthermore, the analysis of the samples under all conditions confirmed that 18S RNA indicated as the most stable gene (Table 4).
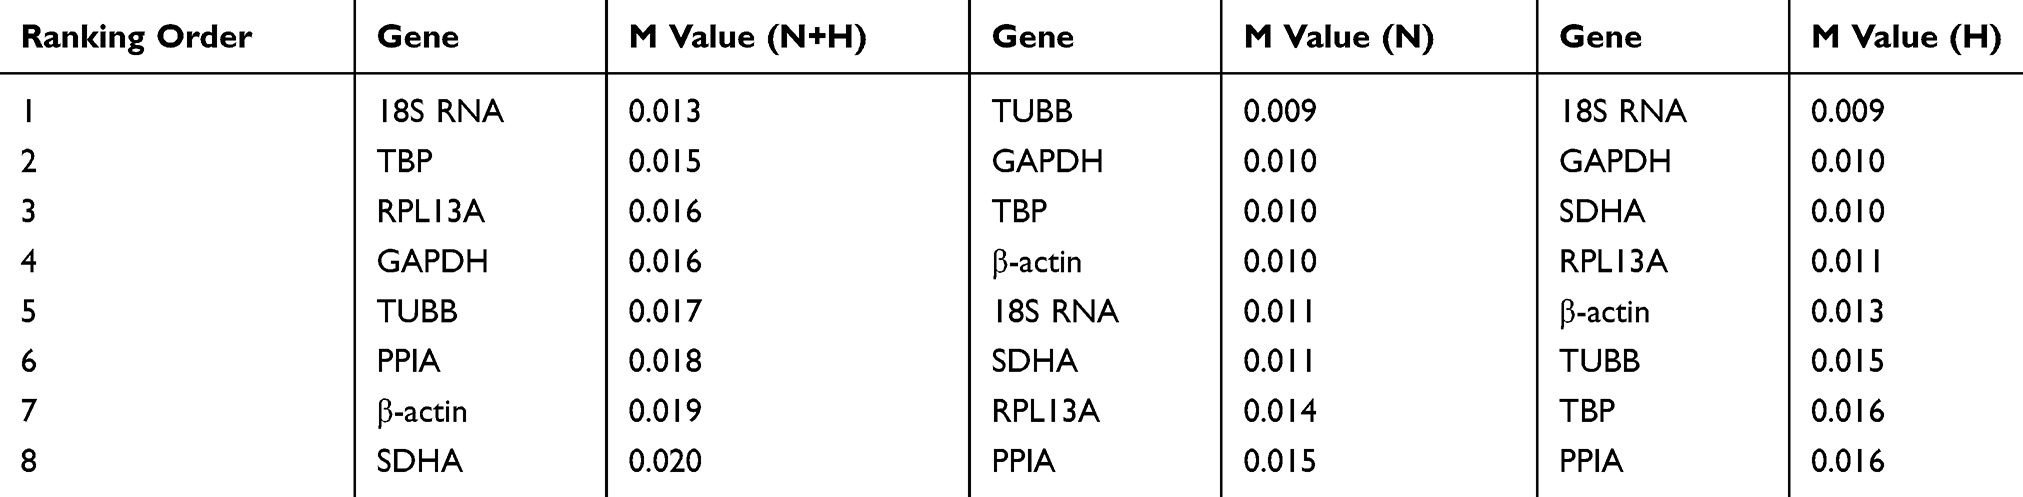 |
Table 4 Calculation of Candidate Reference Genes M Value by the geNorm |
Using the geNorm program, the optimum number of reference genes required for accurate normalization was calculated from the pairwise variation value (Vn/n+1) to determine whether the addition of another reference gene (n + 1) was recommended. The cut-off threshold value (0.15) was utilized to generate the optimal number of reference genes required for normalization.4 In general, the more internal reference genes are used for standardization, the higher the reliability of target gene expression level.6 However, according to the results, V2/3 was less than 0.15, which means only two HKGs were enough for gene expression analysis of the cells under normoxia (Figure 3A and D) or hypoxia (Figure 3B and E) cultural environment. When each sample was analyzed together, the values (Vn/n+1) ranged between 0.013 and 0.020 and were all less than 0.15 (Figure 3C and F). Therefore, only two candidate genes are needed to normalize the target gene expression analysis, and then correct the system deviation to get reliable results, especially the small gene expression differences among the subjects under hypoxia.
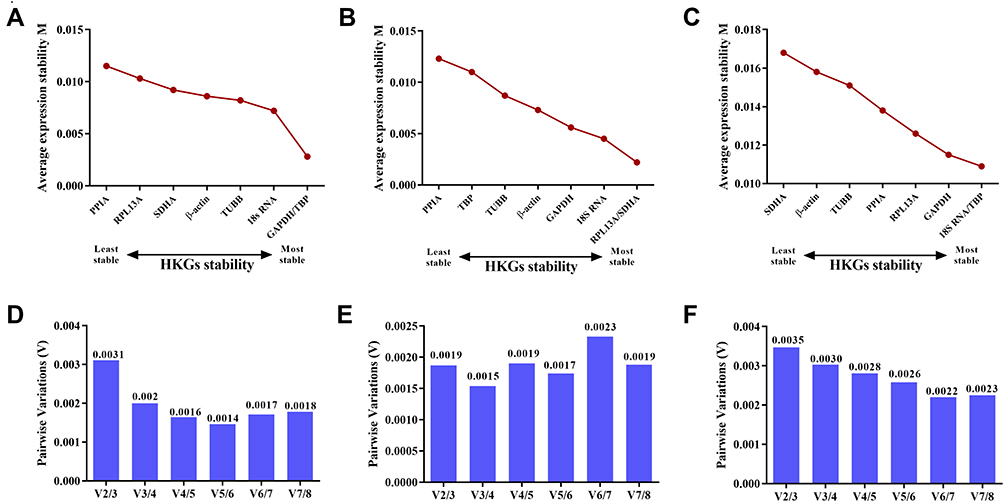 |
Figure 3 The geNorm selection analysis of +candidate reference genes. The average expression stability value (M) was calculated by geNorm for each gene in cells cultured under normoxia (A), hypoxia (B) or in both conditions (C). Pairwise variation (V) between the normalization factors (Vn and Vn + 1) was used to determine the optimal number of reference genes for normalization under normoxia (D), hypoxia (E) or in both conditions (F). |
Candidate Reference Genes Stability: NormFinder
The NormFinder algorithm ranks candidate housekeeping genes according to the intra- and intergroup variation in gene expression.12 These results indicated that TUBB, GAPDH, β-actin and 18S RNA in the normoxia group (Table 5) and 18S RNA, GAPDH, SDHA and RPL13A in the hypoxia group (Table 5) were the steadiest expression candidate genes. 18S RNA, PPIA, RPL13A and GAPDH were the four most steady expression candidate genes in hypoxic and normoxic conditions (Table 5).
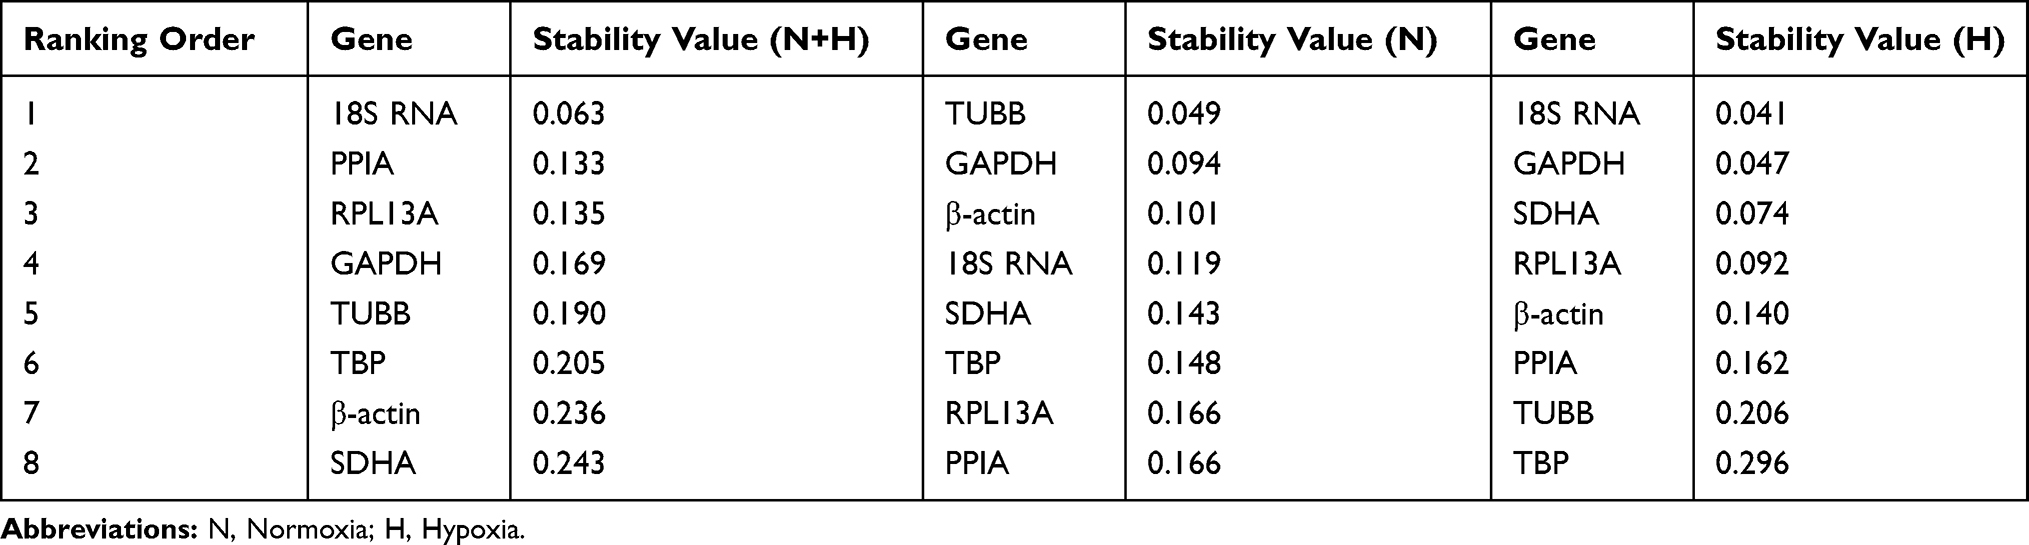 |
Table 5 Calculation of Candidate Reference Genes Expression Stability by the NormFinder |
Candidate Reference Gene Stability: Determine Score
According to the combined outputs of geNorm and NormFinder, a determine score was used to determine the overall ranking of the final comprehensive expression stability. As shown in Table 6, TUBB (normoxia) and 18S RNA (hypoxia) were ranked as the most stable HKGs before and after exposure to a hypoxic environment, respectively. In both conditions, 18S RNA was indicated to be the most stable candidate gene for the normalization of the target genes expression analysis.
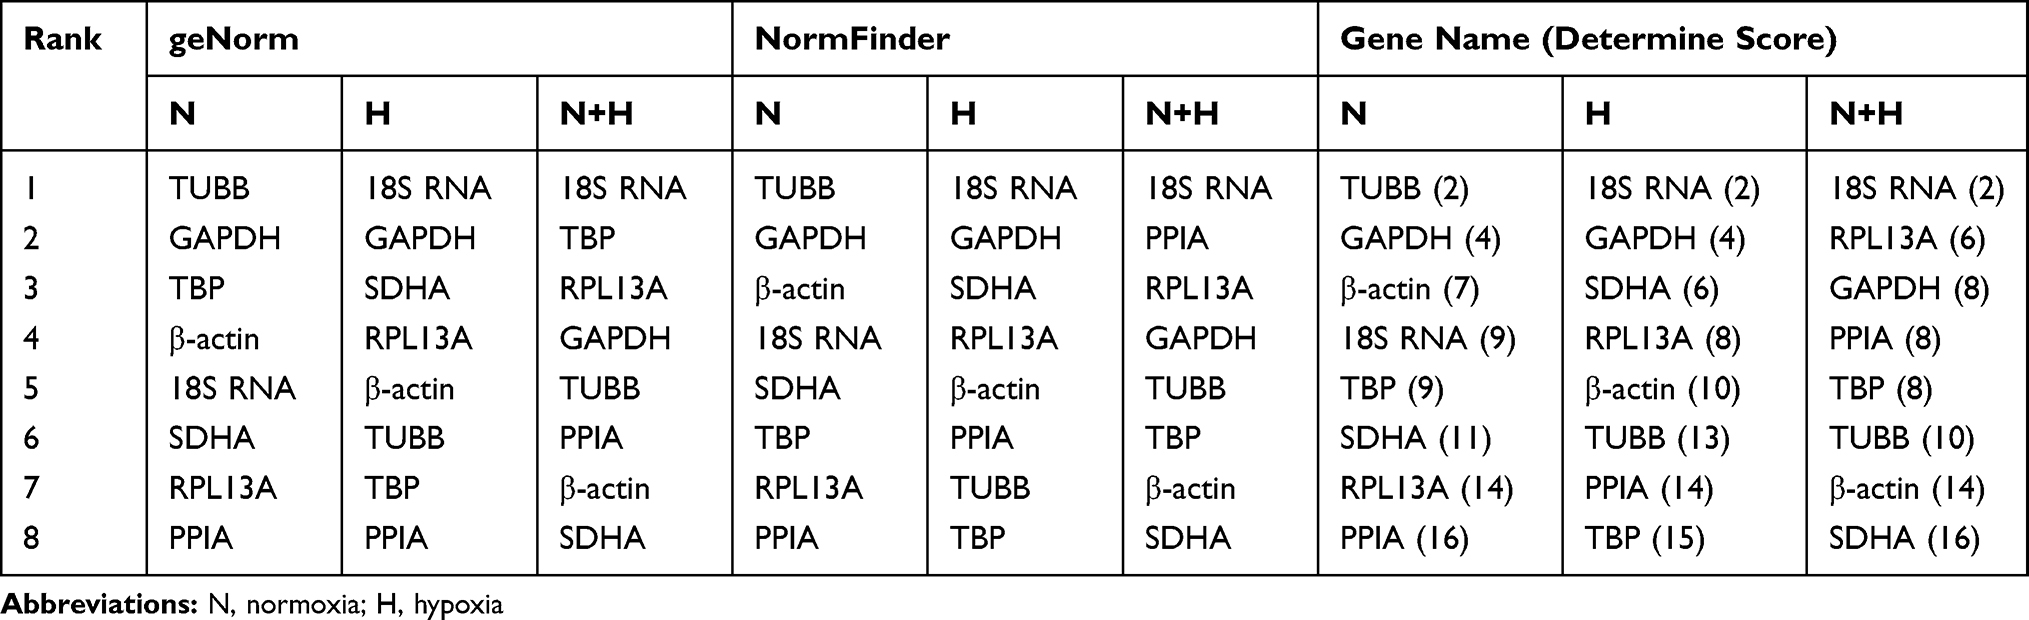 |
Table 6 Stabilities of HKGs Ranked by Determine Score |
Confirmation of the Selected Reference Gene
Another two ovarian cancer cell lines, CAOV3 and OVCAR3, were used in this experiment to verify whether the selected reference gene was stably expressed in other cell lines under hypoxic conditions. After CAOV3 and OVCAR3 cells were exposed to hypoxia, the stability of the eight HKGs was also analyzed by geNorm and NormFinder. The results still indicated that 18S RNA was the most stably expressed housekeeping gene in CAOV3 and OVCAR3 cells after exposure to hypoxia (Tables 7 and 8, Supplemental Files 1-8).
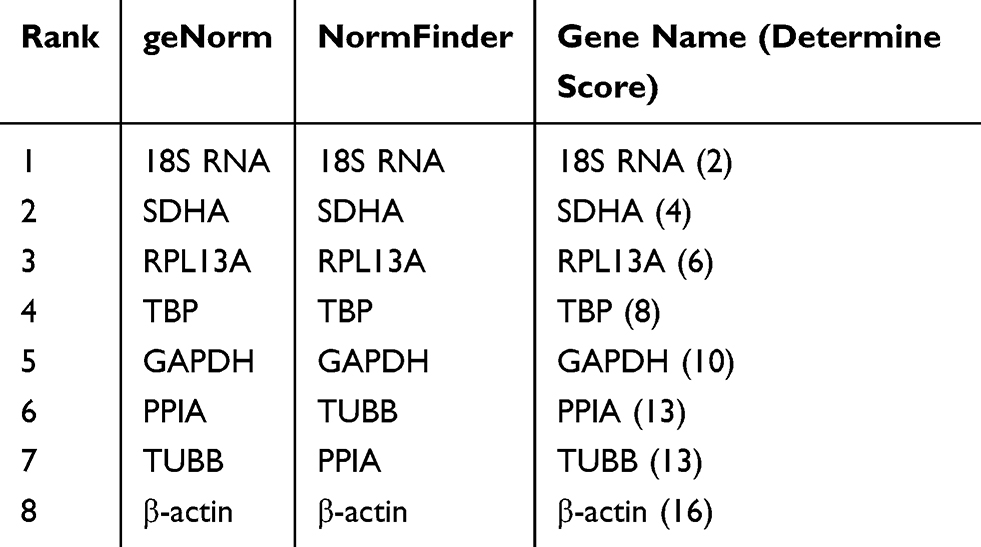 |
Table 7 Stabilities of HKGs Ranked by Determine Score in CAVO3 Cells |
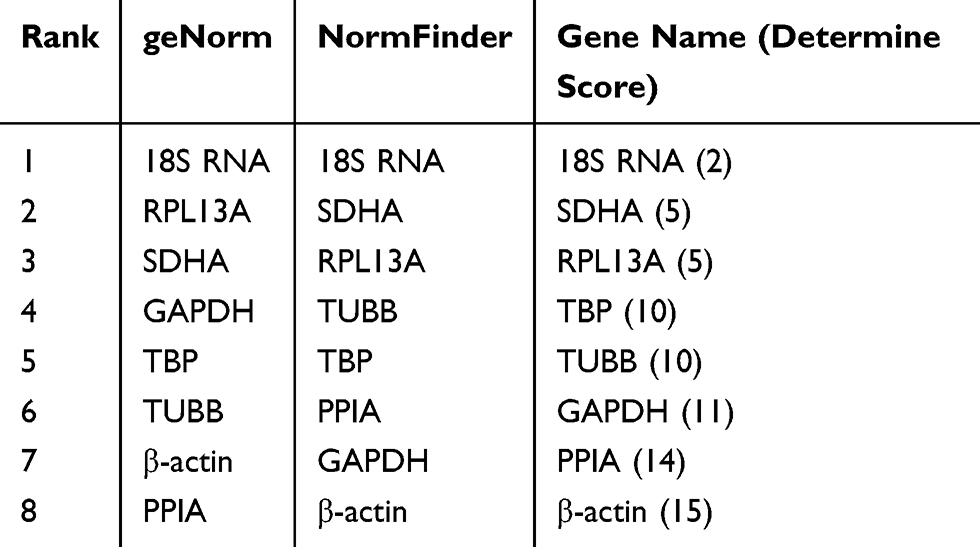 |
Table 8 Stabilities of HKGs Ranked by Determine Score in OVCAR3 Cells |
Discussion
The improvement of the understanding of the mechanisms of hypoxia-induced epithelial–mesenchymal transition is a major focus of ovarian cancer research. Rapid and accurate analysis of gene expression by RT-qPCR is a common strategy to understand the mechanisms of EMT process.14 Since the expression levels of candidate reference genes can vary by the tissue origin (eg, ovary or uterus) or disease origin (eg, adenoma or health tissue) of the sample and also by the experimental parameters (eg, hypoxia-treated cells or non-treated),15,16 the appropriate internal reference gene should be selected to correct the systematic error and obtain reliable results when analyzing the gene expression of ovarian cancer cells under hypoxia conditions. In fact, researchers usually choose only one single commonly used reference gene based on research experience and habits, such as GAPDH or β-actin, which was used in most gene expression studies of ovarian cancer under hypoxic conditions,2,17 without estimation the expression stabilities of the internal reference genes under the specific environment. Therefore, in order to obtain reliable results, it is necessary to estimate the stabilities of candidate genes under hypoxic conditions. However, there have been few studies that have evaluated optimal reference gene(s) in normoxic and hypoxic conditions in ovary cancer.
In this study, eight commonly used housekeeping genes were selected to verify and evaluate their stability in normoxia and hypoxic environments using the NormFinder and geNorm programs. The present study revealed that 18S RNA was stably expressed in the presence of hypoxic condition and can be used as a reliable reference gene for relative gene normalization and quantification in normoxic or hypoxic environments.
Previous studies have reported that the β2-MG level was steady in the presence of different oxygen concentrations.18 In bladder cancer cells under hypoxic conditions, it was indicated that hypoxanthine phosphoribonucleotransferase-1 (HPRT) and β2-MG were optimal and stable housekeeping genes for the determination of gene expression.19 Studies of human adipose-derived stem cells revealed that tyrosine 3/tryptophan 5-monooxygenase activation protein (YMHAZ), β-glucuronidase (GUSB) and TBP were the most stable reference genes in all conditions.20 Therefore, this study indicated that the stress response related genes β2-MG and TBP were not eligible for the normalization of target genes expression in ovarian cancer cells under hypoxia.
Under normoxia, the most stable expression genes were GAPDH/TBP in ovarian cancer cells, whereas under hypoxia, the most stable candidate housekeeping gene were RPL13A/SDHA according to the geNorm algorithm results. When combining samples treated under different conditions, 18S RNA was selected as the most stable candidate housekeeping gene based on the NormFinder and geNorm algorithm. Furthermore, 18S RNA was also stably expressed in another two ovarian cancer cell lines, CAOV3 and OVCAR3, in the same hypoxic environment. These results indicated that 18S RNA could be used as a reference gene when conducting RT-qPCR experiments in ovarian cells subjected to hypoxic stress.
In normoxic and hypoxic conditions, the stability of candidate housekeeping genes should be routinely analyzed for target genes expression analysis in cancer cells prior to performing RT-qPCR. However, previous studies on target gene expression analysis in ovarian cancer cells under hypoxia used GAPDH21 as the reference gene for normalization. Such conventional reference genes always vary in different culture environments. In the present study, the candidate reference genes expression stabilities were estimated in cells under normoxia and hypoxia stress. According to the present results, 18S RNA, which was estimated as the most stable and suitable gene, should be used as the internal reference for normalizing target gene expression in ovarian cancer cells with different oxygen concentrations in culture environment.
Conclusion
The present study identified TUBB in ovarian cancer cells under normoxia as the most stable reference gene, whereas 18S RNA in ovarian cancer cells under hypoxia was the most stable reference gene. Among the selected stably expressed housekeeping genes in both normoxic and hypoxic conditions, 18S RNA was the most highly recommended, but this depended on the ovarian cancer cells used as well as the normoxic and hypoxic conditions.
Data Sharing Statement
All data supporting the conclusion of this article are contained within the manuscript (Supplement Files 9-12).
Acknowledgments
The authors thank Jiawen Zhang for helpful discussion and review of this manuscript.
Author Contributions
All authors contributed to data analysis, drafting or revising the article, gave final approval of the version to be published, and agree to be accountable for all aspects of the work.
Disclosure
The authors have no conflicts of interest.
References
1. Sood AK, Seftor EA, Fletcher MS, et al. Molecular determinants of ovarian cancer plasticity. Am J Pathol. 2001;158(4):1279–1288. doi:10.1016/S0002-9440(10)64079-5
2. Kurrey NK, Bapat SA. Snail and slug are major determinants of ovarian cancer invasiveness at the transcription level. Gynecol Oncol. 2005;97(1):155–165. doi:10.1016/j.ygyno.2004.12.043
3. Sellars MJ, Vuocolo T, Leeton LA, Coman GJ, Degnan BM, Preston NP. Real-time RT-PCR quantification of Kuruma shrimp transcripts: a comparison of relative and absolute quantification procedures. J Biotechnol. 2007;129(3):391–399. doi:10.1016/j.jbiotec.2007.01.029
4. Vandesompele J, De Preter K, Pattyn F, et al. Accurate normalization of real-time quantitative RT-PCR data by geometric averaging of multiple internal control genes. Genome Biol. 2002;3(7):RESEARCH0034. doi:10.1186/gb-2002-3-7-research0034
5. Nolan T, Hands RE, Bustin SA. Quantification of mRNA using real-time RT-PCR. Nat Protoc. 2006;1(3):1559–1582. doi:10.1038/nprot.2006.236
6. Jaramillo ML, Ammar D, Quispe RL, et al. Identification and evaluation of reference genes for expression studies by RT-qPCR during embryonic development of the emerging model organism, Macrobrachium olfersii. Gene. 2017;598:97–106. doi:10.1016/j.gene.2016.11.001
7. Meira-Strejevitch CS, Pereira-Chioccola VL, Maia MM, et al. WITHDRAWN: selection of reference genes in five types of human tissues for normalization of gene expression studies in infectious diseases. Gene. 2016. doi:10.1016/j.gene.2016.10.012
8. Ofinran O, Bose U, Hay D, Abdul S, Tufatelli C, Khan R. Selection of suitable reference genes for gene expression studies in normal human ovarian tissues, borderline ovarian tumours and ovarian cancer. Mol Med Rep. 2016;14(6):5725–5731. doi:10.3892/mmr.2016.5933
9. Benak D, Sotakova-Kasparova D, Neckar J, Kolar F, Hlavackova M. Selection of optimal reference genes for gene expression studies in chronically hypoxic rat heart. Mol Cell Biochem. 2019;461(1–2):15–22. doi:10.1007/s11010-019-03584-x
10. Wang Y, Shan Q, Meng Y, Pan J, Yi S. Mrpl10 and Tbp are suitable reference genes for peripheral nerve crush injury. Int J Mol Sci. 2017;18:2.
11. Bustin SA, Benes V, Garson JA, et al. The MIQE guidelines: minimum information for publication of quantitative real-time PCR experiments. Clin Chem. 2009;55(4):611–622. doi:10.1373/clinchem.2008.112797
12. Ahn K, Huh JW, Park SJ, et al. Selection of internal reference genes for SYBR green qRT-PCR studies of rhesus monkey (Macaca mulatta) tissues. BMC Mol Biol. 2008;9:78. doi:10.1186/1471-2199-9-78
13. Andersen CL, Jensen JL, Orntoft TF. Normalization of real-time quantitative reverse transcription-PCR data: a model-based variance estimation approach to identify genes suited for normalization, applied to bladder and colon cancer data sets. Cancer Res. 2004;64(15):5245–5250. doi:10.1158/0008-5472.CAN-04-0496
14. Valasek MA, Repa JJ. The power of real-time PCR. Adv Physiol Educ. 2005;29(3):151–159. doi:10.1152/advan.00019.2005
15. Liu X, Xie J, Liu Z, Gong Q, Tian R, Su G. Identification and validation of reference genes for quantitative RT-PCR analysis of retinal pigment epithelium cells under hypoxia and/or hyperglycemia. Gene. 2016;580(1):41–46. doi:10.1016/j.gene.2016.01.001
16. Xiao J, Li X, Liu J, Fan X, Lei H, Li C. Identification of reference genes in blood before and after entering the plateau for SYBR green RT-qPCR studies. Peer J. 2017;5:e3726. doi:10.7717/peerj.3726
17. Du J, Sun B, Zhao X, et al. Hypoxia promotes vasculogenic mimicry formation by inducing epithelial-mesenchymal transition in ovarian carcinoma. Gynecol Oncol. 2014;133(3):575–583. doi:10.1016/j.ygyno.2014.02.034
18. Petousi N, Croft QP, Cavalleri GL, et al. Tibetans living at sea level have a hyporesponsive hypoxia-inducible factor system and blunted physiological responses to hypoxia. J Appl Physiol. 2014;116(7):893–904. doi:10.1152/japplphysiol.00535.2013
19. Lima L, Gaiteiro C, Peixoto A, et al. Reference genes for addressing gene expression of bladder cancer cell models under hypoxia: a step towards transcriptomic studies. PLoS One. 2016;11(11):e0166120. doi:10.1371/journal.pone.0166120
20. Fink T, Lund P, Pilgaard L, Rasmussen JG, Duroux M, Zachar V. Instability of standard PCR reference genes in adipose-derived stem cells during propagation, differentiation and hypoxic exposure. BMC Mol Biol. 2008;9:98. doi:10.1186/1471-2199-9-98
21. Wang Y, Ma J, Shen H, et al. Reactive oxygen species promote ovarian cancer progression via the HIF-1alpha/LOX/E-cadherin pathway. Oncol Rep. 2014;32(5):2150–2158. doi:10.3892/or.2014.3448
 © 2020 The Author(s). This work is published and licensed by Dove Medical Press Limited. The
full terms of this license are available at https://www.dovepress.com/terms
and incorporate the Creative Commons Attribution
- Non Commercial (unported, 3.0) License.
By accessing the work you hereby accept the Terms. Non-commercial uses of the work are permitted
without any further permission from Dove Medical Press Limited, provided the work is properly
attributed. For permission for commercial use of this work, please see paragraphs 4.2 and 5 of our Terms.
© 2020 The Author(s). This work is published and licensed by Dove Medical Press Limited. The
full terms of this license are available at https://www.dovepress.com/terms
and incorporate the Creative Commons Attribution
- Non Commercial (unported, 3.0) License.
By accessing the work you hereby accept the Terms. Non-commercial uses of the work are permitted
without any further permission from Dove Medical Press Limited, provided the work is properly
attributed. For permission for commercial use of this work, please see paragraphs 4.2 and 5 of our Terms.