Back to Journals » Cancer Management and Research » Volume 12
Identification and Validation of Novel Genes in Anaplastic Thyroid Carcinoma via Bioinformatics Analysis
Authors Wang S, Wu J ![]() , Guo C
, Guo C ![]() , Shang H, Yao J, Liao L
, Shang H, Yao J, Liao L ![]() , Dong J
, Dong J
Received 21 February 2020
Accepted for publication 11 September 2020
Published 8 October 2020 Volume 2020:12 Pages 9787—9799
DOI https://doi.org/10.2147/CMAR.S250792
Checked for plagiarism Yes
Review by Single anonymous peer review
Peer reviewer comments 2
Editor who approved publication: Professor Rudolph Navari
Shengnan Wang,1,2,* Jing Wu,1,* Congcong Guo,3 Hongxia Shang,4 Jinming Yao,4 Lin Liao,4,5 Jianjun Dong6
1Laboratory of Endocrinology, Medical Research Center, Shandong Provincial Qianfoshan Hospital, Shandong First Medical University & Shandong Academy of Medical Sciences, Jinan, People’s Republic of China; 2Department of Occupational Disease, Yantai Shan Hospital, Yantai, People’s Republic of China; 3Department of Endocrinology, Affiliated Hospital of Shandong University of Traditional Chinese Medicine, Jinan, People’s Republic of China; 4Department of Endocrinology and Metabolism, The First Affiliated Hospital of Shandong First Medical University, Jinan, People’s Republic of China; 5Department of Endocrinology and Metabology, Shandong Qianfoshan Hospital, Cheeloo College of Medicine, Shandong University, Jinan, People’s Republic of China; 6Department of Endocrinology, Qilu Hospital, Cheeloo College of Medicine, Shandong University, Jinan, People’s Republic of China
*These authors contributed equally to this work
Correspondence: Lin Liao
Department of Endocrinology and Metabolism, The First Affiliated Hospital of Shandong First Medical University, Jinan 250014, People’s Republic of China
Tel +86 151 6888 8260
Fax +86 531 8296 3647
Email [email protected]
Jianjun Dong
Department of Endocrinology, Qilu Hospital, Cheeloo College of Medicine, Shandong University, Jinan 250012, People’s Republic of China
Tel +86 137 9112 2910
Fax +86 531 8296 7544
Email [email protected]
Purpose: The conventional interventions of anaplastic thyroid carcinoma (ATC) patients are mainly through surgery, chemotherapy, and radiotherapy; however, it is hardly to improve survival rate. We aimed to investigate the differential expressed genes (DEGs) between ATC and normal thyroid gland through bioinformatics analysis of the microarray datasets and find new potential therapeutic targets for ATC.
Methods: Microarray datasets GSE9115, GSE29265, GSE33630, GSE53072, and GSE65144 were downloaded from Gene Expression Omnibus (GEO) database. Compared with the normal tissue, GEO2R was conducted to screen the DEGs in each chip under the condition of |log FC| > l, adjusted P‐values (adj. P) < 0.05. The Retrieval of Interacting Genes (STRING) database was used to calculate PPI networks of DEGs with a combined score > 0.4 as the cut-off criteria. The hub genes in the PPI network were visualized and selected according to screening conditions in Cytoscape software. In addition, the novel genes in ATC were screened for survival analysis using Kaplan–Meier plotter from those hub genes and validated by RT-qPCR.
Results: A total of 284 overlapping DEGs were obtained, including 121 upregulated and 161 downregulated DEGs. A total of 232 DEGs were selected by STRING database. The 50 hub genes in the PPI network were chosen according to three screening conditions. In addition, the Kaplan–Meier plotter database confirmed that high expressions of ANLN, CENPF, KIF2C, TPX2, and NDC80 were negatively correlated with poor overall survival of ATC patients. Finally, RT-qPCR experiments showed that KIF2C and CENPF were significantly upregulated in ARO cells and CAL-62 cells when compared to Nthy-ori 3– 1 cells, TPX2 was upregulated only in CAL-62 cells, while ANLN and NDC80 were obviously decreased in ARO cells and CAL-62 cells.
Conclusion: Our study suggested that CENPF, KIF2C, and TPX2 might play a significant role in the development of ATC, which could be further explored as potential biomarkers for the treatment of ATC.
Keywords: anaplastic thyroid carcinoma, bioinformatics analysis, Gene Expression Omnibus database, differential expressed genes
Introduction
Thyroid carcinoma is the most common endocrine malignancy,1 which has become the second most common malignant tumor of female endocrine systems.2 Anaplastic thyroid carcinoma (ATC) is rare (2% of thyroid carcinoma), but it is associated with rapid progression, high invasiveness and high mortality.3 The treatments of thyroid carcinoma are mainly compose of surgery, drugs, and radioactive iodine 131I (RAI). These are effective for differentiated thyroid carcinoma (DTC), however, less effective, even no effective for ATC.4,5 Because ATC does not have the ability to uptake iodine, nor regulated by thyroid stimulating hormone (TSH), RAI and TSH inhibiting therapy are also not effective for ATC.6,7 Up to now, there is no available established treatment that prolongs survival. In recent decades, with the understanding and research of the individual diversity of tumors, genetic analysis has been used as a more conducive method for accurate diagnosis and effective treatment. Therefore, exploring novel molecular biomarkers of ATC will help to find new therapeutic methods.
Microarray technology has been widely used to profile gene expression and explore the potential pathogenesis of cancers and is suitable for the screening of the differentially expressed genes (DEGs) in recent years.8–10 Gene Expression Omnibus (GEO) database (http://www.ncbi.nlm.nih.gov/geo/) was used for the bioinformatics data mining of gene expression profiles.11 Microarray technology and bioinformatics analysis methods provide new ideas for the study on molecular mechanisms of diseases and are the best ways to explore gene regulation during disease development currently.12 Combining microarray technology with bioinformatics analysis allows for comprehensive analysis of the DEGs, provides a new and effective way to explore pivotal pathways and molecular mechanisms of ATC.
In the present study, we identified overlapping DEGs of ATC via analyzing five microarray datasets downloaded from the GEO database. The aim of the study is to find DEGs and explore new potential therapeutic targets for ATC. We screened the novel genes in ATC via a bioinformatics analysis and preliminarily validated these genes through in vitro experiments. Our study results indicated that CENPF, KIF2C, and TPX2 might be novel biomarkers for the treatment of ATC.
Materials and Methods
ATC Dataset Preprocessing
The microarray data GSE9115, GSE29265, GSE33630, GSE53072, and GSE65144 of ATC were downloaded from GEO database in the National Center for Biotechnology Information (NCBI) by searching the following key terms: ((anaplastic thyroid cancer) OR anaplastic thyroid carcinoma) OR anaplastic thyroid tumor) OR anaplastic thyroid neoplasm) OR ATC) AND “Homo sapiens”. All included chip datasets have the same characteristics, that is, the comparison of ATC tissues and normal specimens, and contained at least 6 corresponding samples and all microarray data available to the public.
The GSE9115 dataset included five ATC tissues and four normal thyroid tissues (noncancerous samples, normal thyroid specimens). The GSE29265 consisted of nine ATC tissues and ten adjacent normal thyroid tissues. The GSE33630 contained eleven ATC tissues and forty-five non-tumoral thyroid tissues. The GSE53072 included five ATC tissues and four normal thyroid tissues. The GSE65144 consisted of twelve ATC tissues and thirteen normal thyroid tissues.
Data Processing
GEO2R (http://www.ncbi.nlm.nih.gov/geo/geo2r) is an interactive web tool that allows users to compare different groups of Samples in a GEO Series.11 Literature reviewing showed that most similar articles13–15 used GEO2R to analyze the data from different platforms. In our study, GEO2R was used to screen the differentially expressed genes (DEGs) between ATC and normal thyroid samples in five datasets, respectively. The selection criteria of DEGs were based on published literatures.16–18 Cao’s study used |log FC|≥1 and the adj. P < 0.05 as the selection criteria of DEGs and DE miRNAs selection.16 Chen’s study used log FC (fold change) >1 and adj. P < 0.01 as the selection criteria of DEGs.17 The screening conditions for the DEGs were absolute value of p < 0.05 and |log FC|>1 in Yan’s study.18 Therefore, compared with the normal thyroid specimens, the GEO2R was conducted to screen DEGs in each chip under the condition of |log FC| > l, adjusted P‐values (adj. P) <0.05. VENNY online tool (http://bioinfogp.cnb.csic.es/tools/venny) was performed to obtain the overlapping DEGs in the five datasets.
Functional Enrichment Analysis of DEGs
The overlapping DEGs were uploaded to the Database for Annotation Visualization and Integrated Discovery (DAVID, version 6.8, https://david.ncifcrf.gov) for Gene Ontology (GO) and Kyoto Encyclopedia of Genes and Genomes (KEGG) analyses.19,20 In addition, the cut-off value for GO and KEGG analyses were set to P < 0.05.
Protein–Protein Interaction Network Construction
The Retrieval of Interacting Genes (STRING; http://stringdb.org) database was used to calculate protein–protein interaction (PPI) networks of DEGs with a combined score >0.4 as the cut-off criteria.21,22 The PPI network was visualized by Cytoscape software (version 3.2.1).23 Subsequently, the Cytoscape plugin Molecular Complex Detection (MCODE) was utilized to identify the hub genes and critical modules in the PPI network with the default parameters (Degree cut-off 2, Node score cut-off 2, K-core 2 and Max depth = 100).24 The Cytoscape plugin CytoHubba provided a simple interface to analyze a network with eleven scoring methods.25 Among the 11 methods, the newly proposed method Maximal Clique Centrality (MCC) has a better performance in the PPI network. In addition, the crucial nodes were identified based on Degree Centrality (DC), nodes with a high degree were identified as hub genes.26
Therefore, the hub genes in the PPI network were selected according to the screening conditions: i) The PPI network model was analyzed by Molecular Complex Detection plugin (MCODE). In the result of default condition analysis, target points corresponding to the model with score >3 and number of nodes >5 were selected; ii) The top 50 targets of MCC algorithm in CytoHubba; iii) The target points larger than average degree value two times. Finally, the hierarchical clustering analysis was performed for the hub genes.
Survival Analysis of the Hub Genes
The publically available database Kaplan–Meier plotter (KM plotter, http://kmplot.com/analysis/) was utilized to analyze the prognostic value of the hub genes.27 In order to analyze the overall survival (OS) of patients with ATC, the patients were divided into two groups, the high expression group and the low gene expression group (control group) based on the median expression of the selected gene. In addition, the hazard ratio (HR) with 95% confidence intervals (CIs) and log-rank P value were calculated and presented on the plot, and the log-rank P value <0.05 was considered statistically significant.
Cell Culture
Human normal thyroid follicular epithelial cell line (Nthy-ori 3–1 cell) and human anaplastic differentiated thyroid cancer cell lines (ARO cell, CAL-62 cell) were employed in our study. Nthy-ori 3–1 cells and ARO cells were obtained from the First Affiliated Hospital of Shandong First Medical University. CAL-62 cells were purchased from Procell (Wuhan, China). As shown in Supplementary Figure S1, thyroglobulin (TG) expression was detected by immunofluorescence in ARO cells. TG is a specific marker protein of thyroid tumor cells. Therefore, ARO cell line is a thyroid-derived tumor cell line. As shown in the Report of Cell Line Identification, we have done STR profile identification of ARO cells. Therefore, ARO cell line is the cells of human anaplastic thyroid carcinoma. The use of the Nthy-ori 3–1 cells, ARO cells, and CAL-62 cells were approved by the institutional research ethics committee of the First Affiliated Hospital of Shandong First Medical University. Cells were cultured in Dulbecco’s modified Eagle’s medium (DMEM) (Gibco Life Technology, Grand Island, NY, USA) containing 10% fetal bovine serum (FBS) and 1% streptomycin at 37°C with 5% CO2. In addition, cells with 80–90% adherence were used for subculturing and were respectively harvested with trypsin (Gibco Life Technology, Grand Island, NY, USA).
Quantitative RT-PCR (RT‐qPCR)
Total RNA was respectively extracted from Nthy-ori 3–1 cells, ARO cells and CAL-62 cells using RNA TriZol reagent (TaKaRa Bio, Otsu, Japan) according to the manufacturer’s protocol. The cDNA was synthesized using the First Strand cDNA Synthesis Kit (TaKaRa Bio, Otsu, Japan). Quantitative real‐time polymerase chain reaction (RT‐qPCR) was performed with the Ultra SYBR One Step RT-qPCR kit (CWBIO, Beijing, China) in a total volume of 20μL. The primers for ANLN, CENPF, KIF2C, TPX2, NDC80, and GAPDH were designed (Table 1) and synthesized by TaKaRa Bio (Otsu, Japan). The expression level of each target gene was calculated using the 2−ΔΔCt method and GAPDH was used as the internal control.
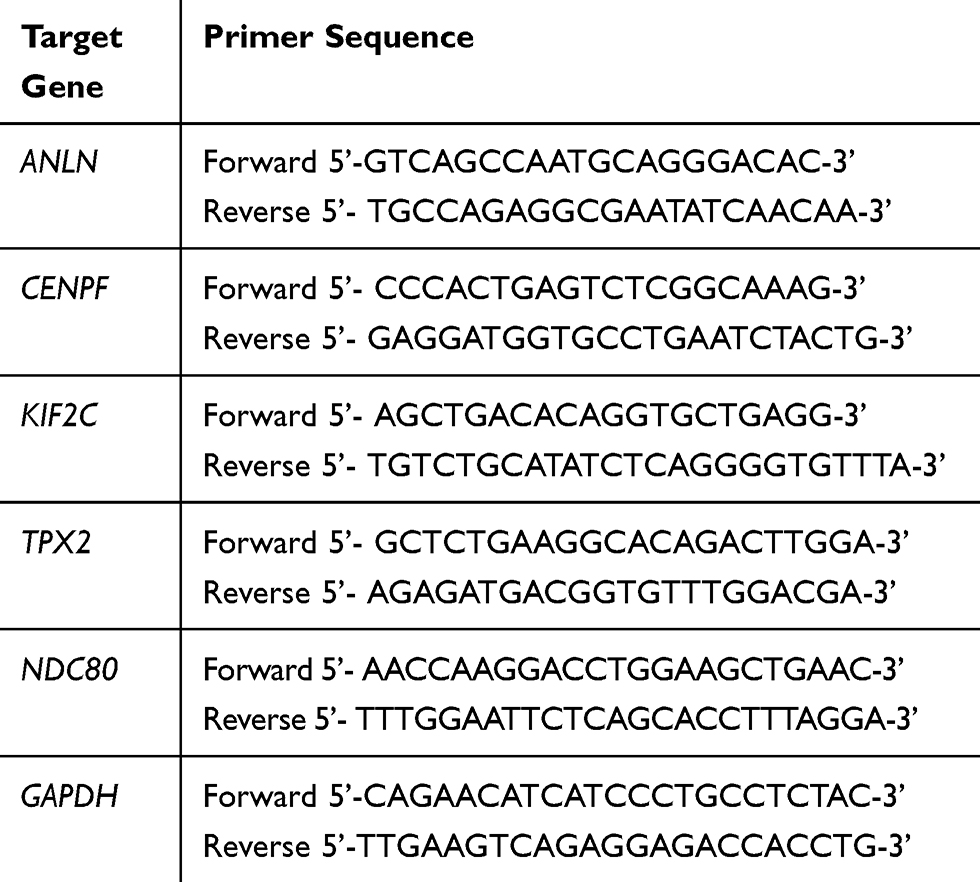 |
Table 1 Primer Sequences Used to Amplify Target Genes by Real-Time RT-PCR |
Statistical Analysis
Statistical analysis was performed using SPSS 21.0 statistical software (SPSS, Chicago, IL, USA). Each experiment was done at least three independent measurements. All the data were presented as means ± standard deviation (SD). Student’s t-test was used to analyze statistical significance. P<0.05 was considered as significant (*: P<0.05, **: P<0.01, *** P<0.001).
Results
Identification of DEGs
A total of 1388, 2548, 4796, 3004, and 4644 DEGs from GSE9115, GSE29265, GSE33630, GSE53072, and GSE65144 datasets were identified after standardization of the microarray results. As shown in the volcano diagram (Figure 1), red represents upregulated genes and blue downregulated genes. There were 293 overlapped DEGs among the five datasets (Figure 1F). After removing nine genes whose log FC values were inconsistent in the five datasets, 284 overlapped DEGs remained, which included 121 upregulated genes and 163 downregulated genes (Supplementary Table S1). The flowchart of the work was shown in Supplementary Figure S2.
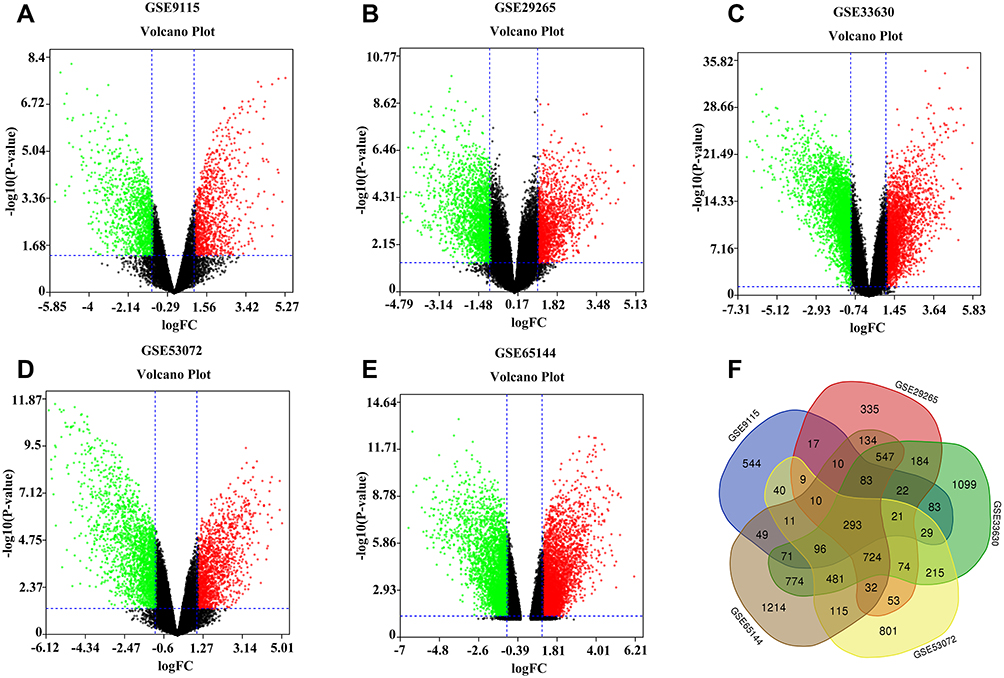 |
Figure 1 Volcano plot of gene expression profile data in ATC and normal samples. (A) Volcano plot of GSE9115, (B) Volcano plot of GSE29265, (C) Volcano plot of GSE33630, (D) Volcano plot of GSE53072, and (E) Volcano plot of GSE65144. The red color represents the upregulation, and the green color represents the downregulation. (F) Venn diagram of the overlapping DEGs. |
Function and Pathway Enrichment Analyses of DEGs
GO and KEGG analyses were performed using the DAVID to investigate the biological function of 284 overlapped DEGs between ATC and normal thyroid tissues. GO analysis showed that the biological processes (BP) terms of the DEGs were significantly enriched in cell division, mitotic nuclear division, metaphase plate congression, mitotic sister chromatid segregation, etc. The molecular function (MF) terms also indicated that the DEGs were significantly enriched in ATP binding, signal transducer activity, protein binding, etc. In the cell component (CC) ontology, the DEGs were mainly enriched in kinetochore, extracellular exosome, proteinaceous extracellular matrix, spindle midzone, etc. Figure 2 shows the top 10 enriched functions of BP, CC, and MF, respectively. In addition, the DEGs were mainly enriched in seven KEGG pathways (p<0.05), which included Cell cycle, Fanconi anemia pathway, Oocyte meiosis, DNA replication, Central carbon metabolism in cancer and HIF-1 signaling pathway (Figure 2D).
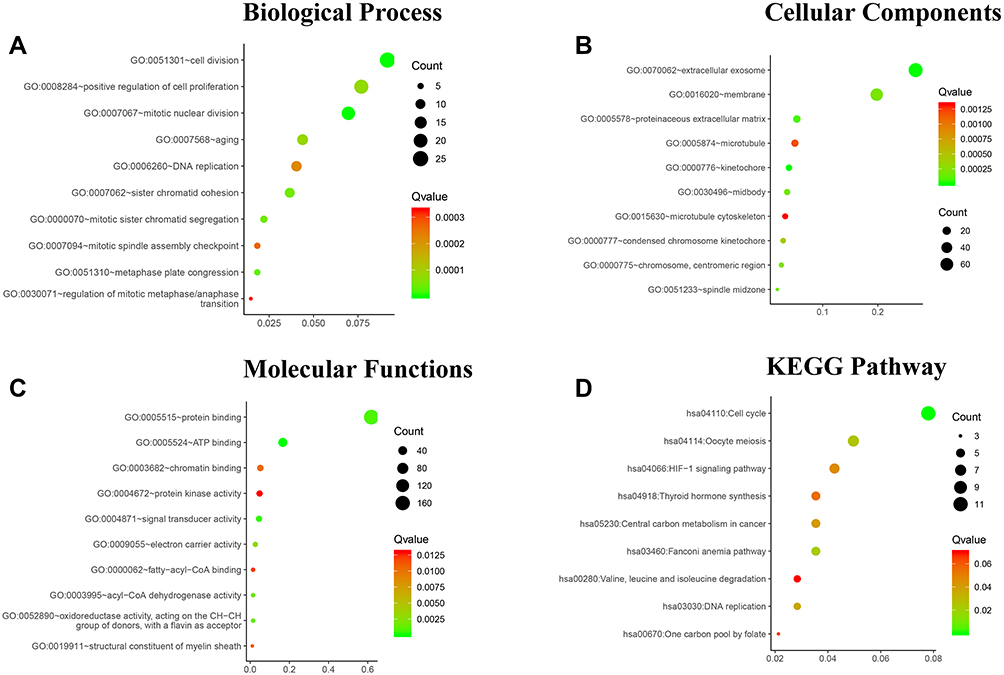 |
Figure 2 Functional and pathway enrichment analyses of the overlapping DEGs in ATC. (A) Biological Process (BP), (B) Cellular Component (CC), (C) Molecular Function (MF), (D) and KEGG pathway analyses. The x-axis represents the Q value, and the y-axis represents the GO term. The GO terms were measured by the rich factor, Q value, and number of genes enriched. |
Protein–Protein Interaction (PPI) Network Construction
The PPI networks of 284 DEGs were analyzed by using the String database, and 232 DEGs with a combined score >0.4 were imported into the Cytoscape software for further analysis. As shown in Figure 3A, the PPI network consisted of 232 nodes interacting via 1674 edges. The hub genes were obtained according to the screening criteria: i) The PPI network model was analyzed by MCODE. Among the results analyzed by default, there was one model with model score >3 and node number >5 (model score =47.16 and node number =52), including 52 genes; ii) Select the top 50 targets of MCC algorithm in CytoHubba; iii) The average degree value was 14.43103448, and 53 genes were more than twice the average degree. Finally, 50 genes that satisfied all three conditions were regarded as hub genes. These hub genes were CCNA2, TYMS, CCNB2, AURKA, TPX2, KIF11, KIF2C, MAD2L1, BUB1B, CDC6, CDCA8, UBE2C, PBK, CENPF, RAD51, NUSAP1, MKI67, CENPE, TRIP13, BUB1, MCM4, TTK, NCAPH, KIF23, CEP55, NDC80, FEN1, DTL, RAD54L, KIAA0101, MCM6, ESPL1, HMMR, FOXM1, PRC1, SMC4, NEK2, EZH2, HELLS, WDHD1, ASF1B, CKS2, UHRF1, POLE2, ANLN, KIF14, UBE2T, BLM, ZWILCH, FAM83D. The 50 hub genes were showed as a heat map in Figure 3B, and the details about the 50 hub genes were showed in Supplementary Table S2.
 |
Figure 3 PPI network analysis of the DEGs. (A) The protein–protein network construction of the 233 DEGs. The yellow nodes denote the 50 hub genes, the pink nodes denote the remaining 183 DEGs. Triangles represent upregulated genes, and V-shape represents downregulated genes. (B) The heatmap of the 50 hub genes. Red represents upregulated genes. |
Survival Analysis
Kaplan–Meier plotter was employed to analyze the prognostic values of the 50 hub genes in thyroid carcinoma. Consistent with the survival analysis, the five genes (ANLN, CENPF, KIF2C, TPX2, and NDC80) were uploaded to the database and Kaplan–Meier curves were plotted. As shown in Figure 4, the red line denoted thyroid carcinoma patients with high expression of the hub gene, and the black line denoted thyroid carcinoma patients with low expression of the hub gene. The low gene expression group was the control group. Compared with the low gene expression group, the high expressions of ANLN (HR=2.99; 95% CI: 1.04–8.61), CENPF (HR=3.33; 95% CI: 1.16–9.85), KIF2C (HR=2.96; 95% CI: 1.1–7.97), TPX2 (HR=3.27; 95% CI: 1.14–9.42), and NDC80 (HR=2.59; 95% CI: 0.97–6.92) were associated with the poor survival of ATC patients (P<0.05). While the high expressions of other hub genes were not related to the overall survival of thyroid carcinoma patients. So the five genes were chosen from the 50 hub genes.
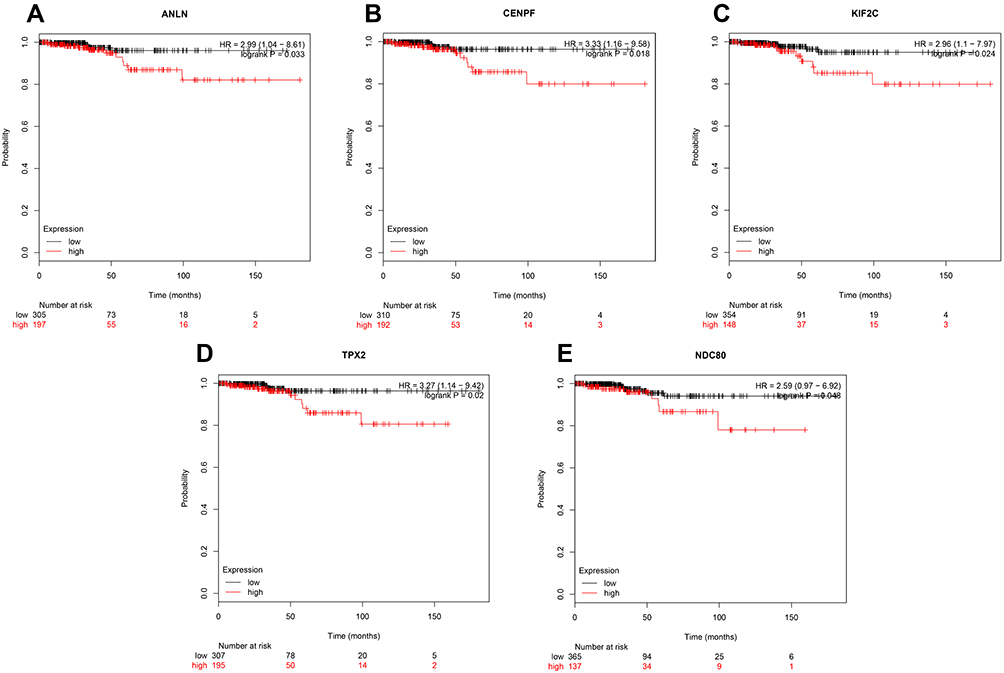 |
Figure 4 The prognostic curve of five genes. The prognostic significance of the hub genes in patients with TC, according to the Kaplan–Meier plotter database. (A) ANLN; (B) CENPF; (C) KIF2C; (D) TPX2; (E) NDC80. The red lines denote patients with high gene expression, and black lines denote patients with low gene expression. |
In order to strengthen the explanation of the possible connection between the five genes, we used the String database to analyze the five genes again (Supplementary Figure S3). As shown in the Supplementary Figure S3A, the protein–protein interaction (PPI) network of the five genes consisted of the 10 edges with an average degree of 4. The top 10 significantly enriched terms in biological processes (BP), all terms in cell component (CC) and KEGG correspond to the criterion (P<0.05) were showed in Figure S3 B, C and D.
The Transcriptional Expression Level of the Five Genes
The five genes (ANLN, CENPF, KIF2C, TPX2, and NDC80) were significantly upregulated in ATC compared to that of normal thyroid tissues in microarray datasets GSE9115, GSE29265, GSE33630, GSE53072, and GSE65144 (Figure 5).
 |
Figure 5 The mRNA expression of the five genes in five microarray datasets. The mRNA expressions of ANLN, CENPF, KIF2C, TPX2 and NDC80 in five microarray datasets (GSE9115, GSE29265, GSE33630, GSE53072, and GSE65144) respectively. The red dots represent a high gene expression, and blue dots represent a low gene expression. ** P < 0.01, *** P < 0.001 vs nontumor. |
To further verify the results of bioinformatics analysis, the mRNA levels of the five genes were determined in normal thyroid follicular epithelial Nthy-ori 3–1 cells, anaplastic differentiated thyroid cancer ARO cells and CAL-62 cells with RT-qPCR. Each RT-qPCR was done at least three independent measurements. As shown in Figure 6, compared with the Nthy-ori 3–1 cells group, the expression of ANLN was decreased by 23.1% (P<0.01) and 36.9% (P<0.01) in ARO cells and CAL-62 cells, respectively. The expression of CENPF was upregulated by 39.6% (P<0.001) and 42.4% (P<0.01) in ARO cells and CAL-62 cells, respectively. The expression of KIF2C was upregulated by 1.3 times (P<0.05) and 1.5 times (P<0.05) in ARO cells and CAL-62 cells, respectively. The expression of TPX2 was decreased by 0.5% (P>0.05) and upregulated by 81.9% (P<0.05) in ARO cells and CAL-62 cells. The expression of NDC80 was decreased by 23.18.1% (P<0.001) and 39.5% (P<0.001) in ARO cells and CAL-62 cells, respectively. The results showed that KIF2C and CENPF were significantly upregulated in ARO cells and CAL-62 cells compared to that of Nthy-ori 3–1 cells, while TPX2 was upregulated only in CAL-62 cells. Inconsistent with the results in the GEO database, ANLN and NDC80 were obviously decreased in ARO cells and CAL-62 cells (Figure 6).
 |
Figure 6 The mRNA expression of the five genes in cell lines. The mRNA expressions of the five genes were detected in normal thyroid follicular epithelial Nthy-ori 3–1 cells, anaplastic differentiated thyroid cancer ARO cells and CAL-62 cells by quantitative real-time PCR. (A) ANLN; (B) CENPF; (C) KIF2C; (D) TPX2; (E) NDC80. * P < 0.05, ** P < 0.01, *** P < 0.001 vs Nthy ori 3–1. |
Discussion
Anaplastic thyroid cancer (ATC) is an undifferentiated, aggressive malignancy with a tendency of early distant metastases. It is challenging to diagnose ATC in the early stage, and once diagnosed, it is mostly in the middle or late stages, with short survival periods and high mortality.28 At present, the treatment method of ATC is mainly through traditional surgery, but it has not achieved sound therapeutic effects.29,30 With the rapid development of molecular biology, especially in the technical breakthrough of tumor molecular medicine, we have a better understanding of the occurrence and development of tumors. It is generally believed that ATC is caused by multiple genes, multiple pathways, various phases, and numerous factors. In recent years, the development of high-throughput chip technology has dramatically helped the screening and research of differential genes, which are expected to become one of the development directions of ATC therapy.31 Some potential therapeutic targets, such as PBF, PTTG, BCL2, and hsa-miR-181a-5p, have been found in thyroid carcinoma by using chip technology.32,33 The aim of this study is to identify DEGs with an analysis of comprehensive bioinformatics and establish a foundation for future research of ATC. In this study, the expression profile data of ATC in the GEO database were excavated. The results showed that high levels of ANLN, CENPF, KIF2C, TPX2, and NDC80 indicated poor prognosis in ATC, suggesting that intervention of these genes might be a promising strategy for ATC treatment. Liu’s meta-analysis of microarray datasets identified TRIP13, DLGAP5, HJURP, CDKN3, NEK2, KIF15, TTK, KIF2C, AURKA and TPX2 as cell cycle-related key genes potentially contributing to anaplastic thyroid carcinoma,34 which were in consistence with some of our results (KIF2C, TPX2).
Anillin (encoded by ANLN), an actin‐binding protein, is mainly located in the cytoskeleton and nucleus. It was first identified in Drosophila and plays a critical role in cytokinesis. In recent years, ANLN has been involved in the occurrence and development of various malignant tumors such as colon cancer, breast cancer,35–37 pancreatic cancer,38 which can promote the growth, migration, and infiltration of tumor cells.
Centromere Protein F (CENPF), a cell cycle-associated nuclear antigen, involves in the regulation of DNA synthesis and cell cycle progression. It is identified as a marker of cell proliferation and metastasis in several human carcinomas.39–41 A large number of studies have shown that the expression of CENPF is abnormally elevated in various malignant tumors such as hepatocellular carcinomas,40 prostate cancer,41,42 breast cancer39 and so on, which is related to the prognosis of patients.
Kinesin family member 2C (KIF2C), a mitotic centromere associated kinesin (MCAK), mainly localizes to the nucleoplasm, regulating mitosis and cell cycle. Some studies have shown that KIF2C is highly expressed in breast cancer, colon cancer, and other tumors, and is not beneficial to the prognosis of patients.43 Zaganjor et al showed that KIF2C was highly expressed in non-small cell lung cancer and enhanced the migration ability of tumor cells.44
Nuclear division cycle 80 (NDC80), a nuclear division cycle protein, mainly localizes to the nucleoplasm and centrosome, which is highly expressed in the cells with vigorous division, such as tumor cells. NDC80 plays an essential role in normal cell mitosis, maintenance of chromosomal stability, and tumor development. It has been found that overexpression of NDC80 could cause the mitotic checkpoint to be continuously hyperactivated and induce tumor formation in vivo. In osteosarcoma, the expression level of NDC80 was related to the TNM stage and distant metastasis, and NDC80 is an independent prognostic indicator.45 Ju et al showed that NDC80 induced hepatocarcinogenesis mainly through its value-added and anti-apoptosis effects.
Targeting protein for Xenopus kinesin-like protein 2 (TPX2), mainly localizes to the nucleoplasm, is a newly discovered protein regulates cell cycle and associates with nuclear proliferation.46 Recent studies have shown that TPX2 is related to tumorigenesis, its expression level in malignant tumors increases, and it can induce tumor differentiation and growth. The expression level of TPX2 is associated with metastasis and recurrence of multiple tumors, such as breast cancer,47 bladder cancer,48 hepatocellular carcinoma,49 and so on. Blocking the expression of TPX2 may be a potential target for tumor therapy.
As shown in Supplementary Figure S3, the results indicated that the five genes play important roles in regulations of cell division, mitotic cell cycle process, metaphase plate congression, mitotic cell cycle phase transition, chromosome segregation, etc. In the CC ontology, the five genes were mainly enriched in condensed chromosome kinetochore, condensed chromosome outer kinetochore, cytoskeletal part, microtubule cytoskeleton, microtubule organizing center. In addition, the five genes were mainly enriched in seven KEGG pathways (p<0.05), which included Amplification of signal from unattached kinetochores via a MAD2 inhibitory signal, Separation of Sister Chromatids, Resolution of Sister Chromatid Cohesion, RHO GTPases Activate Formins, Cell Cycle, and G2/M Transition. Among them, Cell Cycle pathways showed the largest number of genes count: CENPF, KIF2C, NDC80, and TPX2.
The above research indicated that the five genes were mainly involved in the regulation of the cell cycle, so they may affect the reoccurrence and metastasis of ATC by regulating the cell cycle. In this study, the RT-qPCR was used to further verify the expression of these five genes in ATC cells. Consistent with the survival analysis, CENPF and KIF2C have a high mRNA level in ARO cells and CAL-62 cells, which may affect the progress of ATC by regulating the cell cycle. The mRNA levels of TPX2 were upregulated significantly only in CAL-62 cells and not in ARO cells compared to that of Nthy-ori 3–1 cells, suggesting that TPX2 overexpression may only affect the progress of CAL-62 cells by regulating cell cycle. However, ANLN and NDC80 were obviously decreased in ARO cells and CAL-62 cells. The mRNA expressions of ANLN and NDC80 are inconsistent with the results in the GEO database. Gene locates in the nucleus of the cell. So, the genes in cells and their tissues are the same. As for the inconsistent results, the possible reasons are as follows: (1) The five genes were screened from 42 ATC tissues of different patients at different stages of the disease (it covers more gene characteristics than two cell lines), while the two cell lines were immortalized from two ATC patients. The two cell lines could only show some gene characteristics of the disease. (2) The results in the GEO database used the RNA-seq method, but we used RT-qPCR method to verify the final five genes. RNA-seq is used for large-scale screening, reflecting the overall gene expression change trend of the sample, but it cannot be guaranteed that the changing trend of each gene is consistent with RT-qPCR.50 RNA-seq and RT-qPCR are two different experimental platforms themselves, and the two cannot correspond to each other.50,51 (3) GEO databases are tissue samples, our experimental samples are cells. Pan’s study indicated that the hub genes showed inconsistent trends in ATC tissues, which may be due to the heterogeneity between cell line data and tumor tissue data.52 So, only three of the five genes screened were validated in cell lines. The inconsistent results should be understandable. We will verify the mechanisms of CENPF, KIF2C, and TPX2 in the reoccurrence and metastasis of ATC in ARO cells and CAL-62 cells.
Researches in thyroid cancer have been hot in recent years. There are many articles published every year on thyroid cancer. In order to keep step with the new developments and findings, knowledge needs to be updated every two or three years, even in the same area of research. Although DEGs have been studied in ATC, different from previous studies, five microarray datasets were used for the analysis of DEGs in this study, whereas Hu’s only used three microarray datasets.53 In addition, the analysis process was totally different from the previous studies: (1) Our study used five microarray datasets, whereas Hu’s only used three microarray datasets. Our five microarray datasets included the Hu’s three and two more datasets. So, our study analyzed seventy-six normal thyroid tissues and forty-two anaplastic thyroid carcinoma tissues while Hu’s study analyzed twenty-one normal thyroid tissues and twenty-two anaplastic thyroid carcinoma tissues. The more samples, the less bias.53 (2) We had the volcano diagram (Figure 1) of gene expression profiles in ATC and normal samples. It was much easy for the readers to find the upregulated genes (presented in red) and downregulated genes (presented in blue), while Hu’s and Pan’s study did not have.52,53 (3) We have used three generally recognized screening methods of the hub genes, including Molecular Complex Detection plugin (MCODE), Maximal Clique Centrality (MCC) and Degree Centrality (DC) in PPI network, and selected the overlapping genes of the three methods to make the final results most valuable. The overlapping genes were then conducted survival analysis using the Kaplan–Meier plotter to get the most important five genes that closely related to the survival of ATC patients. However, many studies only used MCODE to screen hub genes in PPI network.16,24,54 Cao’s study used MCODE and MCC methods to screen hub genes in PPI network.16 Zhang’s study identified the height nodes as hub genes.54 The top 10 DEGs with highest node degree were regarded as hub genes of ATC in Pan’s study.52 Hu’s study did not do the screening with any of those screening methods. They simply get the top 10 hub genes by PPI network.53 In addition, preliminary verification in vitro was done and three of the five important genes were identified, while Hu’s study did not verify their results of Bioinformatics analysis with experiments.53 In summary, our study analyzed more microarray datasets, used more reasonable and rigorous screening methods to screen the hub genes, and has verified the final five genes through cell experiments. The results were more convincing in our study compared with previous studies.
In summary, the DEGs related to the reoccurrence and metastasis of ATC were analyzed by gene chip combined with integrated bioinformatics analysis. Our results showed that CENPF, KIF2C, and TPX2 have high mRNA levels in ATC cells, which were significantly associated with thyroid carcinoma prognosis. And the results showed that KIF2C has the highest mRNA expression in ARO cells and CAL-62 cells among the three genes. In addition, the bioinformatics results showed that CENPF, KIF2C, and TPX2 might affect the progress of ATC by regulating cell cycle. Therefore, the druggability of the biomarkers CENPF, KIF2C, and TPX2 are expected to treat ATC patients by regulating cell cycle, and the druggability of the biomarkers KIF2C may have the best results, while their preclinical and clinical values require further validation. Our study results indicated that the three genes might be novel biomarkers for the treatment of ATC, and further experiments are required to verify the effects and specific mechanisms of these genes on ATC.
Funding
This study was funded by the National Natural Science Foundation of China (81770822, 81570742) and Grant for the Development of Science and Technology of Jinan City (201602172).
Disclosure
The authors report no conflicts of interest in this work.
References
1. Bray F, Ferlay J, Soerjomataram I, et al. Global cancer statistics 2018: GLOBOCAN estimates of incidence and mortality worldwide for 36 cancers in 185 countries. CA Cancer J Clin. 2018;68(6):394–424. doi:10.3322/caac.21492
2. La Vecchia C, Malvezzi M, Bosetti C, et al. Thyroid cancer mortality and incidence: a global overview. Int J Cancer. 2015;136(9):2187–2195. doi:10.1002/ijc.29251
3. Valerio L, Pieruzzi L, Giani C, et al. Targeted Therapy in Thyroid Cancer: state of the Art. Clin Oncol. 2017;29(5):316–324. doi:10.1016/j.clon.2017.02.009
4. Antonelli A, La Motta C. Novel therapeutic clues in thyroid carcinomas: the role of targeting cancer stem cells. Med Res Rev. 2017;37(6):1299–1317. doi:10.1002/med.21448
5. Spitzweg C, Bible KC, Hofbauer LC, et al. Advanced radioiodine-refractory differentiated thyroid cancer: the sodium iodide symporter and other emerging therapeutic targets. Lancet Diabetes Endocrinol. 2014;2(10):830–842. doi:10.1016/S2213-8587(14)70051-8
6. Hong CM, Ahn BC. Redifferentiation of Radioiodine Refractory Differentiated Thyroid Cancer for Reapplication of I-131 Therapy. Front Endocrinol (Lausanne). 2017;8:260.
7. Tiedje V, Stuschke M, Weber F, et al. Anaplastic thyroid carcinoma: review of treatment protocols. Endocr Relat Cancer. 2018;25(3):R153–R161. doi:10.1530/ERC-17-0435
8. Vogelstein B, Papadopoulos N, Velculescu VE, et al. Cancer genome landscapes. Science. 2013;339(6127):1546–1558. doi:10.1126/science.1235122
9. Chen W, et al. Identification of key candidate tumor biomarkers in non-small-cell lung cancer by in silico analysis. Oncol Lett. 2020;19(1):1008–1016.
10. Li C, et al. Identification of potential core genes in metastatic renal cell carcinoma using bioinformatics analysis. Am J Transl Res. 2019;11(11):6812–6825.
11. Barrett T, Wilhite SE, Ledoux P, et al. NCBI GEO: archive for functional genomics data sets–update. Nucleic Acids Res. 2013;41(Database issue):D991–D995. doi:10.1093/nar/gks1193
12. Pfeifer SP. From next-generation resequencing reads to a high-quality variant data set. Heredity. 2017;118(2):111–124. doi:10.1038/hdy.2016.102
13. Li MX, Jin L-T, Wang T-J, et al. Identification of potential core genes in triple negative breast cancer using bioinformatics analysis. Onco Targets Ther. 2018;11:4105–4112. doi:10.2147/OTT.S166567
14. Ma Q, Xu Y, Liao H, et al. Identification and validation of key genes associated with non-small-cell lung cancer. J Cell Physiol. 2019;234(12):22742–22752. doi:10.1002/jcp.28839
15. Zhang X, Gao C, Liu L, et al. DNA methylation-based diagnostic and prognostic biomarkers of nonsmoking lung adenocarcinoma patients. J Cell Biochem. 2019;120(8):13520–13530. doi:10.1002/jcb.28627
16. Cao L, Chen Y, Zhang M, et al. Identification of hub genes and potential molecular mechanisms in gastric cancer by integrated bioinformatics analysis. PeerJ. 2018;6:e5180. doi:10.7717/peerj.5180
17. Chen Q, Yu D, Zhao Y, et al. Screening and identification of hub genes in pancreatic cancer by integrated bioinformatics analysis. J Cell Biochem. 2019;120(12):19496–19508. doi:10.1002/jcb.29253
18. Yan H, Zheng G, Qu J, et al. Identification of key candidate genes and pathways in multiple myeloma by integrated bioinformatics analysis. J Cell Physiol. 2019;234(12):23785–23797. doi:10.1002/jcp.28947
19. Dennis G, Sherman BT, Hosack DA, et al. DAVID: database for Annotation, Visualization, and Integrated Discovery. Genome Biol. 2003;4(5):P3. doi:10.1186/gb-2003-4-5-p3
20. Ke ZB, Cai H, Wu Y-P, et al. Identification of key genes and pathways in benign prostatic hyperplasia. J Cell Physiol. 2019;234(11):19942–19950. doi:10.1002/jcp.28592
21. Szklarczyk D, Franceschini A, Wyder S, et al. STRING v10: protein-protein interaction networks, integrated over the tree of life. Nucleic Acids Res. 2015;43(Database issue):D447–D452. doi:10.1093/nar/gku1003
22. Szklarczyk D, Morris JH, Cook H, et al. The STRING database in 2017: quality-controlled protein-protein association networks, made broadly accessible. Nucleic Acids Res. 2017;45(D1):D362–D368. doi:10.1093/nar/gkw937
23. Shannon P, et al. Cytoscape: a software environment for integrated models of biomolecular interaction networks. Genome Res. 2003;13(11):2498–2504. doi:10.1101/gr.1239303
24. Tu J, Chen J, He M, et al. Bioinformatics analysis of molecular genetic targets and key pathways for hepatocellular carcinoma. Onco Targets Ther. 2019;12:5153–5162. doi:10.2147/OTT.S198802
25. Chin CH, Chen S-H, Wu -H-H, et al. cytoHubba: identifying hub objects and sub-networks from complex interactome. BMC Syst Biol. 2014;8(Suppl4):S11. doi:10.1186/1752-0509-8-S4-S11
26. Zhang Y, Li Y, Mao X, et al. Thyroid hormone synthesis: a potential target of a Chinese herbal formula Haizao Yuhu Decoction acting on iodine-deficient goiter. Oncotarget. 2016;7(32):51699–51712. doi:10.18632/oncotarget.10329
27. Gyorffy B, Lanczky A, Eklund AC, et al. An online survival analysis tool to rapidly assess the effect of 22,277 genes on breast cancer prognosis using microarray data of 1809 patients. Breast Cancer Res Treat. 2010;123(3):725–731. doi:10.1007/s10549-009-0674-9
28. Higashiyama T, Ito Y, Hirokawa M, et al. Induction chemotherapy with weekly paclitaxel administration for anaplastic thyroid carcinoma. Thyroid. 2010;20(1):7–14. doi:10.1089/thy.2009.0115
29. Cornett WR, Sharma AK, Day TA, et al. Anaplastic thyroid carcinoma: an overview. Curr Oncol Rep. 2007;9(2):152–158. doi:10.1007/s11912-007-0014-3
30. Zarebczan B, Chen H. Multi-targeted approach in the treatment of thyroid cancer. Minerva Chir. 2010;65(1):59–69.
31. Xu B, Ghossein R. Genomic Landscape of poorly Differentiated and Anaplastic Thyroid Carcinoma. Endocr Pathol. 2016;27(3):205–212. doi:10.1007/s12022-016-9445-4
32. Read ML, et al. Elevated PTTG and PBF predicts poor patient outcome and modulates DNA damage response genes in thyroid cancer. Oncogene. 2017;36(37):5296–5308.
33. Zhang C, Bo C, Guo L, et al. BCL2 and hsa-miR-181a-5p are potential biomarkers associated with papillary thyroid cancer based on bioinformatics analysis. World J Surg Oncol. 2019;17(1):221. doi:10.1186/s12957-019-1755-9
34. Liu M, Qiu Y-L, Jin T, et al. Meta-analysis of microarray datasets identify several chromosome segregation-related cancer/testis genes potentially contributing to anaplastic thyroid carcinoma. PeerJ. 2018;6:e5822. doi:10.7717/peerj.5822
35. Wang Z, Chen J, Zhong M-Z, et al. Overexpression of ANLN contributed to poor prognosis of anthracycline-based chemotherapy in breast cancer patients. Cancer Chemother Pharmacol. 2017;79(3):535–543. doi:10.1007/s00280-017-3248-2
36. Magnusson K, Gremel G, Rydén L, et al. ANLN is a prognostic biomarker independent of Ki-67 and essential for cell cycle progression in primary breast cancer. BMC Cancer. 2016;16(1):904. doi:10.1186/s12885-016-2923-8
37. Zhou W, Wang Z, Shen N, et al. Knockdown of ANLN by lentivirus inhibits cell growth and migration in human breast cancer. Mol Cell Biochem. 2015;398(1–2):11–19. doi:10.1007/s11010-014-2200-6
38. Idichi T, Seki N, Kurahara H, et al. Regulation of actin-binding protein ANLN by antitumor miR-217 inhibits cancer cell aggressiveness in pancreatic ductal adenocarcinoma. Oncotarget. 2017;8(32):53180–53193. doi:10.18632/oncotarget.18261
39. Sun J, Huang J, Lan J, et al. Overexpression of CENPF correlates with poor prognosis and tumor bone metastasis in breast cancer. Cancer Cell Int. 2019;19(1):264. doi:10.1186/s12935-019-0986-8
40. Kim HE, Kim D-G, Lee KJ, et al. Frequent amplification of CENPF, GMNN and CDK13 genes in hepatocellular carcinomas. PLoS One. 2012;7(8):e43223. doi:10.1371/journal.pone.0043223
41. Shi J, Zhang P, Liu L, et al. Weighted gene coexpression network analysis identifies a new biomarker of CENPF for prediction disease prognosis and progression in nonmuscle invasive bladder cancer. Mol Genet Genomic Med. 2019;7(11):e982. doi:10.1002/mgg3.982
42. Gobel C, Özden C, Schroeder C, et al. Upregulation of centromere protein F is linked to aggressive prostate cancers. Cancer Manag Res. 2018;10:5491–5504. doi:10.2147/CMAR.S165630
43. Gnjatic S, et al. NY-CO-58/KIF2C is overexpressed in a variety of solid tumors and induces frequent T cell responses in patients with colorectal cancer. Int J Cancer. 2010;127(2):381–393.
44. Zaganjor E, Osborne JK, Weil LM, et al. Ras regulates kinesin 13 family members to control cell migration pathways in transformed human bronchial epithelial cells. Oncogene. 2014;33(47):5457–5466. doi:10.1038/onc.2013.486
45. Xu B, et al. Elevated NDC80 expression is associated with poor prognosis in osteosarcoma patients. Eur Rev Med Pharmacol Sci. 2017;21(9):2045–2053.
46. Wei JH, Zhang ZC, Wynn RM, et al. GM130 Regulates Golgi-Derived Spindle Assembly by Activating TPX2 and Capturing Microtubules. Cell. 2015;162(2):287–299. doi:10.1016/j.cell.2015.06.014
47. Tan GZ, et al. MiR-491 suppresses migration and invasion via directly targeting TPX2 in breast cancer. Eur Rev Med Pharmacol Sci. 2019;23(22):9996–10004.
48. Li F, et al. HnRNP-F promotes cell proliferation by regulating TPX2 in bladder cancer. Am J Transl Res. 2019;11(11):7035–7048.
49. Huang DH, et al. TPX2 silencing exerts antitumor effects on hepatocellular carcinoma by regulating the PI3K/AKT signaling pathway. Int J Mol Med. 2019;44(6):2113–2122.
50. Costa C, et al. Comprehensive molecular screening: from the RT-PCR to the RNA-seq. Transl Lung Cancer Res. 2013;2(2):87–91.
51. Yang M, Cousineau A, Liu X, et al. Direct Metatranscriptome RNA-seq and Multiplex RT-PCR Amplicon Sequencing on Nanopore MinION - Promising Strategies for Multiplex Identification of Viable Pathogens in Food. Front Microbiol. 2020;11:514. doi:10.3389/fmicb.2020.00514
52. Pan Z, Li L, Fang Q, et al. Integrated Bioinformatics Analysis of Master Regulators in Anaplastic Thyroid Carcinoma. Biomed Res Int. 2019;2019:9734576. doi:10.1155/2019/9734576
53. Hu S, Liao Y, Chen L. Identification of Key Pathways and Genes in Anaplastic Thyroid Carcinoma via Integrated Bioinformatics Analysis. Med Sci Monit. 2018;24:6438–6448. doi:10.12659/MSM.910088
54. Ni W, Zhang S, Jiang B, et al. Identification of cancer-related gene network in hepatocellular carcinoma by combined bioinformatic approach and experimental validation. Pathol Res Pract. 2019;215(6):152428. doi:10.1016/j.prp.2019.04.020
 © 2020 The Author(s). This work is published and licensed by Dove Medical Press Limited. The
full terms of this license are available at https://www.dovepress.com/terms
and incorporate the Creative Commons Attribution
- Non Commercial (unported, 3.0) License.
By accessing the work you hereby accept the Terms. Non-commercial uses of the work are permitted
without any further permission from Dove Medical Press Limited, provided the work is properly
attributed. For permission for commercial use of this work, please see paragraphs 4.2 and 5 of our Terms.
© 2020 The Author(s). This work is published and licensed by Dove Medical Press Limited. The
full terms of this license are available at https://www.dovepress.com/terms
and incorporate the Creative Commons Attribution
- Non Commercial (unported, 3.0) License.
By accessing the work you hereby accept the Terms. Non-commercial uses of the work are permitted
without any further permission from Dove Medical Press Limited, provided the work is properly
attributed. For permission for commercial use of this work, please see paragraphs 4.2 and 5 of our Terms.