Back to Journals » Journal of Hepatocellular Carcinoma » Volume 9
Identification and Validation in a Novel Classification of Helicase Patterns for the Prediction of Tumor Proliferation and Prognosis
Authors Yin Y, Xu ZY, Liu YJ ![]() , Huang W, Zhang Q, Li JP
, Huang W, Zhang Q, Li JP ![]() , Zou X
, Zou X
Received 17 June 2022
Accepted for publication 10 August 2022
Published 27 August 2022 Volume 2022:9 Pages 885—900
DOI https://doi.org/10.2147/JHC.S378175
Checked for plagiarism Yes
Review by Single anonymous peer review
Peer reviewer comments 2
Editor who approved publication: Prof. Dr. Imam Waked
Yi Yin,1,2,* Zi-Yuan Xu,1,2,* Yuan-jie Liu,1,2 Wei Huang,1,2 Qian Zhang,1,2 Jie-pin Li,1– 3 Xi Zou1,2,4
1Department of Oncology, Affiliated Hospital of Nanjing University of Chinese Medicine, Jiangsu Province Hospital of Chinese Medicine, Nanjing, Jiangsu, 210029, People’s Republic of China; 2No. 1 Clinical Medical College, Nanjing University of Chinese Medicine, Nanjing, Jiangsu, 210023, People’s Republic of China; 3Department of Oncology, Zhangjiagang TCM Hospital Affiliated to Nanjing University of Chinese Medicine, Zhangjiagang, Jiangsu, 215600, People’s Republic of China; 4Jiangsu Collaborative Innovation Center of Traditional Chinese Medicine in Prevention and Treatment of Tumor, Nanjing, Jiangsu, 210029, People’s Republic of China
*These authors contributed equally to this work
Correspondence: Xi Zou; Jie-pin Li, Email [email protected]; [email protected]
Background: Helicases have been classified as a class of enzymes that determine the stability of the cellular genome. There is growing evidence that helicases can help tumor cells resist drug killing by repairing Deoxyribose Nucleic Acid (DNA) or stabilizing transcription, which may contribute to the understanding of drug resistance. Currently, identifying cancer biomarkers among helicases and stratifying patients according to helicase activity will be able to guide treatment well.
Methods: We clustered 371 hepatocellular carcinoma (HCC) patients from The Cancer Genome Atlas (TCGA) by consensus clustering based on helicase expression profiles to identify potential molecular subtypes. The Multiscale Embedded Gene Co-Expression Network Analysis (MEGENA) algorithm was used to find core differential gene modules between different molecular subtypes, and single-cell analysis was utlized to explore the potential function of hub gene. Immunohistochemical (IHC) staining was used to verify the diagnostic value of DDX56 and its ability to reflect the proliferation efficiency of cancer cells.
Results: We identified two subtypes associated with helicase. High helicase subtype was associated with poor clinical outcome, massive M0 macrophage infiltration, and highly active cell proliferation features. In addition, we identified a new biomarker, DDX56, which has not been reported in HCC, was highly expressed in HCC tissues, associated with poor prognosis, and was also shown to be associated with high cell proliferative activity.
Conclusion: In conclusion, based on helicase expression profiles, we have developed a new classification system for HCC, which is a proliferation-related system, and has clinical significance in evaluating prognosis and treating HCC patients, including immunotherapy and chemotherapy. In addition, we identified a new biomarker, DDX 56, which is overexpressed in HCC tissues, predicts a poor prognosis and is a validated index of tumor cell proliferation.
Keywords: helicases, hepatocellular carcinoma, DDX56, bioinformatics
Introduction
The most common and lethal type of primary liver cancer is hepatocellular carcinoma (HCC), which accounts for approximately 75% to 90% of all cases and is followed by cholangiocarcinoma.1–3 HCC is now the third leading cause of cancer-caused death worldwide, placing a heavy economic burden on healthcare systems and demonstrating that HCC is a major health problem.4 Although classical treatment strategies based on clinical risk stratification are currently widely used in the clinic, the effect of these strategies on improving the prognosis of HCC patients was recently challenged.5,6 With the development of precision medicine based on molecular diagnosis and treatment, more and more attention is being focused on providing individualized treatment strategies for patients, especially on the discovery of new stratification methods and biomarkers.7–9
Recent studies have shown that there are close direct interactions between helicases and several nuclear proteins that maintain chromosome stability and are potentially important in cancer susceptibility.10 As a key enzyme that determines cell division as well as nuclear transcription, helicases are easily associated with a unique and crucial role in DNA damage response, DNA repair and maintenance of genomic stability.11 Considering that selective inactivation of DNA repair pathways can affect the efficacy of antitumor therapy, selective killing of cancer cells through inactivation of the resolvase-dependent biological pathway using means that regulate helicase expression or function is a feasible strategy.12,13 Overexpression of DDX1 has been proved to be an independent prognostic indicator of early recurrence of breast cancer.14 In addition, it has been shown that high levels of DDX3 are associated with poor prognosis in gallbladder and breast cancers.15,16 In contrast, there is little knowledge of the biological processes involved in DDX56 in cancer species. Only recently, the expression of DDX56 has been proved to be related to lymphatic invasion and distant metastasis in colorectal cancer,17 and it is frequently up-regulated in tumor tissue and osteosarcoma cell lines.18 DDX56 may be related to the early recurrence of squamous cell lung cancer, involving transduction of the Wnt signal pathway,19 which indicates the potential carcinogenic effect of DDX56 in cancer.
In this study, we aim to develop a helicase-related stratification strategy to predict the immune microenvironment, prognosis and response to immunotherapy in HCC and to further search for valuable diagnostic and prognostic markers. In the future, this work could help physicians make important judgments about diagnosis and treatment.
Materials and Methods
Reagents
All reagents and antibodies involved in this study are listed in the Supplementary Materials (Supplementary Table S1). The concentrations of antibodies used are based on those used in previous studies or as recommended by the relevant manufacturer. Specific experimental procedures were included in the Supplementary Materials.
The Research Flowchart
The research flowchart demonstrated our study design (Figure 1).
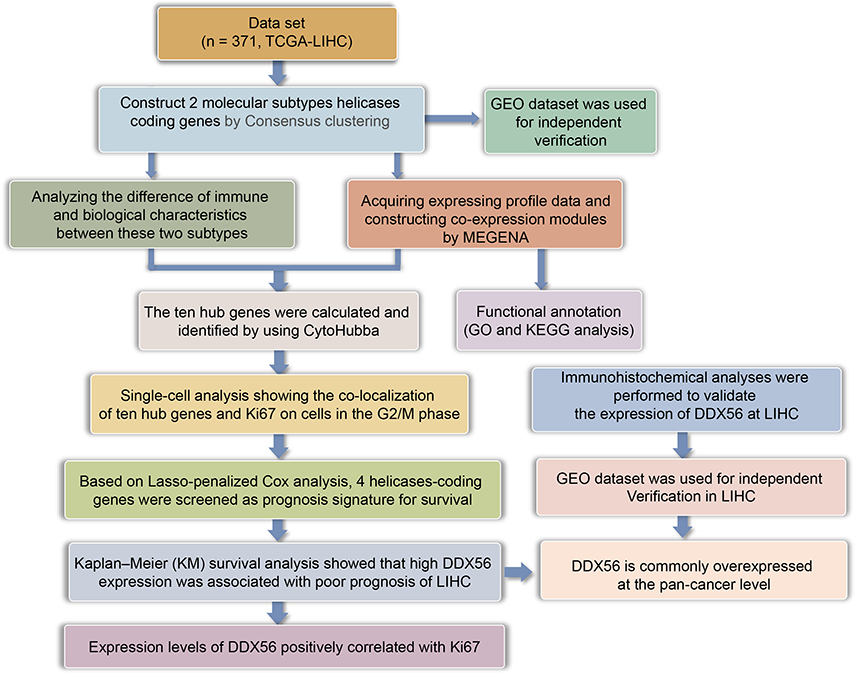 |
Figure 1 The flow chart showing the scheme of our study for hepatocellular carcinoma. |
Clinical Sample Collection and Immunohistochemical (IHC) Staining
This study was conducted in accordance with the Declaration of Helsinki and approved by the ethics committee of the Zhangjiagang TCM Hospital Affiliated to Nanjing University of Chinese Medicine (Ethics Approval No.2022-03-14). Written informed consent was obtained from all patients. Inclusion/exclusion criteria for participants were provided in the Supplementary Material. Immunohistochemical Staining procedures and H-scoring methods have been previously described.20,21 The detailed description was also included in Supplementary Materials.
Cell Culture and Western Blotting
Five human HCC cell lines were used in this study. Those human hepatocarcinoma cell lines (SNU-182/SNU-387/HepG2/Huh7/SK-Hep-1) came from a single supplier, Wuhan Pu-nuo-sai Life Technology Co. Ltd. (Wuhan, China). They were cultivated in Dulbecco’s Modified Eagle’s Medium (DMEM) supplemented with 10% fetal bovine serum (FBS). All the cells were maintained in a humidified 5% CO2 atmosphere at 37°C. The Western blotting protocol was consistent with previous studies.22 The detailed description is shown in Supplementary Materials.
Public Datasets
The RNA-seq transcriptome information and matching clinical data of 374 Liver hepatocellular carcinoma (LIHC) patients and 50 normal control samples were acquired from TCGA portal website.23 To ensure the reproducibility of the analysis results, independent datasets were downloaded from the Gene Expression Omnibus (GEO) database,24 where GSE14520 (n = 220) was used for independent clustering, and GSE36376 (n = 433) and GSE102079 (n = 257) datasets were used for validation of the differential expression analysis results. The single-cell RNA data included in this study were obtained based on a previous HCC study (GSE125449).25
Consensus Clustering
The “ConcensusClusterPlus” R package was conducted to perform consensus clustering to stratify HCC patients based on helicases.26 The ideal cluster numbers between k = 2–6 was then assessed, and this procedure was repeated 1000 times to guarantee stability.
Identification of Differentially Expressed Genes in HCC
The differentially expressed genes (DEGs) were obtained by “Limma” package.27 DEGs with an absolute log2 fold change (FC) >2 and an adjusted P value of <0.05 were considered with statistical significance, and then were used for subsequent analysis.
Enrichment Analysis
The “clusterProfiler” package was used for the Gene Ontology (GO) and Kyoto Encyclopedia of Genes and Genomes (KEGG) enrichment analysis.28,29 In addition, the gene set enrichment analysis (GSEA)-based differential signaling pathways were also obtained by “Limma” package,30 and the Hallmark gene set data resource derived from the Molecular Signatures Database-MsigDB (www.broadinstitute.org/gsea/msigdb) was downloaded as a background set. P < 0.05 was defined as significant enrichment.
Immune Analysis
CIBERSORT was used to quantify the level of infiltration of different immune cells in HCC, and tumor immune dysfunction and exclusion (TIDE) score was calculated to predict the potential immune checkpoint (ICB) blockade response in patients with HCC.31
Construction of Co-Expression Networks
The “multiscale embedded gene co-expression network analysis (MEGENA)” package in R software was conducted to identify a co-expression network.32 As an recently developed co-expression module analysis method, MEGENA offers unique advantages over traditional co-expression analysis tools in efficiently constructing large-scale co-expression plane filtering networks and preserving gene interactions.32 Specifically, fast planar filtered network (PFN) construction is the first step of MEGENA analysis, then significant gene pairs in PFN were obtained computationally, and finally the constructed PFNs are aggregated into multiscale clustering analysis (MCA) for subsequent analysis.33
We extracted the largest gene module from the co-expression network and converted them into a format readable by Cytoscape software for final analysis as well as visualization.34 Degree values were calculated and used to rank the genes in the module to identify potential hub genes.
Single Cell Analysis
Seurat (Version 3) (http://satijalab.org/seurat/) was used to process raw gene expression matrices. The filtering thresholds are set as follows: 1) Genes expressed in at least three cells. 2) Cells contain 500–6000 features. 3) Mitochondrial genes in cells are less than 20%. The highly variable genes (HVGs) were identified with “FindVariableFeatures” function. Principal component analysis (PCA) was conducted to determine the principal components suitable for subsequent analysis,35 and uniform manifold approximation and projection (UMAP) was carried out to visualize the clusters.36 The “FindAllMarkers” function was applied to find marker genes for each cell cluster. Clusters were annotated to known cell types by “singleR” package according to well-known marker genes.
GSCA Database
GSCALite (http://bioinfo.life.hust.edu.cn/web/GSCALite/) was used to analyze expression, DNA methylation, CNV (copy number variation), and drug sensitivity about helicases. The degree of helicase activation or inhibition of the cancer-related pathways was also analyzed.
Rusults
The Genetic Characteristics and Transcriptional Variations of 112 Helicases
Basic information and list of all helicases was obtained from the Human Genome Organization (HUGO) portal,37 and 112 helicases mainly include DNA helicase and RNA helicase. In order to observe the genetic variation of helicase molecules in cancer, we showed somatic mutations of 10 molecules with the highest mutation frequency in cancer tissues according to TCGA pan-cancer data. Among 4798 samples, 2125 samples carry helicases molecular mutation, with a frequency of 44.29%. In all helicases, ATRX showed the highest mutation frequency (Figure 2A). Genetic variation was further confirmed to be an important factor that affects the expression of the helicases. For most helicases, there is a positive correlation between CNV and mRNA expression levels, while methylation and mRNA expression levels showed opposite trends (Figure 2B and C). Besides, we found that different helicases have very different prognostic significance in different cancer types (Figure S1). In the TCGA-LIHC dataset, we observed extensive and significant co-mutations between helicase molecules (Figure 2D). Among 363 samples, 176 samples had mutated helicase molecules, at a frequency of 48.48%. Among the 176 samples, DHX9 had the highest mutation frequency of up to 3% (Figure 2E), mainly missense mutation.
 |
Figure 2 Expression variation of helicase molecules. (A) The waterfall diagram shows the somatic mutations of the 10 helicases with the highest mutation frequency in pan-cancer. Here, 44.29% is the proportion of 2125 samples with at least one mutation of the top 10 genes among 4798 samples with at least one mutation of 112 helicases. The percentage figure of each line on the right of the picture is the number of samples with the corresponding gene mutation divided by 4798 samples with at least one mutation among the 112 helicases. (B) The bubble chart shows the correlation between CNV of the 112 helicases and mRNA expression level. Red indicates positive correlation; blue indicates negative correlation. The deeper color indicates a larger correlation index. The bubble size indicates the FDR. (C) The bubble chart shows the correlation between methylation of the 112 helicases and mRNA expression. Red shows a positive correlation and blue shows a negative correlation. The darker color indicates a larger correlation index. Bubble size indicates the FDR. (D) Mutation characteristics of the 112 helicases in 374 patients with bladder cancer in the TCGA-LIHC cohort; green indicates co-mutation, the asterisk indicates P-value (P < 0.05, *P < 0.1). (E) Mutation frequency of 112 helicases in 374 patients in the TCGA-LIHC cohort. Each column represents an individual patient. The small figure above shows the TMB, the number on the right shows the mutation frequency of each regulator, and the figure on the right shows the proportion of each variant. |
Two Different Helicases Level Patterns Identified by Unsupervised Learning
To fully understand the role of helicase in LIHC, we used consensus clustering to identify two unique modification patterns of LIHC associated with helicase. To fully understand the role of helicase in LIHC, we used consensus clustering to identify two unique modification patterns of LIHC associated with helicases, called Cluster 1 (C1) and Cluster (C2) (Figure 3A–C). Principal component analysis confirmed that these two clusters could be accurately distinguished by helicase expression profiles (Figure 3D). Overall, C2 showed high helicase expression levels, indicating a high-helicase subtype. In contrast, C1 showed low expression levels, indicating a low-helicase subtype (Figure 3E). In addition, survival analysis showed that the 2 helicase-based subtypes presented different clinical outcomes, with C1 having a poor prognosis and C2 having a favorable clinical outcome (Figure 3F, OS, P = 0.0205; Figure 3G, DSS, P = 0.0162; Figure 3H, disease-free survival (DFS), P = 0.134). The analysis procedure for GSE14520 was identical to TCGA-LIHC cohort (Figure S2). Interestingly, we observed a higher proportion of patients with advanced stage in C1 than in C2, especially in terms of T stage and pathological stage (P < 0.05, Figure 3I). We subsequently compare the difference in mutation frequency between the two subtypes and noted that TP53 was mutated much more frequently in C1 than in C2 (Figure 3J), implying that C1 has higher genomic instability. In addition, we found more mutational co-occurrence in C1, such as RYR1 and RYR2 mutations (Figure 3K), while in C2, most mutational events were relatively independent and did not interact with each other (Figure 3L).
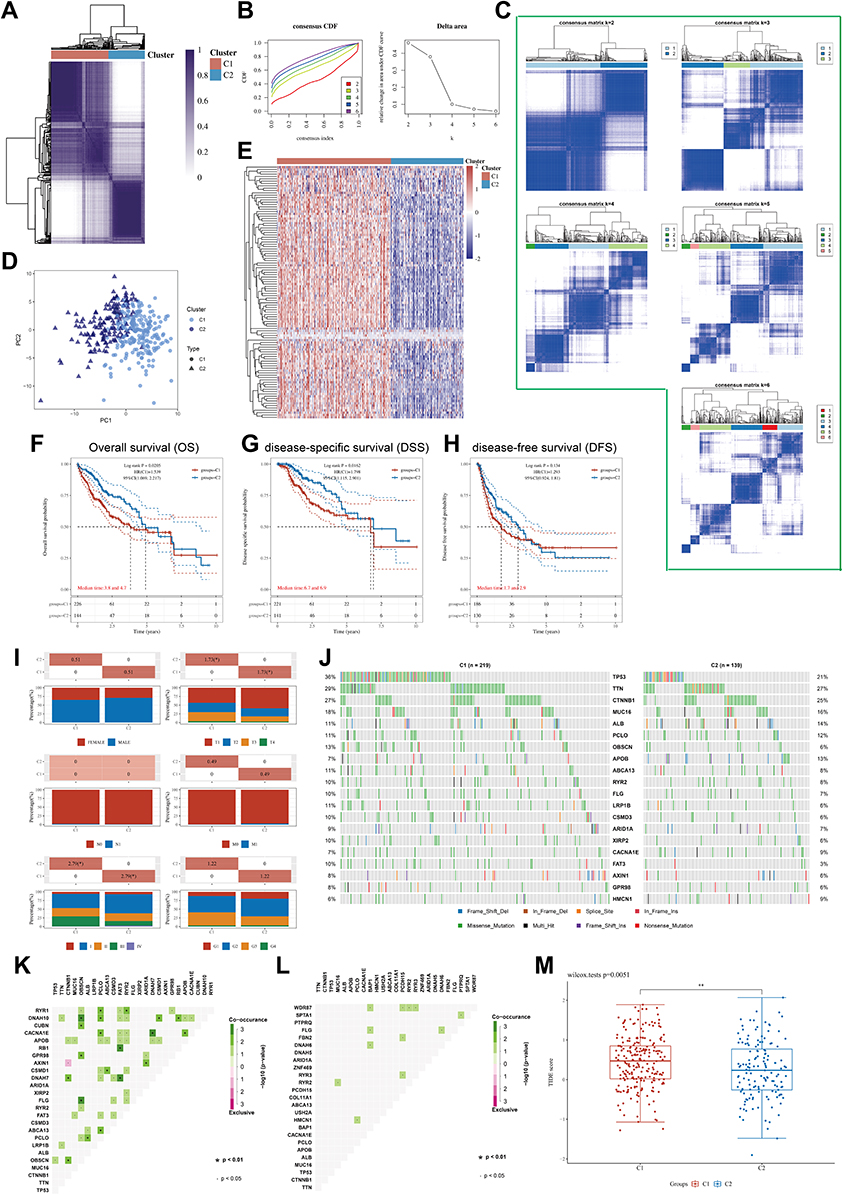 |
Figure 3 (A) Heatmap depicts consensus clustering solution (k = 2) for 112 helicases in 374 LIHC samples; (B) Delta area curve of consensus clustering indicates the relative change in area under the cumulative distribution function (CDF) curve for k = 2–6. (C) The consensus score matrix of all samples when k = 2–6. (D) The PCA distribution of TCGA-LIHC cases by expression profile of helicases. Each point represents a single sample; different colors and shapes represent the C1 and C2 subtypes, respectively. (E) Heatmap of 112 helicases expressions in different subtypes. Red represents high expression and blue represents low expression. (F–H) Kaplan–Meier curves of OS (F), DSS (G), DFS (H) in C1 and C2 (TCGA-LIHC, n = 374). Log rank test was performed. (I) Relationship between two subtypes and the clinicopathological parameters, including gender, T, N, and M stage, pathological stage, and tumor grade (TCGA-LIHC, n = 374, *P < 0.05). (J) Oncoplot displaying mutation profile of a union set of the top 20 genes with highest mutation frequency in C1 and C2, respectively. (K and L) Graphs showing mutually exclusive and co-occurrence of mutational events in C1(K) and C2 (L), respectively (·P < 0.05, *P < 0.1). (M) Differential TIDE score between C1 and C2 (TCGA-LIHC, n = 374, **P < 0.1). Wilcoxon test was performed. |
Finally, we analyzed the effect of helicases on tumor immune microenvironments. We use CIBERSORT to calculate the level of immune cell infiltration in LIHC samples using RNA-sequencing data. There was a higher quantity of M0 macrophage in C1 than in C2 (Figure S3A, P < 0.001), and the high infiltration of M0 macrophages was a factor in the poor prognosis of patients with LIHC (Figure S3B, OS, P = 0.02). Notably, all common ICPs (immune checkpoints) were significantly higher in C1 than in C2 (Figure S3C, P < 0.05), while the TIDE algorithm showed that patients in C1 may have worse immunotherapy outcomes (Figure 3M, P = 0.0051).
Identification of Differentially Expressed Genes (DEGs) and Signal Pathways in Different Helicases Subtypes
As the two subtypes exhibited different clinical outcomes and pathological features, we here identify key DEGs and signaling pathways in each subtype to understand the underlying regulatory mechanisms of the helicase phenotype. We found an aggregate of 921 DEGs between two clusters (Figures 4A), and the upregulated genes in C1 were mainly enriched in activities associated with fatty acid metabolism, spermatogenesis, hedgehog signaling, pancreas beta cells, KRAS signaling, inflammatory response (Figure 4B). To identify key gene modules, we constructed a MEGENA network using these DEGs (Figure 4C). The largest module C1_4 consisting of 358 genes was shown in Figure 4D. Enrichment analysis shows that this module is closely associated with nuclear division as well as genomic stability (Figure 4E). We subsequently conducted Matthews correlation coefficient (MCC) algorithm to identify 10 hub genes which had a consistent activation of the cell cycle (Figure 4F), and all hub genes significantly highly expressed in hepatocellular carcinoma tissues (Figure 4G, P < 0.001) and correlated with unfavorable prognosis (Figure S4, P < 0.05). In addition, we found that overexpression of most hub genes in the GDSC database was associated with higher drug sensitivity, except for KIF23 (Figure S5A). In the Cancer Therapeutics Response Portal (CTRP) database, overexpression of KIF18B, GINS1, CDCA5, KIFC1, KIF2C, KIF4A, and TOP2A implied insensitivity to Trametinib, a targeted drug that inhibits cell proliferation through MEK signaling (Figure S5B). Finally, we observed higher expression of 10 hub genes in C1 than in C2 (Figure 4H, P < 0.001), further suggesting that they are potential regulators of helicases subtypes differences.
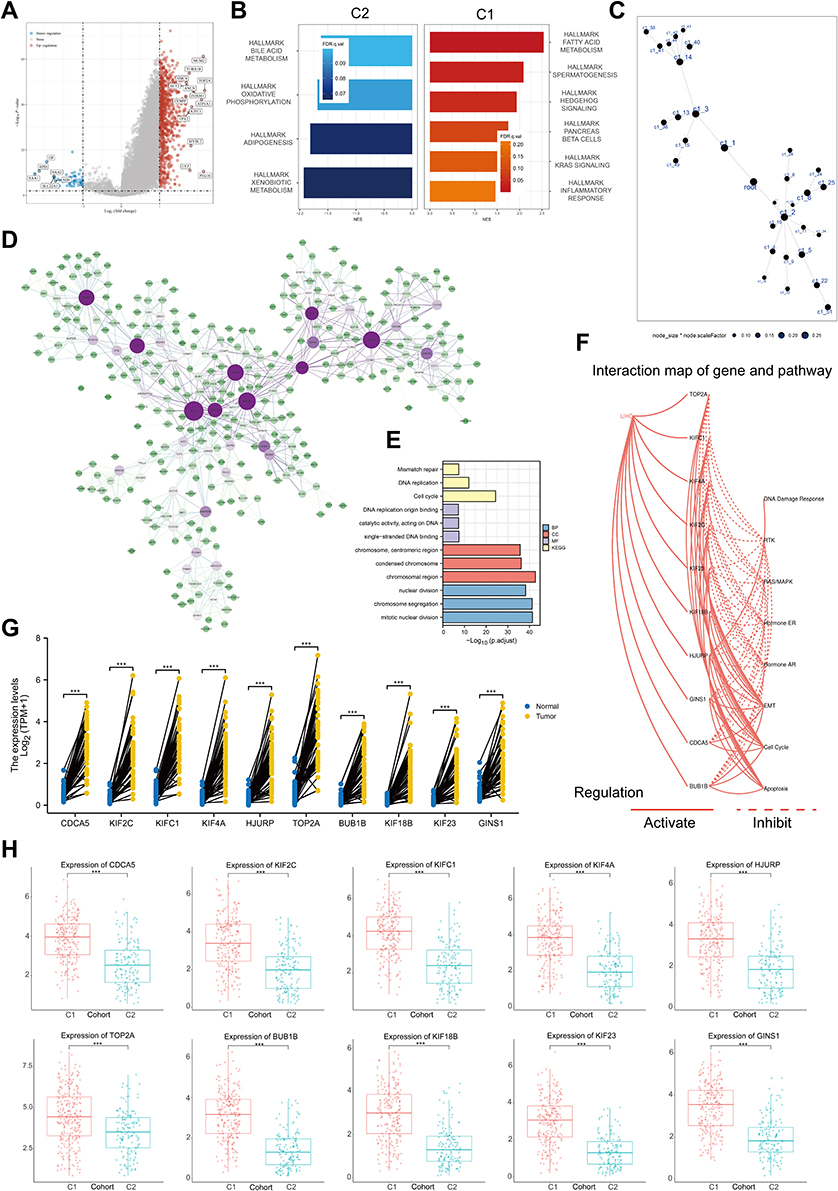 |
Figure 4 Function analysis of helicase phenomenon. (A) Volcano map of differentially expressed genes between C1 and C2. Red indicates up-regulated genes in C1, blue indicates down-regulation. Data on the abscissa are differences in gene expression (log2 fold change); data on the ordinate represent the significance of these differences (−log10 padj) (TCGA-LIHC, n = 374). (B) Gene Set Enrichment Analysis (GSEA) of C1 and C2. (C) The DEGs between C1 and C2 in the co-expression network. Each node represents a gene module, with the larger nodes indicating a higher number of genes. (D) The MEGENA network showing the largest gene module. The degree value of the node was calculated by Cytoscape. The higher the degree value, the darker the color the larger the size. (E) GO and KEGG enrichment analysis of the largest gene modules. Each colored bar indicates a different biological process. (F) The correlation between the 10 hub genes in HCC and important cancer signaling pathways. The solid line represents activation and the dashed line represents inhibition. (G) Expression level of 10 hub genes between HCC tissues in the TCGA-LIHC cohort (n = 50) and paired control tissues (TCGA-LIHC, n = 50, ***P < 0.001). (H) Expression level of 10 hub genes between C1 and C2 (TCGA-LIHC, n = 374, ***P < 0.001). |
Identification of Hub Genes Upregulation in Highly Proliferative Cells
Here, we sought to localize the hub gene at the single-cell level to investigate the biological mechanism of the helicase phenotype. The process of the single-cell analysis was demonstrated in Figures 5A and B with a Uniform Manifold Approximation and Projection (UMAP) and a t-Distributed Stochastic Neighbor Embedding (tSNE) that displayed the cell markers of each cell cluster. We then used singleR for automatic annotation of cell types (Figure 5C and D). The expression levels of CDCA5, KIF2C, KIFC1, KIF4A, HJURP, TOP2A, BUB1B, KIF18B, KIF23, GINS1, and MKI67 in a single-cell study are illustrated in Figure 5E and F. We observed that most hub genes are expressed in concert with Ki67, mainly on cells in the G2M phase (Figure 5G). Finally, in the TCGA-LIHC dataset, we further confirmed the significant positive correlation between MKI67 level and all hub gene levels (Figure 5H). These results suggested that the helicase phenotype was closely related to cell proliferation.
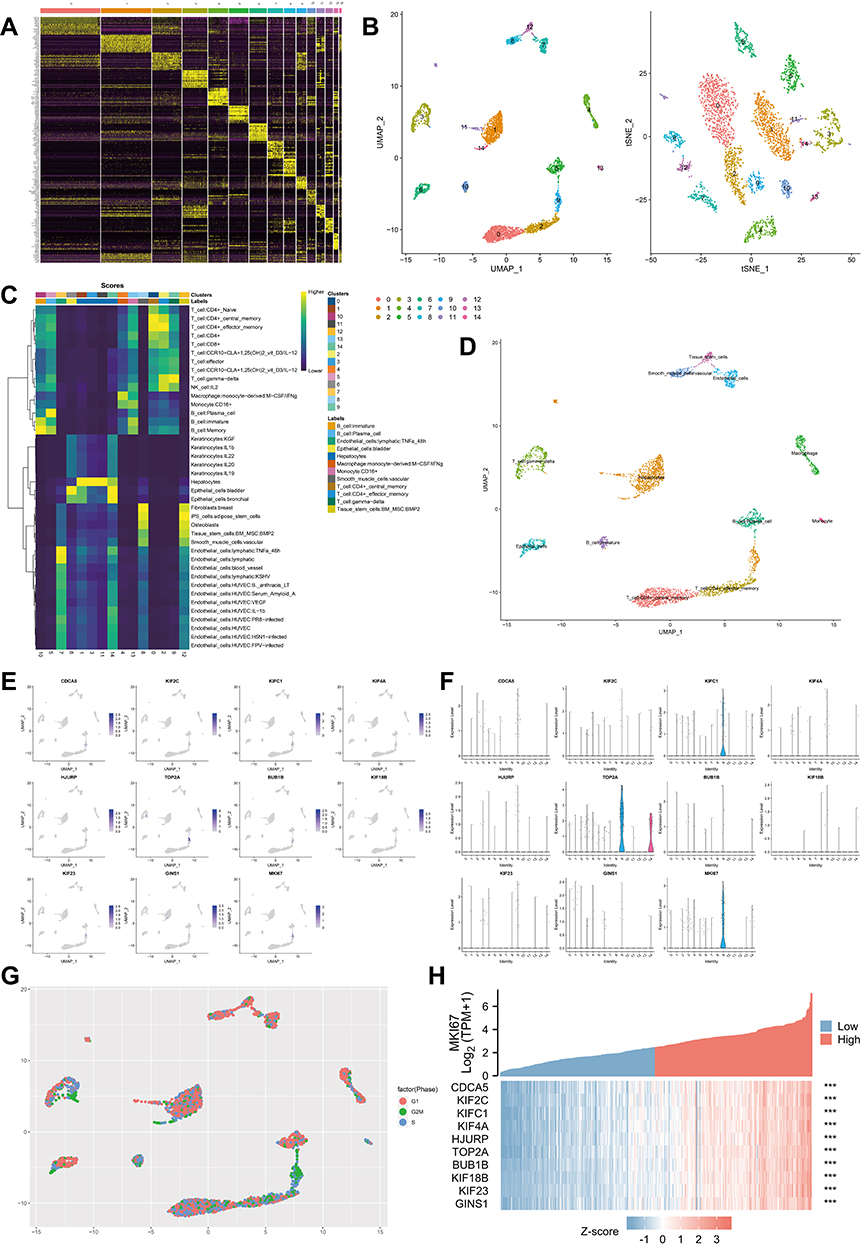 |
Figure 5 Single cell analysis of hub genes. (A) Heatmap depicting expressions of top 10 marker genes among 14 detected HCC cell clusters. (B) Cells were clustered into 14 types via UMAP and tSNE dimensionality reduction algorithm, each color represents a unique cluster. (C) SingleR was used to automatically annotate each cell, and the bar at the top of the graph represents the cluster and cell label, respectively. (D) The dot plot shows the situation after manual modification, with each color representing the annotated phenotype of each cluster. (E and F) tSNE distribution of all hub genes, including dot plot (E) and violin plot (F). (G) The cell cycle is annotated by marker genes, red for G1 phase, green for G2M phase and blue for S phase. (H) Heat map showing the significant correlation of all hub genes with MKI67. The top half of the graph represents the expression trend of MKI67 and the bottom half represents the expression trend of all hub genes, with blue representing low expression and red representing high expression (TCGA-LIHC, ***P < 0.001). |
Identification of DDX56 Overexpression as a Poor Prognostic Factor for LIHC
In this part, LASSO regression of overall survival (OS), disease-free survival (DSS) and progression-free interval (PFI) was conducted based on 112 helicases, respectively, to identify robust markers for follow-up studies. Cross-validation was performed in ten rounds to prevent overfitting (Figure 6A–C). Sequential Cox regression (both univariate and multivariate) indicated that DHX58, DDX43, DDX56 were significantly correlated with LIHC prognosis (Figure 6D–I). Then, we constructed Kaplan–Meier survival curves to validate the prognostic value of DHX58, DDX43, DDX56 and the results showed that patients with higher DDX56 expression level had shorter PFI (Figure 6J–M, P < 0.05). In addition, we observed a trend of overexpression of DDX56 in almost all common tumor types (Figure 6N). These results suggested that DDX56 is a potential oncogene.
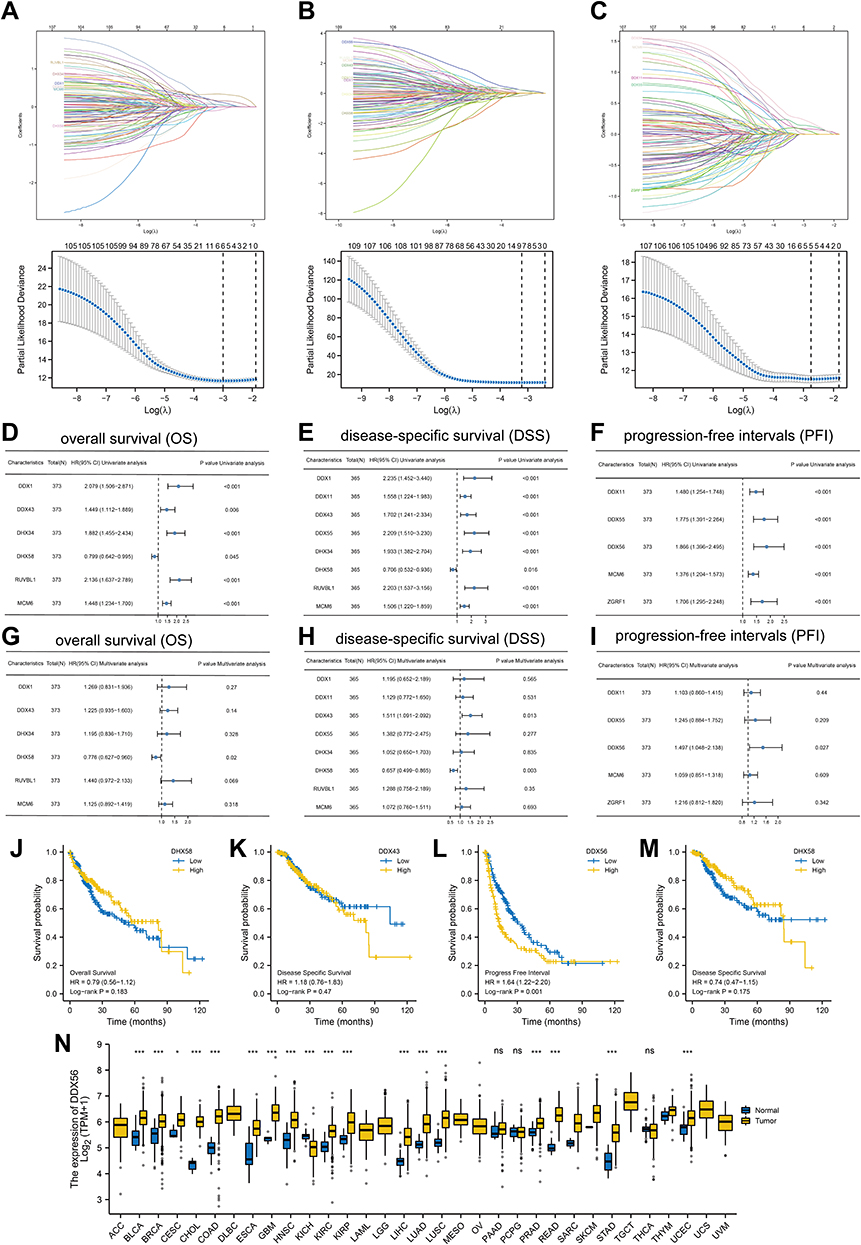 |
Figure 6 Identification of DDX56 as an independent prognosis factor. (A–C) least absolute shrinkage and selection operator model (LASSO) fitting based on OS (A), DFS (B), PFI (C). Each curve represents a gene. The profiles of coefficients were plotted versus log(λ). Vertical lines indicate the positions of all genes with coefficients greater than 0 determined by 10-fold cross-validation. λ was determined from 10-fold cross-validation. The x-axis represents log(λ); the y-axis represents binomial deviance. Optimal values calculated from minimum criteria and one standard error of the criteria are indicated by the dotted vertical lines. (D–I) Univariate (D–F) forest plot and multivariate (G–I) forest plot showing association between 6 candidate genes expression and OS (D and G), 8 candidate genes and DSS (E and H), 5 candidate genes and PFI (F and I) in HCC. (J–M) OS about DHX58, DSS about DDX43, PFI about DDX56, and DSS about DHX58 based on TCGA-LIHC (TCGA-LIHC, n = 374, Log rank test). (N) The mRNA expression of DDX56 between tumor and normal control tissues in pan-cancer was assessed from TCGA database. (TCGA-LIHC, n = 374; NS: not significant, *P < 0.05, ***P < 0.001). |
Expression Analysis of DDX56 in LIHC
We first found that DDX56 was highly expressed in C1 with relatively poor prognosis (P = 1.7e-14, Figure 7A) and confirmed the overexpression of DDX56 in tumor tissue in paired TCGA samples as well as in other two independent datasets (p < 0.001, Figure 7B and C). We next examined the expression of DDX56 in several common hepatocellular carcinoma cell lines, and the results were consistent with those predicted in The Cancer Cell Line Encyclopedia (CCLE) database (Figure 7D and E). IHC sections from the Human Protein Atlas (HPA) database source showed that DDX56 is overexpressed at the protein level in cancerous tissues (Figure 7F), and we confirmed this result through our own samples (P < 0.001, Figure 7G and H).
 |
Figure 7 Expression analysis of DDX56 in LIHC. (A) Differential expression of DDX56 between C1 and C2 clusters based on TCGA-LIHC databases (n = 374, ****P < 0.0001). (B) Expression level of DDX56 between the tumor and paired normal tissues in the TCGA-LIHC databases (n = 50, ***P < 0.001). (C) Differential expression of DDX56 between normal tissue and HCC tissue by using public datasets from Gene Expression Omnibus GSE36376 (n = 433, ****P < 0.0001) and GSE102079 (n = 257, ****P < 0.0001). (D and E) DDX56 protein expression in different HCC cell lines (**P < 0.01, ***P < 0.001). (F) Immunohistochemical analysis of DDX56 in HCC tissues and normal tissues based on Human Protein Atlas database (HPA). (G and H) Representative images of different immunohistochemical staining intensities for DDX56 based on our own HCC samples and statistical comparison of DDX56 expression levels (H-SCORE) in HCC tissues and normal tissues (n = 50, ***P < 0.001). (I) UMAP plots showing expression of DDX56 clusters. (J) The cell type assignment of each cluster is based on the DDX56 expression. (K) Correlation of the DDX56 expression levels with MKI67 based on TCGA-LIHC (n = 374). (L and M) Correlation between DDX56 and Ki67 based on immunohistochemical H-score calculation (n = 50). (N) Association of DDX56 mRNA expression with T/N/M stages, pathological stage, histologic grade and vascular invasion in HCC patients based on TCGA-LIHC (n = 374, NS: not significant, *P < 0.05, **P < 0.01, ***P < 0.001). (O) Analysis of differentially immune infiltration level with DDX56 high and low expression in TCGA-LIHC (NS: not significant, *P < 0.05, **P < 0.01, ***P < 0.001). |
Single-cell analysis revealed that DDX56 are ubiquitously expressed by all cell types (Figure 7I and J). Considering the strong correlation between helicase phenotype and cell proliferation, we further found that the level of DDX56 was highly positively correlated with the level of MKI67 based on TCGA-LIHC calculation (R = 0.395, P < 0.001). Since both DDX56 and Ki67 are nuclear proteins, we found that they also converge in expression at the protein level by sequential comparison of IHC staining results (Figure 7L and M, R = 0.426, P = 0.002). Subsequently, we analyzed the relationship between DDX56 and clinicopathological parameters and found that the level of DDX56 increased with tumor grade as well as with vascular invasion (Figure 7N, P < 0.01). Finally, our calculations showed that the level of DDX56 significantly and negatively correlated with the abundance of most immune cells, including TGD cells, natural killer (NK) cells, dendritic cells (DC) and cytotoxic cells, among others (Figure 7O, P < 0.01). This part of the results indicates that DDX56 is highly expressed in hepatocellular carcinoma tissues and is a proliferative marker that is associated with immunosuppression.
Discussion
Helicases are essential for all living organisms, and their main function is to unpackage the genes of the organism.3 They act as linear molecular engines, specifically, moving directionally along the nucleic acid phosphodiester backbone and using the energy generated by ATP hydrolysis to separate two annealed nucleic acid strands, including DNA, ribonucleic acid (RNA) or RNA-DNA hybrids.38–40 Thus, whenever cellular processes involving the separation of nucleic acid strands, such as DNA replication, transcription, translation, recombination, DNA repair and ribosome biogenesis, are closely associated with helicases, ultimately determining cell fate.41,42
We examined the genetic and transcriptional profiles of 112 helicase molecules and found extensive mutational covariation among them, and not only that we also observed that the vast majority of helicases are overexpressed in almost all common cancer types. One of the essential features of tumor cells is their rapid proliferation accompanied by DNA damage response and chromosomal instability, therefore enhanced activity of resolvases is currently considered necessary for tumor cells to cope with endogenous or exogenous stress in order to maintain cellular homeostasis.43–45 In addition, considering the frequent DNA damage caused by chemotherapy or radiotherapy, it has also been shown that DNA helicases play a key role in resistance to conventional clinical anti-cancer therapies, and Nicola J Curtin’s work suggested that the activity level of individual DNA damage response genes, including the decapping gene, can be used as a predictive biomarker for personalized cancer therapy.46,47
To further understand the significance of helicases in LIHC, we pooled the expression profiles of helicase-encoding genes based on TCGA-LIHC and classified LIHC patients into two clusters (C1, C2) by consensus clustering, and patients in C1 versus C2 showed large differences in survival and clinical characteristics. Notably, levels of almost all helicases were observed to be significantly higher in C1 than in C2, and mutational profiling showed that TP53, a “star” gene currently found to prevent tumor cell division, induce apoptosis, and repair normal DNA damage,48,49 was mutated much more frequently in C1 than in C2. Further, we found far more mutational co-occurrence events in C1 than in C2. This together with the above results suggested that C1 patients may be characterized by stronger genomic instability compared with C2. GSEA based on differential genes of two subtypes showed that KRAS signaling and hedgehog pathway activity were significantly upregulated in C1. To effectively explore deeper biological mechanisms, we identified key co-expressed gene modules in differential genes by MEGENA algorithm, and enrichment analysis showed that co-expressed gene modules are closely associated with cell cycle and division. Subsequently, we further calculated to obtain 10 hub genes, which have potential promotive effects on cell cycle. Interestingly, the levels of these 10 hub genes, including CDCA5, KIF2C, KIFC1, KIF4A, HJURP, TOP2A, BUB1B, KIF18B, KIF23, and GINS1, were significantly higher in tumor tissues than in paired normal tissues, and a similar phenomenon was observed between C1 and C2. These results show their potential oncogene function and possible relevance to nuclear division. We note that most of them belong to the kinesin family, and kinesins are now widely recognized as ATPases that move along microtubule filaments involved in the transport of cellular cargo and provide support for several cellular functions, including mitosis and meiosis.50–52 The biological significance of kinesins in tumors is currently receiving increasing attention, and it has been demonstrated that KIF2C is a direct target of the Wnt/β-catenin pathway and mediates crosstalk between Wnt/β-catenin and mTORC1 signaling by interacting with TBC1D7.53 In addition to these, the value of CDCA5 as a cell cycle-associated protein for nuclear division needs no elaboration,54,55 while other hub genes including TOP2A, HJURP, BUB1B, and GINS1 have been widely reported to be risk factors for poor cancer prognosis, and their potential mechanisms are widely involved in interfering with DNA topology, mitotic checkpoint signaling, spindle assembly, and other biological processes that maintain genomic and chromosomal stability.56–58
To distinguish in more detail the biological differences between the two helicase subtypes, we proceeded to examine the expression characteristics of these 10 hub genes at the single cell level. Considering the significant difference in the degree of mitotic activity between the two subtypes, we used the tumor proliferation index Ki67 as a reference to analyze the relationship between 10 hub genes and cell division. We observed a cluster of hepatocellular carcinoma cells at the G2M stage, enriched in Ki67-encoding genes, indicating that they were in a proliferative phase. Interestingly, most of the single-cell localizations of hub genes are consistent with Ki67, especially TOP2A, a cell proliferation marker that exerts a strong anti-apoptotic effect by frequently amplifying in tumor tissues.59 In addition, KIFC1 was also observed to be abundantly expressed on proliferating cells, and some investigators observed reduced levels of Ki67 and PCNA after knockdown of KIFC1 in Hep3B and SNU-475 cell lines, tentatively confirming a potential positive correlation between KIFC1 and HCC proliferation.60
The above work confirms the existence of two subtypes with significantly different proliferative activity in LIHC patients, and since this subtype is established based on the helicase expression profile, it is clear that the helicase activity itself may be a potentially critical factor. We identified three independent prognostic factors, DHX58, DDX43, and DDX56, through the development of the LASSO-COX model. Survival analysis showed that DDX56 was strongly associated with poor prognosis and that DDX56 was overexpressed in most tumor types.61,62 We then focused on the significance of DDX56 at LIHC and further confirmed the high expression of DDX56 in 2 independent datasets and obtained consistent results at the protein level. Several studies have indicated that DDX56 interacts with the mitotic regulator serine/threonine phosphoprotein phosphatase (PP) 1 and the oncoprotein DEK to regulate tumor progression, and its high expression has been reported in breast and colorectal cancers.62–64 Based on this, we compared the correlation between DDX56 and MKI67 and a significant positive correlation was observed at both transcriptome and protein levels. Finally, we also found that DDX56 levels negatively correlated with the abundance of most immune cells, which may be due to immunosuppressive effects caused by malignant proliferation of tumor cells.
Conclusions
In conclusion, our study highlights the relationship between helicase subtypes and proliferative features of LIHC. In conclusion, our study highlights the relationship between helicase isoforms and proliferative features of LIHC. These observations may be beneficial for conventional chemotherapy-based treatment of LIHC patients, especially for apoptosis-inducing and cell cycle-blocking-related interventions. We also identified DDX56 as an independent prognostic factor in patients with LIHC, and DDX56 was overexpressed in HCC tissue and significantly positively correlated with Ki67, indicating a high proliferation rate of tumor cells. The main limitation of this study was the small sample of clinical cases. The number of clinical cases was limited, mainly because of the death cases during the follow-up. Besides this, changes in living systems involve multi-scale regulatory processes in time and space. Various intracellular response mechanisms are finely regulated through complex signaling pathways, and the different pathways are intertwined with each other. DDX56, which has not been previously reported in hepatocellular carcinoma. The underlying mechanisms merit further explorations.
Data Sharing Statement
We declare that all the data in this article are authentic, valid, and available for use on reasonable request. Dr Xi Zou can be contacted ([email protected]) regarding the availability of data and materials.
Ethics Statement
The study’s protocol was approved by the ethics committee of the Zhangjiagang TCM Hospital Affiliated to Nanjing University of Chinese Medicine (Ethics Approval No. 2022-03-14).
Author Contributions
All authors made a significant contribution to the work reported, whether in study conception, design, and execution; data acquisition, analysis, and interpretation; or all these areas. All authors were involved in drafting, revising, or critically reviewing the article; gave final approval for the version to be published; have agreed on the journal to which the article has been submitted; and agree to be accountable for all aspects of the work.
Funding
The present study was supported by the Jiangsu Province Hospital of Chinese Medicine Peak Academic Talent Project (y2021rc19 and y2021rc46), the Advantageous Disciplines Program of Nanjing University of Chinese Medicine (ZYX03KF022 and ZYX03KF019), Science and Technology Project of Affiliated Hospital of Nanjing University of Chinese Medicine (Y2020CX62), State Administration of Chinese Medicine Project (20085-9-3), Jiangsu Provincial Science and Technology Department Project (BE2019771), Jiangsu Province Postgraduate Research Innovation Program Project (KYCX21-1677); Youth Science and Technology Project of Suzhou (No. KJXW2019059); and the Suzhou Science and Technology Development Plan (No. SYSD2019006).
Disclosure
The authors declare no conflicts of interest in relation to this work.
References
1. Llovet JM. Hepatocellular carcinoma. Nat Rev Dis Primers. 2021;7(1):7. doi:10.1038/s41572-021-00245-6
2. Forner A, Reig M, Bruix J. Hepatocellular carcinoma. Lancet. 2018;391(10127):1301–1314. doi:10.1016/S0140-6736(18)30010-2
3. Brosh RM, Matson SW. History of DNA Helicases. Genes. 2020;11(3):255. doi:10.3390/genes11030255
4. von Felden J, Garcia-Lezana T, Schulze K, et al. Liquid biopsy in the clinical management of hepatocellular carcinoma. Gut. 2020;69(11):2025–2034. doi:10.1136/gutjnl-2019-320282
5. Villanueva A, Longo DL. Hepatocellular Carcinoma. N Engl J Med. 2019;380(15):1450–1462. doi:10.1056/NEJMra1713263
6. Frenette C. Advances in hepatocellular carcinoma. Clin Liver Dis. 2020;24(4):xiii–xiv. doi:10.1016/j.cld.2020.08.014
7. Vyas M, Zhang X. Hepatocellular carcinoma: role of pathology in the era of precision medicine. Clin Liver Dis. 2020;24(4):591–610.
8. De Stefano F, Chacon E, Turcios L, Marti F, Gedaly R. Novel biomarkers in hepatocellular carcinoma. Dig Liver Dis. 2018;50(11):1115–1123.
9. Wang X, Zhang A, Sun H. Power of metabolomics in diagnosis and biomarker discovery of hepatocellular carcinoma. Hepatology. 2013;57(5):2072–2077.
10. Dhar S, Datta A, Brosh RM. DNA helicases and their roles in cancer. DNA Repair (Amst). 2020;96:102994. doi:10.1016/j.dnarep.2020.102994
11. Abdelhaleem M. Helicases: an overview. Methods Mol Biol. 2010;587:1–12. doi:10.1007/978-1-60327-355-8_1
12. Brosh RM. DNA helicases involved in DNA repair and their roles in cancer. Nat Rev Cancer. 2013;13(8):542–558. doi:10.1038/nrc3560
13. Gupta R, Brosh RM. DNA repair helicases as targets for anti-cancer therapy. Curr Med Chem. 2007;14(5):503–517. doi:10.2174/092986707780059706
14. Germain DR, Graham K, Glubrecht DD, et al. DEAD box 1: a novel and independent prognostic marker for early recurrence in breast cancer. Breast Cancer Res Treat. 2011;127(1):53–63. doi:10.1007/s10549-010-0943-7
15. Miao X, Yang Z-L, Xiong L, et al. Nectin-2 and DDX3 are biomarkers for metastasis and poor prognosis of squamous cell/adenosquamous carcinomas and adenocarcinoma of gallbladder. Int J Clin Exp Pathol. 2013;6(2):179–190.
16. Heerma van Voss MR, Schrijver WA, ter Hoeve ND, et al. The prognostic effect of DDX3 upregulation in distant breast cancer metastases. Clin Exp Metastasis. 2017;34(1):85–92. doi:10.1007/s10585-016-9832-8
17. Kouyama Y, Masuda T, Fujii A, et al. Oncogenic splicing abnormalities induced by DEAD -Box Helicase 56 amplification in colorectal cancer. Cancer Sci. 2019;110(10):3132–3144. doi:10.1111/cas.14163
18. Zhu C, Zhang X, Kourkoumelis N, et al. Integrated analysis of DEAD-box helicase 56: a potential oncogene in osteosarcoma. Front Bioeng Biotechnol. 2020;8:588. doi:10.3389/fbioe.2020.00588
19. Wu Q, Luo X, Terp MG, et al. DDX56 modulates post-transcriptional Wnt signaling through miRNAs and is associated with early recurrence in squamous cell lung carcinoma. Mol Cancer. 2021;20(1):108. doi:10.1186/s12943-021-01403-w
20. Ma M, Dai J, Tang H, et al. MicroRNA-23a-3p inhibits mucosal melanoma growth and progression through targeting adenylate cyclase 1 and attenuating cAMP and MAPK pathways. Theranostics. 2019;9(4):945–960. doi:10.7150/thno.30516
21. Kawamura N, Takaoka K, Hamada H, et al. Rab7-mediated endocytosis establishes patterning of Wnt activity through inactivation of Dkk antagonism. Cell Rep. 2020;31(10):107733. doi:10.1016/j.celrep.2020.107733
22. Hirano S. Western blot analysis. Methods Mol Biol. 2012;926:87–97.
23. Blum A, Wang P, Zenklusen JC. SnapShot: TCGA-analyzed tumors. Cell. 2018;173(2):530. doi:10.1016/j.cell.2018.03.059
24. Clough E, Barrett T. The gene expression omnibus database. Methods Mol Biol. 2016;1418:93–110.
25. Sun BY, Zhou C, Guan R-Y, et al. Dissecting intra-tumoral changes following immune checkpoint blockades in intrahepatic cholangiocarcinoma via single-cell analysis. Front Immunol. 2022;13:871769. doi:10.3389/fimmu.2022.871769
26. Wilkerson MD, Hayes DN. ConsensusClusterPlus: a class discovery tool with confidence assessments and item tracking. Bioinformatics. 2010;26(12):1572–1573. doi:10.1093/bioinformatics/btq170
27. Ritchie ME, Phipson B, Wu D, et al. limma powers differential expression analyses for RNA-sequencing and microarray studies. Nucleic Acids Res. 2015;43(7):e47. doi:10.1093/nar/gkv007
28. The Gene Ontology Consortium. Gene Ontology Consortium: going forward. Nucleic Acids Res. 2015;43(Database issue):D1049–56. doi:10.1093/nar/gku1179
29. Kanehisa M, Goto S. KEGG: Kyoto Encyclopedia of Genes and Genomes. Nucleic Acids Res. 2000;28(1):27–30. doi:10.1093/nar/28.1.27
30. Reimand J, Isserlin R, Voisin V, et al. Pathway enrichment analysis and visualization of omics data using g: Profiler, GSEA, Cytoscape and EnrichmentMap. Nat Protoc. 2019;14(2):482–517. doi:10.1038/s41596-018-0103-9
31. Chen B, Khodadoust MS, Liu CL, Newman AM, Alizadeh AA. Profiling tumor infiltrating immune cells with CIBERSORT. Methods Mol Biol. 2018;1711:243–259.
32. Song WM, Zhang B. Multiscale embedded gene co-expression network analysis. PLoS Comput Biol. 2015;11(11):e1004574. doi:10.1371/journal.pcbi.1004574
33. Chen R, Zhao S, Tian Z, Ding BY. A multiscale clustering approach for non-IID nominal data. Comput Intell Neurosci. 2021;2021:8993543. doi:10.1155/2021/8993543
34. Shannon P, Markiel A, Ozier O, et al. Cytoscape: a software environment for integrated models of biomolecular interaction networks. Genome Res. 2003;13(11):2498–2504. doi:10.1101/gr.1239303
35. David CC, Jacobs DJ. Principal component analysis: a method for determining the essential dynamics of proteins. Methods Mol Biol. 2014;1084:193–226.
36. Becht E, McInnes L, Healy J, et al. Dimensionality reduction for visualizing single-cell data using UMAP. Nat Biotechnol. 2018. doi:10.1038/nbt.4314
37. McKusick VA. HUGO news. The Human Genome Organisation: history, purposes, and membership. Genomics. 1989;5(2):385–387. doi:10.1016/0888-7543(89)90077-3
38. Patel SS, Pandey M, Nandakumar D. Dynamic coupling between the motors of DNA replication: hexameric helicase, DNA polymerase, and primase. Curr Opin Chem Biol. 2011;15(5):595–605. doi:10.1016/j.cbpa.2011.08.003
39. Patel SS, Picha KM. Structure and function of hexameric helicases. Annu Rev Biochem. 2000;69(1):651–697. doi:10.1146/annurev.biochem.69.1.651
40. Sun B, Johnson DS, Patel G, et al. ATP-induced helicase slippage reveals highly coordinated subunits. Nature. 2011;478(7367):132–135. doi:10.1038/nature10409
41. Gangloff S, Soustelle C, Fabre F. Homologous recombination is responsible for cell death in the absence of the Sgs1 and Srs2 helicases. Nat Genet. 2000;25(2):192–194. doi:10.1038/76055
42. Sun B, Wang MD. Single-molecule perspectives on helicase mechanisms and functions. Crit Rev Biochem Mol Biol. 2016;51(1):15–25. doi:10.3109/10409238.2015.1102195
43. DeBerardinis RJ, Lum JJ, Hatzivassiliou G, et al. The biology of cancer: metabolic reprogramming fuels cell growth and proliferation. Cell Metab. 2008;7(1):11–20. doi:10.1016/j.cmet.2007.10.002
44. Srinivas US, Tan BWQ, Vellayappan BA, et al. ROS and the DNA damage response in cancer. Redox Biol. 2019;25:101084. doi:10.1016/j.redox.2018.101084
45. Lord CJ, Ashworth A. The DNA damage response and cancer therapy. Nature. 2012;481(7381):287–294. doi:10.1038/nature10760
46. Curtin NJ. DNA repair dysregulation from cancer driver to therapeutic target. Nat Rev Cancer. 2012;12(12):801–817. doi:10.1038/nrc3399
47. Smith HL, Southgate H, Tweddle DA, et al. DNA damage checkpoint kinases in cancer. Expert Rev Mol Med. 2020;22:e2. doi:10.1017/erm.2020.3
48. Olivier M, Hollstein M, Hainaut P. TP53 mutations in human cancers: origins, consequences, and clinical use. Cold Spring Harb Perspect Biol. 2010;2(1):a001008. doi:10.1101/cshperspect.a001008
49. Hussain SP, Schwank J, Staib F, et al. TP53 mutations and hepatocellular carcinoma: insights into the etiology and pathogenesis of liver cancer. Oncogene. 2007;26(15):2166–2176. doi:10.1038/sj.onc.1210279
50. Rath O, Kozielski F. Kinesins and cancer. Nat Rev Cancer. 2012;12(8):527–539. doi:10.1038/nrc3310
51. Lucanus AJ, Yip GW. Kinesin superfamily: roles in breast cancer, patient prognosis and therapeutics. Oncogene. 2018;37(7):833–838. doi:10.1038/onc.2017.406
52. Li Q, Qiu J, Yang H, et al. Kinesin family member 15 promotes cancer stem cell phenotype and malignancy via reactive oxygen species imbalance in hepatocellular carcinoma. Cancer Lett. 2020;482:112–125. doi:10.1016/j.canlet.2019.11.008
53. Wei S, Dai M, Zhang C, et al. KIF2C: a novel link between Wnt/β-catenin and mTORC1 signaling in the pathogenesis of hepatocellular carcinoma. Protein Cell. 2021;12(10):788–809. doi:10.1007/s13238-020-00766-y
54. Zhang Z, Shen M, Zhou G. Upregulation of CDCA5 promotes gastric cancer malignant progression via influencing cyclin E1. Biochem Biophys Res Commun. 2018;496(2):482–489. doi:10.1016/j.bbrc.2018.01.046
55. Bai L, Ren Y, Cui T. Overexpression of CDCA5, KIF4A, TPX2, and FOXM1 coregulated cell cycle and promoted hepatocellular carcinoma development. J Comput Biol. 2020;27(6):965–974. doi:10.1089/cmb.2019.0254
56. Li S, Wu L, Zhang H, et al. GINS1 induced sorafenib resistance by promoting cancer stem properties in human hepatocellular cancer cells. Front Cell Dev Biol. 2021;9:711894. doi:10.3389/fcell.2021.711894
57. Li M, Shi M, Hu C, et al. MALAT1 modulated FOXP3 ubiquitination then affected GINS1 transcription and drived NSCLC proliferation. Oncogene. 2021;40(22):3870–3884. doi:10.1038/s41388-021-01816-3
58. Tang L, Yu W, Wang Y, et al. Anlotinib inhibits synovial sarcoma by targeting GINS1: a novel downstream target oncogene in progression of synovial sarcoma. Clin Transl Oncol. 2019;21(12):1624–1633. doi:10.1007/s12094-019-02090-2
59. Wang T, Lu J, Wang R, et al. TOP2A promotes proliferation and metastasis of hepatocellular carcinoma regulated by miR-144-3p. J Cancer. 2022;13(2):589–601. doi:10.7150/jca.64017
60. Wang X, Wang M, Li X-Y, et al. KIFC1 promotes the proliferation of hepatocellular carcinoma in vitro and in vivo. Oncol Lett. 2019;18(6):5739–5746. doi:10.3892/ol.2019.10985
61. Wang K, Li B, Fan P, et al. Downregulation of DEAD-box helicase 21 (DDX21) inhibits proliferation, cell cycle, and tumor growth in colorectal cancer via targeting cell division cycle 5-like (CDC5L). Bioengineered. 2021;12(2):12647–12658. doi:10.1080/21655979.2021.2011636
62. Zhang H, Zhang Y, Chen C, et al. A double-negative feedback loop between DEAD-box protein DDX21 and Snail regulates epithelial-mesenchymal transition and metastasis in breast cancer. Cancer Lett. 2018;437:67–78. doi:10.1016/j.canlet.2018.08.021
63. Wang X, Wu Z, Qin W, et al. Long non-coding RNA ZFAS1 promotes colorectal cancer tumorigenesis and development through DDX21-POLR1B regulatory axis. Aging. 2020;12(22):22656–22687. doi:10.18632/aging.103875
64. Lu P, Yu Z, Wang K, et al. DDX21 interacts with WDR5 to promote colorectal cancer cell proliferation by activating CDK1 expression. J Cancer. 2022;13(5):1530–1539. doi:10.7150/jca.69216
 © 2022 The Author(s). This work is published and licensed by Dove Medical Press Limited. The
full terms of this license are available at https://www.dovepress.com/terms
and incorporate the Creative Commons Attribution
- Non Commercial (unported, 3.0) License.
By accessing the work you hereby accept the Terms. Non-commercial uses of the work are permitted
without any further permission from Dove Medical Press Limited, provided the work is properly
attributed. For permission for commercial use of this work, please see paragraphs 4.2 and 5 of our Terms.
© 2022 The Author(s). This work is published and licensed by Dove Medical Press Limited. The
full terms of this license are available at https://www.dovepress.com/terms
and incorporate the Creative Commons Attribution
- Non Commercial (unported, 3.0) License.
By accessing the work you hereby accept the Terms. Non-commercial uses of the work are permitted
without any further permission from Dove Medical Press Limited, provided the work is properly
attributed. For permission for commercial use of this work, please see paragraphs 4.2 and 5 of our Terms.