Back to Journals » OncoTargets and Therapy » Volume 14
Identification and Validation a Necroptosis‑related Prognostic Signature and Associated Regulatory Axis in Stomach Adenocarcinoma
Received 4 October 2021
Accepted for publication 15 November 2021
Published 2 December 2021 Volume 2021:14 Pages 5373—5383
DOI https://doi.org/10.2147/OTT.S342613
Checked for plagiarism Yes
Review by Single anonymous peer review
Peer reviewer comments 2
Editor who approved publication: Prof. Dr. Geoffrey Pietersz
Ning Wang,1 Dingsheng Liu2
1Department of Thoracic Surgery, Shengjing Hospital, China Medical University, Shenyang, People’s Republic of China; 2Department of General Surgery, Shengjing Hospital, China Medical University, Shenyang, People’s Republic of China
Correspondence: Dingsheng Liu
Department of General Surgery, Shengjing Hospital, China Medical University, No. 36 Sanhao St, Heping District, Shenyang, 110004, Liaoning, People’s Republic of China
Email [email protected]
Background: Gastric cancer (GC) ranks fifth in global cancer incidence and third in cancer-related mortality. The prognosis of GC patients was poor. Necroptosis is a type of regulated cell death mediated by RIP1, RIP3, and MLKL. Necroptosis was found to be involved in antitumor immunity in the cancer immunotherapy.
Methods: LASSO Cox regression analysis was performed to construct a prognostic signature. Bioinformatics analysis was performed to construct a lncRNA-miRNA-mRNA regulatory axis. qRT-PCR was performed to verify the expression and prognosis of hub gene in STAD.
Results: Most of necroptosis regulators were upregulated, while the mRNA level of TLR3, ALDH2, and NDRG2 was downregulated in STAD versus gastric tissues. The genetic mutation and copy number variation of necroptosis regulator in STAD were also summarized. GO and KEGG pathways analysis revealed that these necroptosis regulators were mainly involved in programmed necrotic cell death and TNF signaling pathway. A necroptosis‑related prognostic signature based on four genes (EZH2, PGAM5, TLR4, and TRAF2) had a good performance in predicting the prognosis of STAD patients. We also identified lncRNA SNHG1/miR-21-5p/TLR4 regulatory axis in the progression in STAD. Verification study suggested that the hub gene TLR4 upregulated in STAD and correlated with a poor overall survival. Moreover, Cox regression analysis revealed that TLR4 expression and clinical stage were independent factors affecting the prognosis of STAD patients.
Conclusion: We performed a comprehensive bioinformatics analysis and identified a necroptosis‑related prognostic signature and a lncRNA SNHG1/miR-21-5p/TLR4 regulatory axis in STAD. Further study should be performed to confirm our result.
Keywords: necroptosis, stomach adenocarcinoma, prognostic signature, immune infiltration
Introduction
Gastric cancer (GC) ranks fifth in global cancer incidence and third in cancer-related mortality.1 Globally, one million people were estimated to be initially diagnosed with GC, and 782,685 deaths are caused by the disease per year.2 Among all GC cases, stomach adenocarcinoma (STAD) was the most common subtype. Although a multidisciplinary approach of surgery combined with chemotherapy had been applied for GC patients, the prognosis was still disillusioned with median overall survival (OS) of less than 12 months.3 These sobering data illustrate a critical need for biomarkers for the diagnosis, prognosis and therapy of STAD patients.
Necroptosis is a type of regulated cell death mediated by RIP1, RIP3, and MLKL.4,5 Accumulating evidence revealed the involvement of necroptosis in the pathogenesis of many diseases, such as Parkinson's, infectious disease and cancer.5–7 Najafov et al revealed that necroptosis could promote the metastasis and T cells death of tumor.8 Interestingly, necroptosis was found to be involved in antitumor immunity in the cancer immunotherapy.4 Necroptosis serves as an alternative mode of programmed cell death overcoming apoptosis resistance and may trigger and amplify antitumor immunity in cancer therapy.4 Necroptosis is emerging as an important cellular response in the modulation of cancer initiation, progression, and metastasis.9 Some scholars even found that necroptosis regulators could be biomarker for the prognosis of cancers and some diseases.10,11 In pancreatic cancer, Necroptosis could promote tumor cell migration and invasion by release of CXCL5.12 However, the specific role of necroptosis regulators in the prognosis and potential molecular mechanism in STAD is still unknown.
With the rapid development of technology and the establishment of the Cancer Genome Atlas (TCGA), we could explore the tumorigenesis mechanism and biomarkers for the prognosis and therapy of cancer by comprehensively study genome, proteome, transcriptome, and metabolome. In our study, we aimed to clarify the expression and prognosis significance of necroptosis-related genes and potential regulatory axis in STAD. Our result may provide more data for the prognostic biomarkers and molecular mechanisms in STAD.
Materials and Methods
Datasets and Preprocessing
The RNA sequencing profile (level 3 data, FPKM value) for STAD patients (n=375) was obtained from the TCGA data portal (https://tcga-data.nci.nih.gov/tcga/). In dataset downloading, the data type was set as “Gene Expression Quantification” and workflow type was set as “HTSeq-FPKM”.
Clinical data such as gender, age, histological type and survival were also downloaded from TCGA data portal. These patients with chemoradiotherapy pre-operation should be excluded from our study. Copy number variation (CNV) data of STAD patients was downloaded UCSC Xena website (https://xenabrowser.net/datapages/). To perform further analysis, we first normalized the expression profile to transcripts per kilobase million values. All the analyses were performed with R (version 4.0.5) with R Bioconductor packages.
Expression, Genetic Mutation, GO and KEGG Analysis
A total of 17 necroptosis regulators (RIPK1, RIPK3, MLKL, TLR2, TLR3, TLR4, TNFRSF1A, PGAM5, ZBP1, NR2C2, HMGB1, CXCL1, USP22, TRAF2, ALDH2, EZH2, NDRG2) were obtained by reviewing the previous literature.13–21 Wilcox text were performed to explore the expression of 17 necroptosis regulators in STAD and normal tissues with “limma” and “reshape2” package in R. The genetic landscape of necroptosis regulators was generated with “maftools” package. To show the CNV alteration and associated with chromosome location of necroptosis regulators, we used “RCircos” package in R. Gene Ontology (GO) and Kyoto Encyclopedia of Genes and Genomes (KEGG) were conducted with Metascape (https://metascape.org), an comprehensive tool for gene annotation and functional analysis.22
Development of Necroptosis-Related Prognostic Gene Signature
A forest map was generated to reveal the necroptosis-related prognostic gene in STAD using univariate Cox analysis. Using necroptosis-related prognostic genes, LASSO Cox regression analysis was performed to develop a necroptosis-related prognostic gene signature. After obtaining the coefficients of each gene, we then calculate the risk score of each STAD patient with the computational equation (sum of x necroptosis-related gene expression). All STAD cohorts were divided into low- and high-risk subgroups with the median value of risk score as the cut-off value. The OS curve was drawn using Kaplan–Meier analysis. To evaluate the predictive performance of this prognostic signature, we then generated a time ROC curve. Spearman correlation analysis was conducted to evaluate the correlation between immune cells and Riskscore as well as Hub genes.
Construction of lncRNA-miRNA-mRNA Regulatory Axis
A PPI network was constructed to identify the hug genes among necroptosis-related prognostic gene signature with STRING (https://string-db.org/). TargetScan (http://www.targetscan.org/), miRDB (http://mirdb.org/), and StarBase (http://starbase.sysu.edu.cn/) were applied to explore the miRNA targets of Hub gene. To explore the lncRNA targets of miRNA, we used LncBase (https://carolina.imis.athena-innovation.gr/) and StarBase (http://starbase.sysu.edu.cn/). We also detected the expression and prognostic values of miRNA and lncRNA target with Student’s t-test and Kaplan–Meier analysis using TCGA STAD dataset.
Validation of the Expression and Prognosis Value
Approved by the Ethics Committee of Shengjing Hospital, China Medical University, we selected 52 STAD tissues and pair-normal gastric tissues from patients who do not receive any local or systemic treatment preoperatively (Supplementary Table 1). This study was conducted in accordance with the Declaration of Helsinki. All patients provided informed consent, histological diagnosis and tumor grade were assessed by three experienced pathologists in accordance with 2010 American Joint Committee on Cancer staging system.
All the Total RNA of STAD and normal tissue were extracted with TRIzol reagent (Vazyme, Nanjing, China). The synthesis of cDNAs corresponding to the mRNAs of interest depended on PrimeScript RT-polymerase (Vazyme). SYBR-Green Premix (Vazyme) with specific PCR primers (Sangon Biotech Co., Ltd., Shanghai, China). Glyceraldehyde-3-phosphate dehydrogenase was used as an internal control. The 2−ΔΔCt method was used to calculate fold-changes. Primer sequences were as follows: GAPDH, Forward: GCACCGTCAAGGCTGAGAAC; Reverse: TGGTGAAGACGCCAGTGGA and TLR4, Forward: CAGAGTTGCTTTCAATGGCATC; Reverse: AGACTGTAATCAAGAACCTGGAGG. The differences in the expression of STAT5A and the prognosis of TLR4 in STAD were evaluated with Student’s t-test and Kaplan-Meier analysis in GraphPad Prism7 software (GraphPad, Inc., La Jolla, CA, USA).
Results
The Expression and Genetic Mutation Landscape of Necroptosis Regulators in STAD
Figure 1A reveals the expression landscape of necroptosis regulators in STAD. The data suggested that a total of 16 necroptosis-related genes were altered as mRNA level. To be more specific, the mRNA levels of RIPK1, RIPK3, MLKL, TLR2, TLR4, PGAM5, ZBP1, NR2C2, HMGB1, CXCL1, USP22, TRAF2, and EZH2 were upregulated, while the mRNA levels of TLR3, ALDH2, and NDRG2 were downregulated in STAD versus gastric tissues (Figure 1A, all p < 0.05). The genetic mutation landscape of necroptosis regulators in STAD are shown in Figure 1B and C. Genetic mutations of necroptosis regulators were found in 74.19% (69/93) of STAD samples (Figure 1B). Among these genes, TLR4 was the gene with the highest mutation rate gene followed by NC2R2, and TLR3 (Figure 1B and C). As shown in Figure 1C, missense mutation was the most common variant classification and C > T ranked the top SNV class. In CNV analysis, we found that most of the necroptosis regulators had a copy number amplification (Figure 1D). The data suggested widespread CNV deletion of RIPK1, TLR3, EZH2, and USP22 (Figure 1D). Figure 1E presents the location of CNV alteration of necroptosis-related genes on chromosomes.
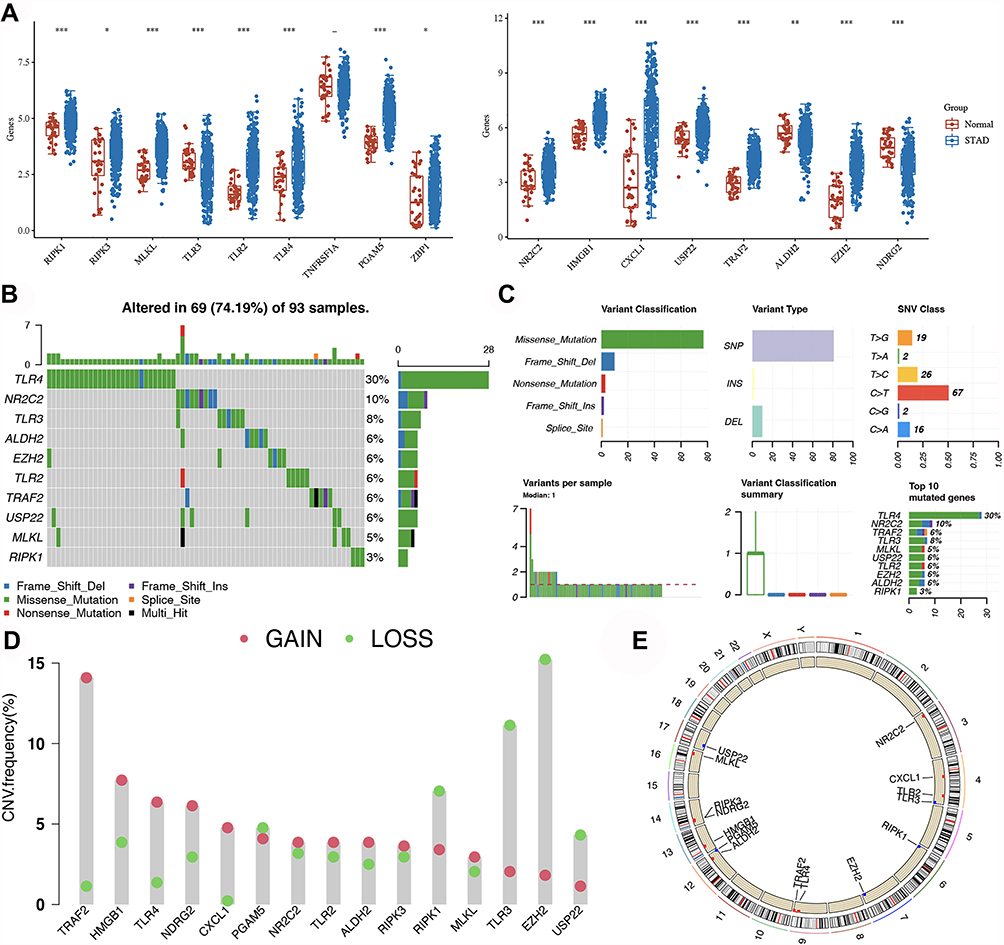 |
Figure 1 Expression and genetic mutation of necroptosis regulators in STAD. (A) The expression of necroptosis regulators in STAD. (B and C) The mutation frequency and classification of necroptosis regulators in STAD. (D) The CNV frequency of necroptosis regulators in STAD. The height of the column represented the alteration frequency. (E) The location on chromosomes of CNV of necroptosis regulators. *p<0.05, **P < 0.01, ***P < 0.001. |
GO and KEGG Analysis
To clarify the potential functions of these differential expressed necroptosis regulators, we then conducted GO and KEGG pathways analysis. As shown in Figure 2A and B, these necroptosis regulators were mainly involved in programmed necrotic cell death, regulation of cytokine production, NF-kappaB signaling, and leukocyte migration in GO analysis. KEGG pathway analysis suggested the involvement of necroptosis regulators in TNF signaling pathway, NOD-like receptor signaling pathway, Toll-like receptor signaling pathway and Hepatitis C (Figure 2C and D).
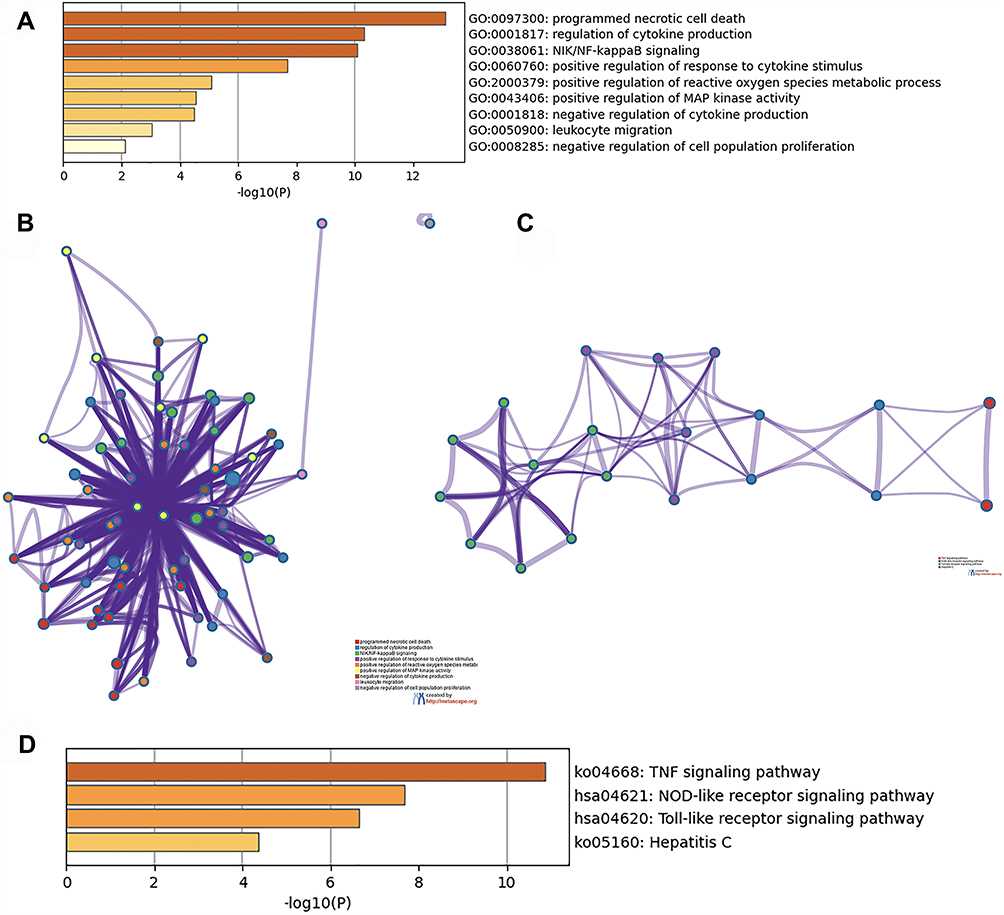 |
Figure 2 The enriched items in functional analysis. (A and B) The enriched items in gene ontology analysis. (C and D) The enriched items in Kyoto Encyclopedia of Genes and Genomes analysis. |
Construction of a Necroptosis-Related Prognostic Signature
The result of univariate Cox analysis suggested that EZH2, PGAM5, TLR4, and TRAF2 were associated with the prognosis of STAD patients (Figure 3). We then constructed a prognostic gene signature with LASSO Cox regression analysis based on these 4 prognostic necroptosis regulators. Interestingly, all these four genes were included in this prognostic gene signature, and the risk score of STAD patients was calculated with followed equation: Riskscore = (−0.0987) * EZH2 + (−0.0391) * PGAM5 + (0.1328) * TLR4 + (−0.1725) * TRAF2. Figure 4A and B reveales the coefficient and partial likelihood deviance of prognostic signature. All STAD cohort was divided into low- and high-risk subgroups with the median value of risk score as the cut-off value. Figure 4C shows the risk score, survival status of patients and gene expression of necroptosis regulators. The overall survival curve revealed that STAD patients with high-risk score had a worse OS rate versus low-risk score (Figure 4D, p = 0.00579, median time = 2.1 years vs 4.5 years,) with an area under the curve of 0.568 and 0.563 in 3-year, and 5-year ROC curve (Figure 4E). We then analyzed the correlation between riskscore and immune infiltration in STAD. As expected, riskscore was significantly positively correlated with the abundance of B cell (Figure 5A, Cor=0.18), CD4+ T cell (Figure 5B, Cor=0.28), CD8+ T cell (Figure 5C, Cor=0.35), Neutrophil (Figure 5D, Cor=0.43), Macrophage (Figure 5E, Cor=0.55), and Myeloid dendritic cell (Figure 5F, Cor=0.40).
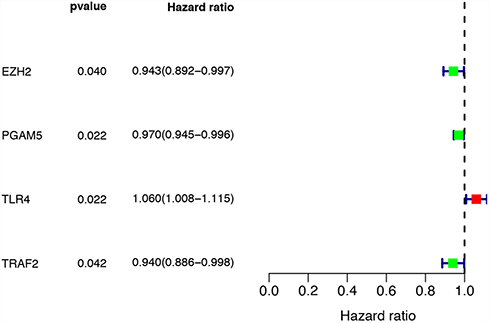 |
Figure 3 Forest map showed 4 necroptosis-related prognostic regulators for STAD identified by univariate cox analysis. |
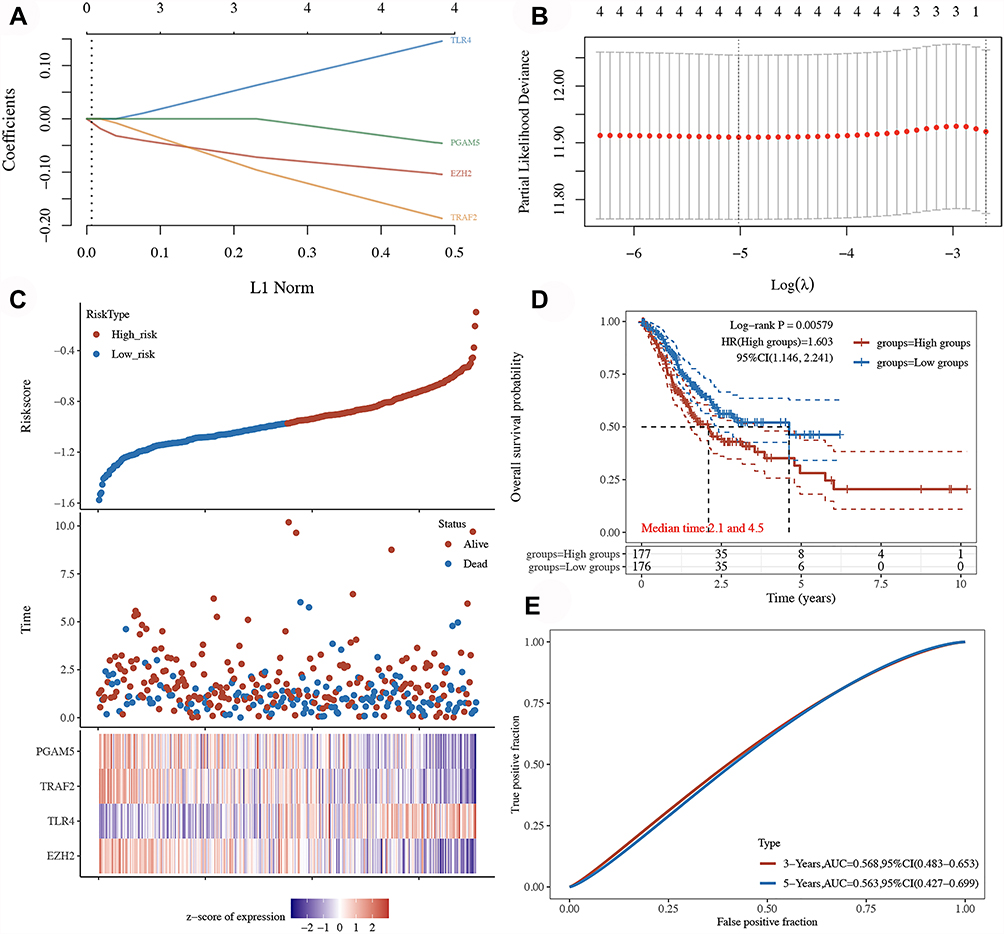 |
Figure 4 Construction of a necroptosis-related prognostic gene signature. (A and B) The coefficient and partial likelihood deviance of prognostic signature. (C) Risk score distribution survival status of patients, and gene expression of necroptosis regulator in prognostic signature. (D and E) Overall survival curve and ROC curve prognostic signature. |
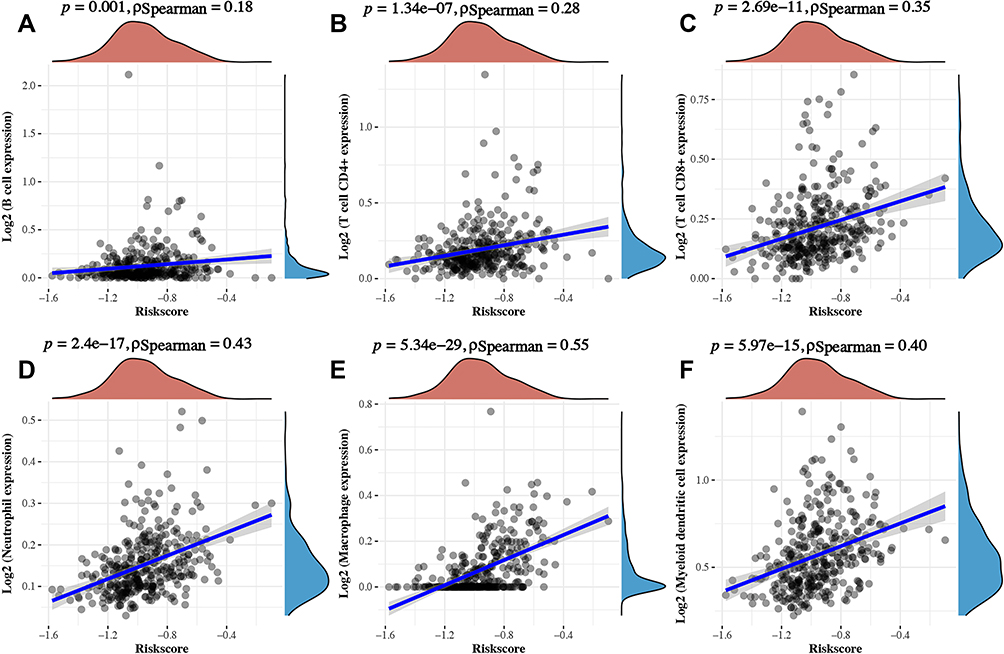 |
Figure 5 The correlation between Riskscore and immune infiltration STAD. The correlation between hub gene TLR4 and the abundance of B cell (A), CD4+ T cell (B), CD8+ T cell (C), Neutrophil (D), Macrophage (E), and Dendritic cell (F). |
Construction of lncRNA-miRNA-mRNA Regulatory Axis
To further clarify the potential molecular mechanism of necroptosis regulators in STAD, we then constructed a lncRNA-miRNA-mRNA regulatory axis. We first identified the hub gene among necroptosis-related prognostic signature using PPI network. As a result, TLR4 was identified as the hub gene (Figure 6A). Based on the result predicted by miRDB, TargetScan, and StarBase, four miRNAs (hsa-miR-448, hsa-miR-1306-5p, hsa-miR-3924, and hsa-miR-21-5p) were identified as the potential miRNA targets of TLR4 (Figure 6B). Among these four genes, miR-1306-5p (p=0.0045) and miR-21-5p (p=4.1e−18) were upregulated in STAD tissues versus gastric tissues (Figure 6C and D). Interestingly, previous study suggested miR-21-5p as a prognosis marker in STAD.23,24 Thus, miR-21-5p was selected as the most promising miRNA target of TLR4. To explore its upstream lncRNAs targets, we submitted miR-21-5p to StarBase and lncBase and the result suggested SNHG1 as the lncRNA target of miR-21-5p (Figure 6E). Interestingly, we also found that SNHG1 was upregulated in STAD tissues versus gastric tissues (Figure 6F, p=3.8e−12). Further prognosis revealed that STAD patients with high SNHG1 expression with a better overall survival (Figure 6G, p=0.0076) and relapse-free survival (Figure 6H, p=0.0051). Therefore, we identified lncRNA SNHG1/miR-21-5p/TLR4 regulatory axis in the progression in STAD. Further, in vivo and in vitro studies should be performed to confirm the results.
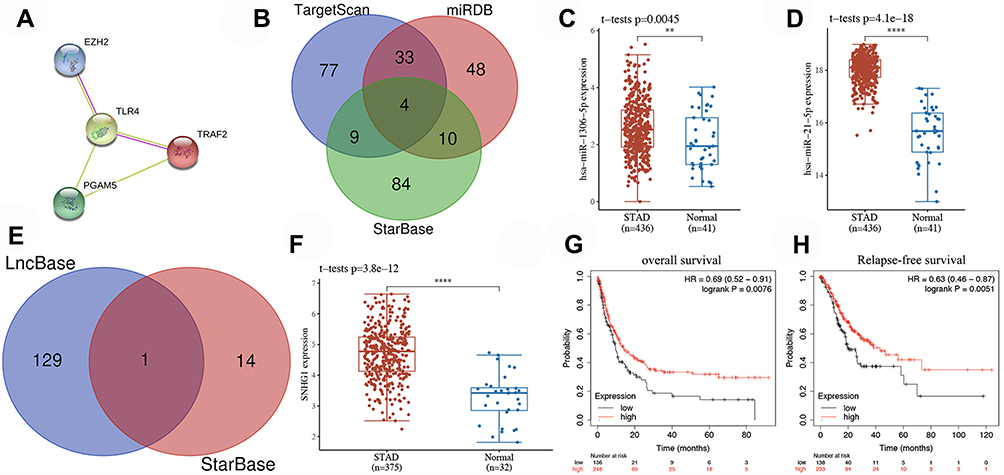 |
Figure 6 Construction of lncRNA-miRNA-mRNA regulatory axis. (A) A PPI network revealed TLR4 as the hub gene among prognostic gene signature. (B) The result of miRDB, TargetScan, and StarBase identified four miRNAs (hsa-miR-448, hsa-miR-1306-5p, hsa-miR-3924, and hsa-miR-21-5p) as the potential miRNA targets of TLR4. (C and D) The expression of miR-1306-5p and miR-21-5p in STAD tissues versus gastric tissues. (E) The result of StarBase and lncBase suggested SNHG1 as the lncRNA target of miR-21-5p. (F) The expression of SNHG1 in STAD tissues versus gastric tissues. (G and H) Prognosis revealed that STAD patients with high SNHG1 expression with a better overall survival and relapse-free survival. **P < 0.01, ****P < 0.0001. |
Validation of the Expression and Prognostic Value of TLR4 in STAD
We finally verified the expression and prognostic value of TLR4 in STAD using qRT-PCR. As expected, the expression of TLR4 was significantly upregulated in STAD tissues (Figure 7A, p < 0.01). Further prognosis analysis suggested that STAD patients with high TLR4 expression had a poor overall survival (Figure 7B, p = 0.0084). Moreover, Cox's regression analysis revealed that TLR4 expression and clinical stage were independent factors affecting the prognosis of STAD patients (Figure 7C and D). These data further confirmed previous results. A correlation between TLR4 expression and immune infiltration in STAD was also detected. And the result suggested a significantly positive correlation between TLR4 expression and the abundance of B cell (Cor=0.121), CD4+ T cell (Cor=0.389), CD8+ T cell (Cor=0.34), Neutrophil (Cor=0.537), Macrophage (Cor=0.548), and Dendritic cell (Cor=0.641) (Figure 7E, all p < 0.05). Moreover, some somatic copy number alterations of TLR4 could inhibit immune cell infiltration level (Figure 7F).
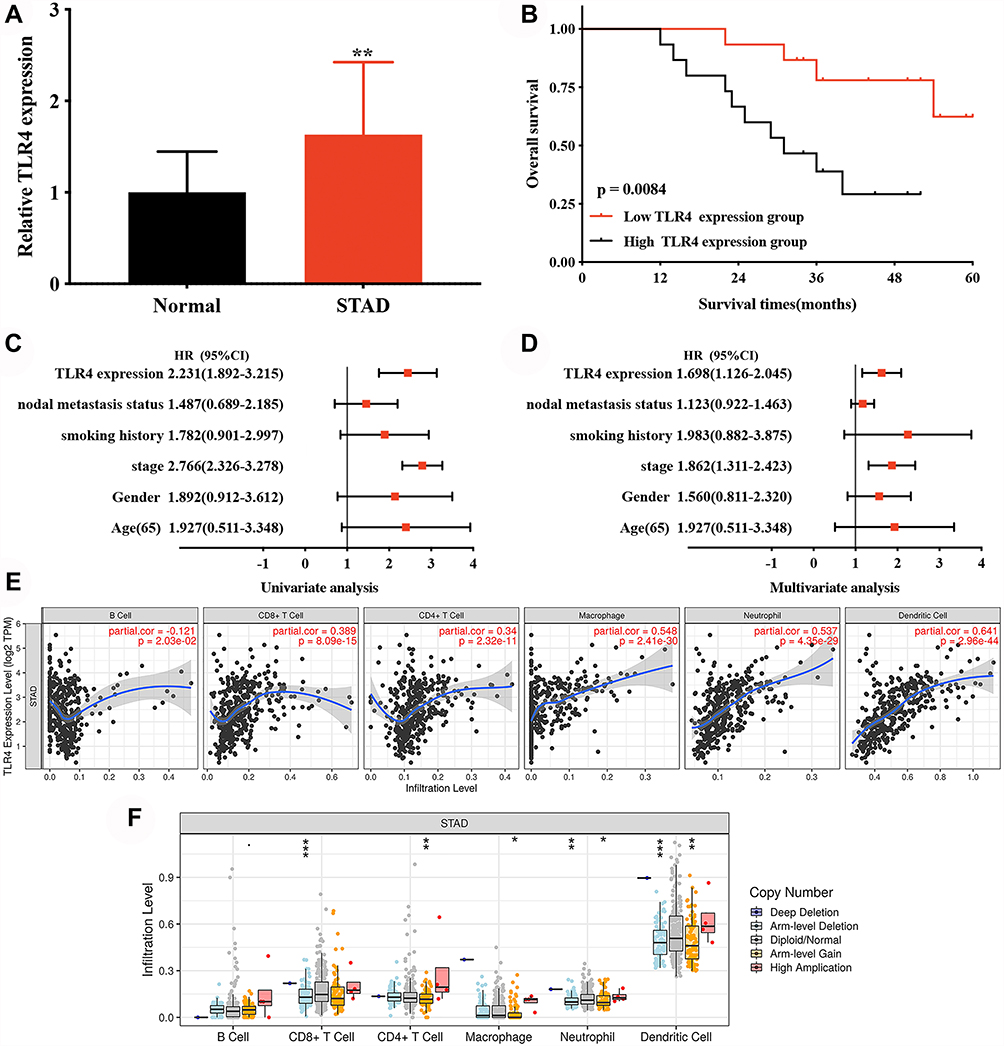 |
Figure 7 The expression and prognosis value of TLR4 in STAD. (A) The relative expression of TLR4 in STAD tissues and normal tissues. (B) Survival curve revealed the overall survival of STAD patients with high/low TLR4 expression. (C and D) Univariate and multivariate analysis of TLR4 and clinical characters in STAD. (E) The correlation between TLR4 and the abundance of different immune cell level in STAD. (F) The correlation between copy number alteration of TLR4 and immune cell infiltration in STAD. *P < 0.05, **P < 0.01, ***P < 0.001. |
Discussion
Previous studies revealed that necroptosis played a vital role in the migration and invasion of many types of cancer.12 Moreover, necroptosis was suggested as a promising approach to eliminate cancer cell.25 Certain studies had reported a correlation between necroptosis and gastric carcinoma.26 However, the specific role of necroptosis regulators in the prognosis and potential molecular mechanism in STAD was far from fully clarified.
We first clarified the expression of necroptosis regulators in STAD. And the data found that most of necroptosis regulators were upregulated, while the mRNA levels of TLR3, ALDH2, and NDRG2 were downregulated in STAD versus gastric tissues. Moreover, GO and KEGG pathways analysis performed using these differential expressed necroptosis regulators suggested that these necroptosis regulators were mainly involved in programmed necrotic cell death and TNF signaling pathway, NF-kappa B signaling pathway, NOD-like receptor signaling pathway. In fact, previous studies revealed that these pathways were associated with necroptosis and tumor progression. Accumulating evidence revealed that NF-kappa B signaling pathway played a vital role in inflammation and cancer progression.27 Moreover, TNF signaling pathway was also found to be involved in balancing cell survival and necroptosis.28
Univariate Cox analysis suggested that EZH2, PGAM5, TLR4, and TRAF2 were associated with the prognosis of STAD patients. Based on these four prognostic necroptosis regulators, we also constructed a necroptosis-related prognostic gene signature using LASSO Cox regression analysis. Interestingly, this necroptosis-related prognostic gene signature had a good performance in predicting the prognosis of STAD patients. As far as we knew, this was the first necroptosis-related prognostic gene signature identified in cancers, though some prognostic gene signatures had been identified for STAD. Nie et al constructed a prognostic nomogram and 14-lncRNA Signature which could predict the prognosis of STAD patients.29 Another study also developed and vilified an immune-related gene prognostic signature for STAD.6
We also identified lncRNA SNHG1/miR-21-5p/TLR4 regulatory axis in the progression in STAD. Previous studies revealed that lncRNA SNHG1 could inhibit cell proliferation and accelerate apoptosis in STAD.30 miR-21-5p could promote glycolysis and cancer progression in gastric cancer. Interestingly, miR-21-5p was suggested as a biomarker for the diagnosis and prognosis of STAD.24,31 Moreover, miR-21-5p could regulate the tumor biological processes in STAD.23 Correlated with Helicobacter pylori susceptibility, TLR4 was involved in tumor progression and patients’ prognosis in STAD.32,33 Moreover, the activation of TLR4 could promote gastric cancer progression.34 These evidences suggested lncRNA SNHG1/miR-21-5p/TLR4 regulatory axis may also play a vital role in the progression of STAD. LncRNA SNHG1 may inhibit cell proliferation and accelerate apoptosis in STAD by downregulation of miR-21-5p and TLR4. Further, in vitro and in vivo studies should be conducted to verify this result.
There is no doubt that our study had some limitations. First, the necroptosis-related prognostic signature should be verified by clinical tissues. Moreover, vivo and vitro studies should be performed to verify lncRNA SNHG1/miR-21-5p/TLR4 regulatory axis. It would be better to perform IHC to confirm the correlation between TLR4 and the abundance of immune cells.
Conclusion
In all, we performed a comprehensive bioinformatics analysis and identified a necroptosis‑related prognostic signature and a ncRNA SNHG1/miR-21-5p/TLR4 regulatory axis in for STAD. LncRNA SNHG1 may inhibit cell proliferation and accelerate apoptosis in STAD by downregulation of miR-21-5p and TLR4. And these results should be verified by further studies.
Data Sharing Statement
The analyzed data sets generated during the study are available from the corresponding authors on reasonable requests.
Ethics Approval and Consent to Participate
Our study was approved by the Ethics Committee of Shengjing Hospital and all patients provided informed consent. This study was conducted in accordance with the Declaration of Helsinki.
Disclosure
The authors declare that they have no competing interests.
References
1. Wang H, Shen L, Li Y, et al. Integrated characterisation of cancer genes identifies key molecular biomarkers in stomach adenocarcinoma. J Clin Pathol. 2020;73(9):579–586. doi:10.1136/jclinpath-2019-206400
2. Bray F, Ferlay J, Soerjomataram I, et al. Global cancer statistics 2018: GLOBOCAN estimates of incidence and mortality worldwide for 36 cancers in 185 countries. CA Cancer J Clin. 2018;68(6):394–424. doi:10.3322/caac.21492
3. Digklia A, Wagner AD. Advanced gastric cancer: current treatment landscape and future perspectives. World J Gastroenterol. 2016;22(8):2403–2414. doi:10.3748/wjg.v22.i8.2403
4. Gong Y, Fan Z, Luo G, et al. The role of necroptosis in cancer biology and therapy. Mol Cancer. 2019;18(1):100. doi:10.1186/s12943-019-1029-8
5. Zhe-Wei S, Li-Sha G, Yue-Chun L. The role of necroptosis in cardiovascular disease. Front Pharmacol. 2018;9:721. doi:10.3389/fphar.2018.00721
6. Wu M, Xia Y, Wang Y, et al. Development and validation of an immune-related gene prognostic model for stomach adenocarcinoma. Biosci Rep. 2020;40(10). doi:10.1042/BSR20201012
7. Yuan J, Amin P, Ofengeim D. Necroptosis and RIPK1-mediated neuroinflammation in CNS diseases. Nat Rev Neurosci. 2019;20(1):19–33. doi:10.1038/s41583-018-0093-1
8. Najafov A, Chen H, Yuan J. Necroptosis and cancer. Trends Cancer. 2017;3(4):294–301. doi:10.1016/j.trecan.2017.03.002
9. Zhu F, Zhang W, Yang T, et al. Complex roles of necroptosis in cancer. J Zhejiang Univ Sci B. 2019;20(5):399–413. doi:10.1631/jzus.B1900160
10. Park JE, Lee JH, Lee SY, et al. Expression of key regulatory genes in necroptosis and its effect on the prognosis in non-small cell lung cancer. J Cancer. 2020;11(18):5503–5510. doi:10.7150/jca.46172
11. Zhang Z, Xie G, Liang L, et al. RIPK3-mediated necroptosis and neutrophil infiltration are associated with poor prognosis in patients with alcoholic cirrhosis. J Immunol Res. 2018;2018:1509851. doi:10.1155/2018/1509851
12. Ando Y, Ohuchida K, Otsubo Y, et al. Necroptosis in pancreatic cancer promotes cancer cell migration and invasion by release of CXCL5. PLoS One. 2020;15(1):e0228015. doi:10.1371/journal.pone.0228015
13. Choi ME, Price DR, Ryter SW, et al. Necroptosis: a crucial pathogenic mediator of human disease. JCI Insight. 2019;4(15). doi:10.1172/jci.insight.128834
14. Malireddi RKS, Kesavardhana S, Kanneganti TD. ZBP1 and TAK1: master regulators of NLRP3 inflammasome/ pyroptosis, apoptosis, and necroptosis (PAN-optosis). Front Cell Infect Microbiol. 2019;9:406. doi:10.3389/fcimb.2019.00406
15. Xia X, Lei L, Wang S, et al. Necroptosis and its role in infectious diseases. Apoptosis. 2020;25(3–4):169–178. doi:10.1007/s10495-019-01589-x
16. Cheng M, Lin N, Dong D, et al. PGAM5: a crucial role in mitochondrial dynamics and programmed cell death. Eur J Cell Biol. 2021;100(1):151144. doi:10.1016/j.ejcb.2020.151144
17. Wen S, Li X, Ling Y, et al. HMGB1-associated necroptosis and Kupffer cells M1 polarization underlies remote liver injury induced by intestinal ischemia/reperfusion in rats. FASEB j. 2020;34(3):4384–4402. doi:10.1096/fj.201900817R
18. Zhu J, Yang L-K, Wang Q-H, et al. NDRG2 attenuates ischemia-induced astrocyte necroptosis via the repression of RIPK1. Mol Med Rep. 2020;22(4):3103–3110. doi:10.3892/mmr.2020.11421
19. Lou X, Zhu H, Ning L, et al. EZH2 regulates intestinal inflammation and necroptosis through the JNK signaling pathway in intestinal epithelial cells. Dig Dis Sci. 2019;64(12):3518–3527. doi:10.1007/s10620-019-05705-4
20. Petersen SL, Chen TT, Lawrence DA, et al. TRAF2 is a biologically important necroptosis suppressor. Cell Death Differ. 2015;22(11):1846–1857. doi:10.1038/cdd.2015.35
21. Roedig J, Kowald L, Juretschke T, et al. USP22 controls necroptosis by regulating receptor-interacting protein kinase 3 ubiquitination. EMBO Rep. 2021;22(2):e50163. doi:10.15252/embr.202050163
22. Zhou Y, Zhou B, Pache L, et al. Metascape provides a biologist-oriented resource for the analysis of systems-level datasets. Nat Commun. 2019;10(1):1523. doi:10.1038/s41467-019-09234-6
23. Liu Z, Yu M, Fei B, et al. miR‑21‑5p targets PDHA1 to regulate glycolysis and cancer progression in gastric cancer. Oncol Rep. 2018;40(5):2955–2963. doi:10.3892/or.2018.6695
24. Park SK, Park YS, Ahn JY, et al. MiR 21-5p as a predictor of recurrence in young gastric cancer patients. J Gastroenterol Hepatol. 2016;31(8):1429–1435. doi:10.1111/jgh.13300
25. Philipp S, Sosna J, Adam D. Cancer and necroptosis: friend or foe? Cell Mol Life Sci. 2016;73(11–12):2183–2193. doi:10.1007/s00018-016-2193-2
26. Guo D, Zhang W, Yang H, et al. Celastrol induces necroptosis and ameliorates inflammation via targeting biglycan in human gastric carcinoma. Int J Mol Sci. 2019;20(22):5716. doi:10.3390/ijms20225716
27. Hoesel B, Schmid JA. The complexity of NF-κB signaling in inflammation and cancer. Mol Cancer. 2013;12:86. doi:10.1186/1476-4598-12-86
28. Grootjans S, Vanden Berghe T, Vandenabeele P. Initiation and execution mechanisms of necroptosis: an overview. Cell Death Differ. 2017;24(7):1184–1195.
29. Nie K, Deng Z, Zheng Z, et al. Identification of a 14-lncRNA signature and construction of a prognostic nomogram predicting overall survival of gastric cancer. DNA Cell Biol. 2020;39(9):1532–1544. doi:10.1089/dna.2020.5565
30. Zhang Z, Wang H. lncRNA SNHG1 suppresses gastric cancer cell proliferation and promotes apoptosis via Notch1 pathway. J Buon. 2020;25(1):302–307.
31. Kao HW, Pan C-Y, Lai C-H, et al. Urine miR-21-5p as a potential non-invasive biomarker for gastric cancer. Oncotarget. 2017;8(34):56389–56397. doi:10.18632/oncotarget.16916
32. He B, Xu T, Pan B, et al. Polymorphisms of TGFBR1, TLR4 are associated with prognosis of gastric cancer in a Chinese population. Cancer Cell Int. 2018;18:191. doi:10.1186/s12935-018-0682-0
33. Rigoli L, Di Bella C, Fedele F, et al. TLR4 and NOD2/CARD15 genetic polymorphisms and their possible role in gastric carcinogenesis. Anticancer Res. 2010;30(2):513–517.
34. Yuan X, Zhou Y, Wang W, et al. Activation of TLR4 signaling promotes gastric cancer progression by inducing mitochondrial ROS production. Cell Death Dis. 2013;4(9):e794. doi:10.1038/cddis.2013.334
 © 2021 The Author(s). This work is published and licensed by Dove Medical Press Limited. The
full terms of this license are available at https://www.dovepress.com/terms
and incorporate the Creative Commons Attribution
- Non Commercial (unported, 3.0) License.
By accessing the work you hereby accept the Terms. Non-commercial uses of the work are permitted
without any further permission from Dove Medical Press Limited, provided the work is properly
attributed. For permission for commercial use of this work, please see paragraphs 4.2 and 5 of our Terms.
© 2021 The Author(s). This work is published and licensed by Dove Medical Press Limited. The
full terms of this license are available at https://www.dovepress.com/terms
and incorporate the Creative Commons Attribution
- Non Commercial (unported, 3.0) License.
By accessing the work you hereby accept the Terms. Non-commercial uses of the work are permitted
without any further permission from Dove Medical Press Limited, provided the work is properly
attributed. For permission for commercial use of this work, please see paragraphs 4.2 and 5 of our Terms.