Back to Journals » International Journal of Nanomedicine » Volume 18
Identification and Biological Evaluation of a Water-Soluble Fullerene Nanomaterial as BTK Kinase Inhibitor
Authors Malarz K ![]() , Korzuch J
, Korzuch J ![]() , Marforio TD
, Marforio TD ![]() , Balin K, Calvaresi M
, Balin K, Calvaresi M ![]() , Mrozek-Wilczkiewicz A
, Mrozek-Wilczkiewicz A ![]() , Musiol R
, Musiol R ![]() , Serda M
, Serda M ![]()
Received 11 January 2023
Accepted for publication 14 March 2023
Published 31 March 2023 Volume 2023:18 Pages 1709—1724
DOI https://doi.org/10.2147/IJN.S403058
Checked for plagiarism Yes
Review by Single anonymous peer review
Peer reviewer comments 2
Editor who approved publication: Prof. Dr. Anderson Oliveira Lobo
Katarzyna Malarz,1,* Julia Korzuch,2,* Tainah Dorina Marforio,3 Katarzyna Balin,1 Matteo Calvaresi,3 Anna Mrozek-Wilczkiewicz,1 Robert Musiol,2 Maciej Serda2
1A. Chełkowski Institute of Physics, University of Silesia in Katowice, Chorzów, Poland; 2Institute of Chemistry, University of Silesia in Katowice, Katowice, Poland; 3Department of Chemistry “Giacomo Ciamician”, University of Bologna, Bologna, Italy
*These authors contributed equally to this work
Correspondence: Maciej Serda; Katarzyna Malarz, Email [email protected]; [email protected]
Introduction: Thanks to recent advances in synthetic methodology, water-soluble fullerene nanomaterials that interfere with biomolecules, especially DNA/RNA and selected proteins, have been found with tremendous potential for applications in nanomedicine. Herein, we describe the synthesis and evaluation of a water-soluble glycine-derived [60]fullerene hexakisadduct (HDGF) with Th symmetry, which is a first-in-class BTK protein inhibitor.
Methods: We synthesized and characterized glycine derived [60]fullerene using NMR, ESI-MS, and ATR-FT-IR. DLS and zeta potential were measured and high-resolution transmission electron microscopy (HRTEM) observations were performed. The chemical composition of the water-soluble fullerene nanomaterial was examined by X-ray photoelectron spectrometry. To observe aggregate formation, the cryo-TEM analysis was carried out. The docking studies and molecular dynamic simulations were performed to determine interactions between HDGF and BTK. The in vitro cytotoxicity was evaluated on RAJI and K562 blood cancer cell lines. Subsequently, we examined the induction of cell death by autophagy and apoptosis by determining the expression levels of crucial genes and caspases. We investigated the direct association of HDGF on inhibition of the BTK signalling pathway by examining changes in the calcium levels in RAJI cells after treatment. The inhibitory potential of HDGF against non-receptor tyrosine kinases was evaluated. Finally, we assessed the effects of HDGF and ibrutinib on the expression of the BTK protein and downstream signal transduction in RAJI cells following anti-IgM stimulation.
Results: Computational studies revealed that the inhibitory activity of the obtained [60]fullerene derivative is multifaceted: it hampers the BTK active site, interacting directly with the catalytic residues, rendering it inaccessible to phosphorylation, and binds to residues that form the ATP binding pocket. The anticancer activity of produced carbon nanomaterial revealed that it inhibited the BTK protein and its downstream pathways, including PLC and Akt proteins, at the cellular level. The mechanistic studies suggested the formation of autophagosomes (increased gene expression of LC3 and p62) and two caspases (caspase-3 and − 9) were responsible for the activation and progression of apoptosis.
Conclusion: These data illustrate the potential of fullerene-based BTK protein inhibitors as nanotherapeutics for blood cancer and provide helpful information to support the future development of fullerene nanomaterials as a novel class of enzyme inhibitors.
Keywords: fullerenes, BTK inhibitor, anticancer agent, autophagy, apoptosis
Graphical Abstract:

Introduction
Since their discovery in 1985, fullerenes have emerged as an object of interest for synthetic chemists based on their unique structure and physical properties.1 These observations supported the exploration of the biological activity of fullerenes, which was first started by the case of HIV-1 protease inhibition reported by Sijbesma et al.2 However, the first breakthrough for nanomedical applications of the engineered buckyballs was possible thanks to the development of chemical methods enhancing their water-solubility, mainly using Bingel–Hirsch cyclopropanations and Prato cycloadditions.3,4 Under appropriate conditions, Bingel–Hirsch reactions lead to the formation of Th symmetrical hexakisadducts that are present only in the form of one regioisomer, which is essential for biological applications.5–7 Currently, there is rapid development of appropriately engineered fullerene nanomaterials, mainly for drug delivery systems, antioxidants, and MRI contrast agents.8 The interactions between proteins and carbon nanomaterials, especially the protein corona formation, are believed to play a crucial role in the biological effects of carbon nanomaterials.9,10 The observation of fullerene–protein complexation has been investigated for the past 20 years, from the initial experiments describing the creation of fullerene complexes with bovine serum albumin to further exploration using computational methods.11,12 Interestingly, the strong adsorption of lysozyme protein can be used as a method to solubilize fullerenes, enabling the formation of lysosomal trafficking phototheranostic agents.13 The BTK protein is a non-receptor tyrosine kinase that has an essential role in signal transduction of the B-cell antigen receptor, with crucial applications in treating chronic lymphocytic leukemia (CLL) and mantle cell lymphoma (MCL).14 Many novel BTK inhibitors have been developed in the past decade, including the small molecules ibrutinib and evobrutinib, which have high selectivity over other kinases and pronounced activity at nanomolar concentrations.15 In general, the BTK inhibitors can be divided into two subgroups, reversible and irreversible; the latter shows strong binding to the Cys481 residue of BTK protein.16 Interestingly, BTK activation is initiated by the phosphorylation of Tyr551 in the kinase domain, which can occur in the cellular environment using spleen tyrosine kinase (SYK) or SRC-type kinases.17 The Tyr551 position is crucial for modulation of BTK protein activity—some active inhibitors such as CGI1746 bind BTK in a modified, inactive conformation in which the regulatory Tyr551 is rotated and forms a new binding pocket (H3 pocket).18 However, up to now, no carbon nanomaterials have been designed that can successfully inhibit BTK kinase activity at the cellular level.
We have recently begun to explore the use of fullerene nanomaterials as first-in-class carbon nanomaterial inhibitors of non-receptor tyrosine kinases, namely Fyn A kinase.19 Previously developed glycofullerene-based inhibitors were non-toxic and had no effect on the cell cycle of pancreatic cancer cells, but induced autophagy and disrupted redox balance. The formation of a protein corona on the surface of glycofullerenes modulated their inhibition effectiveness and remodeled their selectivity, impairing the ability to reduce protein levels at a cellular scale. In the present study, we demonstrate that the modification of the buckyball scaffold using diglycine malonate via Bingel–Hirsch cyclopropanation is an easy and robust approach to forming a hexakis diglycinemethanofullerene (HDGF) nanomaterial (Figure 1) with the ability to block the formation of the BTK protein, thereby inhibiting its downstream molecular pathway in RAJI cells. Our initial studies of anticancer activity were carried out on two blood cancer cells – K562 and RAJI. HDGF exhibits good anticancer properties only against RAJI cells, so further its molecular mechanism of action was characterized on this cellular model.
 |
Figure 1 Structure of HDGF and FDA-approved BTK inhibitors (A). Proposed mechanism of action of HDGF in RAJI cells. Image created with BioRender.com (B). |
Materials and Methods
Materials
All chemicals used were of reagent-grade quality or better. Solvents were dried in accordance with standard literature procedures. The following reagents were used as received: C60 (99.5+%, SES Research, USA), glycine tert-butyl hydrochloride (Sigma Aldrich, USA), malonic acid (Sigma Aldrich, USA), DBU (1,8-diazabicyclo[5.4.0]undec-7-ene, Sigma Aldrich, USA), triethylamine (Fisher, Belgium), CBr4 (Sigma Aldrich, USA), 1,4-dioxane (Acros Organics, Belgium), thionyl chloride (Fisher, UK), dichloromethane (Chempur, Poland), anhydrous sodium sulfate (POCH, Poland), diethyl ether (Eurochem, Poland), ethyl acetate (POCH, Poland), toluene (Chempur, Poland), methanol (Chempur), and concentrated hydrogen chloride (POCH, Poland).
Methods
Nuclear magnetic resonance (NMR) spectra were obtained using a Bruker Avance III 500 MHz NMR spectrometer with tetramethylsilane as the internal standard. Mass spectroscopy (MS) was performed using a single electrospray quad Agilent InfinityLab LC/MSD XT mass spectrometer, equipped with an Agilent HPLC 1260 Infinity II system and SBC18 column (1.8 µm, 2.1×50 mm). Spectra were collected in the range 100–3000 Da. Additional electrospray ionization (ESI) MS measurements were performed using a Varian 320-MS ESI mass spectrometer and high-resolution spectra were collected on Agilent 6224 TOF spectrometer. All ESI-MS measurements were conducted in an acetonitrile/H2O mixture. Attenuated total reflectance Fourier transform infrared (ATR-FT-IR) measurements were collected using a JASCO FT/IR-4600 spectrophotometer equipped with a JASCO ATR PRO ONE kit. Fullerene powders were measured using an ATR ZnSe accessory in the range 700–4000 cm−1. The spectra were recorded using 64 accumulations at a spectral resolution of 1 cm−1. Dynamic light scattering and zeta potentials of the fullerene nanomaterial 4 were measured using a Zetasizer Nano Instrument (Malvern Panalytical Ltd., UK). High-resolution transmission electron microscopy (HRTEM) observations were performed using a JEOL JEM 3010 microscope operating at a 300 kV accelerating voltage, which was equipped with a Gatan 2k × 2k OriusTM 833SC200D CCD camera. The chemical composition of the water-soluble fullerene nanomaterial 4 was examined by X-ray photoelectron spectrometry (Physical Electronics PHI 5700, Chanhassen, MN, USA) using monochromatic Al Kα radiation (1486 eV). The analysis area was 800 µm in diameter. The spectra were collected from the surface of the powdered sample placed onto carbon conductive tape. The survey spectrum was collected with a pass energy of 187.85eV, with a pass energy of 23.50 eV for the O1s, C1s, and N1s core levels. PHI MultiPak (v.9.6.0.1, ULVAC PHI, Chigasaki, Japan) software was used to calculate the atomic concentrations and curve fitting. As the sample was air-exposed, the adventitious carbon located at 284.8 eV (assigned to C–C hydrocarbon bonds) was used to calibrate the spectra. To deconvolute the O1s, C1s, and N1s peaks, Shirley-type background subtraction and the Gauss–Lorentz line shape were applied. Cryo-electron microscopy, as well as room-temperature measurements, were performed on the Titan Krios 3Gi (Thermo Scientific) and Tecnai G2 F30 electron microscope at the University of Chicago Advanced Electron Microscopy Core Facility (RRID:SCR_019198). Cryo-EM was conducted on copper grids (Lacey carbon, EMS LC200-Cu) which were plasma-cleaned (Gatan Solarus) for 30s. Then, 3.5 µL of fullerene solution in DI water (c = 1 mg/mL) was applied to the grid, blotted for 2s, and plunge-frozen using the Thermo Scientific Vitrobot (Mark IV). The grids were stored in liquid nitrogen until imaging. Then, they were clipped in autogrids (Thermo Scientific) and placed into the cassette for loading onto the Titan Krios 3Gi (Thermo Scientific). The grids were imaged using EPU (Thermo Scientific). For room-temperature EM of fullerene nanomaterials (negative staining) carbon-coated copper grids (EMS CF200-Cu) were plasma cleaned (Gatan Solarus). The 3.5 µL of fullerene sample dissolved in DI water (c = 1 mg/mL) was applied to the grid for 1 minute and then blotted away. The grid was rinsed with two drops of uranyl formate stain (0.75%) and then stained with a third drop of uranyl formate for 45s. The stain was then blotted away. The grid was imaged on a Tecnai G2 F30 electron microscope FEI). The final dialysis purification of the water-soluble fullerene nanomaterial was performed using Pall Microsep™ centrifugal membranes with molecular cut-offs at 1 and 3 kDa (Pall Corporation).
Synthetic Procedures
Synthesis of malonyl dichloride. Malonyl dichloride was prepared according to previously reported references.20 Briefly, malonic acid (0.9 g; 8.65 mmol) was dissolved in 30 mL of thionyl chloride. The reaction was stirred for 48 hours at 50°C. Then, the solvent was removed, and the obtained liquid was used in the next step without further purification.
Synthesis of Di-tert-Butyl-Diglycinyl Malonate (1)
Under argon protection, glycine tert-butyl ester hydrochloride (3301 mg, 10 mmol), dried triethylamine (2020 mg, 50 mmol), and dried dichloromethane (200 mL) were mixed in a round-bottomed flask at −10°C. A solution of malonyl dichloride (564 mg, 20 mmol) in dried dichloromethane was added for 0.5 h. After the mixture was stirred for 1 hour at −10°C, it was left to reach room temperature and stirred for another 12 hours. After water (300 mL) was added, and the organic phase was extracted with dichloromethane (3 × 300 mL). The organic phase was dried over anhydrous Na2SO4. After the solvent was removed, the residue was purified on a silica gel column with a mixture of petroleum ether and ethyl acetate (10:2) as the eluent to give the pure product (1.5 g, 25%) as a brown, viscous liquid.
Synthesis of the [60]Fullerene Monoadduct (2)
The [60]fullerene (1 mmol; 720 mg) was dissolved in 700 mL of dry toluene using an ultrasonic bath (20 minutes). To the solution of C60, glycine malonate (1.25 mmol; 330 mg) and CBr4 (2 mmol; 662 mg) were added. The DBU solution (1 mmol; 152 mg) in 6 mL of DCM was added dropwise to the reaction mixture. The reaction mixture was stirred for 3 hours at room temperature and monitored by TLC. Subsequently, the unreacted [60]fullerene was removed by pouring the reaction mixture through a silica plug. The [60]fullerene was flushed out with toluene. The residual brownish monoadduct fraction was purified on a column using a dichloromethane/methanol eluent (50:1 v/v), followed by evaporation on a rotary evaporator. A light-brown solid was obtained (192.7 mg, 18% yield) and characterized by NMR and FT-IR spectroscopy and MALDI-TOF spectrometry.
Synthesis of Water-Soluble [60]Fullerene Hexakisadduct (4)
The [60]fullerene monoadduct (2) (0.178 mmol; 187 mg) was dissolved in a mixture of 30 mL of dry methylene chloride and 100 mL of dry toluene. Glycine malonate (1.78 mmol; 587.7 mg) and excess CBr4 (3.56 mmol; 1178 mg) were added to the fullerene solution and stirred vigorously at room temperature. Next, a solution of DBU (2.14 mmol; 324 mg) in 3 mL of dichloromethane was added dropwise in aliquots (0.5 mL per hour). The reaction mixture was stirred at room temperature for 48 hours, and the solution changed color to reddish brown. The final product (3) was purified using column chromatography with a dichloromethane/methanol gradient as the eluent (starting from dichloromethane and finishing with 50:50 v/v), which resulted in the formation of a brown solid with a 19% yield. The water-insoluble fullerene nanomaterial (3) was deprotected from tert-butyl ester groups using the HCl-1,4-dioxane methodology. The [60]fullerene derivative (3) was dissolved in 18 mL of 1,4-dioxane and 3 mL of concentrated HCl. The fullerene nanomaterial was stirred for 7 days at room temperature. Subsequently, the final product was purified by dialysis of an aqueous solution of (4) using a centrifugal membrane (molecular weight exclusion limit 1.0 kDa; Nanosept, Pall Corporation, USA) in three cycles, lyophilized, and stored at −20°C.
Molecular Docking and MD Simulations
System Setup
The crystal structure of the BTK (PDB ID: 5P9J) was downloaded from the Protein Data Bank (PDB). The structure of the covalent inhibitor (ibrutinib) was removed from the PDB structure, and the protonation of the native cysteine (Cys481) was restored. The Amber ff14SB force field was used to model the BTK protein.21 The GAFF force field was used to model HDGF using the antechamber module implemented in Amber16. The partial atomic charges of HDGF were calculated using the restraint electrostatic potential method (RESP) at the HF/6-31G* level of theory.
Docking
Docking models were generated using the PatchDock algorithm: 1276 poses were obtained.22 The docking poses were clustered to avoid the generation of redundant solutions, and five possible complexes were identified (Figure S1).
MD Simulations
The five poses were minimized by 5000 steps of steepest descent minimization, followed by 5000 steps of the conjugate gradient algorithm. The minimized structures underwent an equilibration step of 1 ns and were heated from 0 to 300 K (Langevin thermostat). Periodic boundary conditions (PBC) and particle mesh Ewald summation were used throughout (with a cut-off radius of 10 Å for the direct space sum). The MD simulations were performed using an explicit solvent (TIP3P water model). Sodium counterions were included to exactly neutralize the charge of the system. After the equilibration, a production MD simulation of 100 ns was performed for every system at 300 K. Amber 16 was used to run all the simulations. Only the simulation obtained from Pose 1 generated a stable complex in water.
Molecular Mechanics/Generalized Born Surface Area (MM/GBSA) Analysis
In total, 5000 frames were extracted from MD simulations and used for the MM-GBSA analysis. An infinite cut-off was used for all the interactions. The electrostatic contribution to the solvation free energy was calculated with the Generalized Born (GB) model, as implemented in MMPBSA.py.23 The nonpolar contribution to the solvation-free energy was determined with solvent-accessible surface area-dependent terms. To obtain an estimate of the binding entropy, the normal modes for the complex, receptor, and ligand were calculated, and the results were averaged using the PTRAJ program (Normal Mode Analysis) via MMPBSA.py.23 The analysis of the molecular structures/MD trajectories and creation of images was performed using Chimera.
Biological Studies
Cell Cultures
The human suspension chronic myelogenous leukemia cell line K562 and human suspension Burkitt's lymphoma cell line RAJI were purchased from Sigma Aldrich. Cell lines were cultured in RPMI-1640 medium (Merck) containing 10% heat-inactivated FBS and a mix of two antibiotics (penicillin/streptomycin, 1% v/v; Gibco). Cell lines were cultured at 37°C with a humidified atmosphere containing 5% CO2.
Cytotoxicity Studies
The cells were seeded in 96-well plates (Nunc) at a density of 8,000 cells per well and incubated under standard conditions at 37°C for 24 h. The assay was performed following incubation for 72 h with various concentrations of HDGF and ibrutinib. Then, DMEM without phenol red with CellTiter 96®AQueous One Solution-MTS (Promega) solution was added to each well and incubated for 1 h at 37°C. The optical density of the samples was measured at 490 nm using a multi-plate reader (Varioskan LUX, Thermo Scientific). The obtained results were presented relative to the control and were estimated as the inhibitory concentration (IC50) values (using GraphPad Prism 9). Each individual compound was tested in triplicate in a single experiment; each experiment was performed three or four times.
Tyrosine Kinase Assay
Assays using the Kinase Selectivity TK-2 profiling systems and ADP-Glo Kinase Assay (both from Promega) were performed to determine the inhibition of the non-receptor tyrosine kinases. The reagents were prepared in accordance with the manufacturer’s instructions and the protocol for nanomaterials established by our group.19 Briefly, 95 μL of 2.5× Kinase Reaction Buffer was added to each of the kinases (ABL1; BRK; BTK; CSK; Fyn A; Lck; Lyn B; Src) from an eight-well strip. Then, 15 μL of freshly prepared solution of ATP (100 μM) was added to the eight-well substrate/co-factor strip. The HDGF was dissolved in water or DMEM with 12% FBS to a concentration of 40 mg/mL, which was then used as the stock solution to prepare the 0.05–2 mg/mL concentrations in 1× Kinase Reaction Buffer (40 mM Tris, pH 7.5; 20 mM MgCl2; 0.1 mg/mL BSA; 50 μM DTT). First, 1 μL of prepared solutions of the HDGF was transferred into 384-well white plate. Then, 2 μL of kinases from the eight-well strip were added to each well, and the plate was incubated for 10 min at room temperature. Then, 2 μL of the substrates from the eight-well substrate/co-factor strip were added to each well, and the plate was incubated for one h at room temperature. Solutions of 1× Kinase Reaction Buffer with 5% vehicle (water or DMEM with 12% FBS) were used as the negative controls without inhibitors or enzymes. To stop the reaction, 5 μL of ADP-Glo reagent was added to each well, and the plate was incubated for 40 min at room temperature. After this time, 10 μL of the Kinase Detection Reagent was added to each well, and the luminescence was measured in a Varioskan LUX multi-plate reader following 30 min incubation at room temperature. The obtained results were compared with the control (without inhibitor) and the inhibitory concentration (IC50) values were estimated using GraphPad Prism 9.
Calcium Assay
RAJI cells were seeded in a 96-well black plate at a density of 40,000 cells per well and incubated under the standard conditions of 37°C for 24 h. The following day, the medium was removed, and solutions of the tested nanomaterial HDGF (347 and 174 µM) and ibrutinib (30 and 15 µM) were added. After incubation for 24 h, the Fluo-4 AM assay (Invitrogen) was performed in accordance with the manufacturer’s instructions. Briefly, the cells were centrifuged and washed with cold PBS, and the cells were resuspended in a solution of Fluo-4 AM (5 µM) and incubated for 30 min at 37°C. After staining, the lymphoma cells were washed with cold PBS and resuspended in DMEM without serum and phenol red. The fluorescence intensity was measured in a Varioskan LUX multi-plate reader with a 485 nm excitation and a 520 nm emission filter. The experiments were performed at least three times.
Analysis of the mRNA Expression
RAJI cells were exposed to the tested nanomaterial HDGF (347, 174, and 84 µM) and ibrutinib (30 and 15 µM) for 24 h. Then, total RNA was isolated using TRIzol Reagent (Ambion). Reverse transcription was performed on 1 μg of total RNA using a ProtoScript M-MuLV First Strand cDNA Synthesis Kit (New England BioLabs). RT-qPCR was performed using a QuantStudio 5 Real-Time PCR System (Thermo Scientific) in a 10 μL reaction volume containing Luna Universal qPCR Master Mix (New England BioLabs), specific primer pair mix, and cDNA. The PCR reaction was performed as follows: initial denaturation at 95°C for 60s; followed by 40 denaturation cycles of 95°C and 15 sec; annealing (primer-specific temperature for 30s); and extension at 72°C for 30s. Melting curve analysis was used to determine the specific PCR products. The results were analyzed based on a comparison of the expression of the target genes to the reference gene, HPRT1, using the 2−ΔΔCT method. The experiments were performed at least four times. All primer pair sequences were purchased from Merck and are listed in Table S2.
Immunoblotting
Before the experiment, RAJI cells were seeded onto 3 cm Petri dishes (Nunc) at a density of 500,000 cells per well. The following day, the cells were stimulated with anti-human IgM (12 µg/mL, 10 min) and the medium was replaced with the solution of HDGF (347 and 174 µM) and ibrutinib (20 µM). After exposure for 24 h, the cells were collected, centrifuged, and lysed on ice in complete RIPA buffer containing Halt Protease Inhibitor Cocktail, Halt Phosphatase Inhibitor Cocktail, and 0.5 M EDTA (all from Thermo Scientific). The protein quantification was measured using a BCA Protein Assay Kit (Thermo Scientific) in accordance with the manufacturer’s protocol. Equal amounts of the proteins were separated by SDS-PAGE and transferred onto nitrocellulose membranes. After nonspecific binding was blocked by incubation of the membrane in 5% non-fat milk prepared in TTBS (Tris-buffered saline with Tween 20), the membranes were incubated with specific primary antibodies (all from Cell Signaling) at 1:1000 dilution (for BTK, phospho-BTK, PLCγ2, phospho-PLCγ2, Akt, phospho-Akt, caspase-9, caspase-3, and c-Myc) and at 1:2000 dilution for the reference proteins (vinculin, β-actin, and GAPDH) overnight at 4°C. On the next day, the membranes were washed and incubated with horseradish peroxidase (HRP)-conjugated secondary antibodies for 1 h at room temperature. The chemiluminescence signals were recorded after staining with a SuperSignal™ West Pico Chemiluminescent Substrate (Thermo Scientific) using the ChemiDoc™ XRS+ System (BioRad). The experiments were performed at least four of five times. The densitometric analysis was conducted using ImageJ software (Wayne Rasband, National Institutes of Health, USA).
Statistical Analysis
The results are presented as the mean ± standard deviation (SD) of all independent experiments performed. The statistical analysis for calcium assay and mRNA analysis was performed using one- or two-way ANOVA with Dunnett’s post-hoc test. A p-value of 0.05 or less was considered to be statistically significant.
Results and Discussion
To avoid formation of a plethora of [60]fullerene regioisomers, a water-soluble fullerene nanomaterial was prepared in a two-step Bingel–Hirsch reaction; first, a more reactive fullerene monoadduct (2) was formed, which was further reacted with the same malonate to create the protected fullerene hexakisadduct (Scheme 1). The formed carbon nanomaterial was hydrolyzed and purified by membrane dialysis to form the described water-soluble fullerene nanomaterial, HDGF. The 1H and 13C NMR spectra of malonate 1 and its fullerene derivatives are shown in Figures S2–S5 (SI). The reaction conditions for the studied cyclopropanations were initially optimized, to obtain in the first step only, the [60]fullerene monoadduct (malonate/DBU/CBr4 ratio 1.25/1/2). For the second Bingel–Hirsch reaction, the reaction conditions used were previously developed to graft the second malonate groups to fullerene derivative 2 and were successfully applied to produce compound 3, which was deprotected in acid conditions to the form pure water-soluble nanomaterial 4 (HDGF) after purification by membrane dialysis.24 The chemical structure of compound 2 was easily confirmed by its 1H- and 13C-NMR spectra (Figures S4 and S5) as well as by mass spectrometry (Figures S6 and S7). The 13C-NMR fullerene monoadduct displayed 15 characteristic signals of fullerene sp2 carbons (in the 145–139 ppm range, Figure S5), as well as one sp3 carbon at approximately 70 ppm, with no additional peaks from bis- and trisadducts. In the case of the [60]fullerene hexakisadduct, its symmetry (Th) was confirmed by a characteristic 13C-NMR spectrum in which three fullerene signals were observed (two sp2 carbons between 145 and 139 ppm and one sp3 signal at approximately 70 ppm, Figure 2A).
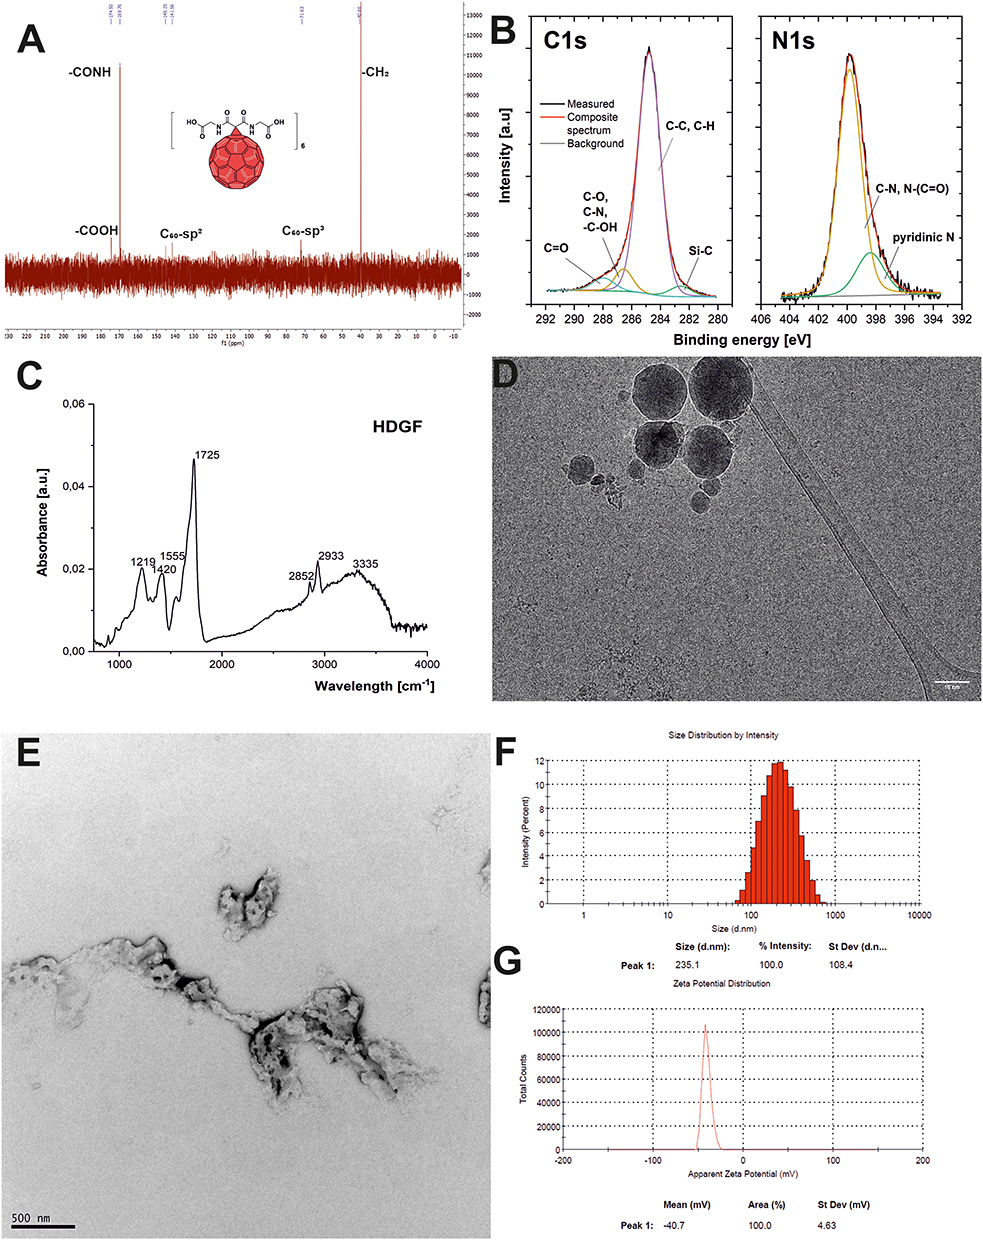 |
Figure 2 Physico-chemical characterization of fullerene nanomaterial HDGF: (A) The 13C-NMR spectrum; (B) A high-resolution XPS spectra of C1s and N1s; (C) The FT-IR spectrum; (D) Cryo-transmission electron microscopy; (E) Transmission electron microscopy; (F) Dynamic light scattering measurements; (G) Zeta potential measurements. |
Additionally, ESI-TOF mass spectra of compounds 2 and 3 confirmed the molecular ion peaks for fullerene monoadduct and the protected hexakisadduct, for which masses were observed at 1048.1519 Da [(M+3Na)+3H2O]+ and 2841.0877 Da, respectively (Figures S7 and S8).
 |
Scheme 1 Synthetic protocol for obtaining fullerene nanomaterial 4. |
The analysis of the survey spectrum of HDGF indicates that the main constituents of the examined samples were carbon, oxygen, and nitrogen. The analysis of the C1s line (Figure 2B) indicates that carbon occurs in four different chemical environments. In the deconvoluted C1s range, the most intense line, with a binding energy of 284.8 eV, indicates the presence of the C–C and C–H bonds in the sample.25 The second chemical state, observed at a binding energy of 286.6 eV, can be assigned to C–O and C–N bonds (similar to those observed in fullerene derivatives) and to –C–OH bonds.26 The line at 288 eV represents the carbonyl group and the double carbon bond with oxygen (C=O).27 The analysis of the chemical state of nitrogen indicated that it existed in only two chemical surroundings (see Figure 2B). The peak localized at 399.8 eV can be assigned to C–N and N–(C=O)– bonds, whereas the N1s component at 398.4 eV can be assigned to pyridinic type nitrogen.28 The deconvolution of the O1s spectrum, shown in the Supporting Information (Figure S9), revealed the presence of three compositional lines at 529.2 eV, 530.6 eV, and 532.5 eV. The chemical state of oxygen detected at 529.2 eV has been observed in graphene oxide films and can be linked to atomic oxygen.29,30 The chemical composition, atomic concentration, and percentage contributions of HDGF obtained from the XPS studies are presented in Table S1.
The final fullerene nanomaterial 4 was also characterized using FT-IR spectroscopy (Figure 2C). Characteristic signals of carbonyl group were present at approximately 1725 cm−1 and a there was a broad signal for OH groups with a maximum at approximately 3335 cm−1, suggesting possible H-bonding. DLS analysis revealed the formation of [60]fullerene aggregates at approximately 235 nm with an observed zeta potential of −40.7 mV (Figure 2F and G), but with a relatively high polydispersity index (PDI = 0.27). As water-soluble fullerene is able to form a wide range of aggregates that are in stable equilibrium, we also studied this phenomenon using cryo- and room temperature electron microscopy. The cryo-TEM analysis (Figure 2D) revealed that HDGF formed smaller spherical aggregates (15–35 nm in diameter) as well as the larger, “fluffy” type of aggregates (200–300 nm in diameter, Figure 2E), which were also previously observed for aminofullerenes.28 Additionally, we have checked the behavior of synthesized fullerene nanomaterial in a different pH conditions, as well as in medium containing FBS (Figures S10–S14). In general, we observed formation of larger aggregates (400 nm) at lower pH values (pH = 3) and almost the same behavior at pH = 6 and pH = 7. In contrast, at higher pH values, the formation of two subtypes of fullerene aggregates was clearly detected – around 40 nm and 250 nm. The further studies on fullerene aggregation in cellular medium containing FBS confirmed its stability-almost the same pattern of aggregates was observed after 3 days.
To evaluate the inhibitory potential of HDGF against non-receptor tyrosine kinases, including ABL, BRK, BTK, and Src family kinases, we performed the ADP Glo Kinase assay. As shown in Table 1, HDGF dissolved in water exhibited strong inhibitory activity, with inhibition at micromolar concentrations, for BTK and Fyn kinases. The calculated IC50 values were 25.79 µM and 11.90 µM, respectively. Interestingly, for HDGF dissolved in DMEM with 12% FBS, we observed that the high-level BTK kinase inhibition was maintained (IC50 = 29.76 µM). In our previous work, we observed an attenuation of the inhibitory potential of glycofullerenes in culture medium.19 The reason for this phenomenon was the interaction of nanomaterials with serum and the formation of a protein corona on their surface. The presence of a protein corona can lead to the aggregation of nanoparticles, modifying their surface properties by reducing stability, which affects their interaction with cells and inhibits their ability to bind to specific target receptors.31 For the other kinases tested, we noted significant differences in the inhibitory activity of HDGF dissolved in water or medium. In the case of the Fyn kinase, we observed an almost four-fold weaker effect for the tested nanomaterial in DMEM (IC50 = 44.15 µM). In turn, we observed a more significant difference in inhibition for the Lyn kinase. The calculated IC50 values were 72.42 µM and 864.1 µM for HDGF dissolved in water and medium, respectively. Additionally, we observed the weak affinity of HDGF for ABL, BRK, CSK, Lck, and Src kinases.
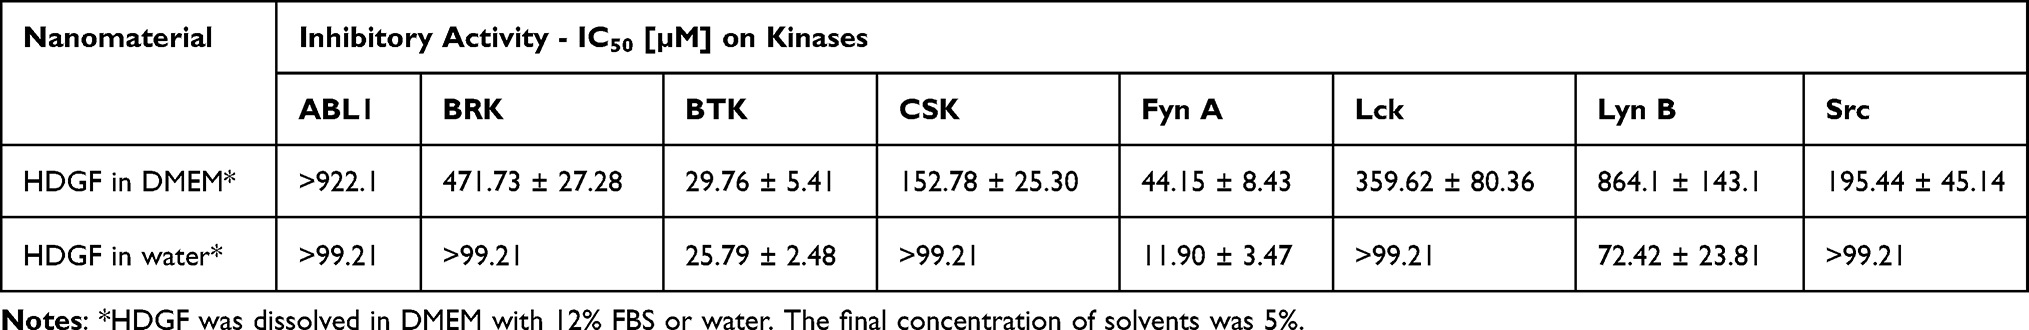 |
Table 1 Inhibitory Activity of Tested HDFG Against a Panel of Tyrosine Kinases |
To understand the atomistic details of the interaction between HDGF and BTK, we used a docking procedure able to determine the fullerene binding site in proteins. HDGF binds in the active site of BTK, interacting directly with Cys481, Arg525, and Tyr551, which are crucial residues for the activity of BTK (Figure 3A). These interactions may explain the inhibitory effect of HDGF on the BTK protein.
 |
Figure 3 (A) Identification of the HDGF binding pocket in the BTK three-dimensional structure. (B) Electrostatic (on the left) and surface (on the right) complementarity between HDGF and BTK. (C) Accessibility of Tyr551 before (on the left) and upon (on the right) HDGF binding. (D) ΔGbinding between HDGF and BTK broken down by residue. |
HDGF shows strong shape and electrostatic complementarity with the BTK active site (Figure 3B). In particular, the negatively charged HDGF interacts favorably with the positively charged region of the active site that can physiologically bind a molecule that is negatively charged, such as ATP. The phosphorylation of Tyr551 is essential for BTK function, and HDGF obscures Tyr551, strongly reducing its accessibility (Figure 3C). Starting from the docking pose, an MD simulation for 100 ns was performed. MM/GBSA analysis of the MD trajectory estimated a favorable binding energy for HDGF with BTK, of −43.8 kcal mol−1 (Figure 3D). Fingerprint analysis provided the contribution to the binding of each amino acid with HDGF. The most strongly interacting amino acids were positively charged residues, such as Lys430, Arg487, Arg525, and Lys555. Notably, HDGF strongly interacts with: i) the ATP binding pocket of BTK (Gln412 and Lys430); ii) the catalytic residue Arg525; and iii) Cys481, which represents the site of covalent binding of the most commonly studied covalent inhibitors of BTK, such as ibrutinib, acalabrutinib, or zanubrutinib. The inhibitory activity of HDGF is multifaceted: it hampers the BTK active site, interacting directly with the catalytic residues Arg525, obscures Tyr551, rendering it inaccessible to phosphorylation, and binds to residues that form the ATP binding pocket.
In subsequent experimental studies, we focused on exploring the mechanism of action of HDGF at the cellular level. First, we assayed the cytotoxicity of HDGF in two suspension-culture human cell lines: K562 (leukemia) cells and RAJI (lymphoma) cells. We chose these two cell lines because of their characteristics, including high levels of BTK expression, as reported previously.32,33 The tested nanomaterial resulted in good antiproliferative activity against RAJI cells. The calculated IC50 parameter was 350 µM (Figure 4A). In contrast, the leukemia cells were resistant to HDGF. The reference small-molecule BTK inhibitor, ibrutinib, has a high level of activity against K562 cells (IC50 = 0.85 µM) and moderate activity against RAJI cells (IC50 = 20.88 µM).34 Subsequently, we examined the induction of cell death by autophagy and apoptosis in RAJI cells treated with HDGF. For this purpose, we determined the expression of two essential genes (LC3 and p62) related to the autophagy process by qRT-PCR (Figure 4B), as well as two caspases (caspase-3 and −9) responsible for the activation and progression of apoptosis by Western blotting (Figure 4C). Our results showed that 347 µM HDGF caused a significant increase in the mRNA expression of LC3, which is a marker of autophagosomes formation.
 |
Figure 4 Antiproliferative activity of HDGF and ibrutinib against K562 and RAJI cells (*value for lymphoma taken from ref.) (A). The effects of the tested compounds on the expression of genes associated with autophagy (B) and the expression of proteins related to the apoptosis process (C). The calcium levels after exposure to the tested compounds in RAJI cells (D). Statistical significances were calculated using one- or two-way ANOVA with Dunnett’s post hoc test: **p < 0.01, ***p < 0.001, ****p < 0.0001 compared with the untreated cells (control). |
Additionally, we observed an almost three-fold increase in the expression of p62 after exposure to HDGF (174 µM) and ibrutinib (15 µM). However, protein expression analysis showed that HDGF caused a marked increase in the cleavage product of caspases −3 and −9. These proteins are among the activators and effectors of the apoptosis process, and an increase in their expression is a hallmark of this form of cell death.35 Subsequently, we began to investigate the direct association of HDGF on inhibition of the BTK signaling pathway by examining changes in the calcium levels in RAJI cells after treatment. Several reports indicate that BTK kinase is involved in B-cell antigen receptor signal transduction, which triggers a cascade of events leading to the activation of phospholipase C-γ2 (PLCγ2) phosphorylation, calcium mobilization in cells, stimulation of ERK, JNK, and MAPK kinases, in addition to NF-κB activation.36–38 Our analyses showed that cellular calcium levels drop dramatically following incubation with HDGF and the BTK inhibitor ibrutinib. In addition, the downward trend in calcium levels in RAJI cells is dependent on the drug and dose used (Figure 4D).
Next, we explored the effect of HDGF on the expression of the BTK kinase and its downstream targets in the signaling pathway at the cellular level. As mentioned above, the BTK kinase is responsible for the activation of PLCγ2, which then boosts the influx of calcium ions into the cellular environment, and subsequently stimulates transcriptional factors, including the nuclear factor of activated T-cells (NFAT) or NF-κB.39,40 Moreover, in B-cells, this kinase functions as a transcriptional regulator that can interact with proteins such as Arid3a or BAM11. Additionally, BTK participates in the immune response by interacting with the TIR domains of TLR8 and TLR9, which mediate TNF induction and NF-κB recruitment.41 Consequently, we examined the influence of HDGF and ibrutinib on changes in the mRNA expression of BTK, TLR8, NFAT, and ARID3A in RAJI cells. As shown in Figure 5A, 84 µM HDGF caused a significant, almost two-fold decrease in BTK gene expression. Additionally, we observed a slight downregulation of this gene after exposure to higher concentrations of HDGF. Surprisingly, BTK expression increased after exposure to ibrutinib. The explanation for this phenomenon may be that gene production is enhanced to compensate for the low protein expression of BTK following inhibition by ibrutinib. Moreover, we observed a significant decrease in the expression of TLR8 and NFAT after incubation with both the tested compounds. In the case of ARID3A, we noticed a significant, almost two-fold downregulation after exposure to 84 and 174 µM HDGF and 30 µM ibrutinib.
 |
Figure 5 Impact of the tested compounds on the expression of selected genes (A) and proteins (B) associated with the BTK signaling pathway in RAJI cells. The statistical significances were calculated using one- or two-way ANOVA with Dunnett’s post hoc test: *p < 0.05, **p < 0.01, ***p < 0.001, ****p < 0.0001 compared with the untreated cells (control). |
Finally, we assessed changes in the BTK protein expression and downstream signaling transduction after exposure of RAJI cells to HDGF and ibrutinib following anti-IgM stimulation. Notably, the stimulation of RAJI cells could initiate the full activation of BTK kinase through Bcr receptor signaling and subsequently induce PLCγ2 phosphorylation and activation of downstream signaling cascade pathways, including MAPK or Akt. The results are presented in Figure 5B. In general, we noticed significant inhibition of the phosphorylation of the BTK protein and downstream targets, including PLCγ2 and Akt. At 347 µM, HDGF caused an almost five-fold decrease in the level of phosphorylation of BTK at Tyr551.
Changes in the total BTK protein expression also was noted. Similar results were also observed for treatment with an FDA-approved BTK inhibitor. In turn, we noticed significant inhibition of phosphorylation of PLCγ2 at the Tyr759 site after exposure to 174 and 347 µM HDGF. Interestingly, the observed effects were more significant than with ibrutinib. In the case of c-Myc protein, a downstream target of the MAPK pathway, we observed a slight downregulation after treatment with 374 µM HDGF and 20 µM ibrutinib. From a therapeutic perspective, the suppression of c-Myc expression may be crucial to overcome resistance mechanisms and to sensitize cells to ibrutinib treatment.42 The HDGF also blocked the phosphorylation of Akt at the Ser473 residue, which can be activated without calcium release events. Thus, the tested [60]fullerene derivative may contribute to the inhibition of pro-survival processes, cell migration, and cell adhesion, which are driven by the activation of the Akt pathway.
Conclusions
To the best of our knowledge, our study is the first to describe the inhibition of the BTK protein using a water-soluble fullerene nanomaterial. Our data show the controlled synthesis of a highly water-soluble and Th symmetrical diglycinyl [60]fullerene hexakisadduct, which was confirmed by 13C-NMR spectroscopy and mass spectroscopy. The created fullerene nanomaterial formed spherical aggregates visualized by cryo-TEM with a negative zeta potential of approximately −40 mV. The enzymatic and cellular studies revealed strong inhibition of the BTK protein with an IC50 of approximately 25 µM, with only a slight influence of adsorbed protein corona. The cytotoxicity and mechanistic studies in RAJI and K562 cells revealed the increased gene expression of LC3 and p62 with an additional increase in the cleavage product of caspase−3 and −9, suggesting the cell death occurred by mixed mechanisms. Moreover, the cellular calcium levels dropped dramatically after cells were treated with HDGF. To better understand the molecular mechanism of BTK inactivation by HDGF, we performed computational studies, which predicted that HDGF binds in the active site of BTK, interacting directly with Cys481, Arg525, and Tyr551, the residues that are crucial for the activity of BTK. Our data provide helpful information for the development of fullerene-based inhibitors of non-receptor kinases.
Acknowledgments
This work was supported by National Science Centre (Poland) grant 2019/35/B/NZ5/04208 awarded to Dr Katarzyna Malarz. The publication was co-financed by the funds granted under the Research Excellence Initiative of the University of Silesia in Katowice (KM). Dr Maciej Serda thanks for National Science Centre (Poland) for grant funding (UMO-2016/23/D/NZ7/00912).
Disclosure
The authors declare no competing financial interest.
References
1. Steve FA, Acquah AVP, Markelov DA, Semisalov AS, Leonhardt BE, Magi JM. The beautiful molecule: 30 years of C60 and its derivatives. ECS J Solid State Sci Technol. 2017;6(6):M3155–M3162. doi:10.1149/2.0271706jss
2. Sijbesma R, Srdanov G, Wudl F, et al. Synthesis of a fullerene derivative for the inhibition of HIV enzymes. J Am Chem Soc. 1993;115(15):6510–6512. doi:10.1021/ja00068a006
3. Nakamura E, Isobe H. Functionalized fullerenes in water. The first 10 years of their chemistry, biology, and nanoscience. Acc Chem Res. 2003;36(11):807–815. doi:10.1021/ar030027y
4. Rašović I. Water-soluble fullerenes for medical applications. Mater Sci Technol. 2017;33(7):777–794. doi:10.1080/02670836.2016.1198114
5. Hirsch A, Lamparth I, Grösser T, Karfunkel HR. Regiochemistry of multiple additions to the fullerene core: synthesis of a Th-symmetric hexakis adduct of C60 with bis (ethoxycarbonyl) methylene. J Am Chem Soc. 1994;116(20):9385–9386. doi:10.1021/ja00099a088
6. Muñoz A, Sigwalt D, Illescas BM, et al. Synthesis of giant globular multivalent glycofullerenes as potent inhibitors in a model of Ebola virus infection. Nat Chem. 2015;8:50. doi:10.1038/nchem.2387
7. Dhiman S, Kaur A, Sharma M. Fullerenes for anticancer drug targeting: teaching an old dog a new trick. Mini Rev Med Chem. 2022;22(22):2864–2880. doi:10.2174/1389557522666220317145544
8. Kazemzadeh H, Mozafari M. Fullerene-based delivery systems. Drug Discov Today. 2019;24(3):898–905. doi:10.1016/j.drudis.2019.01.013
9. Ge C, Du J, Zhao L, et al. Binding of blood proteins to carbon nanotubes reduces cytotoxicity. Proc Natl Acad Sci U S A. 2011;108(41):16968–16973. doi:10.1073/pnas.1105270108
10. Pinals RL, Yang D, Rosenberg DJ, et al. Quantitative protein corona composition and dynamics on carbon nanotubes in biological environments. Angew Chem Int Ed. 2020;59(52):23668–23677. doi:10.1002/anie.202008175
11. Belgorodsky B, Fadeev L, Ittah V, et al. Formation and characterization of stable human serum albumin− tris-malonic acid [C60] fullerene complex. Bioconjug Chem. 2005;16(5):1058–1062.
12. Calvaresi M, Zerbetto F. Baiting proteins with C60. ACS Nano. 2010;4(4):2283–2299. doi:10.1021/nn901809b
13. Di Giosia M, Soldà A, Seeger M, et al. A bio‐conjugated fullerene as a subcellular‐targeted and multifaceted phototheranostic agent. Adv Funct Mater. 2021;31(20):2101527. doi:10.1002/adfm.202101527
14. Burger JA. BTK inhibitors: present and future. Cancer J. 2019;25(6):386.
15. Liang C, Tian D, Ren X, et al. The development of Bruton’s Tyrosine Kinase (BTK) inhibitors from 2012 to 2017: a mini-review. Eur J Med Chem. 2018;151:315–326.
16. Molina-Cerrillo J, Alonso-Gordoa T, Gajate P, Grande E. Bruton’s Tyrosine Kinase (BTK) as a promising target in solid tumors. Cancer Treat Rev. 2017;58:41–50. doi:10.1016/j.ctrv.2017.06.001
17. Lin L, Czerwinski R, Kelleher K, et al. Activation loop phosphorylation modulates Bruton’s Tyrosine Kinase (Btk) kinase domain activity. Biochemistry. 2009;48(9):2021–2032. doi:10.1021/bi8019756
18. Di Paolo JA, Huang T, Balazs M, et al. Specific Btk inhibition suppresses B cell–and myeloid cell–mediated arthritis. Nat Chem Biol. 2011;7(1):41–50. doi:10.1038/nchembio.481
19. Serda M, Malarz K, Mrozek-Wilczkiewicz A, Wojtyniak M, Musioł R, Curley SA. Glycofullerenes as non-receptor tyrosine kinase inhibitors-towards better nanotherapeutics for pancreatic cancer treatment. Sci Rep. 2020;10(1):1–11. doi:10.1038/s41598-019-57155-7
20. Wu J-C, Wang D-X, Huang Z-T, Wang M-X. Synthesis of diverse N, O-bridged calix [1] arene [4] pyridine-C60 dyads and triads and formation of intramolecular self-inclusion complexes. J Org Chem. 2010;75(24):8604–8614. doi:10.1021/jo1019267
21. Maier JA, Martinez C, Kasavajhala K, Wickstrom L, Hauser KE, Simmerling C. Ff14SB: improving the accuracy of protein side chain and backbone parameters from Ff99SB. J Chem Theory Comput. 2015;11(8):3696–3713. doi:10.1021/acs.jctc.5b00255
22. Schneidman-Duhovny D, Inbar Y, Nussinov R, Wolfson HJ. PatchDock and SymmDock: servers for rigid and symmetric docking. Nucleic Acids Res. 2005;33(suppl_2):W363–W367. doi:10.1093/nar/gki481
23. Miller BR, McGee TD, Swails JM, Homeyer N, Gohlke H, Roitberg AE. MMPBSA. py: an efficient program for end-state free energy calculations. J Chem Theory Comput. 2012;8(9):3314–3321. doi:10.1021/ct300418h
24. Serda M, Ware MJ, Newton JM, et al. Development of photoactive sweet-C60 for pancreatic cancer stellate cell therapy. Nanomedicine. 2018;13(23):2981–2993. doi:10.2217/nnm-2018-0239
25. Watts JF. High resolution XPS of organic polymers: the scienta ESCA 300 database. Surf Interface Anal. 1993;20(3):267. doi:10.1002/sia.740200310
26. Yu J, Guan M, Li F, et al. Effects of fullerene derivatives on bioluminescence and application for protease detection. Chem Comm. 2012;48(89):11011–11013. doi:10.1039/C2CC36099C
27. Chen X, Wang X, Fang D, Review A. On C1s XPS-spectra for some kinds of carbon materials. Fuller Nanotub Carbon Nanostructures. 2020;28(12):1048–1058. doi:10.1080/1536383X.2020.1794851
28. Korzuch J, Rak M, Balin K, et al. Towards water-soluble [60] fullerenes for the delivery of SiRNA in a prostate cancer model. Sci Rep. 2021;11(1):1–10. doi:10.1038/s41598-021-89943-5
29. Yang D, Velamakanni A, Bozoklu G, et al. Chemical analysis of graphene oxide films after heat and chemical treatments by X-ray photoelectron and micro-raman spectroscopy. Carbon. 2009;47(1):145–152. doi:10.1016/j.carbon.2008.09.045
30. Gladys M, El Zein A, Mikkelsen A, Andersen JN, Held G. Chemical composition and reactivity of water on clean and oxygen-covered Pd surface science. Surf Sci. 2008;602(22):3540–3549.
31. Wu LJ, Fu FQ, Wang WH, et al. Plasma protein corona forming upon fullerene nanocomplex: impact on both counterparts. Particuology. 2023;73:26–36. doi:10.1016/j.partic.2022.04.0061674-2001
32. Malarz K, Mularski J, Pacholczyk M, Musiol R. The landscape of the anti-kinase activity of the IDH1 inhibitors. Cancers. 2020;12(3):536. doi:10.3390/cancers12030536
33. Chu Y, Lee S, Shah T, et al. Ibrutinib significantly inhibited Bruton’s Tyrosine Kinase (BTK) phosphorylation, in-vitro proliferation and enhanced overall survival in a preclinical Burkitt Lymphoma (BL) model. Oncoimmunology. 2019;8(1):e1512455. doi:10.1080/2162402X.2018.1512455
34. Ge Y, Wang C, Song S, et al. identification of highly potent BTK and JAK3 dual inhibitors with improved activity for the treatment of B-cell lymphoma. Eur J Med Chem. 2018;143:1847–1857. doi:10.1016/j.ejmech.2017.10.080
35. Li J, Yuan J. Caspases in apoptosis and beyond. Oncogene. 2008;27(48):6194–6206. doi:10.1038/onc.2008.297
36. Bajpai UD, Zhang K, Teutsch M, Sen R, Wortis HH. Bruton’s tyrosine kinase links the B cell receptor to nuclear factor κB activation. J Exp Med. 2000;191(10):1735–1744. doi:10.1084/jem.191.10.1735
37. Pal Singh S, Dammeijer F, Hendriks RW. Role of bruton’s tyrosine kinase in B cells and malignancies. Mol Cancer. 2018;17(1):1–23. doi:10.1186/s12943-017-0753-1
38. Tomlinson MG, Woods DB, McMahon M, et al. A conditional form of bruton’s tyrosine kinase is sufficient to activate multiple downstream signaling pathways via PLC gamma 2 in B cells. BMC Immunol. 2001;2(1):1–12. doi:10.1186/1471-2172-2-4
39. Hendriks RW, Yuvaraj S, Kil LP. Targeting bruton’s tyrosine kinase in B cell malignancies. Nat Rev Cancer. 2014;14(4):219–232. doi:10.1038/nrc3702
40. Antony P, Petro JB, Carlesso G, et al. Directs the activation of NFAT and NF-κB via distinct molecular mechanisms. Exp Cell Res. 2003;291(1):11–24. doi:10.1016/S0014-4827(03)00338-0
41. Hayakawa K, Li Y-S, Shinton SA, et al. Crucial role of increased Arid3a at the pre-B and immature B cell stages for B1a cell generation. Front Immunol. 2019;10:457. doi:10.3389/fimmu.2019.00457
42. Moyo TK, Wilson CS, Moore DJ, Eischen CM, Enhances M. B-cell receptor signaling in precancerous B cells and confers resistance to Btk inhibition. Oncogene. 2017;36(32):4653–4661. doi:10.1038/onc.2017.95
 © 2023 The Author(s). This work is published and licensed by Dove Medical Press Limited. The
full terms of this license are available at https://www.dovepress.com/terms
and incorporate the Creative Commons Attribution
- Non Commercial (unported, 3.0) License.
By accessing the work you hereby accept the Terms. Non-commercial uses of the work are permitted
without any further permission from Dove Medical Press Limited, provided the work is properly
attributed. For permission for commercial use of this work, please see paragraphs 4.2 and 5 of our Terms.
© 2023 The Author(s). This work is published and licensed by Dove Medical Press Limited. The
full terms of this license are available at https://www.dovepress.com/terms
and incorporate the Creative Commons Attribution
- Non Commercial (unported, 3.0) License.
By accessing the work you hereby accept the Terms. Non-commercial uses of the work are permitted
without any further permission from Dove Medical Press Limited, provided the work is properly
attributed. For permission for commercial use of this work, please see paragraphs 4.2 and 5 of our Terms.