Back to Journals » OncoTargets and Therapy » Volume 7
ID2 predicts poor prognosis in breast cancer, especially in triple-negative breast cancer, and inhibits E-cadherin expression
Authors Li K, Yao L, Chen L, Cao Z, Yu S, Kuang X, Hu X, Shao Z
Received 25 March 2014
Accepted for publication 23 April 2014
Published 18 June 2014 Volume 2014:7 Pages 1083—1094
DOI https://doi.org/10.2147/OTT.S64759
Checked for plagiarism Yes
Review by Single anonymous peer review
Peer reviewer comments 3
Kai Li,1,2,* Ling Yao,1,* Li Chen,1,2 Zhi-Gang Cao,1,2 San-Jian Yu,1,2 Xia-Ying Kuang,1,2 Xin Hu,1 Zhi-Ming Shao1–3
1Department of Breast Surgery, Key Laboratory of Breast Cancer in Shanghai, Fudan University Shanghai Cancer Center, 2Department of Oncology, Shanghai Medical College, 3Institutes of Biomedical Science, Fudan University, Shanghai, People’s Republic of China
*These authors have contributed equally to this work
Background: Inhibitors of DNA-binding (ID) proteins are known as important modulators in the regulation of cell proliferation and differentiation. This study sought to investigate the prognostic value of ID proteins in breast cancer.
Methods: The prognostic role of ID proteins in human breast cancer was investigated in 250 breast cancers, via tissue microarrays. The messenger (m)RNA and protein levels of E-cadherin were examined by quantitative reverse-transcription polymerase chain reaction (qRT-PCR) and Western blotting, in cells overexpressing IDs. Dual-luciferase report assay was used to investigate the potential mechanism, and a migration assay was performed to investigate the influence of IDs on cell migratory activity.
Results: The survival analysis with Kaplan–Meier and Cox regression showed that ID2 expression level, which correlated with estrogen receptor status and E-cadherin abundance, served as an independent prognostic factor for disease-free survival (DFS) (P=0.013). The prognostic value of ID2 for DFS was most significant in triple-negative breast cancer patients (P=0.009). We also found that ID2 was negatively correlated with E-cadherin expression by correlation analysis (P=0.020, Pearson’s R=-0.155). Subsequently, we explored the biological rationale and uncovered that the enforced expression of ID proteins could suppress E-cadherin expression significantly, thus increasing the migration ability of mammary epithelial cells. Then using a combination of ID2 and E-cadherin expression, the patients were classified into four subgroups with different DFS (P=0.023).
Conclusion: The overexpression of ID2 can be used as a prognostic marker in breast cancer patients, especially in triple-negative breast cancer patients. ID proteins were still, unexpectedly, revealed to inhibit E-cadherin abundance.
Keywords: breast cancer, prognosis, biomarker
Background
Inhibitors of DNA-binding (ID) proteins belong to the family of basic Helix-Loop-Helix (bHLH) proteins, which contain the highly conserved HLH domain and regulate cell-specific gene expression. Most bHLH proteins can bind to the E-box element on DNA, except for the ID proteins, which have no DNA-binding domains. These proteins interact with bHLH transcription factors to form heterodimers via the common HLH domain and thus, act as dominant negative regulators of these transcription factors.1 The bHLH transcription factors have been reported to regulate a great number of genes by binding their DNA elements, termed E-boxes, in the promoter region of the target genes.2 Four members of the ID family have been identified, consisting of ID1, ID2, ID3, and ID4. Aberrant expression levels of the ID proteins have been reported in a variety of cancers, such as breast cancer, ovarian cancer, colon cancer, and rectal cancer,3 which indicates that ID proteins are involved in cancer progression. Studies have suggested that ID proteins act as crucial factors that regulate tumor progression and have shown they play a role in tissue invasion,4,5 tumor angiogenesis,6,7 cancer cell survival, and metastasis.8,9 ID proteins have also been found to be abundant in proliferating tissues, such as adult and embryonic stem cell populations.10 Here, these proteins have been shown to inhibit cell differentiation, implying that ID proteins could preserve cells in an immature state. Recently, ID proteins have been reported to be associated with the epithelial−mesenchymal transition (EMT) process.11,12 However, the predictive values of ID proteins for breast cancers, and their underlying molecular mechanisms, have not been elucidated.
E-cadherin has been referred to as a hallmark of the EMT process, which is a critical mechanism of tumor progression.13 The process of tumor invasion involves the loss of cell adhesion, the gain of cell mobility and migration, as well as active intravasation and extravasation through the lymphatic or blood vessels, especially in the case of epithelial tumors, such as breast cancer.13,14 Cell adhesion is mediated by several complexes in which the E-cadherin/catenin adhesion system plays a crucial part.15−19 Many studies have demonstrated that E-cadherin plays a key role in the maintenance of structural integrity and cell polarity20,21 and that the repression of E-cadherin could result in the loss of adherens junctions, lateral cell–cell contact, and apical–basolateral polarity.22,23 The loss of adherens junctions is generally followed by cytoskeletal rearrangements that result in increased cell motility, which is a prerequisite to invasiveness and metastasis.24,25
In this study, we examined the expression profiles of ID proteins (ID1, ID2, and ID3) in breast cancer tissues and unexpectedly found that ID2 protein expression was negatively correlated with E-cadherin abundance in breast cancers. We showed that ID2 might be a valuable predictive marker for survival in breast cancer patients. Additionally, our results provide further biological evidence that ID proteins can suppress E-cadherin expression and upregulate the migration ability in mammary epithelial cells, thus uncovering the underlying relevance between ID proteins and E-cadherin in breast cancers.
Methods
Study population
This study involved 250 breast cancer patients who had pathologically invasive ductal breast cancer and had a follow-up of at least 5 years. Their diagnoses were revalidated by at least two pathologists. The specimens from these patients were collected by the Department of Breast Surgery in Fudan University Shanghai Cancer Center, Shanghai, People’s Republic of China, from August 2001 to March 2006. This study was approved by the Ethics Committee of Fudan University Shanghai Cancer Center, and each participant signed an informed consent document.
Tissue microarrays (TMAs)
TMAs were constructed from archival formalin-fixed, paraffin wax-embedded samples of carcinomas obtained from the 250 breast cancer patients described above. Tissue cylinders, with a diameter of 2 mm, were punched from the previously marked tumor area of each block (donor block) and inserted into a recipient paraffin wax block, resulting in a 10×10 array. Tissue samples from all 250 patients were punched twice into the microarray to compare the staining patterns in different areas of the same tumor.
Immunohistochemistry experimental procedures
Immunohistochemistry for ID1, ID2, ID3, and E-cadherin was performed on the TMAs, using a two-step protocol (EnVision™ Detection Systems, Dako, Glostrup, Denmark). The TMAs were dewaxed with xylene, gradually hydrated with gradient ethanol, and washed with phosphate-buffered saline (PBS). Antigens were retrieved by boiling the TMAs in citrate buffer (pH 6.0) at 121°C for 15 minutes. Endogenous peroxidase was blocked by incubating the TMAs in 3% H2O2 solution. Then, the slides were washed in PBS for 10 minutes, blocked with 10% normal goat serum (CW0130; CWBIO, Beijing, People’s Republic of China) for 30 minutes at 37°C, and incubated with Anti-ID1 (ID1 RabMab®; Epitomics, Inc., Burlingame, CA, USA), anti-ID2 (ID2 [D39E8] Rabbit mAb; Cell Signaling Technology, Inc., Danvers, MA, USA), anti-ID3 (Abgent, San Diego, CA, USA), anti-E-cadherin (BD Biosciences Pharmingen, San Diego, CA, USA) at 4°C overnight. The antibody dilution was 1:200 for the ID antibodies and 1:400 for E-cadherin antibody. The immunoreactive products were visualized by the catalysis of 3, 3-diaminobenzidine by horseradish peroxidase (EnVision™ Detection Systems), following extensive washings. The TMAs were then counterstained with Gill hematoxylin (BA-5021, Zhuhai, People’s Republic of China) and dehydrated in ascending grades of ethanol, and finally, cleared in xylene and mounted under a coverslip.
Evaluation of immunohistochemistry analysis
Each preserved specimen was examined twice by two different examiners, and both examiners were blinded to the results. The specimens with discordant interpretations were reviewed until an agreement was reached. The positive expression of ID1, ID2, and ID3 was defined by nuclear staining, while the positive expression of E-cadherin was defined by staining in intercellular adherens junctions. The staining was classified semiquantitatively according to the staining index (SI) (range 0–9), which was calculated by multiplying the results of the intensity score (0= no staining; 1+= faint/equivocal; 2+= moderate; and 3+= strong) and the distribution score (0= no staining; 1+= staining of <10% of cells; 2+= staining of 10% to 50% of cells; and 3+= staining of >50% of cells).26 For this study, a moderate/strong nuclear staining (SI =3–9) was defined as positive staining, while a weak or negative staining (SI =0–2) was defined as negative staining.27,28 The staining information for estrogen receptor (ER), progesterone receptor, and HER-2 (human epidermal growth factor receptor 2) were obtained from the patients’ medical files.
Statistical analysis
Disease-free survival (DFS) was defined as the length of time from the date of surgery to any of the following: invasive breast cancer local recurrence, contralateral primary breast cancer, distant metastasis, or breast cancer-specific death. Local recurrence was confined to the ipsilateral breast, chest wall, and nodes, including ipsilateral axillary, supraclavicular, and internal mammary lymph nodes. Distant metastases comprised distant lymph nodes, bone, or visceral organs, including lung, liver, brain, and other organs.29
The correlations between the clinicopathological parameters and expression of ID proteins were tested using the chi-square test. Survival outcomes were estimated using the Kaplan−Meier method. Univariate and multivariate Cox proportional hazards models were used to determine the associations between the clinicopathological parameters and the survival outcomes. The multivariate Cox regression model was used to calculate the hazard ratios (HRs) and 95% confidence intervals (CIs), with adjustments for known prognostic variables, such as tumor size, histologic grade, lymph node status, and other significant variables in the univariate analysis. The statistical analysis was carried out using SPSS for Windows (Version 17.0; SPSS Inc., Chicago, IL, USA). All analyses were based on the observed data, with the assumption that missing data occurred completely randomly.
Cell culture
The cell lines used in this study (MCF10A, ZR-75-1, ZR-75-30, T47D, Bcap37, BT549, and MCF-7) were obtained from the Shanghai Cell Bank, Type Culture Collection Committee (Shanghai Institute of Cell Biology, Chinese Academy of Sciences, Shanghai, People’s Republic of China) and maintained in complete growth medium as recommended by the distributor. All cells were cultured in a 5% CO2 incubator at 37°C.
Western blot analysis
Whole cell lysates were generated using Pierce T-PER® Tissue Protein Extraction Reagent (Thermo Fisher Scientific Inc., Waltham, MA, USA) with complete EDTA (ethylenediaminetetraacetic acid)-free Protease Inhibitor Cocktail Tablets (F Hoffman-La Roche Ltd, Basel, Switzerland). Immunoblotting was done, essentially as described.30 The primary antibodies used were as follows: Anti-ID1 (ID1 RabMab®; Epitomics, Inc., Burlingame, CA, USA), anti-ID2 (ID2 [D39E8] Rabbit mAb; Cell Signaling Technology, Inc., Danvers, MA, USA), anti-ID3 (Abgent, San Diego, CA, USA), anti-E-cadherin (BD, Biosciences Pharmingen, San Diego, CA, USA), and anti–glyceraldehyde 3-phosphate dehydrogenase (GAPDH) (GAPDH [6C5] mAb; Bioworld Technology, Inc., Minneapolis, MN, USA). The quality of loading and transferring was assessed by immunostaining with the GAPDH antibody. The dilutions for the antibodies were as follows: 1:1000 for ID1, 1:2000 for ID2, 1:1000 for ID3, 1:1000 for E-cadherin, and 1:2000 for GAPDH.
Plasmid constructs
The human full-length coding sequences of ID1, ID2, and ID3 were cloned using a standard reverse-transcription polymerase chain reaction (RT-PCR) protocol (Takara Bio Company, Dalian, Japan).31 Retroviral expression constructs for hemagglutinin epitope (HA)- and Flag-tagged ID1, ID2, and ID3 were generated with pDEST-MSCV via the Gateway recombination system,32 using murine stem cell virus (MSCV) vectors as described in a previous study.32 The plasmid construct for the E-cadherin promoter fragment (−1333 to +47) was generated with pGL3-Basic Vector (Promega Corp, Madison, WI, USA). This constructed plasmid was subsequently used for the Dual-Luciferase® Reporter Assay (Promega Corp).
Immunofluorescence
MCF10A cell lines that stably expressed with the ID1, ID2, and ID3 proteins were stained with antibodies against E-cadherin. The cells were fixed with 4% paraformaldehyde at room temperature (RT) for 30 minutes. The cells were then permeabilized with 0.2% Triton™ X-100 (Sangon Biotech, Shanghai, China), on ice, for 5 minutes and blocked with PBS with 1% bovine serum albumin (BSA; Sigma, CA, USA) at RT for 1 hour. The cells were then incubated with the E-cadherin antibody diluted to 1:200 at RT for 2 hours, and then with Alexa Fluor® 488 F(ab’)2 Fragment of Goat Anti-Mouse immunoglobulin (Ig)G (H + L) secondary antibody (Life Technologies Corp, Carlsbad, CA, USA) the next day for 45 minutes at room temperature. The samples were protected from light during both antibody incubation periods. Finally, 4′,6-diamidino-2-phenylindole (DAPI) (Life Technologies Corp) was added to the slides, and they were observed under a fluorescent microscope.
Dual-luciferase reporter assay
293T cells (8×10³ per well) were seeded in a 96-well plate the day before transfection and were transfected with HA and Flag-tagged ID1, ID2, ID3 or control pDEST vectors (200 ng/well), Renilla Luciferase Control Vector (pRL-TK; Promega Corp) (20 ng/well), and pGL3-Basic Vector containing E-cadherin promoter region (200 ng/well). After 48 hours of transfection, the ratio of Renilla to firefly luciferase was determined using the dual-luciferase reporter assay system.
Migration assay
For the migration assays, transwell inserts with an 8 μm pore size were placed in 24-well plates with 500 μL MCF10A culture medium with added fetal calf serum. Then, the MCF10A cells stably expressing HA and Flag-tagged ID1, ID2, and ID3 were diluted to 5×10⁵ cells/mL with MCF10A culture medium without serum. A total of 200 μL of cell suspension was added to the plates, and the cells were cultured in a 5% CO2 incubator at 37°C for 13 hours. Then, the cells were fixed with methanol for 20 minutes, and 500 μL 0.1% crystal violet (Sangon Biotech) was added to each well. The samples were then incubated for 30 minutes. Five high-resolution fields of each chamber were randomly selected, and the number of cells was counted using an inverted microscope (Leica, Wetzlar, Germany).
Real-time polymerase chain reaction (PCR)
Total RNA was extracted using TRIzol® reagent (Life Technologies Corp). Reverse-transcribed complementary DNA was synthesized with the One-step RT-PCR Master Mix RT-PCR Quick Master Mix (Toyobo Co, Ltd, Osaka, Japan). Real-time PCR was performed with a SYBR Green® Realtime PCR Master Mix-Plus kit (Toyobo Co, Ltd). The real-time PCR was performed using ABI Prism® 7500 Sequence Detection System (Life Technologies Corp). The primers were selected from the primer bank (Table S1). All primers used were synthesized by Life Technologies Corp. The total volume of the real-time PCR was 50 μL, containing 5 μL of complementary (c)DNA, 25 uL SYBR® Green Realtime PCR Master Mix-Plus-, 5 uL plus solution, and 4 uL primer mix, while the total volume of 50 μL was achieved by addition of distilled water. The cycling conditions were set as follows: an initial denaturation at 95°C for 60 seconds, 40 cycles at 95°C for 15 seconds, 60°C for 60 seconds, and the melting curve.
Results
Immunohistochemistry detection of ID proteins in breast cancer
To achieve the expression profiles of ID proteins (ID1, ID2, and ID3) in breast cancers, we first evaluated their expressions using immunohistochemical analyses, via TMAs containing specimens from 250 breast cancer patients with a follow-up of at least 5 years. These patients were diagnosed with invasive ductal breast cancer, which was revalidated by at least two pathologists. Positive staining for the ID proteins was observed mainly in the nuclei of the breast cancer cells (Figure 1A).
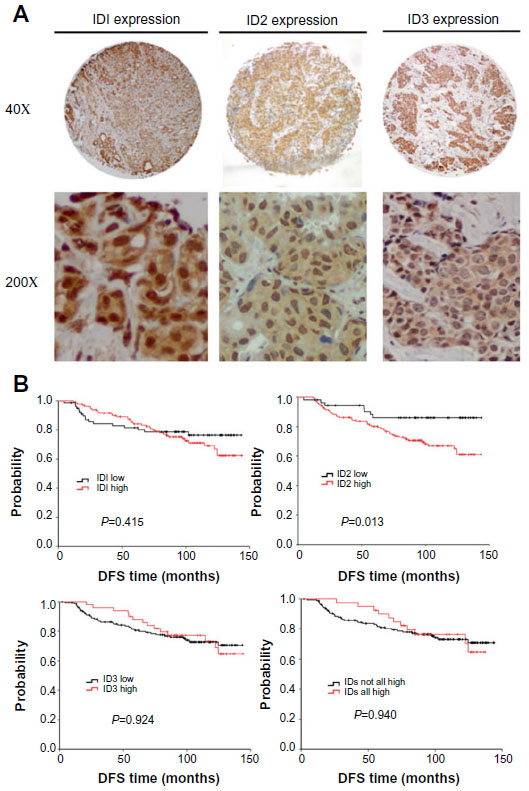 | Figure 1 The expression profiles of ID proteins were determined in breast tumors via immunohistochemistry. (A) Representative photomicrographs of positive immunohistochemical staining for ID1, ID2, and ID3 proteins in breast cancer tissues are illustrated (magnification, 40× and 200×). (B) Kaplan−Meier estimates illustrating DFS, by expression level, for ID1, ID2, ID3 and breast cancer–positive for all ID proteins (including 1, 2, and 3). |
Patient characteristics and ID expression
Among all the clinical characteristics, we found that both ID2 and ID3 were significantly correlated with ER status (P=0.016 and P=0.006, respectively) (Table 1).
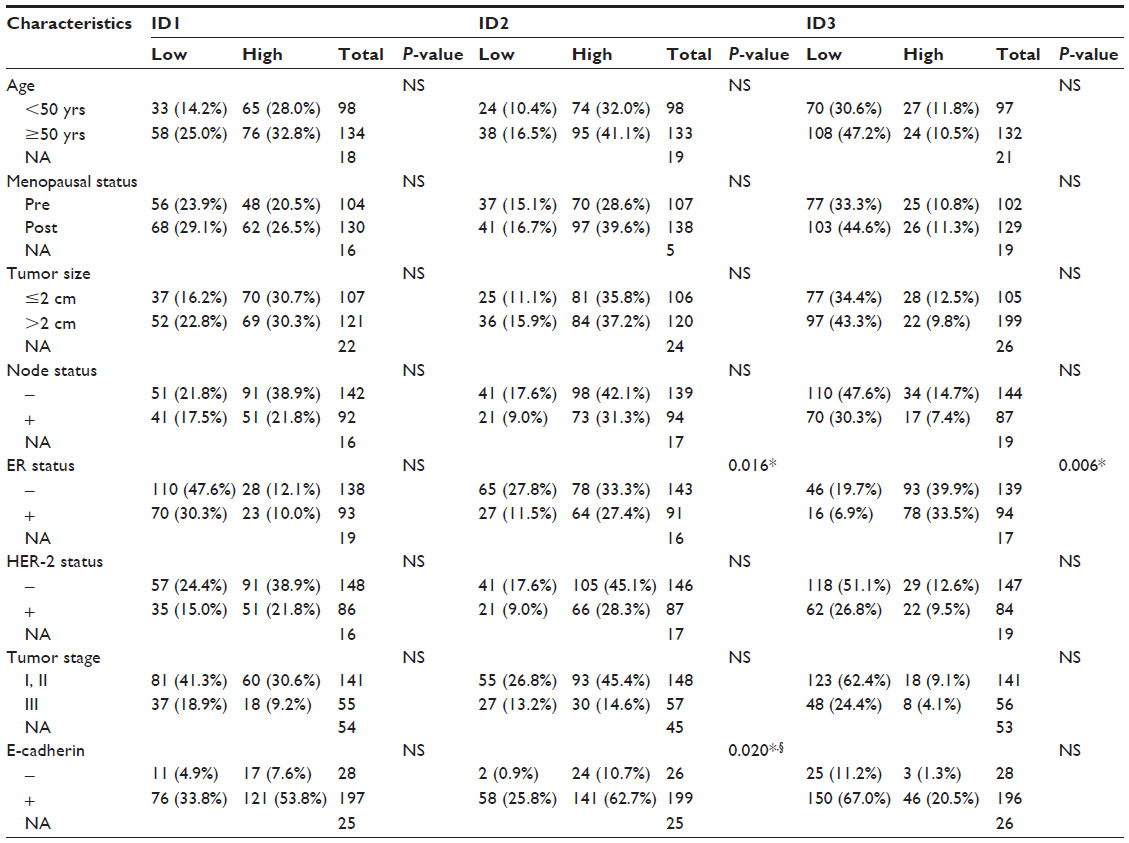 | Table 1 Correlation of ID protein expression with clinicopathologic features and E-cadherin expression in breast cancer patients |
The E-cadherin expression was also, unexpectedly, found to be negatively correlated with ID2 expression (P=0.020, Pearson’s R=−0.155) (Table 1). E-cadherin is a single-pass transmembrane glycoprotein that mediates homophilic cell–cell interactions.33 The loss of E-cadherin can lead to the transition to a more motile and invasive phenotype.34 The expression of ID2 and E-cadherin in serial sections of the same specimen is illustrated in Figure S1.
ID2 was identified as a significant prognostic factor in breast cancer patients, especially in triple-negative breast cancers
When we applied survival analysis for DFS by Kaplan−Meier analysis, we found ID2 predicted poor prognosis (P=0.013), while ID1 and ID3 did not (P=0.415 and P=0.924, respectively). Then we analyzed the survival of breast cancers which were positive for all ID proteins (including 1, 2, and 3) and found that there was no significance (P=0.940) (Figure 1B). In the univariate analysis using the Cox regression model, the lymph node status and ID2 expression level were significantly associated with the DFS. All significant factors were included in the multivariate model. Both the lymph node status and ID2 expression level were shown to be independent predictors for DFS (HR =3.151; 95% CI: 1.820−5.456, P<0.001; and HR =2.358; 95% CI: 1.065−5.218, P=0.034, respectively) (Table 2). Given their biologic relevance, we included the ER status, HER-2 status, and E-cadherin expression in the Cox model, although these factors were not statistically associated with DFS in the univariate analysis. The inclusion of these parameters did not change the association between the two prognostic factors and survival.
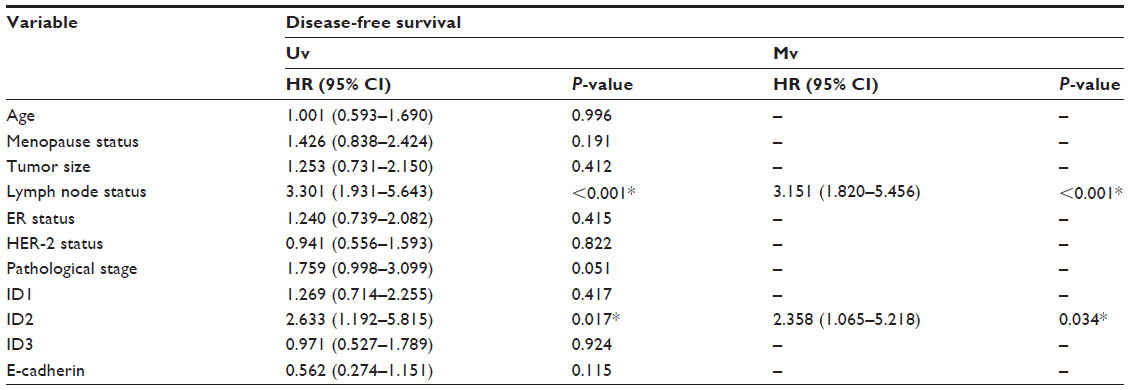 | Table 2 Univariate and multivariate survival analysis of ID2 expression in E-cadherin-negative breast cancers |
We also analyzed the relationship between ID2 expression and survival according to the different breast cancer subtypes (according to 2011 St Gallen consensus) (Figure 2A–D).35 Among the four subtypes, the prognostic value of ID2 was most significant, among patients with TNBC, for DFS (P=0.009).
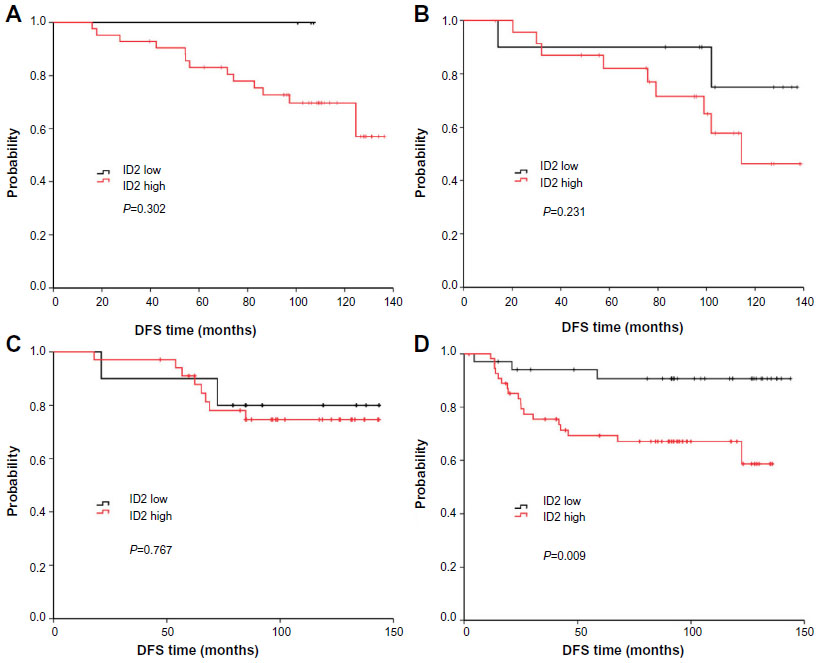 | Figure 2 DFS curves of high or low ID2 expression according to breast cancer subtypes: luminal-A (A), luminal-B (B), HER-2+ (C), and triple-negative (D). The prognostic value of ID2 was most significant for DFS, among patients with TNBC, (P=0.009). |
The enforced expression of ID proteins reduces the expression of E-cadherin in mammary epithelial cells
As ID2 was analyzed to be negatively correlated with E-cadherin expression in breast cancer tissues, we further explored the internal relevance between the ID proteins and E-cadherin in breast cancers. We assessed the expression levels of ID1, ID2, and ID3 in nine common mammary cell lines, at both the transcription level and translational level (Figure S2A and S2B), to obtain a comprehensive overview of their expression profiles. The results showed that ID2 exhibited a low expression level in MCF10A, which was a benign breast cell line, and high levels in a few malignant breast cell lines.
As we found that the expression of ID2 was negatively correlated with E-cadherin expression in breast tumor tissues, we further explored whether ID proteins could regulate the expression of E-cadherin. As shown in Figure 3A, we successfully constructed the ID1, ID2, and ID3 overexpression stable cell lines in the MCF10A cells. Interestingly, the ectopic expression of ID1, ID2, and ID3 markedly suppressed the expression of E-cadherin, compared with the control stable cell line, at both the transcriptional (Figure 3B) and translational level (Figure 3C).
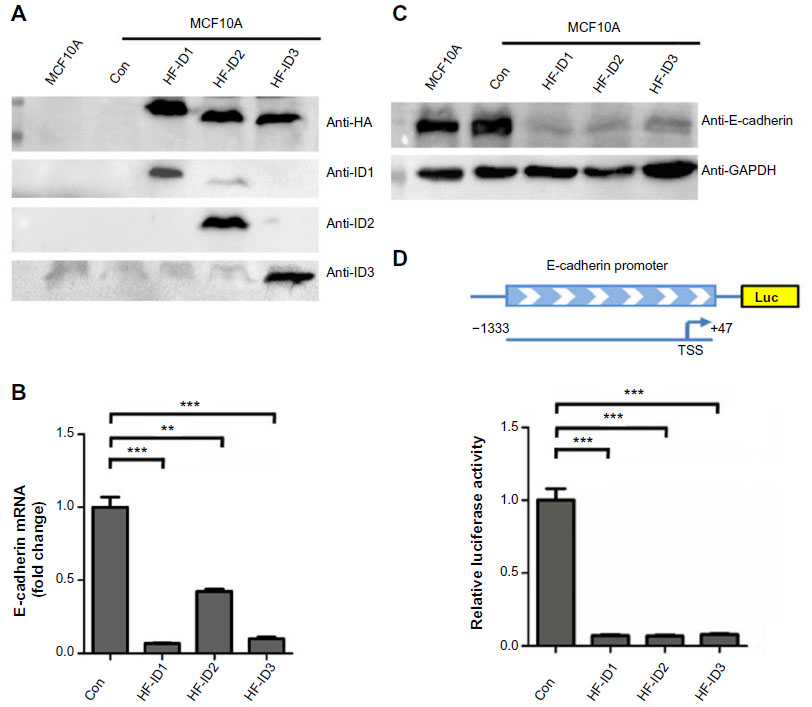 | Figure 3 ID proteins inhibit E-cadherin expression in breast cells. |
ID proteins are known as negative regulators of bHLH transcription factors, which means they may exert inhibitory influence on promoters of target genes. Based on the newly identified negative correlation between ID proteins and E-cadherin in our above analysis, we hypothesized that ID proteins might affect the promoter activity of E-cadherin.
We cloned the promoter region sequence of E-cadherin (−1333 to +47) into a luciferase reporter plasmid and performed a dual-luciferase assay (Figure 3D). The results suggested that the ID proteins (ID1, ID2, and ID3) could inhibit the expression of E-cadherin via indirect repression of the promoter activity of E-cadherin.
The overexpression of IDs increased the migratory ability of mammary epithelial cells
The repression of E-cadherin can result in the loss of adherens junctions, lateral cell−cell contact, and cytoskeletal rearrangements, resulting in increased cell motility. In this study, we observed significant phenotypic changes in MCF10A cells with exogenous ID proteins. Specifically, the cells were more spindle-like and less inclined to cluster (Figure 4A). We further examined the abundance of E-cadherin in these stable cell lines by immunofluorescence. As illustrated in Figure 4A, compared with the controls, the overexpression of ID proteins abolished E-cadherin staining at the intercellular adherens junctions.
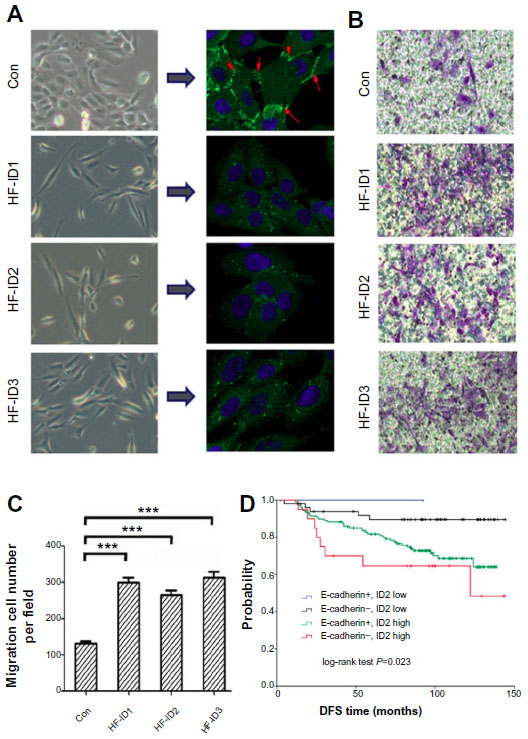 | Figure 4 The overexpression of ID proteins increases the migration ability of mammary epithelial cells. |
Next, we carried out a migration assay to investigate the consequences of this change on the migratory ability of mammary epithelial cells. An increased migration was observed in the stable cell lines with exogenous ID proteins (Figure 4B and C).
Combination of ID2 and E-cadherin expression predicted risk of breast cancer patients
As we investigated that ID2 inhibited E-cadherin expression, we combined the expression of ID2 and E-cadherin. Then all patients were classified into four subgroups: E-cadherin-positive/ID2 low expression (n=58); E-cadherin-negative/ID2 low expression (n=2); E-cadherin-positive/ID2 high expression (n=134); and E-cadherin-negative/ID2 high expression (n=22). The DFS curves of these four groups are shown in Figure 4D (P=0.023). Patients with E-cadherin-positive and low ID2 expression had a low risk of relapse, with a DFS of 91.4%, whereas the DFS for patients with E-cadherin-negative and high ID2 expression was 68.2%.
Discussion
ID proteins are bHLH proteins that lack a basic DNA-binding region, while E proteins are bHLH transcription factors that contain this basic DNA-binding domain.35 E proteins have been reported to function by forming homodimers or heterodimers with class 2 basic HLH (bHLH) proteins, including ID proteins, where the former function as transcription activators, while the latter act as transcription activators or repressors.36
It is well known that epithelial cell polarity, which is also called “asymmetry”, is necessary for tissue function and when altered, can promote malignant progression of cancer cells.15,37 Repeated studies have reported that E-cadherin played an important role in the establishment of epithelial cell polarity38,39 and that its loss would cause losses in adhesions and cell polarity, which could result in increased mobility, invasiveness, and migration. Studies also reported that loss of or low level of E-cadherin was associated with poor prognosis in breast cancer.40,41 Here, we examined the E-cadherin expression profile in normal and malignant breast tissues and confirmed that it exhibited a lower expression level in malignant than in normal breast tissues (Figure S3).
A previous study has reported that patients with strong or moderate ID1 expression had a significant shorter OS (P=0.003, Cox regression) and DFS (P=0.01, Cox regression) compared to those with absent or low ID1 expression. The authors concluded that ID1 was a predictor of poor prognosis in node-negative breast cancer.42 However, in our cohort, we found that ID1 expression was slightly decreased in breast tumors and did not serve as a prognostic factor in the DFS analysis. Interestingly, ID2 protein was significantly upregulated in breast cancer tissues and found to be a significant prognostic factor for poor outcome in breast cancer patients (P=0.013). Moreover, ID proteins were revealed to be negatively correlated with the abundance of E-cadherin. Also, the multivariate Cox regression analysis supported that ID2 was an independent, significant prognostic factor for poor prognosis in breast cancer patients (P=0.034).
As was shown in our results, we analyzed the DFS in different breast cancer subtypes. ID2 was found to be most significant, among patients with TNBC, for DFS (P=0.009). TNBC is the collection of tumors that lack ER, progesterone receptor, and HER-2 expression, which occupy 15%–20% of all breast cancers. TNBC is generally more aggressive, has higher rates of relapse, and decreased overall survival in metastatic disease.43 However, there are rare biomarkers reported to be predictive for TNBC prognosis. Our findings indicate that ID2 is a prognostic biomarker for TNBC.
Cell polarity is well known to be important for the normal function of epithelial cells. The establishment of cell polarity is a complicated process in which the recruitment of E-cadherin to the cell cortex plays a crucial role.38,39 Studies have reported that loss of E-cadherin could interfere with the establishment of cell polarity, which has been report to be associated with loss of the polarized characteristics, hyperproliferation, and enhanced migratory activity.44−46 Here, we demonstrated that ID proteins could cause the loss of E-cadherin ID proteins in breast epithelial cells. Our migration assay also showed an evident increase in migration activity in the stable cell lines with exogenous ID proteins (P<0.05). Thus, ID2 may affect cell polarity, inducing loss of the polarized characteristics and enhancement of migration, by abolishing E-cadherin expression.
As far as the precise mechanism by which ID proteins regulate E-cadherin expression is concerned, we postulated that ID proteins may regulate E-cadherin by suppressing its promoter activity. Bioinformatics analysis showed that there were a few E-box elements located in the E-cadherin promoter region. The results of dual-luciferase reporter assay confirmed our hypothesis that ID proteins could suppress the promoter activity of E-cadherin. Considering that ID proteins can bind to bHLH transcription factors to form heterodimers and function as dominant negative regulators of these transcription factors, these ID-targeted bHLH transcription factors are still to be fully elucidated. Then, we combined the expression of ID2 and E-cadherin to carry out a survival analysis for DFS. This survival analysis was significant among the four subgroups (P=0.023). The risk for the subgroup of E-cadherin-negative and high ID2 expression was much higher than that for E-cadherin-positive and low ID2 expression.
In our study, we noticed that ID1, ID2, and ID3 could all reduce E-cadherin abundance in stable cell lines, while only ID2 was proved to be inversely correlated with E-cadherin in breast cancer specimens. We can take it into consideration that only the expression of ID2 was upregulated in the breast tumors, in comparison with ID1 and ID3. It will be interesting to further explore the underlying molecular mechanisms that result in ID2 overexpression in breast cancer.
Conclusion
Our study provided both clinical and mechanistic evidence uncovering a negative correlation between the expression of ID2 protein and E-cadherin abundance. Notably, ID proteins proved to be a significant prognostic factor for poor prognosis in breast cancer patients, especially in TNBC patients. In addition, ID proteins suppressed E-cadherin expression significantly, thus increasing the migration ability of mammary epithelial cells and influencing ID2’s prognostic value in combination with E-cadherin expression. In this regard, we postulate that ID2 protein could be a new promising biomarker of poor prognosis for patients with breast cancer.
Acknowledgments
The study was supported by grants from the National Natural Science Foundation of China (grant numbers 81201531 and 81202079), the Shanghai Committee of Science and Technology Funds (grant numbers 12ZR1406200, 12DZ2260100, 12410707700, and 12140901502), and the Shanghai Committee of Science and Technology Fund for 2013 Qimingxing Project (grant number 11QA1401400, to XHu). The funders had no role in study design, data collection and analysis, the decision to publish, or preparation of the manuscript.
Disclosure
The authors report no conflict of interest in this work.
References
Benezra R, Davis RL, Lockshon D, Turner DL, Weintraub H. The protein Id: a negative regulator of helix-loop-helix DNA binding proteins. Cell. 1990;61(1):49–59. | |
Massari ME, Murre C. Helix-loop-helix proteins: regulators of transcription in eucaryotic organisms. Mol Cell Biol. 2000;20(2):429–440. | |
Fong S, Debs RJ, Desprez PY. Id genes and proteins as promising targets in cancer therapy. Trends Mol Med. 2004;10(8):387–392. | |
Desprez PY, Sumida T, Coppé JP. Helix-loop-helix proteins in mammary gland development and breast cancer. J Mammary Gland Biol Neoplasia. 2003;8(2):225–239. | |
Sumida T, Itahana Y, Hamakawa H, Desprez PY. Reduction of human metastatic breast cancer cell aggressiveness on introduction of either form a or B of the progesterone receptor and then treatment with progestins. Cancer Res. 2004;64(21):7886–7892. | |
Ling MT, Lau TC, Zhou C, et al. Overexpression of Id-1 in prostate cancer cells promotes angiogenesis through the activation of vascular endothelial growth factor (VEGF). Carcinogenesis. 2005;26(10):1668–1676. | |
Volpert OV, Pili R, Sikder HA, et al. Id1 regulates angiogenesis through transcriptional repression of thrombospondin-1. Cancer Cell. 2002;2(6):473−483. | |
Fong S, Itahana Y, Sumida T, et al. Id-1 as a molecular target in therapy for breast cancer cell invasion and metastasis. Proc Natl Acad Sci U S A. 2003;100(23):13543–13548. | |
Ling MT, Wang X, Ouyang XS, Xu K, Tsao SW, Wong YC. Id-1 expression promotes cell survival through activation of NF-kappaB signalling pathway in prostate cancer cells. Oncogene. 2003;22(29):4498–4508. | |
Yokota Y, Mori S. Role of Id family proteins in growth control. J Cell Physiol. 2002;190(1):21–28. | |
Gervasi M, Bianchi-Smiraglia A, Cummings M, et al. JunB contributes to Id2 repression and the epithelial-mesenchymal transition in response to transforming growth factor-². J Cell Biol. 2012;196(5):589–603. | |
Tobin NP, Sims AH, Lundgren KL, Lehn S, Landberg G. Cyclin D1, Id1 and EMT in breast cancer. BMC Cancer. 2011;11:417. | |
Behrens J, Frixen U, Schipper J, Weidner M, Birchmeier W. Cell adhesion in invasion and metastasis. Semin Cell Biol. 1992;3(3):169−178. | |
Stetler-Stevenson WG, Aznavoorian S, Liotta LA. Tumor cell interactions with the extracellular matrix during invasion and metastasis. Annu Rev Cell Biol. 1993;9:541−573. | |
Martin-Belmonte F, Perez-Moreno M. Epithelial cell polarity, stem cells and cancer. Nat Rev Cancer. 2012;12(1):23−38. | |
Larue L, Ohsugi M, Hirchenhain J, Kemler R. E-cadherin null mutant embryos fail to form a trophectoderm epithelium. Proc Natl Acad Sci U S A. 1994;91(17):8263–8267. | |
Takeichi M. Morphogenetic roles of classic cadherins. Curr Opin Cell Biol. 1995;7(5):619–627. | |
Gumbiner BM. Cell adhesion: the molecular basis of tissue architecture and morphogenesis. Cell. 1996;84(3):345–357. | |
Huber O, Bierkamp C, Kemler R. Cadherins and catenins in development. Curr Opin Cell Biol. 1996;8(5):685−691. | |
Horster MF, Braun GS, Huber SM. Embryonic renal epithelia: induction, nephrogenesis, and cell differentiation. Physiol Rev. 1999;79(4):1157–1191. | |
Huber MA, Kraut N, Beug H. Molecular requirements for epithelial-mesenchymal transition during tumor progression. Curr Opin Cell Biol. 2005;17(5):548–558. | |
Thiery JP. Epithelial-mesenchymal transitions in tumour progression. Nat Rev Cancer. 2002;2(6):442−454. | |
Thiery JP, Sleeman JP. Complex networks orchestrate epithelial-mesenchymal transitions. Nat Rev Mol Cell Biol. 2006;7(2):131–142. | |
Bhowmick NA, Ghiassi M, Bakin A, et al. Transforming growth factor-beta1 mediates epithelial to mesenchymal transdifferentiation through a RhoA-dependent mechanism. Mol Biol Cell. 2001;12(1):27–36. | |
Maeda M, Johnson KR, Wheelock MJ. Cadherin switching: essential for behavioral but not morphological changes during an epithelium-to-mesenchyme transition. J Cell Sci. 2005;118(Pt 5):873–887. | |
Wang L, Xiao X, Li D, et al. Abnormal expression of GADD45B in human colorectal carcinoma. J Transl Med. 2012;10:215. | |
Lin B, Utleg AG, Gravdal K, et al. WDR19 expression is increased in prostate cancer compared with normal cells, but low-intensity expression in cancers is associated with shorter time to biochemical failures and local recurrence. Clin Cancer Res. 2008;14(5):1397–1406. | |
Halvorsen OJ, Rostad K, Øyan AM, et al. Increased expression of SIM2-s protein is a novel marker of aggressive prostate cancer. Clin Cancer Res. 2007;13(3):892–897. | |
Metzger-Filho O, Sun Z, Viale G, et al. Patterns of recurrence and outcome according to breast cancer subtypes in lymph node-negative disease: results from international breast cancer study group trials VIII and IX. J Clin Oncol. 2013;31(25):3083–3090. | |
Hu X, Kim JA, Castillo A, Huang M, Liu J, Wang B. NBA1/MERIT40 and BRE interaction is required for the integrity of two distinct deubiquitinating enzyme BRCC36-containing complexes. J Biol Chem. 2011;286(13):11734–11745. | |
Li Y, Wen X, Spataro BC, Hu K, Dai C, Liu Y. hepatocyte growth factor is a downstream effector that mediates the antifibrotic action of peroxisome proliferator-activated receptor-gamma agonists. J Am Soc Nephrol. 2006;17(1):54–65. | |
Hu X, Paul A, Wang B. Rap80 protein recruitment to DNA double-strand breaks requires binding to both small ubiquitin-like modifier (SUMO) and ubiquitin conjugates. J Biol Chem. 2012;287(30):25510–25519. | |
van Roy F, Berx G. The cell-cell adhesion molecule E-cadherin. Cell Mol Life Sci. 2008;65(23):3756−3788. | |
Canel M, Serrels A, Frame MC, Brunton VG. E-cadherin-integrin crosstalk in cancer invasion and metastasis. J Cell Sci. 2013;126(Pt 2):393–401. | |
Gnant M, Harbeck N, Thomssen C. St. Gallen 2011: Summary of the Consensus Discussion. Breast care. 2011;6(2):136–141. | |
Kee BL. E and ID proteins branch out. Nat Rev Immunol. 2009;9(3):175−184. | |
Engel I, Murre C. The function of E- and Id proteins in lymphocyte development. Nat Rev Immunol. 2001;1(3):193–199. | |
St Johnston D, Ahringer J. Cell polarity in eggs and epithelia: parallels and diversity. Cell. 2010;141(5):757–774. | |
Vasioukhin V, Bauer C, Yin M, Fuchs E. Directed actin polymerization is the driving force for epithelial cell-cell adhesion. Cell. 2000;100(2):209–219. | |
Adams CL, Chen YT, Smith SJ, Nelson WJ. Mechanisms of epithelial cell-cell adhesion and cell compaction revealed by high-resolution tracking of E-cadherin-green fluorescent protein. J Cell Biol. 1998;142(4):1105–1119. | |
Brzozowska A, Sodolski T, Duma D, Mazurkiewicz T, Mazurkiewicz M. Evaluation of prognostic parameters of E-cadherin status in breast cancer treatment. Ann Agric Environ Med. 2012;19(3):541–546. | |
Liu T, Zhang X, Shang M, et al. Dysregulated expression of Slug, vimentin, and E-cadherin correlates with poor clinical outcome in patients with basal-like breast cancer. J Surg Oncol. 2013;107(2):188–194. | |
Schoppmann SF, Schindl M, Bayer G, et al. Overexpression of Id-1 is associated with poor clinical outcome in node negative breast cancer. Int J Cancer. 2003;104(6):677–682. | |
Bastien RR, Rodríguez-Lescure Á, Ebbert MT, et al. PAM50 breast cancer subtyping by RT-qPCR and concordance with standard clinical molecular markers. BMC Med Genomics. 2012;5:44. | |
Lee M, Vasioukhin V. Cell polarity and cancer – cell and tissue polarity as a non-canonical tumor suppressor. J Cell Sci. 2008;121(Pt 8):1141–1150. | |
Tanos B, Rodriguez-Boulan E. The epithelial polarity program: machineries involved and their hijacking by cancer. Oncogene. 2008;27(55):6939–6957. | |
Coradini D, Casarsa C, Oriana S. Epithelial cell polarity and tumorigenesis: new perspectives for cancer detection and treatment. Acta Pharmacol Sin. 2011;32(5):552–564. |
Supplementary materials
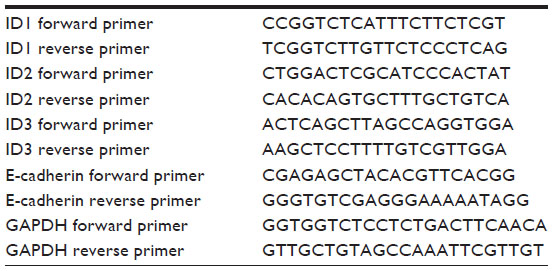 | Table S1 Real-time PCR primers |
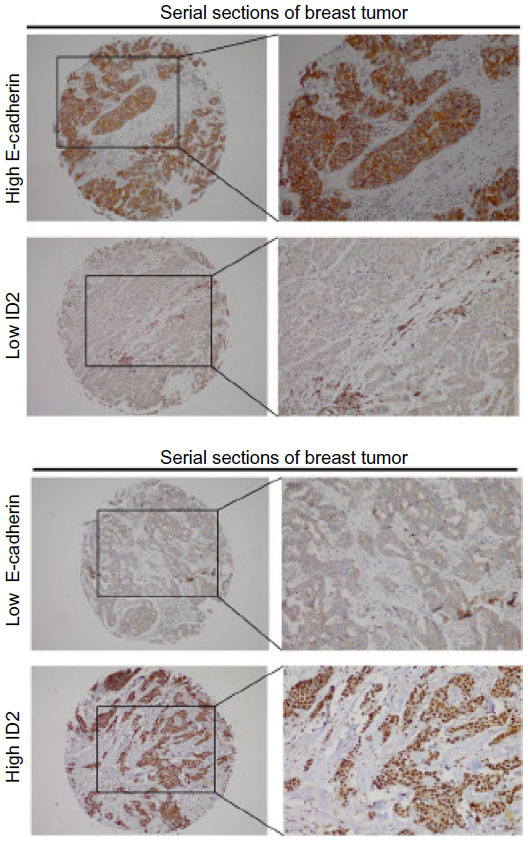 | Figure S1 Representative images of breast cancer tissues showing inverse expression patterns of E-cadherin and ID2. Serial sections of the same samples of breast tissues are illustrated. |
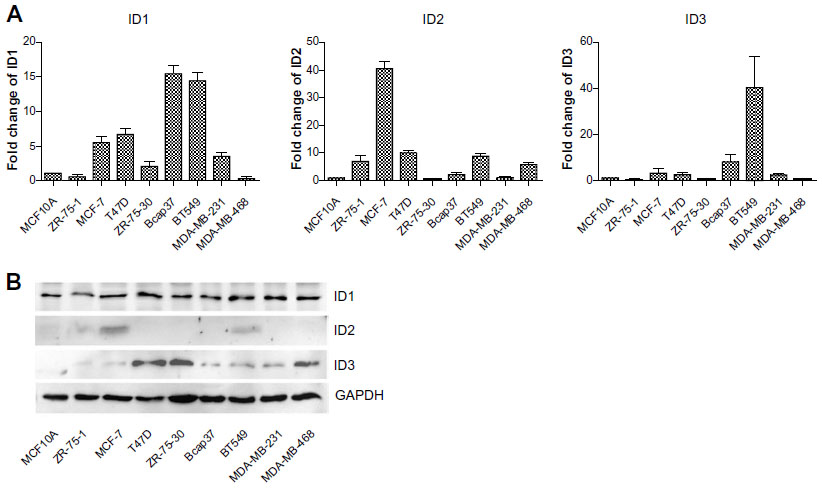 | Figure S2 The expression profile of ID in breast cell lines examined by (A) real-time PCR and (B) western blot. |
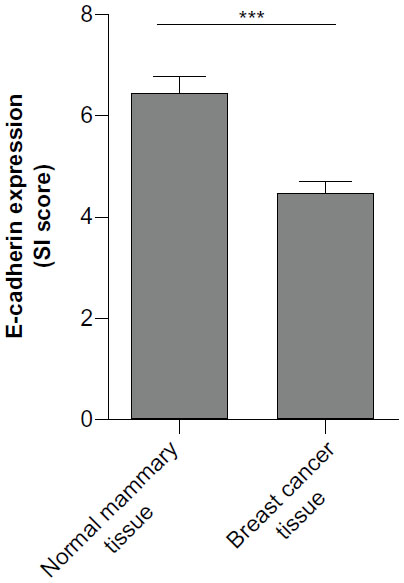 | Figure S3 The expression profile of E-cadherin in breast tissues. |
 © 2014 The Author(s). This work is published and licensed by Dove Medical Press Limited. The
full terms of this license are available at https://www.dovepress.com/terms
and incorporate the Creative Commons Attribution
- Non Commercial (unported, 3.0) License.
By accessing the work you hereby accept the Terms. Non-commercial uses of the work are permitted
without any further permission from Dove Medical Press Limited, provided the work is properly
attributed. For permission for commercial use of this work, please see paragraphs 4.2 and 5 of our Terms.
© 2014 The Author(s). This work is published and licensed by Dove Medical Press Limited. The
full terms of this license are available at https://www.dovepress.com/terms
and incorporate the Creative Commons Attribution
- Non Commercial (unported, 3.0) License.
By accessing the work you hereby accept the Terms. Non-commercial uses of the work are permitted
without any further permission from Dove Medical Press Limited, provided the work is properly
attributed. For permission for commercial use of this work, please see paragraphs 4.2 and 5 of our Terms.