Back to Journals » Journal of Inflammation Research » Volume 16
ICOS/ICOSLG and PD-1 Co-Expression is Associated with the Progression of Colorectal Precancerous- Carcinoma Immune Microenvironment
Authors Zhang Y, Wang XL, Liu JJ, Qian ZY, Pan ZY, Song NP, Chen HY ![]() , Zhang W, Zhang X
, Zhang W, Zhang X
Received 20 December 2022
Accepted for publication 25 February 2023
Published 7 March 2023 Volume 2023:16 Pages 977—992
DOI https://doi.org/10.2147/JIR.S401123
Checked for plagiarism Yes
Review by Single anonymous peer review
Peer reviewer comments 2
Editor who approved publication: Professor Ning Quan
Yu Zhang,1,* Xue-Li Wang,2,* Jing-Jing Liu,3 Zhen-Yuan Qian,4 Zheng-Yang Pan,5 Ni-Ping Song,5 Hui-Yan Chen,6 Wei Zhang,7 Xin Zhang8
1Cancer Center, Department of Gastroenterology, Zhejiang Provincial People’s Hospital (Affiliated People’s Hospital, Hangzhou Medical College), Hangzhou, Zhejiang, People’s Republic of China; 2College of Pharmaceutical Science, Zhejiang University of Technology, Hangzhou, Zhejiang, People’s Republic of China; 3Bengbu Medical College, Bengbu, Anhui, People’s Republic of China; 4General Surgery, Cancer Center, Department of Gastrointestinal and Pancreatic Surgery, Zhejiang Provincial People’s Hospital (Affiliated People’s Hospital, Hangzhou Medical College), Hangzhou, Zhejiang, People’s Republic of China; 5The Second Clinical Medical College, Zhejiang Chinese Medical University, Hangzhou, Zhejiang, People’s Republic of China; 6Clinical Laboratory, Tongxiang First People’s Hospital, Tongxiang, Zhejiang, People’s Republic of China; 7Department of Gastrointestinal Surgery, The Second Affiliated Hospital of Zhejiang Chinese Medical University, Hangzhou, Zhejiang, People’s Republic of China; 8Cancer Center, Department of Pathology, Zhejiang Provincial People’s Hospital (Affiliated People’s Hospital, Hangzhou Medical College), Hangzhou, Zhejiang, People’s Republic of China
*These authors contributed equally to this work
Correspondence: Xin Zhang, Cancer Center, Department of Pathology, Zhejiang Provincial People’s Hospital (Affiliated People’s Hospital, Hangzhou Medical College), No. 158 Shangtang Road, Hangzhou, Hangzhou, Zhejiang, 310014, People’s Republic of China, Tel +86 13758197690, Fax +86 057185893288, Email [email protected] Wei Zhang, Department of Gastrointestinal surgery, The Second Affiliated Hospital of Zhejiang Chinese Medical University, Hangzhou, Zhejiang, 310005, People’s Republic of China, Email [email protected]
Purpose: This study aimed to investigate the expression of inducible T-cell co-stimulator (ICOS) and its ligand (ICOSLG), along with their association with clinicopathological features and influence on the immune profile in colorectal cancer (CRC).
Patients and Methods: The Cancer Genome Atlas Colorectal Adenocarcinoma cohorts were used. We also analyzed 131 clinical samples of colon lesions, including precancerous lesions (hyperplastic polyps, low-grade dysplasia, and high-grade dysplasia) and CRC tissues. We conducted immunohistochemical (IHC) assays and multiple IHC (mIHC) of CD4+, Foxp3+ tumor-infiltrating lymphocytes (TILs), and PD-1/PD-L1 immune checkpoints in precancerous lesions and CRC samples from our patient subsets to determine changes and correlations in ICOS and ICOSLG expression during progression through the adenoma–carcinoma pathway.
Results: High expression of ICOS and ICOSLG was a significant factor in CRC in multiple analyses and was positively correlated with CD4+/Foxp3+ TIL density and PD-1/PD-L1 expression, which increased with the sequential progression of lesions from precancerous tissues to carcinoma. Multivariable logistic regression analysis suggested that the location and expression level of ICOS/ICOSLG may be involved in precancerous–carcinoma progression. The co-expression status of PD-1 and ICOS/ ICOSLG could stratify patients with colorectal lesions into three groups of low, moderate, and high risk of progression. According to this classification and mIHC assays, we found a strong correlation between increased PD-1+ICOS+ or PD-1+ICOSLG+ co-expression and CRC, which might be deemed an independent factor in carcinogenesis.
Conclusion: Increased ICOS/ICOSLG expression may be associated with the progressive formation of Foxp3+ TILs in the immune microenvironment and may further promote the development of the abnormal cytology of colorectal lesions from precancerous neoplasia to CRC. Our findings support the interpretation that enhanced co-expression of PD-1+ICOS+ or PD-1+ICOSLG+ contributes to the immune-active microenvironment of the colorectal adenoma-carcinoma sequence.
Keywords: precancerous-carcinoma, immune environment, ICOS/ICOSLG, PD-1/PD-L1, tumor-infiltrating lymphocytes
Introduction
Colorectal cancer (CRC) progresses through a series of epithelial cell transformations from normal cells to adenomatous lesions with malignant tendencies that eventually develop into colonic adenocarcinoma. This progression is driven by sequential genetic and epigenetic alterations of tumor cells and is also influenced by tumor–host interactions.1 The host immune response, including concomitant activation of a variety of immune system pathways, is orchestrated by a set of co-stimulatory and co-inhibitory molecules to regulate the activation and effector functions of tumor-infiltrating lymphocytes (TILs), which contribute to the molecular and clinical characteristics underlying the carcinogenesis of CRC.2,3 The B7 family of co-stimulatory and co-inhibitory molecules plays an important role in T-cell activation or inhibition.4 Emerging evidence suggests that high expression of programmed death-1 (PD-1)/programmed death-ligand 1 (PD-L1) and high densities of T-cell subpopulations (CD4+ cells and Foxp3+ cells) in the colorectal tissue are generally associated with the degree of dysplasia, supporting a major role for T-cell–mediated immunity in repressing tumor progression.5,6 However, little is known about the complex interrelationships between expression of inducible T-cell co-stimulator (ICOS, also known as CD278), tumor-infiltrating T cells, and major immune molecular features in colorectal adenoma-carcinoma pathway progression.
ICOS was originally identified as a marker of T-cell activation7 and has since been found to play important roles in T-cell proliferation and cytokine secretion.7,8 ICOS interaction with its ligand, ICOSLG, constitutes a costimulatory signal that induces the production of a wide range of cytokines, either pro- or anti-inflammatory.9 Although the role of ICOS in supporting follicular T cell-dependent germinal center responses has been well documented,8,10 its contribution to the immune response in CRC carcinogenesis remains unclear. Metzger et al11 found that ICOS signaling during antitumor responses acts on both T effector cells and Tregs, which have opposing roles in promoting immune activation. There have also been some reports on the clinical influence of ICOS in CRC.12,13 A study on the role of ICOS in CRC primary tumor tissues or peripheral blood highlighted that ICOS+CD4+ cells acting as type 1 T helper cells may be a clinical biomarker for a good prognosis of CRC patients.12 Urakawa et al13 recently reported that patients with abundant ICOS+ Foxp3+ TILs appeared to show a more advanced gastric cancer phenotype and short recurrence-free survival. However, the effects of ICOS in colorectal carcinogenesis, particularly on the immune response in CRC and the immune microenvironment in the precancerous stage, have not been elucidated.
In this study, we investigated the ICOS/IOSLG expression pattern in CRC and the relationships between the ICOS/ICOSLG level and clinicopathological characteristics, and the immune microenvironment. In addition, we considered the combined expression status of ICOS/ICOSLG and PD-1 in colorectal tissues to establish a novel immunophenotyping system that may act as a predictive biomarker for the development of CRC. To address these questions, in this study, we first analyzed the expression of ICOS/ICOSLG and their association with clinicopathological features and the immune profile in CRC based on RNA-sequencing and clinical data available in The Cancer Genome Atlas Colorectal Adenocarcinoma (TCGA COAD-READ) database. Next, we conducted immunohistochemical (IHC) assays of CD4+, Foxp3+ TILs, ICOS/ICOSLG, and PD-1/PD-L1 immune checkpoints in precancerous lesions and CRC samples from our patient subsets. In addition, we designed two multiplex immunohistochemistry (mIHC) panels consisting of immune cell markers of ICOS, ICOSLG and PD-1 in the representative tissues of the colorectal adenomas-carcinomatous progression. The overall goal of this study was to gain novel insights into the clinical relevance of co-stimulatory and co-inhibitory receptors during the formation of the immune-active microenvironment, the malignant transformation of adenomatous polyps, and the development of CRC.
Materials and Methods
Bioinformatics Analysis
Transcriptome RNA-sequencing data of 698 COAD-READ cases (normal samples, 51 cases; tumor samples, 647 cases), including 521 COAD-READ (normal samples, 41 cases; tumor samples, 480 cases) and 177 READ (normal samples, 10 cases; tumor samples, 167 cases) cases, and corresponding clinical data were downloaded from TCGA (https://portal.gdc.cancer.gov/). Normal tissue data were supplemented from the Genotype-Tissue Expression (GTEx) database (http://commonfund.nih.gov/GTEx/). According to the median expression level of ICOS and ICOSLG, the COAD-READ samples were grouped into ICOS/ICOSLG high-expression group and ICOS/ICOSLG low-expression group. Single sample gene set enrichment analysis (ssGSEA) was performed using the R package ‘GSVA’14 to estimate the abundance profile of 24 types of immune cells15 in COAD-READ samples. The correlation between ICOS or ICOSLG expression and 24 immunoinhibitors and biomarkers was determined using Spearman correlation coefficient in the “correlation analysis” setting. The differentially expressed genes (DEGs) between the two groups were analyzed by the “edger” R package16 to identify genes that were positively or negatively co-expressed with ICOS or ICOSLG. Gene Ontology (GO) analysis and Kyoto Encyclopedia of Genes and Genomes (KEGG) pathway enrichment analysis were used to investigate the potential mechanisms underlying the functional impacts of ICOS or ICOSLG using the R package “clusterProfiler”.17 Only terms with both p- and q-values < 0.05 were considered to be significantly enriched.
Patients and Samples
We analyzed 131 clinical samples of colon lesions, including 103 precancerous colon lesions (30 hyperplastic polyps [HPs], 44 low-grade dysplasia [LGD], and 29 high-grade dysplasia [HGD]) and 28 CRC tissues. The clinical samples included in the study were from Zhejiang Provincial People’s Hospital, where colorectal precancerous lesions were resected by endoscopy and colorectal cancers were removed by surgery. We collected patient information, including sex, age, lesion size, location, pathology type, and tumor markers CEA, CA199, and CA125. This retrospective study was conducted in accordance with the principles of the Declaration of Helsinki and was approved by the Institutional Review Board of Zhejiang Provincial People’s Hospital (Protocol 2021QT329). The requirement for informed consent was waived owing to the retrospective nature of this study and the use of anonymous patient data.
IHC and mIHC Staining
IHC staining to detect ICOS, ICOSLG, PD-1, and PD- L1, cluster of differentiation CD4 and FoxP3 was performed following the protocol reported in a previous study.18 Briefly, after deparaffinization, rehydration, antigen retrieval, endogenous peroxidase inactivation and non- specific binding blockade, 4 µM- thick serial sections were incubated with primary antibody anti-ICOS (ab224644, Abcam, Cambridge, UK), anti-ICOSLG (ab233151, Abcam, Cambridge, UK), anti-PD-1 (GT228107, GeneTech, Shanghai, China), anti-PD-L1 (GT228007, GeneTech, Shanghai, China), anti-Foxp3 (ab215206, Abcam, Cambridge, UK), and anti-CD4 (ab183685, Abcam, Cambridge, UK) at 4°C overnight. The mIHC was carried out by using the Five-color multiplex fluorescent IHC kit (abs50013, Absin, Shanghai, China) based on the manufacturer’s instructions to characterize the expressions and localization of PD-1, ICOS and ICOSLG in CRC and precancerous tissues. Two mIHC panels with three primary antibodies were used to measure the co-expression of ICOS+ PD-1+ or ICOSLG+PD-1+ in HP, LGD, HGD and CRC paraffin-embedded tissue with Four-color multiplex fluorescent IHC kit (abs50012, Absin, Shanghai, China) following the manufacturer’s instructions. Cytokeratin (CK) was used to identify the epithelial cancer cells, and 4′,6-diamidino-2-phenylindole (DAPI) was used to stain the nucleus. Sections were observed using an optical microscope (Ni-U, NIKON, Tokyo, Japan).
Immunohistochemical Quantification
The percentage of stained cells was assessed in a double-blind manner by two pathologists (X.Z. and WS.P.). Quantification of all positive cells was performed using an OLYMPUS BX51 microscope and evaluated separately by the same two pathologists. Staining intensity of the protein expression levels was scored as 0 (negative),1 (weak), 2 (moderate), or 3 (strong). The area percentages of cells (0–100%) were multiplied by the intensity values to obtain values ranging from 0 to 300.19 We also assessed the four subsets of TILs, including PD-1+ immune cells, PD-L1+ immune cells, CD4+ cytotoxic T cells, Foxp3+ regulatory T cells, within the surrounding stroma, as previously described. TILs were determined based on 5 randomly chosen hpfs (200×), and the average levels were calculated.19 We calculated the average TIL number and explored its associations with patient characteristics retrospectively.
Statistical Analysis
Significant differences between categorical variables were analyzed using chi-square test and Fisher’s exact test. Discrete variables are expressed as counts (percentage), and continuous variables are expressed as the mean ± standard deviation or median (range). We used the Wilcoxon matched-pairs signed-rank test for comparisons between two corresponding groups; Mann–Whitney U-test or Student’s t-test for continuous variables; Kruskal–Wallis Test and Dunn’s test for comparisons between multiple groups; Spearman’s rank-order correlation coefficient for correlation analysis. Factors associated with adenoma-carcinoma progression were examined using bivariate and multivariate binary logistic regression analyses. Statistical analyses were performed using R software (R version 4.0.4) and SPSS v26.0 (IBM Corporation, Armonk, NY, USA). Results were considered significant when two-sided p-values < 0.05 were obtained.
Results
Correlation of ICOS and ICOSLG Expression with Clinicopathological Features in the COAD-READ Cohort
We first compared the expression levels of ICOS and ICOSLG mRNA in CRC tissues and their corresponding normal tissues in the publicly available TCGA and GTEx databases (n = 742). We found that the mRNA levels of ICOS and ICOSLG were markedly elevated in tumor tissues as compared with those in normal colorectal tissues (p < 0.0001 for both, Figure 1A). Moreover, ICOS mRNA levels were much higher in tumor tissues than in paired non-tumor tissues (p=0.044, Figure 1B), but not ICOSLG mRNA expression (P = 0.088, Figure 1B). As shown in Figure 1C, the variables ICOS (AUC = 0.739, CI = 0.704–0.775) and ICOSLG (AUC = 0.858, CI = 0.832–0.885) both had a certain accuracy in predicting colorectal normal and tumor outcomes. Next, we compared ICOS and ICOSLG expression in TCGA cohort with different clinicopathological features. Based on the cancer stage, the mRNA levels of ICOS were higher in early-stage CRC than in advanced- stage CRC, including N0 (P=0.001, Figure 1E), M0 (p < 0.0001, Figure 1F), and stages I/II (p < 0.0001, Figure 1G), but there was no significant correlation with the T stage of patients (p>0.05, Figure 1D). However, no significant correlation was found between the expression of ICOSLG and TNM stages (all p>0.05, Figure 1D–G). Both ICOS and ICOSLG mRNA levels were positively correlated with the R0 resection (P=0.015 and P=0.023, respectively, Figure 1H). Interestingly, we also observed upregulation of ICOS expression in patients with a history of colon polyps (P =0.003, Figure 1I), which indicated that ICOS expression may correlate with colorectal polys and the progression of CRC.
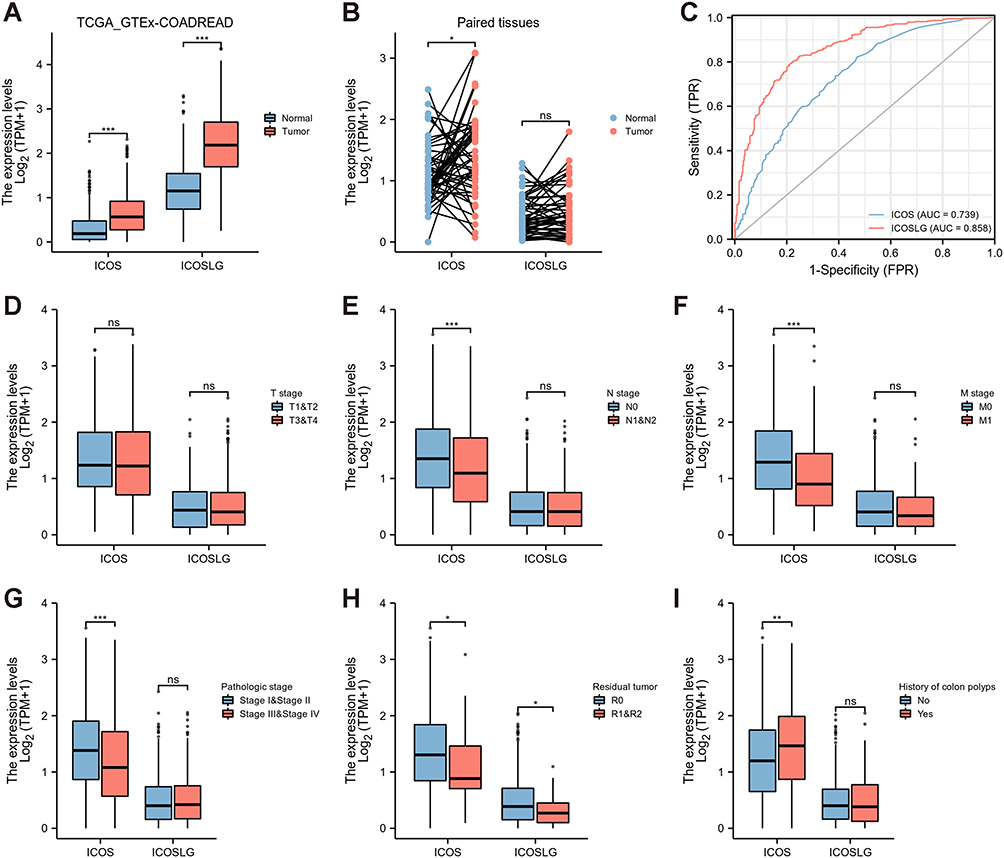 |
Figure 1 Correlation of ICOS and ICOSLG expression with clinicopathological characteristics in TCGA COAD-READ cohorts. (A) TCGA + GTEx tumor and normal tissues, (B) Paired expression in tumor and normal tissues,(C) area under the curve (AUC), (D) T1/T2 vs T3/T4, (E) N0 vs N1/N2, (F) M0 vs M1, (G) stages I/II vs stages III/IV, (H) residual tumor, (I) history of colon polyps. *p < 0.05, **p < 0.01, ***p < 0.001. Abbreviation: ns, no significant difference. |
Correlation of ICOS and ICOSLG Expression with Immune Infiltration in TCGA Cohorts and Clinical Colorectal Tissues
To better understand the roles of ICOS and ICOSLG in the immune response, ssGSEA was conducted to evaluate the immune cell composition of CRC samples from TCGA cohort. The ssGSEA results of TCGA cohorts showed that 23 types and 16 types of TILs were correlated with the expression of ICOS and ICOSLG in COAD-READ, respectively (Figure 2A and B, Supplementary Table 1).There were many more tumor- infiltrating T cells, such as Th1 cells, T helper cells, Treg, Tfh, CD8+ T cells, effector memory T cells (Tem), gamma delta T cells (Tgd), and central memory CD4+ T cells (Tcm), but not Th 17 cells, in tumor tissues of both the ICOShigh (Figure 2A) and ICOSLGhigh (Figure 2B) groups than in those of the low expression group, indicating that ICOS and ICOSLG may have both adaptive and suppressive immune phenotypes in the COAD-READ tumor microenvironment.
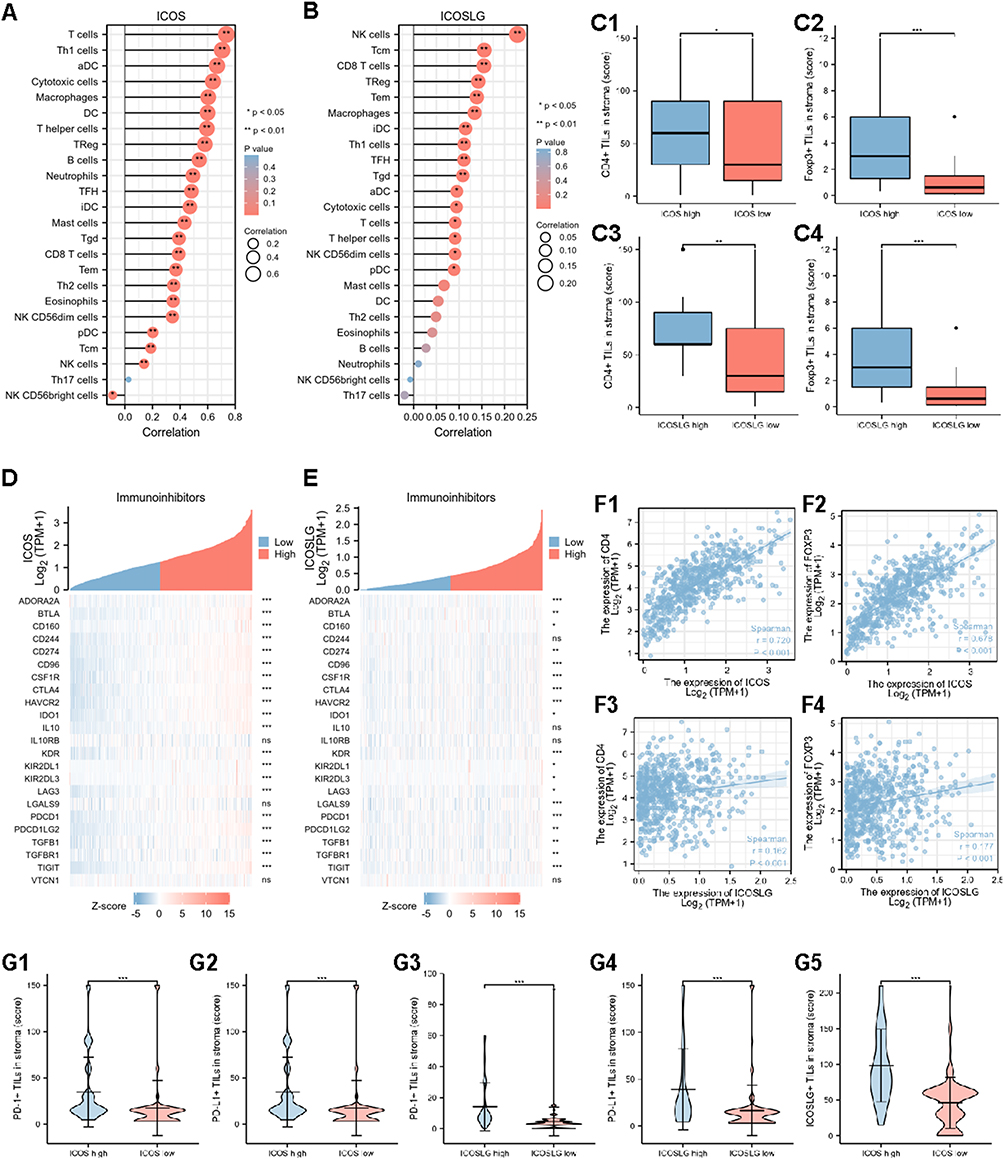 |
Figure 2 Correlations of tumor-infiltrating immune cells and immune checkpoints with ICOS and ICOSLG expression in TCGA cohort and clinical precancerous-carcinoma samples. (A and B) Correlation of ICOS (A) and ICOSLG (B) expression with 24 types of immune cell infiltration levels in TCGA cohort. (C) IHC analysis of CD4+ (C1) and Foxp3+ T cells (C2) infiltration in CRC tissues with ICOS expression, and CD4+ (C3) and Foxp3+ T cells (C4) infiltration in CRC tissues with ICOSLG expression from clinical cohort. (D and E) Correlation of ICOS (D) and ICOSLG (E) expression with 24 immunoinhibitors in TCGA cohorts. (F1–F4) Correlation of CD4 and Foxp3 expression with ICOS or ICOSLG expression in TCGA cohorts. (G1–G5) Correlation of PD-1+ (G1), PD-L1+ (G2), and ICOSLG+ (G3) T cells with ICOS expression, and PD-1+ (G4), PD-L1+ (G5) T cells with ICOSLG expression from clinical cohort. *p < 0.05, **p < 0.01, ***p < 0.001. Abbreviation: ns, no significant difference. |
In clinical cohort, high expression levels of CD4 or Foxp3 were defined as cases with scores greater than 56.7 of the H-score for CD4 and greater than 1.9 (ranges from 0 to 150) of the H-score for Foxp3 (ranges from 0 to 12) (Supplementary Figure 1). Furthermore, we investigated the infiltration of CD4+ TILs (Supplementary Figure 1A and B) and Foxp3+ TILs (Supplementary Figure 1C and D) from our colorectal lesion cohort by IHC assay. The results showed that there were significantly more CD4+ and Foxp3+ T cells in the stroma of both ICOShigh (p=0.046 for CD4+, and p < 0.001 for Foxp3+ TILs in ICOS; Figure 2C1 and C2) and ICOSLGhigh (p=0.002 for CD4+ and p < 0.001 for Foxp3+ TILs in ICOSLG; Figure 2C3 and C4) tissues than in low expression tissues, similar to the findings in the TCGA cohort.
As Treg mainly play an immunosuppressive role in the Tumor microenvironment (TME), in this part, we mainly focused on the relationship between ICOS/ICOSLG and immunoinhibitors. ICOS and ICOSLG expression was significantly associated with most immune markers in the divergent immune cell types in COAD and READ. ICOS expression was correlated with 21 immunoinhibitors (Figure 2D, Supplementary Table 2), and ICOSLG expression was correlated with 20 immunoinhibitors (Figure 2E, Supplementary Table 2, including PD-1 (PDCD1), and PD-L1 (CD274). We also analyzed the correlation between ICOS/ICOSLG and CD4 and Foxp3. The results showed a positive correlation between these checkpoints (Figure 2F). Collectively, these results further support the hypothesis that the levels of ICOS and ICOSLG might affect the immune activity of the TME in COAD-READ.
In clinical cohort, high expression levels of PD-1 or PD-L1 were defined as cases with scores greater than 22.3 (ranges from 0 to 150) of the H-score for PD-L1 and greater than 7.0 (ranges from 0 to 90) of the H-score for PD-1 (Supplementary Figure 1). Furthermore, we investigated the infiltration of PD-1+ TILs (Supplementary Figure 1E and F) and PD-L1+ TILs (Supplementary Figure 1G and H) in our colorectal lesion cohort by IHC assay. In the surrounding stroma, the number of TILs was significantly higher in ICOShigh (Figure 2G1–G3) and ICOSLGhigh (Figure 2G4–G5) lesions (all p < 0.001, respectively), similar to the findings in the TCGA cohort.
Functions of ICOS and ICOSLG in TCGA COAD-READ Cohorts
We obtained the top 100 most positively or negatively correlated genes with ICOS and ICOSLG for GO and KEGG enrichment analyses by the “clusterProfile” R package. The biological process revealed that both ICOS and ICOSLG expression was closely related to immune response processes, such as T cell activation, lymphocyte proliferation, and positive regulation of cytokine production for ICOS (Figure 3A and C), and leukocyte proliferation, T cell activation, and T cell proliferation for ICOSLG (Figure 3B and D). KEGG pathway analysis showed that the immune-related pathways of these DEGs for both ICOS and ICOSLG were enriched mainly in cytokine-cytokine receptor interaction (Figure 3A–D). These results strongly imply that ICOS and ICOSLG are involved in regulation of the immune response in COAD-READ.
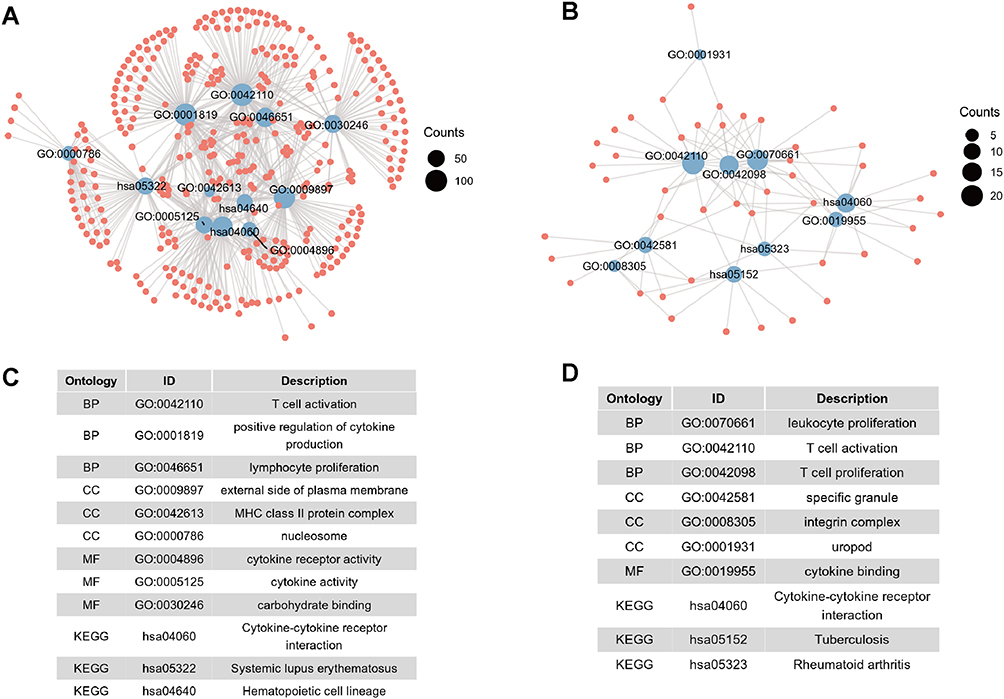 |
Figure 3 Functional enrichment analysis of ICOS and ICOSLG expression in TCGA COAD-READ cohorts. (A and B) GO and KEGG analyses related to ICOS (A) and ICOSLG (B) expression. (C and D) The corresponding entry of GO and KEGG analysis related to ICOS (C) and ICOSLG (D) expression. |
Correlation of ICOS/ICOSLG Expression with Clinicopathological Features in Colorectal Precancerous–Carcinoma Samples
In the TCGA cohort study, we found that a higher expression of ICOS was associated with colonic polyps and early-stage CRC (Figure 1D–I). Therefore, we were curious about the changes in ICOS and ICOSLG in the progression of colonic polyps to CRC. First, we examined ICOS and ICOSLG expression in the clinical samples of colon lesions by IHC assay, including 103 precancerous colon lesions (30 HPs, 44 LGD, and 29 HGD) and 28 CRC tissues. High expression levels of ICOS or ICOSLG were grouped using the median as the cut-off value, which were defined as cases with scores greater than 4.1 of the H-score for ICOS (ranges from 0 to 30) and greater than 61 of the H-score for ICOSLG (ranges from 0 to 210). The results showed that ICOS and ICOSLG protein levels tended to be higher in the CRC stage than in the precancerous stage (HPs or LGDs+HGDs) (all p<0.0001, Figure 4A and B). The high-ICOS expression percentage increased from 15.8% in precancerous lesions (0% in HPs, 11.4% in LGDs, and 40.7% in HGDs) to 73.3% in CRCs (p < 0.001) (Figure 4A, Table 1). The extent of ICOSLG expression showed a similar trend, with percentages of 10.9% in precancerous lesions (0.0% of HPs, 13.6% of LGDs, and 18.5% in HGDs) and 73.3% in CRCs (p < 0.001) (Figure 4B, Table 1). We observed an overall upward trend in ICOS/ICOSLG expression with increasing lesion severity from precancerous lesions to CRCs.
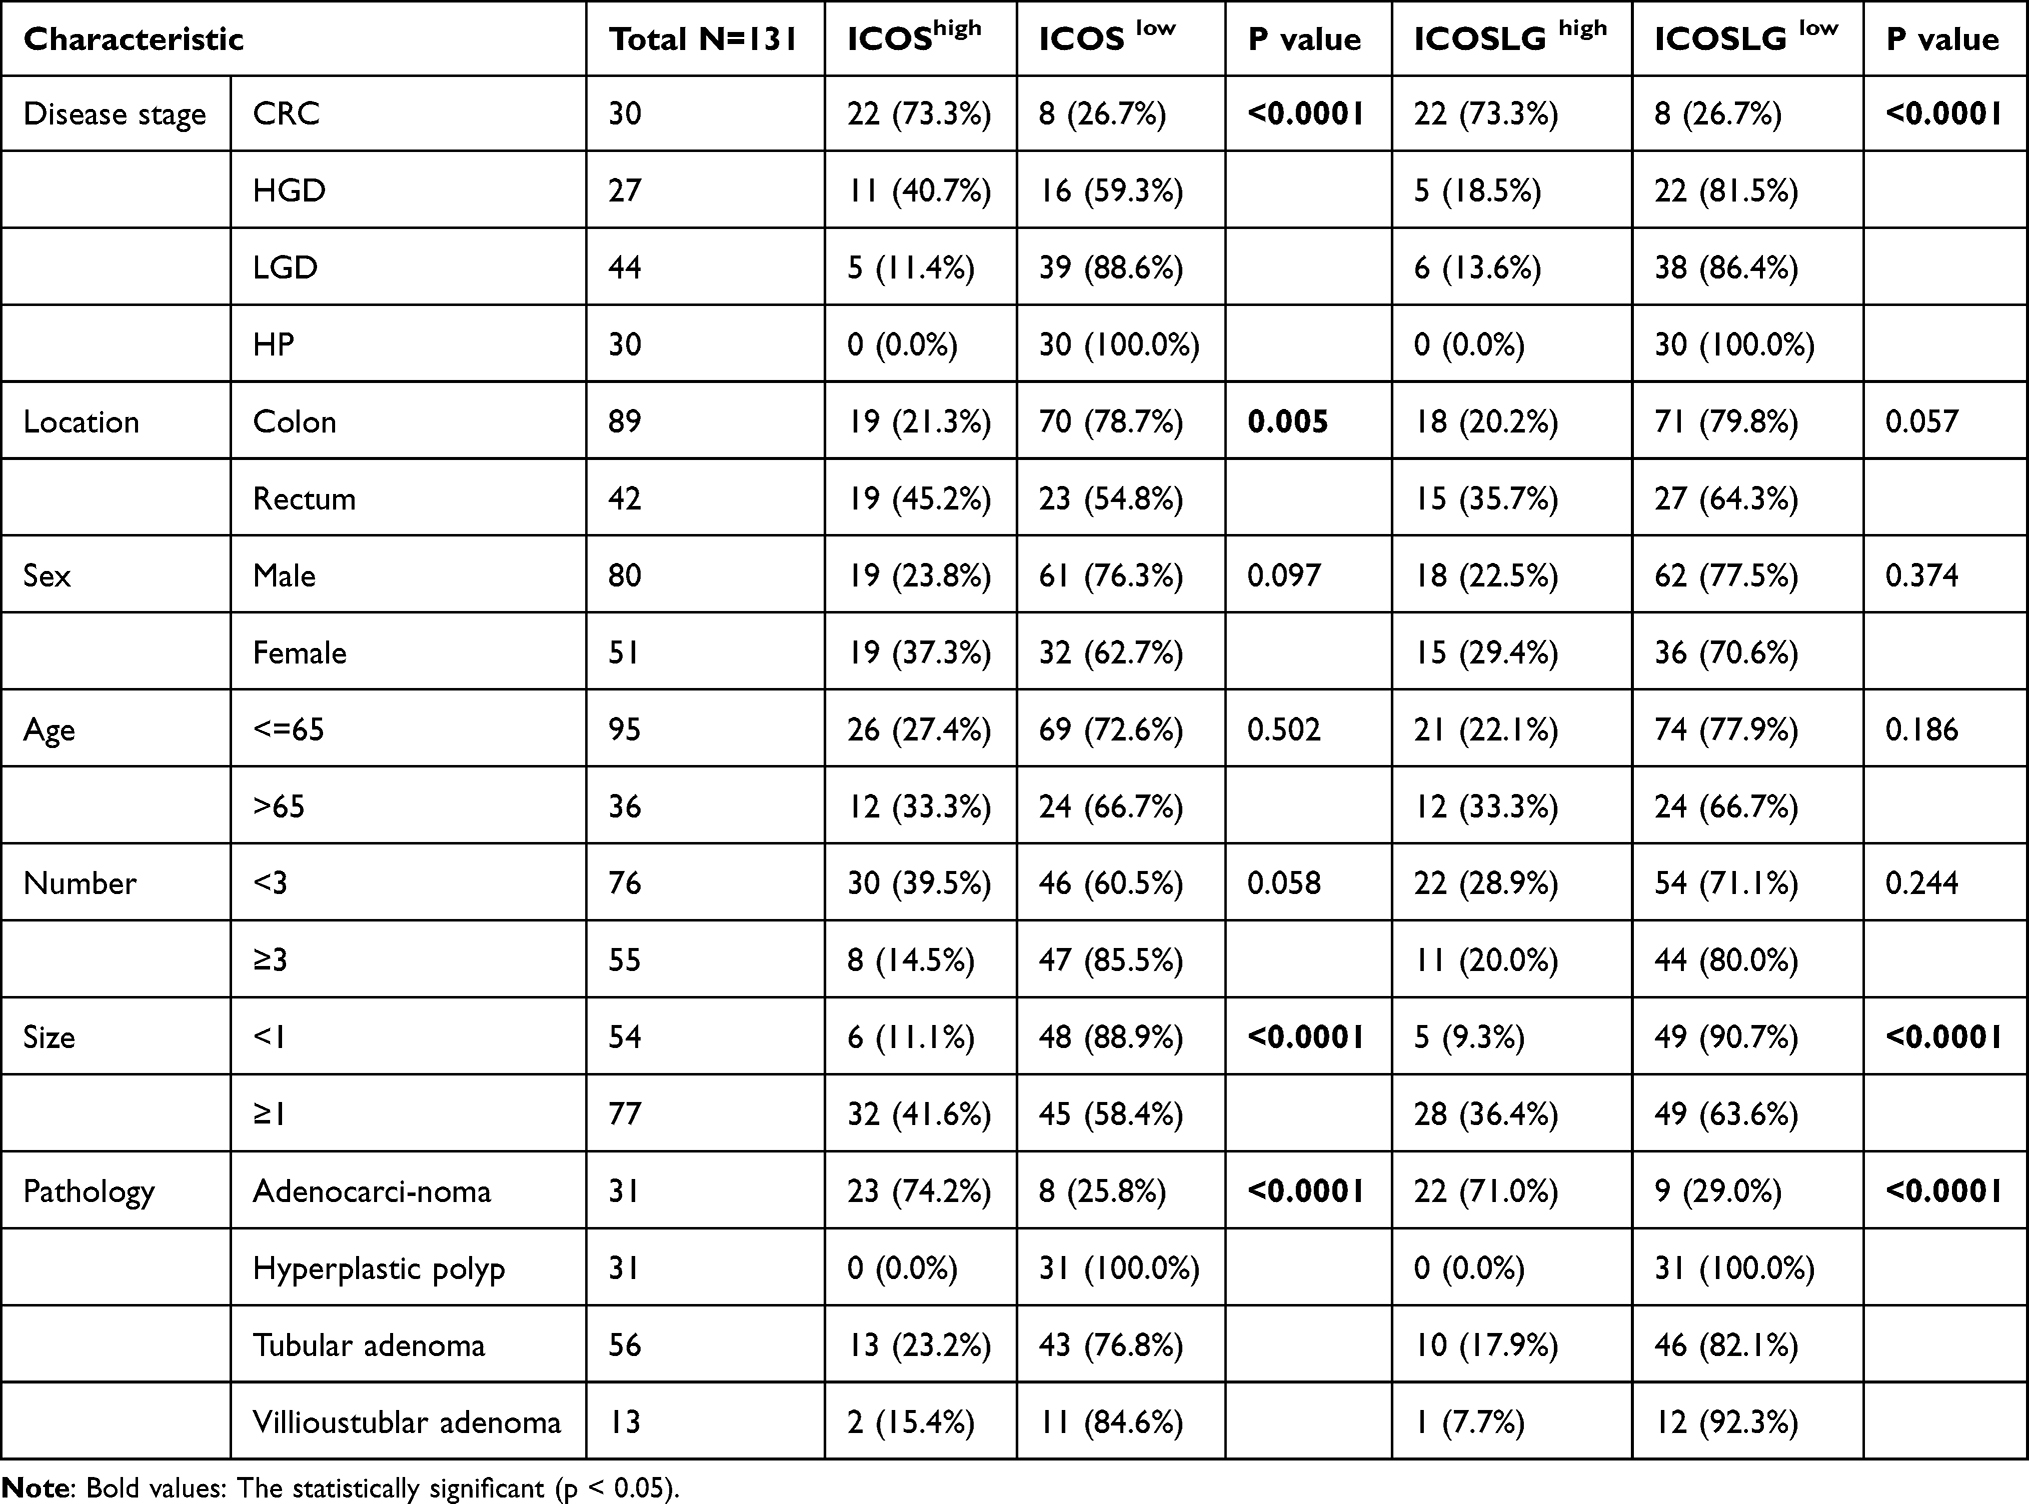 |
Table 1 Clinicopathological Characteristics According to ICOS and ICOSLG Expression in 131 Studied Lesions Analyzed by IHC |
 |
Figure 4 The association of ICOS/ICOSLG with the infiltration of T cells and the progression of precancerous–carcinoma lesions. (A1 and B1) Immunohistochemical staining of ICOS or ICOSLG expression in HP, LGD, HGD, and CRC tissues in clinical cohort. Bar scale = 50 μm. (A2, B2) Multiple comparison of the densities of ICOS+ (A2) and ICOSLG+ (B2) T cells in HP, LGD, HGD, and CRC tissues in clinical cohort. (C and D) The infiltration of ICOS+ (C1) or ICOSLG+ (C2) T cells with PD-1 expression, and ICOS+ (D1) or ICOSLG+ (D2) T cells with PD-L1 expression in precancerous tissues from the clinical cohort. (E and F) The infiltration of Foxp3+ (E1) and CD4+ (F1) T cells in clinical tissues from three groups according to the PD-1/ICOS expression level, and the Foxp3+ (E2) and CD4+ (F2) T cells according to the PD-1/ICOSLG expression level: group A1, PD-1high/ICOShigh; group B1, PD-1high/ICOSlow or PD-1low/ICOShigh; group C1, PD-1low/ICOSlow; group A2, PD-1high/ICOSLGhigh; group B2, PD-1high/ICOSLGlow or PD-1low/ICOSLGhigh; group C2, PD-1low/ICOSLGlow. *p < 0.05, **p < 0.01, ***p < 0.001. Abbreviation: ns, no significant difference. |
Among the lesions ≥ 1 cm, 32 of the 77 lesions (41.6%) presented higher ICOS expression, and 28 (36.4%) presented higher ICOSLG expression than the corresponding lesions <1 cm (both p < 0.001, Table 1). High-ICOS expression levels were significantly correlated with tumor location in the rectum (p=0.005, Table 1). According to the pathological pattern, the proportions of high-expression ICOSLG and ICOS samples were 71% and 74.2% in adenocarcinoma, respectively (p < 0.001, Table 1). The ICOS/ICOSLG expression level was not significantly associated with any of the other characteristics examined, including age, sex, number of lesions, carcinoembryonic antigen, CA125, and CA199 (all p ≥ 0.05, Supplementary Table 3). These results demonstrated that ICOS and ICOSLG expression is positively associated with the progression of CRC, especially with tumor size, location, and pathological types with higher malignant potential.
Significance of Co-Expression of ICOS/ICOSLG and PD-1 in the Progression of Precancerous–Carcinoma Lesions
To better analyze the relationship between the expression of ICOS/ICOSLG and/or PD-1/PD- L1 in the immune microenvironment of the colorectal precancerous-carcinoma pathway, we considered the combinational expression of immunostimulatory and immunosuppressive molecules to generate a potential tool for predicting the potential of CRC progression. In precancerous colorectal tissues, the ICOS and ICOSLG expression levels (IHC scores) were significantly higher in PD-1high expression tissues than in the PD-1low tissues (p<0.05, Figure 4C1 and C2, Table 2), but there was no difference in the PD-L1low and PD-L1high groups (p>0.05, Figure 4D1 and D2, Table 2). These results suggest that the expression of ICOS/ICOSLG may be associated with PD-1 in the early stage of colorectal precancerous lesions. Thus, we classified these patients with colorectal lesions into three groups of low, moderate, and high risk of Immunosuppression (Table 3). First, we examined the associations of PD-1/ICOS or PD-1/ICOSLG co-expression with TILs. The data showed that the level of infiltrating Foxp3+ TILs in both PD-1/ICOS and PD-1/ICOSLG colorectal tissues was the highest in group A compared with that in group B and C (all p<0.001, Figure 4E1 and E2), but there were no significant differences in terms of CD4+ TILs among the three groups (both p>0.05, Figure 4F1 and F2). In the present study, we examined the localization of the co-expression of ICOS, ICOSLG and PD-1 in CRCs and precancerous lesions by using Five-color mIHC. Figure 5 shows that the co-expressions of ICOS, ICOSLG and PD-1 were predominantly detected on the membrane and in the cytoplasm of stromal cells, and were significantly higher in CRC tissues (Figure 5A) than that in adenoma tissues (Figure 5B). Next, we examined the associations of PD-1/ICOS and PD-1/ICOSLG co-expression with the development of CRC by Four-color mIHC (Figure 6A and B). Among the analyzed immune cell proportions, ICOS+ (Figure 6C), ICOSLG+ (Figure 6D), and PD-1+ (Figure 6E) T cells were more frequently observed in advanced-stage tumors than in early-stage tumors in stromal regions. Furthermore, colocalization of PD-1 on ICOS+ (Figure 6A and F) or ICOSLG+ T (Figure 6B and F) cells was abundant in the associated stromal regions of advanced-stage tumors, such as HGD and CRC (p <0.001, respectively). These findings suggested a strong association between PD-1 and ICOS/ICOSLG protein levels in the progression of CRC and that PD-1+ICOS+ and PD-1+ICOSLG+ co-expression is positively associated with an aggressive phenotype and the Immunosuppressive TME in precancerous lesions-to-carcinoma progression.
 |
Table 2 Correlation of PD-1 Expression with the Infiltration of ICOS+ or ICOSLG+ T Cells in Precancerous Lesions |
 |
Table 3 Correlation of ICOS/ICOSLG and PD-1 Co-Expression with Precancerous-Carcinoma Progression According to the Classification of Three Groups |
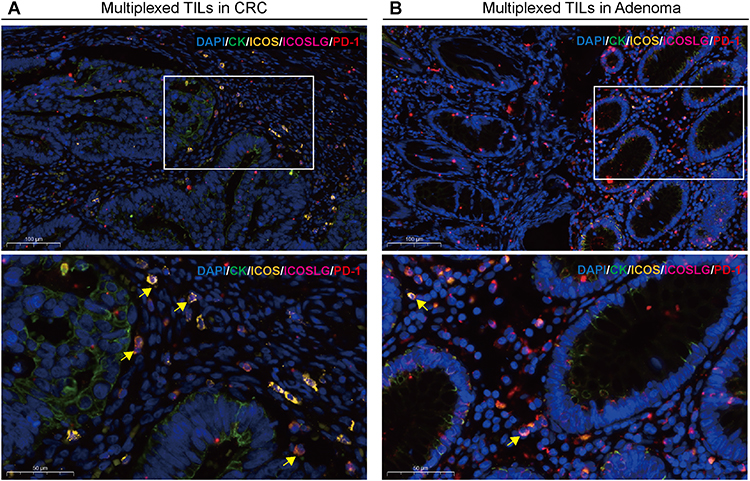 |
Figure 5 Characterization of the expressions and localization of the co-expression of ICOS, ICOSLG and PD-1 infiltration in CRC and adenoma tissues by using five-color multiplex analysis. (A and B) Representative fluorescence pictures showing ICOS+ICOSLG+PD-1+ TILs protein expression in CRC (A) and adenoma (B) tissues from the clinical cohort. The target signal (co-expression of gold, pink and red fluorescence) is predominantly located in the stroma cells. Nuclei (DAPI, blue), CK (cytoplasm, Opal 520, green), ICOS (cytoplasm, Opal 570, gold), ICOSLG (membrane, Opal 620, pink), PD-1 (cytoplasm, Opal 702, red). Upper panel, Bar scale = 100 μm; lower panel, Bar scale = 50 μm. |
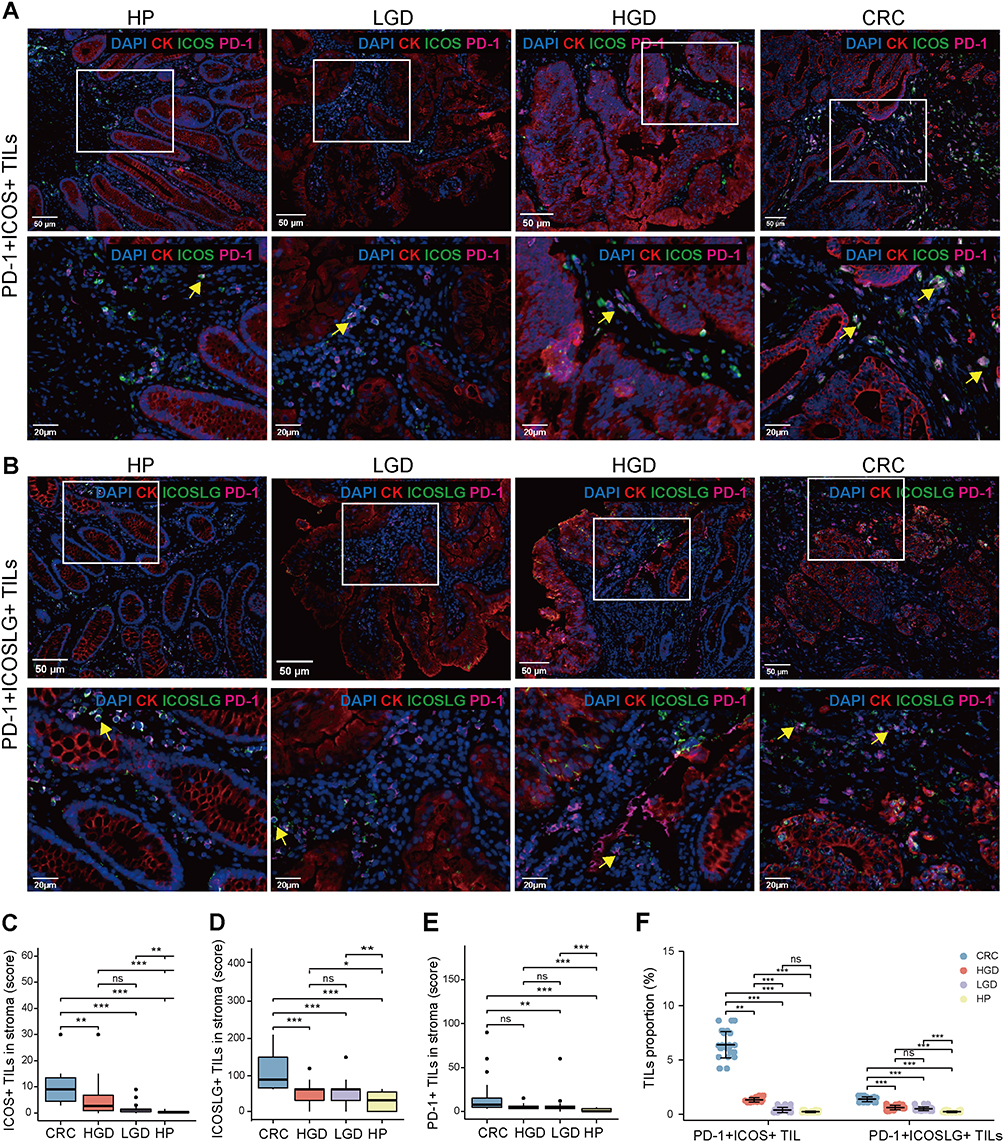 |
Figure 6 Multiplex immunohistochemical analysis of the co-expression of ICOS/ICOSLG and PD-1 infiltration in the progression of precancerous–carcinoma lesions. (A and B) Representative images of PD-1+ICOS+ (A) and PD-1+ICOSLG+ T cells (B) in HP, LGD, HGD and CRC tissues from the clinical cohort. (C–E) Multiple comparison of the density of ICOS+ (C), ICOSLG+ (D), and PD-1+ (E) T cells in HP, LGD, HGD, or CRC tissues from the clinical cohort. (F) Multiple comparison of the density of PD-1+ICOS+ or PD-1+ICOSLG+ T cells in HP, LGD, HGD, or CRC tissues from the clinical cohort. Nuclei (DAPI, blue), CK (cytoplasm, Opal 650, red), ICOS/ICOSLG (cytoplasm/membrane, Opal 520, green), PD-1 (cytoplasm, Opal 570, pink). Upper panel, Bar scale= 50 μm; lower panel, Bar scale= 20 μm. *p < 0.05, **p < 0.01, ***p < 0.001. Abbreviation: ns, no significant difference. |
Factors Associated with Adenoma-Carcinoma Progression
Six factors were significantly associated with CRC in the bivariate model, including age, the location of the lesion, and expression of ICOS, ICOSLG, PD-1, and PD-L1 (all p < 0.05) (Table 4). The multivariate logistic regression analysis indicated that the lesion location in the colon [odds ratio (OR): 0.1; 95% CI 0.02–0.48) was negatively associated with CRC (Table 4). By contrast, high ICOS expression (OR: 5.54; 95% CI 1.14–26.93) and high ICOSLG expression (OR: 27.32; 95% CI 4.1–182.04) were positively associated with CRC (Table 4). Taken together, these data suggest that high ICOS/ICOSLG expression and tumor location in the rectum may be involved in the progression of adenomatous carcinoma and are closely associated with the development of CRC.
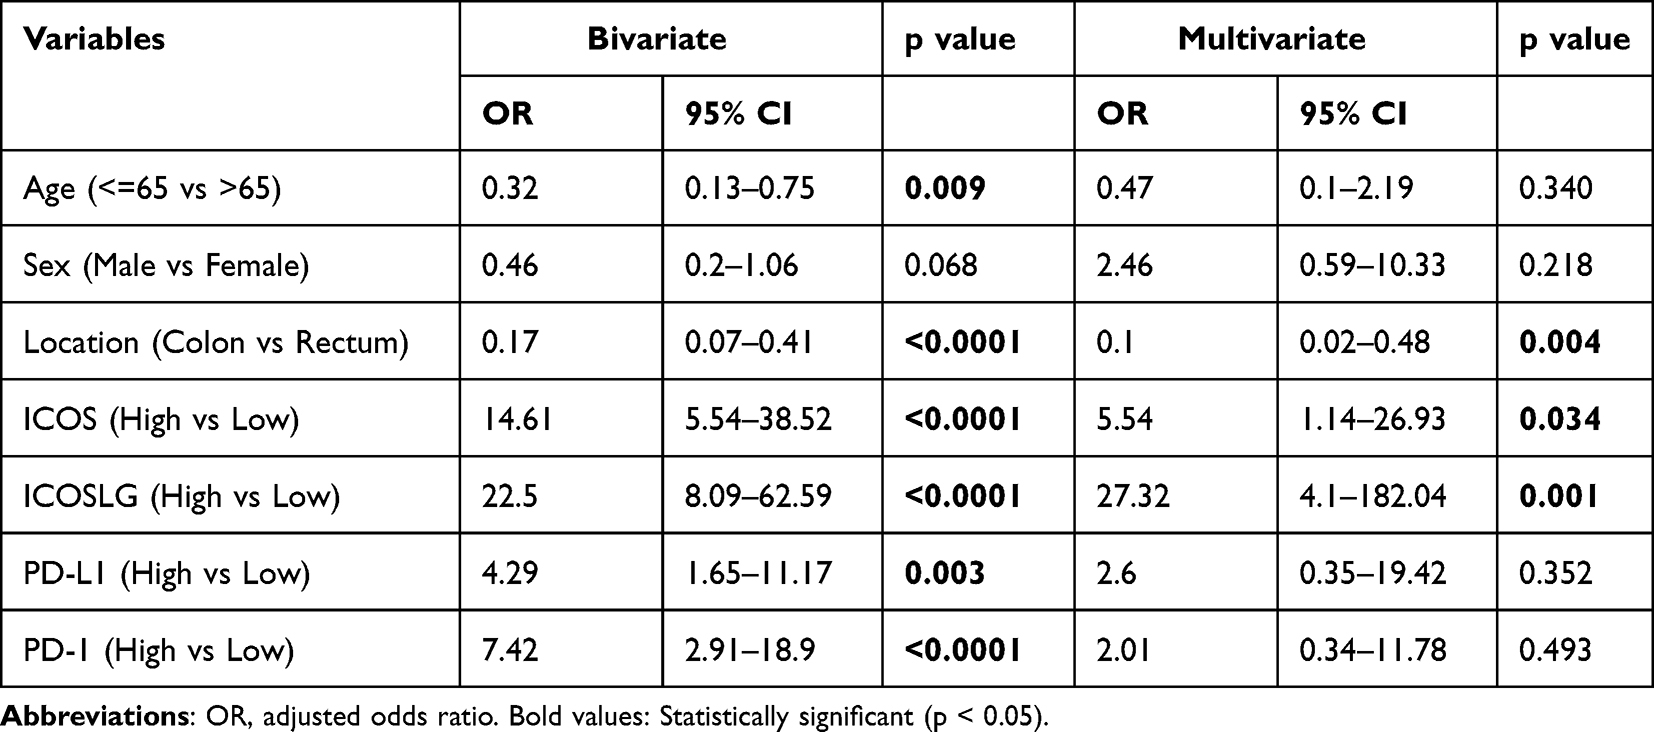 |
Table 4 Association Between Predictor Variables and CRC Determined via Bivariate and Multivariate Logistics Regression Analysis |
Discussion
Colorectal carcinogenesis results from the accumulation of different sets of genomic and epigenomic alterations and is also influenced by tumor–host interactions.20–23 This phenomenon is echoed by several studies showing that the immune microenvironment of CRC is counterbalanced by enhanced expression of multiple checkpoints, especially co-stimulatory and co-inhibitory factors.1,24 ICOS has been identified to play a central role in the differentiation and function of Foxp3+ Tregs25,26 Elevated expression of ICOS was shown to be associated with a poor outcome in most cases and emerged as a better predictor of prognosis than the percentage of total Tregs under some circumstances.27,28 Viveiros et al identified ICOS as a potential immunotherapeutic target in bladder cancer that, through Treg depletion, may increase the efficacy of existing immunotherapies, such as anti-PD-1 therapies. In this study, we first examined the profile of ICOS and ICOSLG expression in COAD-READ and found that they were both abnormally expressed at a high level in tumor tissues and significantly correlated with early-stage CRC compared with advanced-stage CRC. Furthermore, we found that the expression of both ICOS and ICOSLG was closely related to immune response processes, such as T cell activation and lymphocyte proliferation and correlated with the expression of CD4+ and Foxp3+ TILs and PD-1/PD-L1 immune markers, which is essential for tumorigenesis and the formation of the immunosuppressive microenvironment of CRC. These results suggest that ICOS/ ICOSLG may influence the development of CRC and may affect the development of tumor immunity, indicating their potential as a prognostic biomarker.
ICOS interaction with its ligand, ICOSLG, constitutes a costimulatory signal that induces the production of a wide range of cytokines, either pro- or anti-inflammatory.9 Subsequently, numerous studies have elucidated the role of ICOS+ Tregs in homeostasis and different disease conditions. For instance,29 increased expression of ICOS in CD4+Foxp3+ TILs was observed in advanced stages of gastric cancer, and the elevated expression of ICOS in CD4+Foxp3+ TILs negatively correlated with relapse-free survival time. In addition, the expression of ICOSLG in malignant tumor cells or tumor-associated plasmacytoid dendritic cells was confirmed to be a good booster for the accumulation of ICOS+ Tregs in some tumor tissues.30–32 Thus, the interaction between ICOS and ICOSLG is a central mechanism in tumor immune evasion. Zhang et al reported that the expression of ICOS is associated with improved survival in CRC, and the percentage of ICOS+CD4+ cells acting as Th1 cells in either primary tumor tissue or peripheral blood may be a clinical biomarker for good prognosis of CRC patients.12 However, the role of ICOS and ICOSLG in the colorectal adenoma-carcinogenesis pathway remains poorly understood.
Interestingly, we also observed upregulation of ICOS expression in patients with a history of colon polyps. Thus, we hypothesized that ICOS and ICOSLG may play an important role during the carcinogenic transformation of the colorectum and serve as an immunoregulator in the development stage of CRC. Based on this finding, we further evaluated the correlation between co-stimulatory and co-inhibitory factors in terms of the immune features of HPs, LGDs, HGDs, and CRCs, which are typical tissues of the four stages of colorectal adenoma-carcinogenesis, and elucidated their changes and interrelationships in the progression of colorectal adenomas to carcinomas. We found that ICOS/ICOSLG expression was positively correlated with colorectal carcinoma progression, especially with dysplasia stage, size, and pathological types with higher malignant potential. The expression of ICOS/ICOSLG was positively correlated with the expression of PD-1/PD-L1, CD4+, and Foxp3+T cells in colorectal tissues, consistent with the results obtained in TCGA database.
The TME of adenoma and carcinoma is comparable, whereas the key elements driving an epithelium from benign to malignant are likely decided by changes in genomic mutations or/and expression within it.33 The number of intraepithelial regulatory T cells was observed to increase when adenomatous polyps with low-grade dysplasia were compared to advanced adenomas and CRCs.34 In a previous study, we confirmed that increased TIL density and PD-1/PD-L1 expression correlated with cytological dysplasia progression.18 ICOS is generally involved in the production, proliferation, and survival of Tregs, providing them with a strong suppressive capability.35,36 With respect to ICOS assessment in our study, the counts of single positive cells in the stroma were increased in precancerous lesions according to PD-1 expression, but no differences were observed at different PD-L1 expression levels. Alspach et al reported that neoantigen-reactive TILs found in the tumor expressed both PD-1 and ICOS.37 Furthermore, we found that the expression of PD-1 modulated the prognostic significance of ICOS/ICOSLG in patients with precancerous lesions, and the co-expression status of ICOS/ICOSLG and PD-1 stratified the patients into three groups of low, moderate, and high risk of immunosuppression. Additionally, we observed the highest infiltration of Foxp3+ T cells, suggesting an immunosuppressive microenvironment, in the high-risk group, which is consistent with the worst degree of dysplasia in this group. The infiltration of PD-1+ICOS+ or PD-1+ICOSLG+ T cells showed a stepwise trend in the progression of dysplasia from precancerous lesion to CRC. It is possible that ICOS/ICOSLG co-expressed with PD-1 may have a role in promoting tumor progression by regulating tumor-promoting inflammation in the CRC microenvironment.
In this study, we found that ICOS/ICOSLG expression promoted the development of aggressive tumor phenotypes, with respect to associations with tumor stage, size, and pathological types with higher malignant potential. Our findings showed that high expression of ICOS and ICOSLG was a significant factor in CRC in multiple analyses and was positively correlated with CD4+/Foxp3+ TIL density and PD-1/PD-L1 expression, which increased with the sequential progression of lesions from precancerous tissues to carcinoma. Multivariable logistic regression analysis suggested that the location and expression level of ICOS/ICOSLG may play a role in precancerous-carcinoma progression. The co-expression status of PD-1 and ICOS/ ICOSLG could divide patients with colorectal lesions into three groups of low, moderate, and high risk of progression. According to this classification, we found a strong correlation between increased PD-1+ICOS+ or PD-1+ICOSLG+ co-expression and CRC, which might be deemed an independent factor in carcinogenesis. As such, specific follow-up experiments are needed to further validate these findings, and the potential clinical implications of these results could help address current limitations in the diagnosis, treatment, and management of CRC. To our knowledge, such results have not been previously reported.
Conclusion
Our findings suggest that increased ICOS/ICOSLG expression may be associated with the progressive formation of the immune microenvironment and may further promote the development of the abnormal cytology of colorectal lesions from low-grade to high-grade neoplasia to CRC. Our findings support the finding that enhanced co-expression of PD-1+ICOS+ or PD-1+ICOSLG+ contribute to the immune-active microenvironment of lesions, which collectively stimulate a host immune response in a stepwise and sequential progression, ie, dysplasia-carcinoma transition and adenoma-carcinoma sequence.
Ethics Statement
This retrospective study was conducted in accordance with the principles of the Declaration of Helsinki and was approved by the Institutional Review Board of Zhejiang Provincial People’s Hospital (Protocol 2021QT329). The requirement for informed consent was waived due to the retrospective nature of this study and the use of anonymous patient data.
Author Contributions
All authors made a significant contribution to the work reported, whether that is in the conception, study design, execution, acquisition of data, analysis and interpretation, or in all these areas; took part in drafting, revising or critically reviewing the article; gave final approval of the version to be published; have agreed on the journal to which the article has been submitted; and agree to be accountable for all aspects of the work.
Funding
This study was supported by Natural Science Foundation of Zhejiang Province (no. LQ20H160061, Y21H160246); Medical Health Science and Technology Project of Zhejiang Provincial Health Commission (no. 2021KY502); and Zhejiang Provincial Science and Technology Program of Traditional Medicine (no. 2022ZA016).
Disclosure
The authors report no conflicts of interest in this work.
References
1. Masugi Y, Nishihara R, Yang J, et al. Tumour CD274 (PD-L1) expression and T cells in colorectal cancer. Gut. 2017;66(8):1463–1473. doi:10.1136/gutjnl-2016-311421
2. Lal N, Beggs AD, Willcox BE, Middleton GW. An immunogenomic stratification of colorectal cancer: implications for development of targeted immunotherapy. Oncoimmunology. 2015;4(3):e976052. doi:10.4161/2162402X.2014.976052
3. Sun C, Mezzadra R, Schumacher TN. Regulation and Function of the PD-L1 Checkpoint. Immunity. 2018;48(3):434–452. doi:10.1016/j.immuni.2018.03.014
4. Cheng H, Janakiram M, Borczuk A, et al. HHLA2, a new immune checkpoint member of the B7 family, is widely expressed in human lung cancer and associated with EGFR mutational status. Clin Cancer Res. 2017;23(3):825–832. doi:10.1158/1078-0432.CCR-15-3071
5. Acosta-Gonzalez G, Ouseph M, Lombardo K, Lu S, Glickman J, Resnick MB. Immune environment in serrated lesions of the colon: intraepithelial lymphocyte density, PD-1, and PD-L1 expression correlate with serrated neoplasia pathway progression. Hum Pathol. 2019;83:115–123. doi:10.1016/j.humpath.2018.08.020
6. Rau TT, Atreya R, Aust D, et al. Inflammatory response in serrated precursor lesions of the colon classified according to WHO entities, clinical parameters and phenotype-genotype correlation. J Pathol Clin Res. 2016;2(2):113–124. doi:10.1002/cjp2.41
7. Tafuri A, Shahinian A, Bladt F, et al. ICOS is essential for effective T-helper-cell responses. Nature. 2001;409(6816):105–109. doi:10.1038/35051113
8. Dong C, Juedes AE, Temann UA, et al. ICOS co-stimulatory receptor is essential for T-cell activation and function. Nature. 2001;409(6816):97–101. doi:10.1038/35051100
9. Solinas C, Gu-Trantien C, Willard-Gallo K. The rationale behind targeting the ICOS-ICOS ligand costimulatory pathway in cancer immunotherapy. ESMO Open. 2020;5(1):Jan. doi:10.1136/esmoopen-2019-000544
10. Yoshinaga SK, Whoriskey JS, Khare SD, et al. T-cell co-stimulation through B7RP-1 and ICOS. Nature. 1999;402(6763):827–832. doi:10.1038/45582
11. Metzger TC, Long H, Potluri S, et al. ICOS Promotes the Function of CD4+ effector T Cells during Anti-OX40–mediated tumor rejection. Cancer Res. 2016;76(13):3684–3689. doi:10.1158/0008-5472.CAN-15-3412
12. Zhang Y, Luo Y, Qin SL, et al. The clinical impact of ICOS signal in colorectal cancer patients. Oncoimmunology. 2016;5(5):e1141857. doi:10.1080/2162402X.2016.1141857
13. Urakawa S, Yamasaki M, Makino T, et al. The impact of ICOS(+) regulatory T cells and Helicobacter pylori infection on the prognosis of patients with gastric and colorectal cancer: potential prognostic benefit of pre-operative eradication therapy. Cancer Immunol Immunother. 2021;70(2):443–452. doi:10.1007/s00262-020-02696-4
14. Hanzelmann S, Castelo R, Guinney J. GSVA: gene set variation analysis for microarray and RNA-seq data. BMC Bioinform. 2013;14:7. doi:10.1186/1471-2105-14-7
15. Bindea G, Mlecnik B, Tosolini M, et al. Spatiotemporal dynamics of intratumoral immune cells reveal the immune landscape in human cancer. Immunity. 2013;39(4):782–795. doi:10.1016/j.immuni.2013.10.003
16. Barbie DA, Tamayo P, Boehm JS, et al. Systematic RNA interference reveals that oncogenic KRAS-driven cancers require TBK1. Nature. 2009;462(7269):108–112. doi:10.1038/nature08460
17. Yu G, Wang LG, Han Y, He QY. clusterProfiler: an R package for comparing biological themes among gene clusters. OMICS. 2012;16(5):284–287. doi:10.1089/omi.2011.0118
18. Zhang Y, Zhang X, Jin Z, et al. Clinical impact of X-ray repair cross-complementary 1 (XRCC1) and the immune environment in colorectal adenoma-carcinoma pathway progression. J Inflamm Res. 2021;14:5403–5417. doi:10.2147/JIR.S331010
19. Tsuchiya K, Yoshimura K, Inoue Y, et al. YTHDF1 and YTHDF2 are associated with better patient survival and an inflamed tumor-immune microenvironment in non-small-cell lung cancer. Oncoimmunology. 2021;10(1):1962656. doi:10.1080/2162402X.2021.1962656
20. Kocarnik JM, Shiovitz S, Phipps AI. Molecular phenotypes of colorectal cancer and potential clinical applications. Gastroenterol Rep. 2015;3(4):269–276. doi:10.1093/gastro/gov046
21. Ogino S, Fuchs CS, Giovannucci E. How many molecular subtypes? Implications of the unique tumor principle in personalized medicine. Expert Rev Mol Diagn. 2012;12(6):621–628. doi:10.1586/erm.12.46
22. Martinez-Useros J, Garcia-Foncillas J. Obesity and colorectal cancer: molecular features of adipose tissue. J Transl Med. 2016;14:21. doi:10.1186/s12967-016-0772-5
23. Roy HK, Turzhitsky V, Wali R, et al. Spectral biomarkers for chemoprevention of colonic neoplasia: a placebo-controlled double-blinded trial with aspirin. Gut. 2017;66(2):285–292. doi:10.1136/gutjnl-2015-309996
24. Hwang HS, Kim D, Choi J. Distinct mutational profile and immune microenvironment in microsatellite-unstable and POLE-mutated tumors. J Immunother Cancer. 2021;9(10):Oct. doi:10.1136/jitc-2021-002797
25. Lohning M, Hutloff A, Kallinich T, et al. Expression of ICOS in vivo defines CD4+ effector T cells with high inflammatory potential and a strong bias for secretion of interleukin 10. J Exp Med. 2003;197(2):181–193. doi:10.1084/jem.20020632
26. Ito T, Hanabuchi S, Wang YH, et al. Two functional subsets of FOXP3+ regulatory T cells in human thymus and periphery. Immunity. 2008;28(6):870–880. doi:10.1016/j.immuni.2008.03.018
27. Craig SG, Humphries MP, Alderdice M, et al. Immune status is prognostic for poor survival in colorectal cancer patients and is associated with tumour hypoxia. Br J Cancer. 2020;123(8):1280–1288. doi:10.1038/s41416-020-0985-5
28. Viveiros N, Flores BC, Lobo J, et al. Detailed bladder cancer immunoprofiling reveals new clues for immunotherapeutic strategies. Clin Transl Immunology. 2022;11(9):e1402. doi:10.1002/cti2.1402
29. Nagase H, Takeoka T, Urakawa S, et al. ICOS(+) Foxp3(+) TILs in gastric cancer are prognostic markers and effector regulatory T cells associated with Helicobacter pylori. Int J Cancer. 2017;140(3):686–695. doi:10.1002/ijc.30475
30. Faget J, Bendriss-Vermare N, Gobert M, et al. ICOS-ligand expression on plasmacytoid dendritic cells supports breast cancer progression by promoting the accumulation of immunosuppressive CD4+ T cells. Cancer Res. 2012;72(23):6130–6141. doi:10.1158/0008-5472.CAN-12-2409
31. Han Y, Dong Y, Yang Q, et al. Acute myeloid leukemia cells express ICOS ligand to promote the expansion of regulatory T cells. Front Immunol. 2018;9:2227. doi:10.3389/fimmu.2018.02227
32. Liu X, Yu H, Yan C, et al. Plasmacytoid dendritic cells and ICOS(+) Regulatory T cells predict poor prognosis in gastric cancer: a pilot study. J Cancer. 2019;10(26):6711–6715. doi:10.7150/jca.34826
33. Yan K, Bai B, Ren Y, et al. The comparable microenvironment shared by colorectal adenoma and carcinoma: an evidence of stromal proteomics. Front Oncol. 2022;12:848782. doi:10.3389/fonc.2022.848782
34. Zhu XW, Zhu HZ, Zhu YQ, Feng MH, Qi J, Chen ZF. Foxp3 expression in CD4(+)CD25(+)Foxp3(+) regulatory T cells promotes development of colorectal cancer by inhibiting tumor immunity. J Huazhong Univ Sci Technolog Med Sci. 2016;36(5):677–682. doi:10.1007/s11596-016-1644-1
35. Kornete M, Sgouroudis E, Piccirillo CA. ICOS-dependent homeostasis and function of Foxp3+ regulatory T cells in islets of nonobese diabetic mice. J Immunol. 2012;188(3):1064–1074. doi:10.4049/jimmunol.1101303
36. Chen Y, Shen S, Gorentla BK, Gao J, Zhong XP. Murine regulatory T cells contain hyperproliferative and death-prone subsets with differential ICOS expression. J Immunol. 2012;188(4):1698–1707. doi:10.4049/jimmunol.1102448
37. Alspach E, Lussier DM, Miceli AP, et al. MHC-II neoantigens shape tumour immunity and response to immunotherapy. Nature. 2019;574(7780):696–701. doi:10.1038/s41586-019-1671-8
 © 2023 The Author(s). This work is published and licensed by Dove Medical Press Limited. The
full terms of this license are available at https://www.dovepress.com/terms
and incorporate the Creative Commons Attribution
- Non Commercial (unported, 3.0) License.
By accessing the work you hereby accept the Terms. Non-commercial uses of the work are permitted
without any further permission from Dove Medical Press Limited, provided the work is properly
attributed. For permission for commercial use of this work, please see paragraphs 4.2 and 5 of our Terms.
© 2023 The Author(s). This work is published and licensed by Dove Medical Press Limited. The
full terms of this license are available at https://www.dovepress.com/terms
and incorporate the Creative Commons Attribution
- Non Commercial (unported, 3.0) License.
By accessing the work you hereby accept the Terms. Non-commercial uses of the work are permitted
without any further permission from Dove Medical Press Limited, provided the work is properly
attributed. For permission for commercial use of this work, please see paragraphs 4.2 and 5 of our Terms.