Back to Journals » Journal of Inflammation Research » Volume 18
ICAM1-Mediated Endothelial Cells and Macrophage Interactions in Modulating GBM Malignant Transformation
Authors Li J, Liang T, Liang B, Kang X, Wu W, Wang H, Yang H, Wang Y, Ma W ![]()
Received 4 June 2025
Accepted for publication 21 October 2025
Published 5 November 2025 Volume 2025:18 Pages 15409—15427
DOI https://doi.org/10.2147/JIR.S544632
Checked for plagiarism Yes
Review by Single anonymous peer review
Peer reviewer comments 3
Editor who approved publication: Dr Felix Marsh-Wakefield
Junlin Li,1,2,* Tingyu Liang,1,* Bo Liang,3,4,* Xiaoman Kang,1 Wenbo Wu,1 Hai Wang,1 Huiyu Yang,1 Yu Wang,1,5 Wenbin Ma1,5
1Department of Neurosurgery, Peking Union Medical College Hospital, Chinese Academy of Medical Sciences and Peking Union Medical College, Beijing, People’s Republic of China; 2Eight-Year Medical Doctor Program, Chinese Academy of Medical Sciences and Peking Union Medical College, Beijing, 100730, People’s Republic of China; 3Department of Neurosurgery, Beijing Ditan Hospital, Capital Medical University, Beijing, People’s Republic of China; 4National Center for Infectious Disease, Beijing Ditan Hospital, Capital Medical University, Beijing, People’s Republic of China; 5China Anti-Cancer Association Specialty Committee of Glioma, Beijing, 100730, People’s Republic of China
*These authors contributed equally to this work
Correspondence: Yu Wang, Department of Neurosurgery, Peking Union Medical College Hospital, Dongcheng District, Beijing, People’s Republic of China, Email [email protected] Wenbin Ma, Department of Neurosurgery, Peking Union Medical College Hospital, Dongcheng District, Beijing, People’s Republic of China, Email [email protected]
Background: Glioblastoma (GBM) recurs frequently as the most common primary malignant brain tumor. Microvascular proliferation is a hallmark of GBM. Endothelial cells contribute to the tumor microenvironment (TME) in primary GBM and promote malignancy. However, their role in recurrent GBM (rGBM) remains unclear.
Methods: An analysis was made of single-cell RNA data from GSE182109. Endothelial cells were isolated. Subclusters underwent differential expression and pseudotime trajectory analysis for the identification of signature genes. TCGA data confirmed the expression patterns and prognostic significance of signature genes. Immunofluorescence was performed on matched primary-recurrent GBM samples. Signature genes were knocked down in human umbilical vein endothelial cells (HUVECs). Co-culture experiments with THP-1 and U87 cells explored crosstalk mechanisms and their potential upstream and downstream pathways.
Results: Two endothelial cell clusters were identified in single-cell analysis. Cluster 1 showed an elevation in rGBM and was associated with a poorer prognosis. Pseudotime analysis identified intercellular adhesion molecule-1 (ICAM1) as a signature gene. ICAM1 was up-regulated in rGBM, which was likely due to hypoxia. The knockdown of ICAM1 in endothelial cells reduced the adhesion of bone marrow-derived macrophages (BMDMs). Meanwhile, adrenomedullin (ADM) expression was decreased by lowering CCL2. Co-culture experiments demonstrated that macrophage-secreted ADM facilitated angiogenesis and the proliferation and migration of tumor cells.
Conclusion: This study suggests that hypoxia induces endothelial cells to upregulate the expression of ICAM1 during GBM recurrence and facilitates the recruitment of BMDMs. Concurrently, endothelial-derived CCL2 induces the expression of ADM in BMDMs. This macrophage-derived ADM, in turn, accelerates angiogenesis in endothelial cells while enhancing the proliferation and migration of tumor cells. These results elucidate a feedforward loop in the endothelial-BMDM-tumor cell axis, and provide mechanistic insights into the TME of rGBM.
Plain Language Summary: GBM, the most aggressive brain tumor, often relapses after treatment. Microvascular proliferation is an important feature of GBM. These endothelial cells play a key role in shaping the tumor environment. Nevertheless, the changes in these cells during tumor recurrence are not fully understood.
In this study, single-cell data from GBM patients were analyzed to explore the behavior of endothelial cells. It was found that two main types of endothelial cells exist in GBM, and the type that increases during tumor recurrence is linked to a worse outcome for patients. It was identified that a gene called ICAM1 is up-regulated in this group of endothelial cells. This result was also found in patient samples. It was confirmed that ICAM1 is also elevated in rGBM, and its higher levels are associated with poorer patient prognosis. Moreover, hypoxia may lead to an increase of ICAM1.
Research was also conducted on how endothelial cells interact with other cells, particularly macrophages, which are the most immune cells. It was discovered that ICAM1 attracts macrophages. In the meantime, these endothelial cells secrete CCL2, which promotes the expression of ADM in macrophages. In turn, macrophages release ADM to promote blood vessel growth and also facilitate the growth and movement of cancer cells.
The findings show that a complex feedback loop, where endothelial cells, macrophages and tumor cells work together to support tumor growth, exists in rGBM. This understanding could bring about new ways to target these interactions and improve treatment for patients with rGBM.
Keywords: glioblastoma, endothelial cells, intercellular adhesion molecule 1, adrenomedullin
Introduction
Glioma is regarded as the most common primary malignant brain tumor, among which glioblastoma (GBM) is classified as World Health Organization (WHO) grade 4 and constitutes the highest proportion.1 GBM patients generally exhibit a poor prognosis, and their median overall survival (mOS) is only 14–16 months.2 According to current standard therapy, patients with GBM need to receive maximal surgical resection followed by temozolomide chemoradiotherapy and radiotherapy. Nonetheless, tumor recurrence is virtually inevitable after this therapy.3 Understanding the mechanisms that drive GBM recurrence and developing targeted therapies accordingly are critical unmet needs in the field.
Due to its rapid growth, GBM continuously releases pro-angiogenic factors like vascular endothelial growth factor (VEGF) and epidermal growth factor (EGF) to stimulate microvascular proliferation.4 Consequently, endothelial cells have emerged as key components of the tumor microenvironment (TME) in GBM. Notably, microvascular proliferation is a diagnostic histopathological hallmark of GBM.3
Conversely, endothelial cells actively regulate the behavior of GSCs, with spatial analyses consistently locating GSCs in perivascular niches.5 Endothelial cells stimulate oncogenic pathways in a direct way to promote tumor progression.6 At the same time, paracrine factors secreted by endothelial cells may enhance the invasiveness and resistance of GSCs to therapy.7,8 Studies have shown that the lack of effect of temozolomide (TMZ) on the tumor vascular system may trigger tumor recurrence after TMZ treatment.9 Collectively, these findings position endothelial cells as the critical mediators of tumor recurrence.
Beyond direct tumor interactions, endothelial cells influence the TME by modulating the infiltration of immune cells and forming potential feedback loops with immune cells.10,11 Unlike normal vasculature, endothelial cells associated with GBM display tortuosity, dilation, leakiness and other distinct histopathological abnormalities.12 These activated endothelial cells demonstrate a pro-inflammatory phenotype, which expedites the recruitment of bone marrow-derived macrophages (BMDMs).13 Intriguingly, this endothelial activation is likely to be driven by inflammatory cytokines from BMDMs, which ultimately confers resistance to anti-angiogenic therapies.14 However, it remains poorly understood how endothelial cells evolve during GBM recurrence and subsequently remodel the TME. Clinically, angiogenesis biomarkers in peripheral blood, including VEGF, placenta growth factor (PlGF), soluble vascular endothelial growth factor receptor 1 (sVEGFR1) and sVEGFR2, have been linked to patient prognosis and are potential pharmacodynamic biomarkers.15–17 Additionally, bevacizumab, as an anti-VEGF therapeutic, has been approved by the Food and Drug Administration (FDA) for clinical treatment because of its ability to extend progression-free survival (PFS) in recurrent GBM (rGBM) patients.18 Moreover, a number of clinical trials that target rGBM are based on bevacizumab combined with other therapies.19–21 These findings signify that therapeutic advancements targeting endothelial cells probably provide rGBM patients with a viable treatment option.
In the present study, the focus was on the changes in the composition, function and related differentiation of endothelial cells in primary and recurrent GBM. In addition, intercellular cell adhesion molecule-1 (ICAM1) was identified as a pivotal molecule in endothelial cells during GBM recurrence. As a cell surface glycoprotein, ICAM1 is primarily expressed in vascular endothelial and immune cells.22 It facilitates the adhesion of BMDMs to cross the endovascular barrier and reach the TME. ICAM1 also alters the secretion of inflammatory factors, which thereby regulates the phenotype of BMDMs.23 Previous studies have shown that the cerebrospinal fluid and peripheral blood of GBM patients exhibit a significant increase in soluble ICAM1 levels compared to those of normal individuals and patients with grade 3 glioma.24 Small-scale studies have also indicated that ICAM-1 levels parallel chemotherapy response levels in patients.25,26 A distinct ICAM1+ endothelial cell cluster expanding significantly in rGBM, correlating with poor prognosis and potentially orchestrating BMDM adhesion and phenotypic reprogramming, was identified. This elevation may be caused by hypoxia. Co-culture assays revealed that ICAM1+ endothelial cells not only recruit BMDMs but also secrete chemokine (C-C motif) ligand 2 (CCL2) to induce the BMDM overexpression of adrenomedullin (ADM). These ADM-high macrophages, in turn, promote angiogenesis in endothelial cells and enhance the malignancy of tumor cells, and establish a vicious feedforward loop driving recurrence.
Materials and Methods
Sample Collection and Data Acquisition
Primary and recurrent GBM paired samples were gathered from three patients at Ditan Hospital and Peking Union Medical College Hospital. The histopathological diagnoses of GBM were confirmed by neuropathologists through the hematoxylin and eosin staining of formalin-fixed, paraffin-embedded tissue sections. This study gained the approval of the institutional review boards of both hospitals. Written informed consent was obtained from every patient. The Cancer Genome Atlas (TCGA) GBM cohort of 159 patients, including 156 with complete follow-up data, was obtained from the TCGA database. Single-cell ribonucleic acid (RNA) sequencing (scRNA-seq) data from the Gene Expression Omnibus (GSE182109) were used, and contained 201,986 cells from 44 tumor samples of 18 GBM patients. Spatial transcriptomics data were downloaded from GSE237183.
Bulk Sample Analysis
For bulk sample analysis, single-sample gene-set enrichment analysis (ssGSEA) was performed using log2-transformed TPM data. The AnnotationDbi package was utilized to retrieve gene sets from the Gene Ontology (GO) database. For immune microenvironment analysis, the CIBERSORTx tool (https://cibersortx.stanford.edu/) was adopted to analyze TPM data. Statistical comparisons between samples were made with t-tests after Levene’s test for variance homogeneity. Survival analysis used Kaplan-Meier and Cox regression methods, and calculated mOS, hazard ratio (HR) and p-values.
Single-Cell and Spatial Transcriptomics Analysis
Seurat v5.1.0 was employed to process single-cell and spatial transcriptomics data. Additional quality control steps were applied: cells with nFeature <500 or >7,000, mitochondrial gene expression >10%, erythrocyte gene expression >3% or nCount <1,000 were removed, along with the bottom 3% of cells on the basis of nCount. Principal component analysis (PCA) and Harmony integration were performed after data normalization and feature selection, with t-Distributed Stochastic Neighbor Embedding (t-SNE) for visualization. Marker genes were identified using FindAllMarkers, and malignant/non-malignant cells were distinguished using inferCNV. Pseudotime trajectory analysis was carried out with Monocle (v2.28.0); ndGBM was used as the starting point; branch-dependent expression patterns were analyzed. CellChat v2.1.2 was leveraged to assess cell-cell communication. For spatial transcriptomics data, SCTransform normalization was performed, and the gene expression levels were subsequently visualized.
Protein Interaction Prediction
Protein interactions were predicted using the STRING database (https://www.string-db.org/) for Homo sapiens. The interaction network was visualized on the STRING website.
Immunofluorescence
Paraffin-embedded tissue sections were dewaxed with xylene, followed by ethanol and rehydration. Antigens were retrieved using ethylene diamine tetraacetic acid (EDTA) buffer (ZLI-9069, ZSGB-BIO). Blocking with hydrogen peroxide and goat serum (C0265, Beyotime) was followed by antibody incubation for ICAM1 (ab282575, Abcam; 1:1,500) and CD31 (ab281583, Abcam; 1:3,000). Horse radish peroxidase (HRP)-polymer secondary antibodies (AFIHC003, AiFang) were used. Fluorescent labeling was achieved by the use of red and green dyes (C0034, Applygen), and dihydrochloride (DAPI) (C1002, Beyotime) was used for counterstaining. Sections were mounted with anti-fade medium (P0126, Beyotime) for microscopic examination.For cultured cells, fixation (P0098, Beyotime), permeabilization (P0097, Beyotime) and blocking (P0102, Beyotime) were performed as per the protocol. These steps were followed by overnight incubation with ADM antibody (10778, Proteintech; 1:100). Fluorescent labeling was completed using anti-rabbit AF488 (P0176, Beyotime), and DAPI (C1002, Beyotime) was used for counterstaining. ImageJ 1.5.4 and the ScatterJ plugin were applied to analyze images.
Cell Culture
Tohoku Hospital Pediatrics-1 (THP-1) cells were supplied by the Cell Culture Bank of Peking Union Medical College. They were cultured in RPMI-1640 medium (C11875500BT, Gibco) with 10% fetal bovine serum (FBS), and induced to adhere with 100 ng/mL Phorbol 12-myristate 13-acetate (HY-18739, ECM). Sourced from the same bank, primary human umbilical vein endothelial cells (HUVECs) were cultured in specialized endothelial cell medium (4101, ScienCell), added with FBS, epithelial growth supplement and penicillin/streptomycin solution. Only P5-P9 HUVECs were used.
Gene Knockdown
Small interfering RNAs (SiRNAs) and transfection reagent (G04008, GP-transfect-Mate) from GenePharma were used for gene knockdown in HUVECs or phorbol-12-myristate-13-acetate (PMA)-induced THP-1 cells in accordance with the protocol of the manufacturer. Sequences are provided in the Supplementary Table 1.
Quantitative Polymerase Chain Reaction Analysis
The RNAprep Pure RNA extraction kit (A0808A, TianGen) was employed to extract total RNA. A reverse transcription kit (K1621, Thermo Scientific) was utilized to synthesize complementary deoxyribonucleic acid (cDNA). Real-time polymerase chain reaction (PCR) was performed using PowerUp™ SYBR™ Green Master Mix (A25742, Thermo Scientific) on a Thermo Fisher QuantStudio 5 system. Glyceraldehyde-3-phosphate dehydrogenase (GAPDH) (GAPDH, Abcam) was taken as the internal control. Expression differences were calculated using ΔΔCT values. Statistical significance was evaluated using t-tests after Levene’s variance test.
Protein Detection
For Western blotting, radioimmunoprecipitation assay (RIPA) buffer (R0010, Solarbio) was used to prepare whole-cell lysates that were mixed with 5×sodium dodecyl sulfate-polyacrylamide gel electrophoresis (SDS-PAGE) loading buffer (B1012, Applygen) and separated by 10% SDS-PAGE (PG112, EpiZyme). Proteins were transferred to a polyvinylidene fluoride (PVDF) membrane (EQ00010, Millipore) and blocked with 5% non-fat milk (B1009, Applygen) in Tris-Borate-Sodium Tween-20 (TBST). After incubation with primary antibodies, HRP-conjugated secondary antibodies (ZB-2305, ZB-2301, ZSGB-BIO) were applied. Clarity Western ECL Substrate (170–5061, BIO-RAD) was used for visualizing protein bands on a ChemiDoc system. For the enzyme-linked immunosorbent assay (ELISA), cell culture medium was analyzed using an ELISA kit (E-EL-H0275, Elabscience).
Macrophage-Endothelial Cell Adhesion Assay
After being fluorescently labeled with a red membrane staining kit (C1991S, Beyotime), THP-1 cells (2×10^5 cells/mL) were subjected to one-hour incubation with endothelial cell monolayers. Phosphate Buffered Saline (PBS) was used for the removal of non-adherent cells. Adherent cells were quantified by microscopic examination. Adhesion capacity was expressed as the number of THP-1 cells per HUVEC.
Cell Co-Culture
After 24-hour gene knockdown, conditioned medium was transferred to recipient cells for an additional 24-hour incubation. After a further 24-hour co-culture, subsequent experiments were performed.
Angiogenesis Assay
Matrigel matrix (356234, Corning) was plated in 24-well plates and allowed to polymerize for 1 hour. In addition, 5×10^4 induced HUVECs were seeded onto it. Tube formation was assessed after 4-hour incubation by microscopic imaging.
Transwell Migration Assay
U87 cells were subjected to 24-hour co-culture with THP-1 conditioned medium and then seeded into the upper chamber of a Transwell insert (3422, Corning). After 12 hours of incubation, cells were fixed and stained with crystal violet solution (G1061, Solarbio). Cell migration was quantified by microscopic imaging.
Cell Counting Kit-8 Assay
U87 cells were seeded in 96-well plates at 2×10^4 cells/mL (2,000 cells/well). The Cell Counting Kit-8 (CCK-8) reagent (CK04, Dojindo) was used to assess cell viability 24 hours later. A microplate reader was utilized to measure absorbance at 450 nm. After the culture medium was replaced with THP-1 conditioned medium, CCK-8 assays were performed daily, and absorbance values were compared across days. The t-test was used to calculate statistical significance.
Statistical Analysis
Intergroup comparisons were made after Levene’s test for variance equality. The t-test was performed in light of the variance assumptions. Pearson’s correlation method was used for correlation analyses.
Result
Up-regulation of Angiogenesis Regulation in rGBM and Its Association with the Infiltration of Diverse Immune Cells
In the current study, scRNA-seq data from primary and rGBM were utilized to investigate the role of angiogenesis in driving GBM recurrence, and rigorously validated in clinical samples and cell experiments. The detailed workflow is shown in Figure 1a.
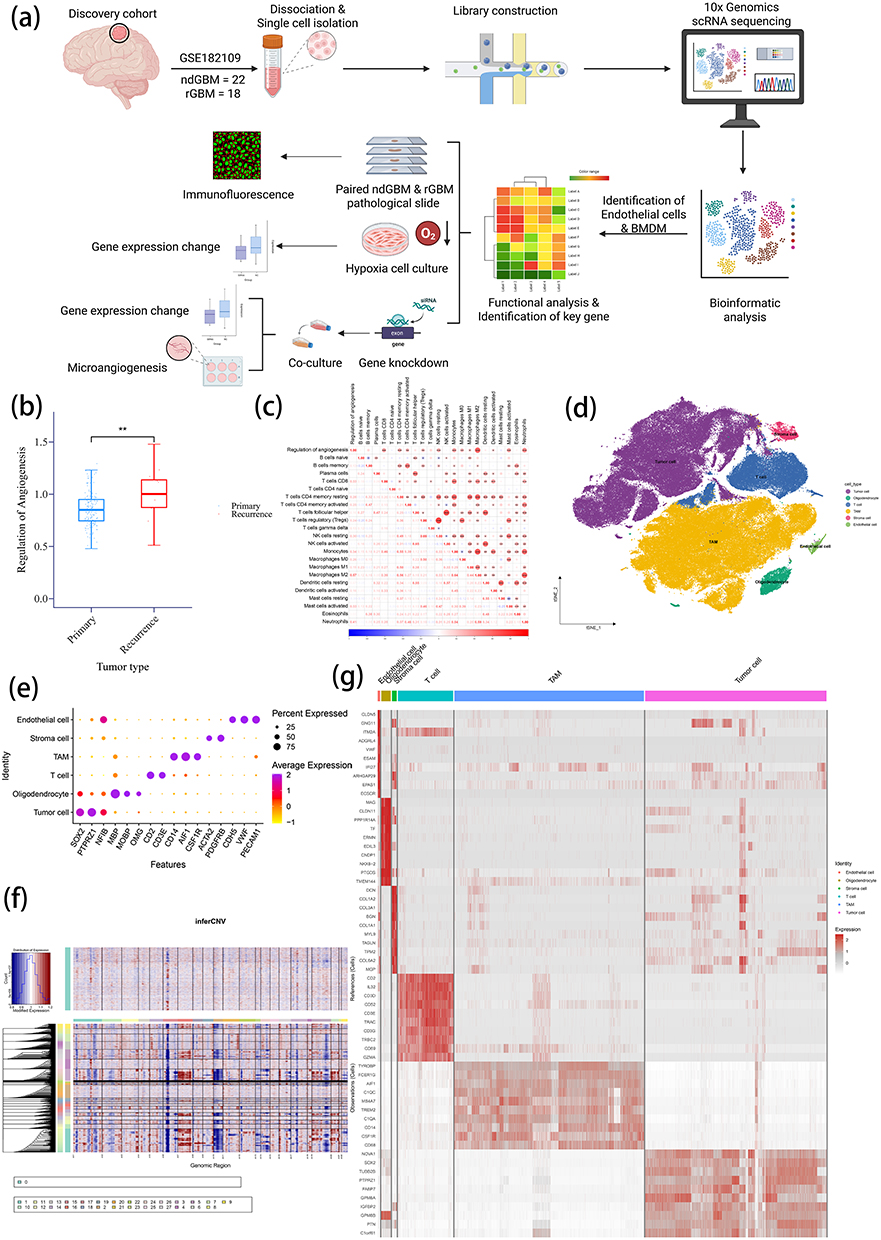 |
Figure 1 Enhanced angiogenesis pathways in recurrent GBM and clustering for scRNA. (a) Overall workflow of the study. (b) Comparison of Regulation of Angiogenesis scores between primary and recurrent GBM in the TCGA cohort using ssGSEA. (c) Correlation analysis between Regulation of Angiogenesis scores and 22 immune cell scores. (d) t-SNE plot of scRNA-seq data (GSE182109). (e) Expression patterns of marker genes across cell types. (f) InferCNV analysis to identify malignant cells. (g) Heatmap displaying the top 10 characteristic genes for each cell type. Note: **P <0.01. |
To comprehensively compare angiogenesis regulation between primary and rGBM, the Regulation of Angiogenesis pathway gene set (GO:0045765) was obtained from the GO database, and ssGSEA was performed based on this gene set (Supplementary Table 2). The results revealed a marked up-regulation of the Regulation of Angiogenesis pathway in rGBM (Figure 1b). CIBERSORTx was used to evaluate the enrichment scores of 22 immune cell subtypes, with a view to further exploring the mechanistic role of angiogenesis regulation in shaping the TME. The analysis uncovered that angiogenesis regulation is positively correlated with multiple immune cell populations. Such immune cell populations encompass neutrophils, CD8+ T cells, resting and activated CD4+ memory T cells, regulatory T cells, resting natural killer cells, monocytes, M0/M1/M2 macrophages, activated dendritic cells and activated mast cells (Figure 1c). These findings suggest a potential mechanistic link between angiogenesis and immune modulation in the TME.
For the purpose of further investigating the TME, scRNA-seq data from the GSE182109 dataset were analyzed. The dataset includes a variety of primary and recurrent GBM samples (Supplementary Figure 1). The unsupervised clustering of the scRNA-seq data revealed different cell populations (Figure 1d). Cell clustering was performed on single-cell data. By examining characteristic gene expression patterns, the following cell types were identified: tumor cells (SOX2, TPRZ1 and NKIB), oligodendrocytes (MBP, MOBP and OMG), T cells (CD2 and CD3E), tumor-associated macrophages (CD14, AIF1 and CSF1R), stromal cells (ACTA2 and PDGFRB) and endothelial cells (CDH5, VWF and PECAM1) (Figure 1e). Subsequently, InferCNV was employed to further distinguish malignant cells from benign ones for validation (Figure 1f). Beyond that, the top 10 marker genes for each cell type were identified, and a corresponding heatmap was generated. As shown in Figure 1g, characteristic genes exhibited substantial differences among distinct cell populations.
Identification of Endothelial Cell Clusters in rGBM and Their Prognostic Implications
Endothelial cell populations were isolated and reclustered in order to further investigate alterations in endothelial cells during tumor recurrence. As shown in Figure 2a, endothelial cells were classified into two distinct clusters (Endo0 and Endo1). Of note, the proportion of Endo1 showed a marked elevation in rGBM (Figure 2b). The heatmap visualization of the top 10 marker genes for each cluster revealed distinct gene expression profiles between both clusters (Figure 2c).
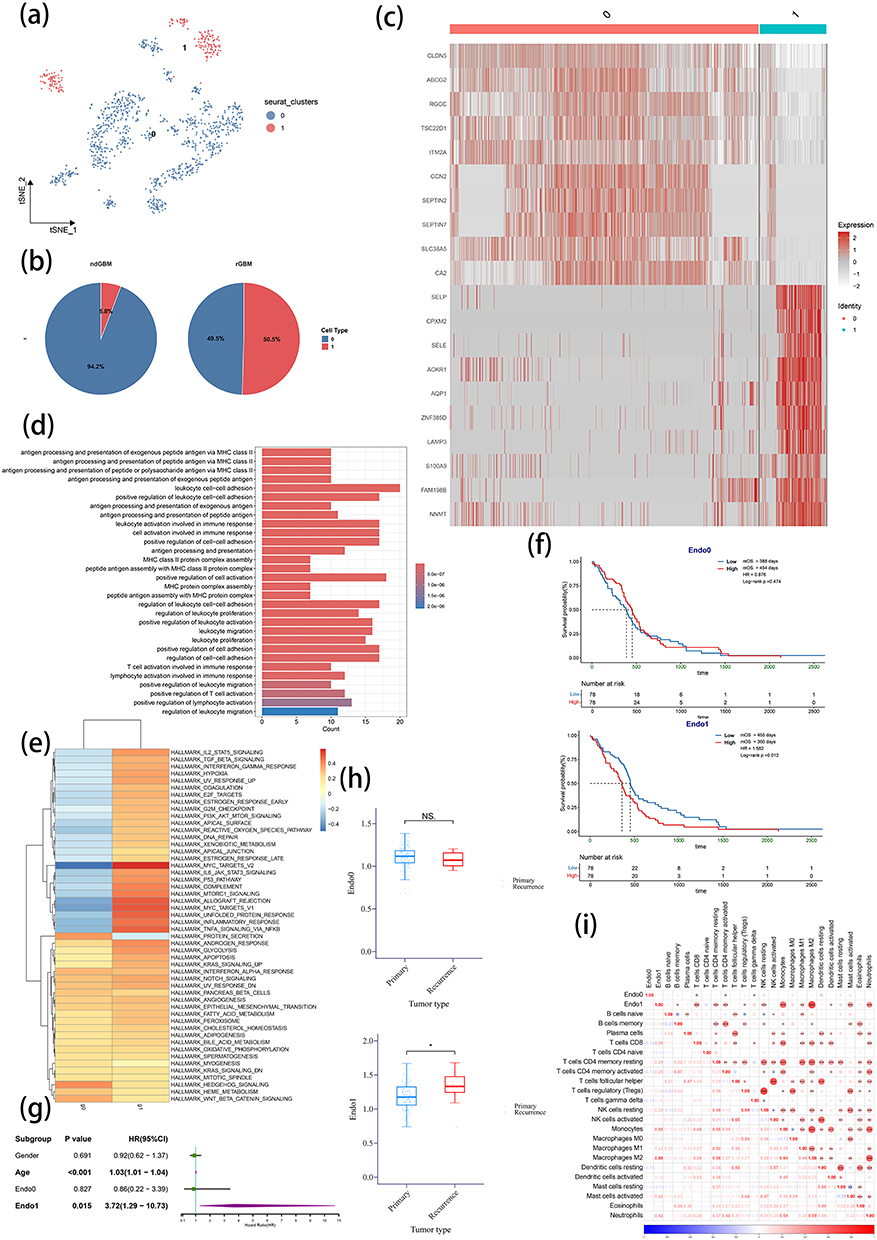 |
Figure 2 Endothelial cell subclustering, characterization, and functional analysis. (a) t-SNE plot of endothelial cell subclustering. (b) Comparison of endothelial cell clusters proportions between primary and recurrent GBM. (c) Heatmap displaying the top 10 characteristic genes in two endothelial clusters. (d) GO enrichment analysis of characteristic genes in Endo1. (e) GSVA analysis using Hallmark gene sets to evaluate functional differences between the two endothelial clusters. (f and g) KM survival analysis (f) and univariate Cox regression analysis (g) of two endothelial cluster scores in TCGA GBM patients. (h) Comparison of two endothelial scores between primary and recurrent GBM in TCGA cohort. (i) Correlation analysis between two endothelial clusters and 22 immune cell scores in TCGA GBM patients. ndGBM, newly diagnosed GBM (primary GBM); rGBM, recurrent GBM. Notes: nsP >0.05 and *P <0.05. |
The functional annotation of cluster-specific marker genes showed that Endo1 was enriched in immune-related pathways such as antigen presentation, T cell regulation, and leukocyte adhesion and activation (Figure 2d). In contrast, Endo0 was primarily enriched in pathways related to transporter activity, growth factor binding, and cytoskeletal organization (Supplementary Figure 2). Gene Set Variation Analysis (GSVA) further verified that Endo1 exhibited significantly higher activation levels in IL-2 and IL-6 signaling, interferon-γ response, TNF-α pathway and immune response networks compared with Endo0 (Figure 2e).
To further investigate the importance of Endo1, gene sets were constructed based on the marker genes of both clusters, and ssGSEA scoring was performed on TCGA GBM data. A dichotomous approach was taken to divide the scores into high and low groups. Survival analysis showed a poorer prognosis of patients with high Endo1 scores (Low vs High: mOS: 455 vs 360 days, P=0.012), but no prognostic difference was detected for Endo0 (Low vs High: mOS: 388 vs 454 days, P=0.474) (Figure 2f). Similarly, COX analysis demonstrated prognostic significance for Endo1 (P=0.015) rather than Endo0 (P=0.827) (Figure 2g). The comparison of endothelial cell scores between primary and recurrent GBM revealed significantly higher scores for Endo1 in rGBM, but no significant difference was observed for Endo0 (Figure 2h). The further analysis of immune cell infiltration showed that Endo1 had a significantly positive correlation with the scores of neutrophils, memory B cells, CD8 T cells, memory CD4 T cells, Treg cells, resting NK cells, monocytes, M1 and M2 macrophages, activated dendritic cells and activated mast cells in comparison with Endo0. This suggests the potential immunomodulatory functions of Endo1 (Figure 2i). Finally, the relationship between the two endothelial clusters and molecular mutations was explored. It was noticed that different Isocitrate Dehydrogenase (IDH), +7/-10, telomerase reverse transcriptase (TERT) promoter and O6-methylguanine DNA methyltransferase (MGMT) promoter statuses had no significant effect on Endo1 but did influence Endo0 (Supplementary Figure 3). This indicates that the characteristics of Endo1 endothelial cells in rGBM are not attributed to specific molecular mutations.
Identification of ICAM1 as a Signature Gene in Endo1
To identify signature genes in Endo1, characteristic genes were further screened according to the workflow shown in Figure 3a. Initially, genes with LogFC>1 and Pct difference>0.2 were selected from the results of characteristic genes (Supplementary Table 3). The subsequent Monocle2 pseudotime trajectory analysis of endothelial cells revealed that a majority of Endo1 cells were located at the terminal end of the differentiation trajectory, with branch point 3 representing the critical bifurcation between Endo0 and Endo1 (Figure 3b).
 |
Figure 3 Identification of ICAM1 as a signature gene of Endo1 and its clinical significance. (a) Workflow for identifying signature genes of Endo1. (b) Pseudotime trajectory analysis of endothelial cells, with ndGBM set as the origin. (c) ICAM1 expression in the two cellular fates at branch point 3. (d) ICAM1 expression across all cells (left) and endothelial cells (right). (e) Protein-protein interaction prediction for ICAM1 from the STRING database. (f) Comparison of ICAM1 expression between primary and recurrent GBM in the TCGA cohort. (g) Correlation between ICAM1 expression and the two endothelial cell cluster scores in TCGA GBM. (h) KM survival analysis of ICAM1 expression in TCGA GBM patients. (I and j) Immunofluorescence staining of paired primary-recurrent GBM paraffin-embedded specimens. (i) Representative Immunofluorescence staining image: ICAM1 (red), endothelial marker CD31 (green), and nuclei (DAPI, blue). (j) Statistical results of immunofluorescence staining. The x-axis indicates ICAM1 expression intensity, and the y-axis represents CD31 expression intensity. (k and l) Hypoxia induces ICAM1 expression in HUVECs validated by qPCR (k) and WB (l). ndGBM, newly diagnosed GBM (primary GBM); rGBM, recurrent GBM. Note: *P <0.05. |
Through branch point gene identification, these genes were intersected with the previous selection, and their significant up-regulation in rGBM was confirmed. At last, a set of 15 genes was identified. Based on molecular function and previous studies, ICAM1 was chosen as the focus. Pseudotime trajectory analysis demonstrated differential ICAM1 expression at branch point 3 during the two distinct differentiation processes (Figure 3c).
Expression profiling showed that ICAM1 was predominantly expressed in tumor-associated myeloid cells (TAMs), endothelial cells, and stromal cells, with minimal expression in other cell types. This is consistent with previous findings. Within endothelial cells, ICAM1 displayed characteristic expression in Endo1 (Figure 3d). Functional analysis using the STRING database substantiated that ICAM1 interacts with immune regulators, including CD2, CD58, CD80, ITGB2 and ITGAM. This aligns with the earlier findings about the immunomodulatory potential of Endo1 (Figure 3e).
TCGA data confirmed the significant up-regulation of ICAM1 in rGBM (Figure 3f). ICAM1 expression was positively correlated with Endo1 scores (Figure 3g). High ICAM1 expression predicted poorer patient prognosis (Low vs High: mOS: 468 vs 360 days, P=0.007) (Figure 3h). Finally, the immunofluorescence co-staining of CD31 and ICAM1 in matched primary-rGBM specimens (n=3 pairs, Figure 3i and Supplementary Figure 4) demonstrated that the frequency of ICAM1+ endothelial cells showed a remarkable increase in recurrent samples (Figure 3j). These findings collectively identify ICAM1 as a signature gene in Endo1, possibly playing a crucial role in driving GBM recurrence.
To further examine the mechanism underlying the elevated ICAM1 expression, analysis in Figure 2e showed that Endo1 is a cell subpopulation significantly activated under hypoxic conditions. Given the ubiquity of hypoxia in rGBM, hypoxia may be the driving factor for the transformation of endothelial cells. To validate this hypothesis, HUVECs were cultured in a hypoxic environment with 5% O2. The results demonstrated an obvious increase in ICAM1 expression at RNA (Figure 4k) and protein (Figure 4L) levels after hypoxic culture.
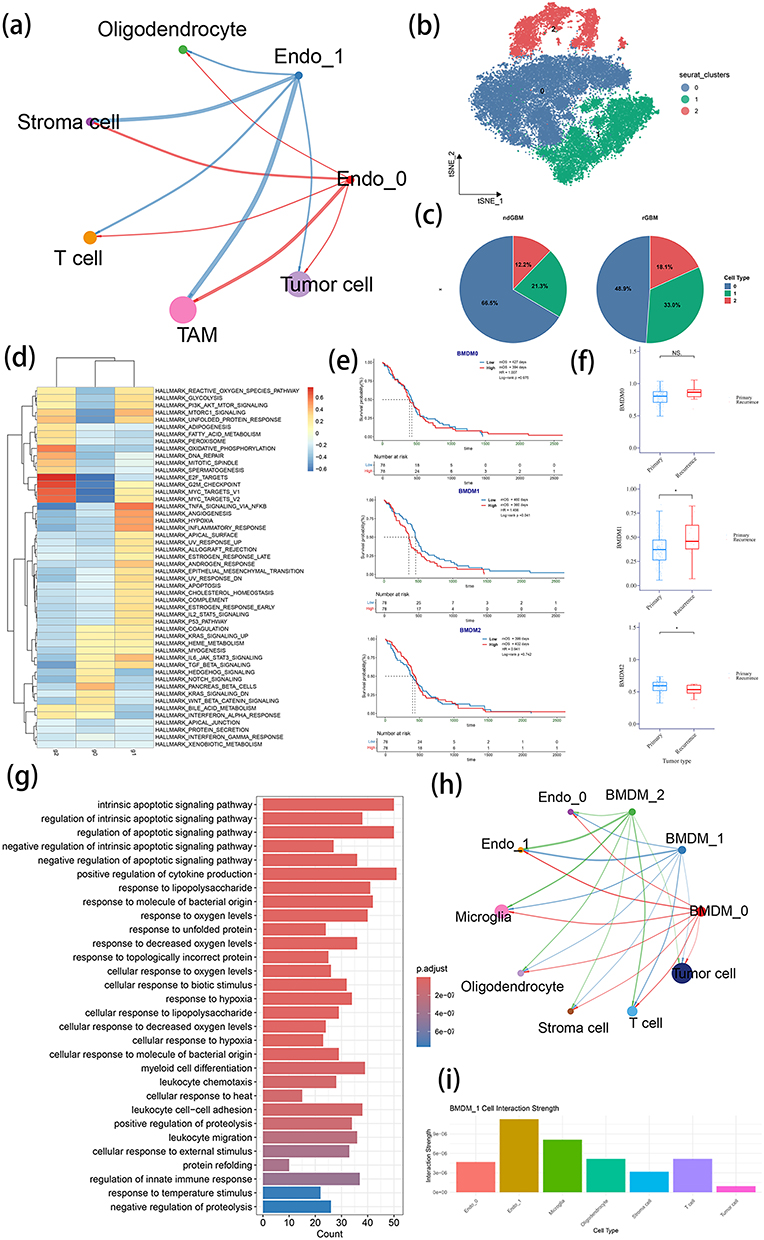 |
Figure 4 Identification of cell types interacting with Endo1 and their functional characterization. (a) Cell-cell communication network among all cell types in TME, Endo0 and Endo1. (b) t-SNE plot of BMDM subclustering. (c) Comparison of BMDM cell clusters proportions between primary and recurrent GBM. (d) GSVA analysis using Hallmark gene sets to evaluate functional differences among three BMDM clusters. (e) KM survival analysis of three BMDM cluster scores in TCGA GBM patients. (f) Comparison of three BMDMs scores between primary and recurrent GBM in TCGA cohort. (g) GO enrichment analysis of signature genes in BMDM1. (h) Cell-cell communication network between two endothelial clusters, three BMDM clusters, and other cell types. (i) Comparison of communication strength between BMDM1 and other cell types. Note: nsP >0.05 and *P <0.05. |
Identification of Cell Populations Interacting with Endo1
To elucidate the role of Endo1 in the TME, cell-cell communication analysis was performed using CellChat. The results demonstrated that Endo1 chiefly interacts with TAMs (Figure 4a). Considering that BMDMs in the TME of GBM enter the tumor via the blood-brain barrier, they inevitably interact with endothelial cells during this process. TAMs were further categorized into BMDMs and microglia (Supplementary Figure 5 and Supplementary Table 4).
The clustering analysis of BMDM revealed three distinct subtypes (BMDM0, BMDM1 and BMDM2) (Figure 4b), with the latter two showing increased proportions in rGBM (Figure 4c). GSVA analysis indicated that BMDM1 was bound up with the activation of hypoxia, angiogenesis, immune response and TNF-α signaling pathways, while BMDM2 showed a relationship with oxidative phosphorylation and lipid metabolism (Figure 4d and Supplementary Figure 6).
The evaluation of BMDM signature genes via the ssGSEA scoring of TCGA data demonstrated correlations between high BMDM1 scores and poor prognosis (Figure 4e). Furthermore, TCGA rGBM exhibited substantially elevated BMDM1 scores but decreased BMDM2 scores (Figure 4f), which suggested that BMDM1 may play a critical role in rGBM.
The functional annotation of BMDM1 genes revealed enrichment in hypoxia, leukocyte migration and cell adhesion pathways (Figure 4g). This is in line with their potential recruitment by the vasculature. Cell communication analysis showed that BMDM1 interacted with Endo1 most strongly compared to tumor cells (Figures 4h and i). This suggests a potential functional partnership between these cell populations in rGBM.
Endothelial Cells Recruit BMDMs through ICAM1 and Promote ADM Expression
To investigate the specific mechanism by which Endo1 affects BMDMs, ligand-receptor interactions in cell communication were analyzed. The results revealed that Endo1 interacts with BMDM through ICAM1, but no such interaction was noted for Endo0 (Figure 5a). Considering the role of ICAM1 as a cell adhesion molecule, the siRNA-mediated knockdown of ICAM1 was performed in primary HUVECs, and knockdown efficiency was confirmed by quantitative PCR (qPCR) and Western blot (Figures 5b and c). By comparison, other adhesion molecules such as vascular cell adhesion molecule-1 (VCAM1), E-selectin (SELE) and P-selectin (SELP) did not show any compensatory up-regulation (Supplementary Figure 7). In co-culture experiments, ICAM1-knockdown HUVECs showed greatly reduced adhesion capacity for THP-1 cells (Figure 5d and e).
Figure 5 Continued. Figure 5 Endo1 recruits BMDMs and promotes their phenotypic transformation to BMDM1. (a) Ligand-receptor interaction analysis between endothelial cell clusters and BMDM clusters using CellChat. (b and c) Validation of ICAM1 knockdown in HUVECs by qPCR (b) and WB (c). (d and e) Cell adhesion assay evaluating THP-1 attachment to control versus ICAM1-knockdown HUVECs. (d) Bright-field and fluorescence microscopy images of THP-1 cells (red under fluorescence). (e) Quantification of THP-1 adhesion efficiency. (f) Pseudotime trajectory analysis of BMDMs, with the origin set to the default value. (g) KM survival analysis of ADM expression in TCGA GBM patients. (h and i) ADM expression in THP-1 cells cultured with conditioned medium from ICAM1-knockdown HUVECs. (h) qPCR analysis of ADM expression in THP-1 cells under two culture conditions. (i) ELISA of ADM expression in THP-1 cells under two culture conditions. (j and k) CCL2 expression in ICAM1 knockdown HUVECs validated by qPCR (j) and WB (k). (l and m) ADM expression in THP-1 with CCL2 stimulation validated by qPCR (l) and ELISA (m). Notes: nsP >0.05, *P <0.05, **P <0.01 and ***P <0.001.
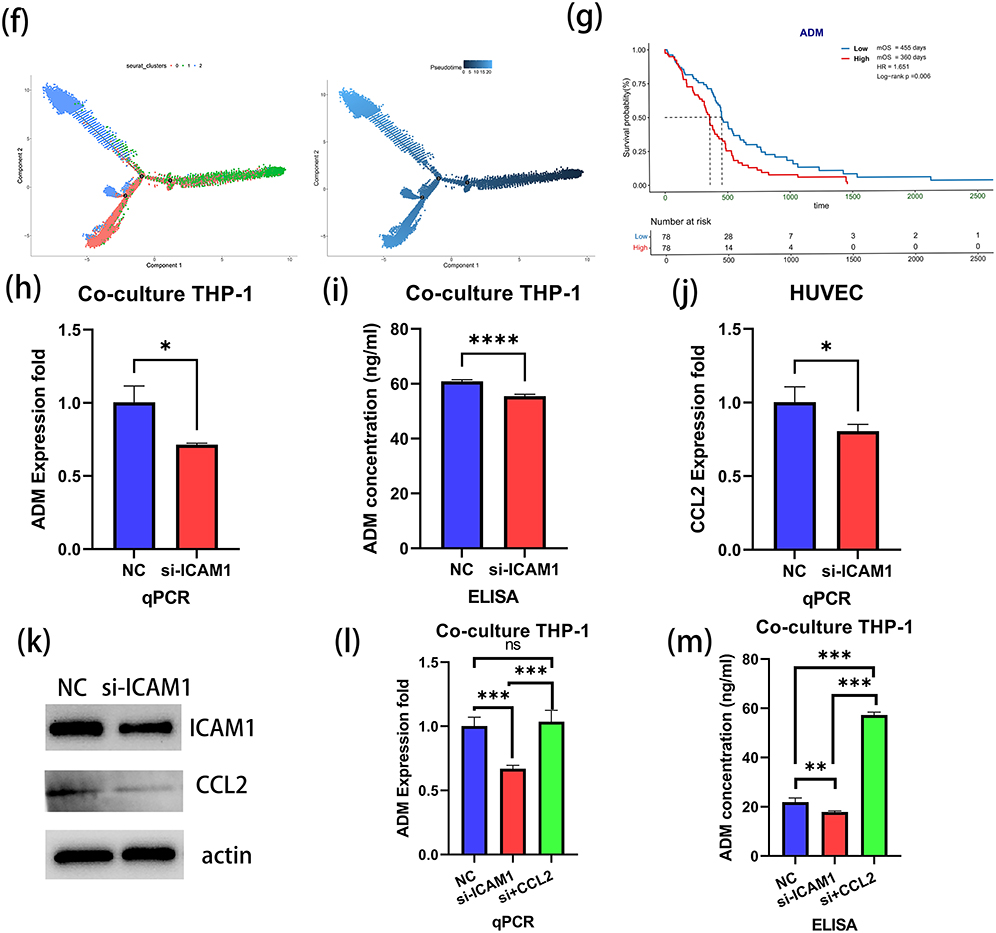
Pseudotime trajectory analysis indicated that BMDM1 was predominantly localized at the terminal end of the differentiation trajectory, which suggested a distinct phenotypic state (Figure 5f). In consideration of the activation of inflammatory pathways in Endo1, it was hypothesized that these cells may promote the polarization of BMDMs toward the BMDM1 phenotype during recruitment. Among the signature genes of BMDM1, the focus was on ADM for further investigation. TCGA data analysis demonstrated that high ADM expression was related to a worse prognosis (Low vs High: mOS: 455 vs 360 days, P=0.006) (Figure 5g). Meanwhile, the spatial transcriptomics data indicated a colocalization between the expression of ADM and ICAM1, and their expression levels were markedly higher in the T1-enhanced region compared with the infiltration zone (Supplementary Figure 8). To validate this finding, THP-1 cells were cultured with conditioned medium from ICAM1-knockdown HUVECs. Both qPCR, ELISA and immunofluorescence analyses testified decreased ADM expression in THP-1 cells exposed to medium from ICAM1-deficient endothelial cells (Figures 5h and i and Supplementary Figure 9).
The endothelial conditioned medium with the knockdown of ICAM1 could induce a decrease in ADM expression in BMDM during indirect co-culture. Therefore, it was hypothesized that the secretion of factors by endothelial cells might be altered upon the inhibition of ICAM1. To explore this, cytokines were screened among the characteristic genes of Endo1 and PCR analysis was conducted. The results showed that the expression of CCL2 decreased after the knockdown of ICAM1 (Figure 5j and Supplementary Figure 10). This finding was further validated at the protein level (Figure 5k). Additionally, co-culture with CCL2 stimulation experiments revealed that CCL2 could stimulate the expression of ADM in BMDMs (Figures 5L and m). These results suggest that CCL2 may be a key factor in endothelial cell-BMDM interactions.
ADM Promotes Angiogenesis in Endothelial Cells and Enhances Tumor Malignant Phenotype
To validate the functional role of ADM, ADM was knocked down in THP-1 cells and knockdown efficiency was confirmed (Figures 6a and 6b and Supplementary Figure 11). Moreover, other factors like vascular endothelial growth factor A (VEGFA) and transforming growth factor-beta (TGFB) did not show any compensatory increase (Supplementary Figure 12). Then, the conditioned medium from ADM-knockdown THP-1 cells was used for co-culturing HUVECs. After 24 hours of co-culture, an angiogenesis assay was performed. The results showed that the conditioned medium from ADM-knockdown THP-1 cells impaired the angiogenic capacity of HUVECs to a large extent (Figure 6c). In parallel, U87 cells were co-cultured with the conditioned medium from ADM-knockdown THP-1 cells. The findings uncovered that the proliferation of U87 cells was dramatically suppressed when cultured with the ADM-knockdown medium (Figure 6d), and their migratory ability was also reduced to a great degree. These results suggest that ADM not only modulates angiogenesis but also exerts an influence on the malignant phenotype of tumor cells (Figure 6e). Similarly, stimulation with ADM alone could promote angiogenesis in HUVECs and enhance the migration ability of U87 cells (Supplementary Figure 13).
 |
Figure 6 Effects of ADM on HUVECs and U87 cells. (a and b) Validation of ADM knockdown in THP-1 cells by qPCR (a) and ELISA (b). (c) Angiogenesis assay of HUVECs cultured with conditioned medium from ADM-knockdown THP-1 cells. (d) CCK-8 proliferation assay of U87 cells cultured with conditioned medium from ADM-knockdown THP-1 cells. (e and f) Transwell migration assay of U87 cells cultured with conditioned medium from ADM-knockdown THP-1 cells. (e) Cell migration assay observed under 10× magnification. (f) Statistical results of cell migration. (g) Schematic diagram of working model (created with BioRender.com). Note: **P <0.01 and ***P <0.001. |
Discussion
GBM, which is the most common primary malignant brain tumor, is linked to a poor prognosis and a high recurrence rate despite current therapeutic interventions. As a consequence, alterations in the tumor during recurrence have garnered significant attention.
In this study, the changes in endothelial cells during recurrence and their underlying mechanisms in mediating crosstalk between the immune microenvironment and tumor cells were elucidated. It was first demonstrated that endothelial cells undergo phenotypic changes during recurrence and feature up-regulated ICAM1 expression. This transformation may be induced by hypoxia. Previous research has shown that hypoxia can promote ICAM1 expression in endothelial cells under inflammatory stimulation.27 In addition, rGBM is characterized by a more pronounced hypoxic microenvironment compared with primary GBM. This hypoxia can be detected noninvasively by magnetic resonance imaging (MRI). Importantly, it has clinical predictive significance.28–30 Through ICAM1, endothelial cells recruit BMDMs. During this recruitment process, endothelial cell-secreted CCL2 induces phenotypic shifts in BMDMs, which promote ADM expression. Conversely, ADM secreted by BMDMs enhances endothelial angiogenesis, which is consistent with previous findings by Wang et al.31 Furthermore, ADM directly affects tumor cells and promotes malignant phenotypes like proliferation and migration (Figure 6f). The findings of this study further expound the molecular alterations in endothelial cells and macrophages within the TME during recurrence. This may ultimately result in histological changes and the malignant phenotype of tumors. This research uncovers the molecular mechanisms underlying endothelial-macrophage-tumor cell crosstalk, which provides a foundation for better understanding the characteristics of rGBM.
As one of the diagnostic criteria for GBM, microvascular proliferation has received increasing attention in the TME of GBM. From a macroscopic perspective, prior studies have demonstrated that the tumor-associated brain region undergoes a transition from vascular regression to neovascularization prior to recurrence. This could be observed on MRI. In addition to that, microvascular alterations may serve as predictive markers for the recurrence of GBM.28,32 From a microscopic perspective, the classification of GBM microvascular patterns via tissue staining also holds predictive value for patient prognosis and recurrence rate.33 These findings suggest that endothelial cells may be important in GBM recurrence and modulate the TME. From a mechanistic perspective, endothelial cells are involved in innate and adaptive immunity and modulate immune responses.34 Due to tumor metabolic activity and the secretion of growth factors like VEGF, endothelial cells frequently undergo phenotypic alterations, which are characterized by diminished tight junctions and increased vascular permeability.35 In addition to that, endothelial cells exhibit altered molecular expression profiles that promote cellular migration and may contribute to tumor drug resistance mechanisms.34 Beyond tumor cells, endothelial cells actively regulate the TME. Macrophages primarily infiltrate the TME through the vascular endothelium. As demonstrated by Wang et al, endothelial cells are capable of secreting cytokines like IL-6 to induce macrophage activation.36 Contrarily, multi-modal evidence from 3D bioprinting, spatial transcriptomics and single-cell sequencing demonstrates that macrophages can promote angiogenesis in the TME through diverse mechanisms, which positions them as potential therapeutic targets.31,37,38
Previous studies have already demonstrated that ICAM1 has clinical value. It has been observed that ICAM1 levels in the peripheral blood and cerebrospinal fluid of patients can be used to predict tumor grade and prognosis. However, these studies have primarily paid attention to the expression of ICAM1 in tumor cells.24–26 In this study, ICAM1 was found to be primarily expressed in endothelial cells. Moreover, more focus was put on the role of cell surface ICAM1. While previous studies have not addressed the underlying causes of elevated ICAM1, this research suggests that hypoxia may be a key factor driving the upregulation of ICAM1. Furthermore, the increased expression of ICAM1 was demonstrated to lead to the production of CCL2 molecules downstream.
As the most prominent immune population within the immune microenvironment of GBM, macrophages secrete a variety of cytokines actively promoting the malignant phenotypic transformation of tumor cells.39,40 ADM, as a 52-amino-acid regulatory peptide hormone, has been observed to be expressed by multiple cell types within the TME, including tumor cells, macrophages, and stromal cells.41 In GBM, previous research has demonstrated that ADM enhances tumor resistance to TMZ treatment.42,43 Nevertheless, previous studies have zoomed in on the autocrine effects of GBM cells, while neglecting paracrine signaling from ADM secreted by other cells in the TME. More than that, few studies have explored the reasons behind the elevation of ADM. In this study, CCL2 was identified as a potential upstream factor driving the increase in ADM. Previous studies have demonstrated that cytokines are able to promote the expression of ADM.44 In this study, CCL2, a factor secreted by endothelial cells, was found to induce the expression of ADM in BMDMs. This supports the hypothesis that Endo1 recruits BMDMs through ICAM1 and alters the BMDM phenotype by secreting CCL2.
In this study, it was demonstrated that ADM produced by endothelial-induced BMDMs significantly influences the malignant phenotype of tumor cells during GBM recurrence. These findings contribute to a more comprehensive understanding of the mechanistic role of ADM in GBM pathogenesis and establish a foundation for developing targeted therapeutic strategies.
In previous studies, ICAM1 and ADM both have corresponding targeted inhibitors. Wang et al developed a targeted monoclonal antibody against ICAM1 and demonstrated its capacity to inhibit tumor growth in lung cancer.45 Despite not having been used for cancer treatment, Lifitegrast, as a small molecule ICAM1 inhibitor, has been approved for the treatment of dry eye disease and other conditions. Furthermore, Lifitegrast has been shown to reduce the malignant phenotype of cells in colorectal cancer.46 Past studies have demonstrated that the 22–52 peptide sequence of ADM can antagonize the effects of ADM in vitro in mice.31 These results indicate the potential of both molecules to serve as targets for clinical translational therapies.
It should be acknowledged that this study has several limitations. First, two distinct endothelial cell subtypes were identified, and their proportional changes were characterized during recurrence. However, technical challenges in single-cell isolation gave rise to a relatively small number of captured endothelial cells, which may have limited the detection of rare but functionally important endothelial subpopulations. Additionally, scRNA-seq analysis and subsequent experimental validation established that ICAM1 and ADM are key mediators of endothelial cell-BMDM crosstalk. However, prior studies suggest that other adhesion molecules like VCAM1 may also contribute to this interplay.47 It is worth noting that BMDMs secrete multiple pro-angiogenic factors, including TGF-β1, VEGF and PlGF, which promote endothelial-mediated vasculogenesis together.48 While this study establishes that the ICAM1-ADM axis mediates endothelial-BMDM crosstalk in GBM, this represents only one component of the complex molecular dialogue within the TME. The complete spectrum of interacting molecules requires systematic characterization. Furthermore, although recurrence-associated ICAM1 up-regulation was observed in endothelial cells, the transcriptional or post-translational mechanisms driving this elevation remain to be determined. Finally, while BMDM1-derived signals were found to promote the malignancy of tumor cells, the specific intracellular pathways activated in recipient tumor cells, which potentially involve mitogen-activated protein kinase (MAPK), signal transducer and activator of transcription 3 (STAT3) or nuclear factor kappa-B (NF-κB), worth targeted investigation.
Abbreviations
GBM, glioblastoma; mOS, median overall survival; TME, tumor microenvironment; GSCs, glioma stem cells; BMDM, bone marrow-derived macrophage; ICAM1, Intercellular Adhesion Molecule 1; ADM, adrenomedullin; TCGA, The Cancer Genome Atlas; TPM, transcripts per million; scRNA-seq, Single-cell RNA sequencing; ssGSEA, single-sample gene-set enrichment analysis; GO, Gene Ontology; HR, hazard ratio; FBS, fetal bovine serum; HUVECs, human umbilical vein endothelial cell; qPCR, PCR Quantitative; TAM, tumor-associated macrophage.
Data Sharing Statement
The raw single-cell sequencing data was available through the GEO series GSE182109 (Abdelfattah N et al. Single-cell analysis of human glioma and immune cells identifies S100A4 as an immunotherapy target. Nat Commun. 2022 Feb 9;13(1):767. doi: 10.1038/s41467-022-28372-y.). The bulk RNA sequencing data was available through TCGA (https://portal.gdc.cancer.gov/).
Ethics Approval and Informed Consent
This study involving human participants was conducted in accordance with the ethical standards of the Declaration of Helsinki. Ethical approval was obtained from the Ethics Committee of Peking Union Medical College Hospital (Approval No. I-24PJ1098) and the Ethics Committee of Beijing Ditan Hospital (Approval No. DTEC-KY2023-036-01). All participants provided written informed consent prior to inclusion in the study. This study does not include any data that can be used to identify individual patients.
Acknowledgments
Thanks for the help of Clinical Biobank (ISO 20387), Peking Union Medical College Hospital, Chinese Academy of Medical Sciences.
Author Contributions
All authors made a significant contribution to the work reported, whether that is in the conception, study design, execution, acquisition of data, analysis and interpretation, or in all these areas; took part in drafting, revising or critically reviewing the article; gave final approval of the version to be published; have agreed on the journal to which the article has been submitted; and agree to be accountable for all aspects of the work.
Consent for Publication
This manuscript does not contain data from any individual person.
Funding
This work was supported by the Chinese Academy of Medical Sciences (CAMS) Innovation Fund for Medical Sciences (CIFMS) (Grant No. 2024-I2M-C&T-B-021), the National Natural Science Foundation of China (Grant No. 82151302), and the National High Level Hospital Clinical Research Funding (Grant No. 2022-PUMCH-B-113). The funders had no role in the design of the study; in the collection, analysis, or interpretation of data; or in writing the manuscript.
Disclosure
The authors report no conflicts of interest in this work.
References
1. Verdugo E, Puerto I, Medina M. An update on the molecular biology of glioblastoma, with clinical implications and progress in its treatment. Cancer Commun. 2022;42(11):1083–1111. doi:10.1002/cac2.12361
2. McKinnon C, Nandhabalan M, Murray SA, et al. Glioblastoma: clinical presentation, diagnosis, and management. BMJ. 2021;374:n1560. doi:10.1136/bmj.n1560
3. Schaff LR, Mellinghoff IK. Glioblastoma and other primary brain malignancies in adults: a review. JAMA. 2023;329(7):574–587. doi:10.1001/jama.2023.0023
4. Li W, Graeber MB. The molecular profile of microglia under the influence of glioma. Neuro Oncol. 2012;14(8):958–978. doi:10.1093/neuonc/nos116
5. Calabrese C, Poppleton H, Kocak M, et al. A perivascular niche for brain tumor stem cells. Cancer Cell. 2007;11(1):69–82. doi:10.1016/j.ccr.2006.11.020
6. Hovis G, Chandra N, Kejriwal N, et al. Understanding the role of endothelial cells in glioblastoma: mechanisms and novel treatments. Int J Mol Sci. 2024;25(11):6118. doi:10.3390/ijms25116118
7. Gerigk M, Bulstrode H, Shi HH, et al. On-chip perivascular niche supporting stemness of patient-derived glioma cells in a serum-free, flowable culture. Lab Chip. 2021;21(12):2343–2358. doi:10.1039/D1LC00271F
8. Liu D, Martin V, Fueyo J, et al. Tie2/TEK modulates the interaction of glioma and brain tumor stem cells with endothelial cells and promotes an invasive phenotype. Oncotarget. 2010;1(8):700–709. doi:10.18632/oncotarget.204
9. Jhaveri N, Chen TC, Hofman FM. Tumor vasculature and glioma stem cells: contributions to glioma progression. Cancer Lett. 2016;380(2):545–551. doi:10.1016/j.canlet.2014.12.028
10. Scholz A, Harter PN, Cremer S, et al. Endothelial cell-derived angiopoietin-2 is a therapeutic target in treatment-naive and bevacizumab-resistant glioblastoma. EMBO Mol Med. 2016;8(1):39–57. doi:10.15252/emmm.201505505
11. Zhu C, Kros JM, Cheng C, et al. The contribution of tumor-associated macrophages in glioma neo-angiogenesis and implications for anti-angiogenic strategies. Neuro Oncol. 2017;19(11):1435–1446. doi:10.1093/neuonc/nox081
12. Azzi S, Hebda JK, Gavard J. Vascular permeability and drug delivery in cancers. Front Oncol. 2013;3:211. doi:10.3389/fonc.2013.00211
13. Dudley AC. Tumor endothelial cells. Cold Spring Harb Perspect Med. 2012;2(3):a006536. doi:10.1101/cshperspect.a006536
14. Wei Q, Singh O, Ekinci C, et al. TNFα secreted by glioma associated macrophages promotes endothelial activation and resistance against anti-angiogenic therapy. Acta Neuropathol Commun. 2021;9(1):67. doi:10.1186/s40478-021-01163-0
15. Reardon DA, Lassman AB, Schiff D, et al. Phase 2 and biomarker study of trebananib, an angiopoietin-blocking peptibody, with and without bevacizumab for patients with recurrent glioblastoma. Cancer. 2018;124(7):1438–1448. doi:10.1002/cncr.31172
16. Sareen H, Ma Y, Becker TM, Roberts TL, de Souza P, Powter B, et al. Molecular biomarkers in glioblastoma: a systematic review and meta-analysis. Int J Mol Sci. 2022;23(16). doi:10.3390/ijms23168835.
17. Reynés G, Vila V, Martín M, et al. Circulating markers of angiogenesis, inflammation, and coagulation in patients with glioblastoma. J Neurooncol. 2011;102(1):35–41. doi:10.1007/s11060-010-0290-x
18. Kreisl TN, Kim L, Moore K, et al. Phase II trial of single-agent bevacizumab followed by bevacizumab plus irinotecan at tumor progression in recurrent glioblastoma. J Clin Oncol. 2009;27(5):740–745. doi:10.1200/JCO.2008.16.3055
19. Wick W, Gorlia T, Bendszus M, et al. Lomustine and bevacizumab in progressive glioblastoma. N Engl J Med. 2017;377(20):1954–1963. doi:10.1056/NEJMoa1707358
20. Tsien CI, Pugh SL, Dicker AP, et al. NRG Oncology/RTOG1205: a randomized phase ii trial of concurrent bevacizumab and reirradiation versus bevacizumab alone as treatment for recurrent glioblastoma. J Clin Oncol. 2023;41(6):1285–1295. doi:10.1200/JCO.22.00164
21. Nayak L, Molinaro AM, Peters K, et al. Randomized phase ii and biomarker study of pembrolizumab plus bevacizumab versus pembrolizumab alone for patients with recurrent glioblastoma. Clin Cancer Res. 2021;27(4):1048–1057. doi:10.1158/1078-0432.CCR-20-2500
22. Hubbard AK, Rothlein R. Intercellular adhesion molecule-1 (ICAM-1) expression and cell signaling cascades. Free Radic Biol Med. 2000;28(9):1379–1386. doi:10.1016/S0891-5849(00)00223-9
23. Bui TM, Wiesolek HL, Sumagin R. ICAM-1: a master regulator of cellular responses in inflammation, injury resolution, and tumorigenesis. J Leukoc Biol. 2020;108(3):787–799. doi:10.1002/JLB.2MR0220-549R
24. Koper OM, Kamińska J, Sawicki K, et al. Cerebrospinal fluid and serum IL-8, CCL2, and ICAM-1 concentrations in astrocytic brain tumor patients. Ir J Med Sci. 2018;187(3):767–775. doi:10.1007/s11845-017-1695-8
25. Pokorná M, Kútna V, Ovsepian SV, et al. Biomolecules to biomarkers? u87mg marker evaluation on the path towards glioblastoma multiforme pathogenesis. Pharmaceutics. 2024;16(1):123. doi:10.3390/pharmaceutics16010123
26. Shrivastava R, Gandhi P, Shrivastava A, Sorte SK, et al. Can a novel combination panel of five systemic biomarkers define the prognosis and provide a target for therapy in high grade glioma? 2023.
27. Zünd G, Uezono S, Stahl GL, et al. Hypoxia enhances induction of endothelial ICAM-1: role for metabolic acidosis and proteasomes. Am J Physiol Cell Physiol. 1997;273(5):C1571–C1580. doi:10.1152/ajpcell.1997.273.5.C1571
28. Stadlbauer A, Kinfe TM, Eyüpoglu I, et al. Tissue hypoxia and alterations in microvascular architecture predict glioblastoma recurrence in humans. Clin Cancer Res. 2021;27(6):1641–1649. doi:10.1158/1078-0432.CCR-20-3580
29. Yang L, Lin C, Wang L, et al. Hypoxia and hypoxia-inducible factors in glioblastoma multiforme progression and therapeutic implications. Exp Cell Res. 2012;318(19):2417–2426. doi:10.1016/j.yexcr.2012.07.017
30. Stadlbauer A, Mouridsen K, Doerfler A, et al. Recurrence of glioblastoma is associated with elevated microvascular transit time heterogeneity and increased hypoxia. J Cereb Blood Flow Metab. 2018;38(3):422–432. doi:10.1177/0271678X17694905
31. Wang W, Li T, Cheng Y, et al. Identification of hypoxic macrophages in glioblastoma with therapeutic potential for vasculature normalization. Cancer Cell. 2024;42(5):815–832.e12. doi:10.1016/j.ccell.2024.03.013
32. Stadlbauer A, Eyüpoglu I, Buchfelder M, et al. Vascular architecture mapping for early detection of glioblastoma recurrence. Neurosurg Focus. 2019;47(6):E14. doi:10.3171/2019.9.FOCUS19613
33. Chen L, Lin Z-X, Lin G-S, et al. Classification of microvascular patterns via cluster analysis reveals their prognostic significance in glioblastoma. Hum Pathol. 2015;46(1):120–128. doi:10.1016/j.humpath.2014.10.002
34. Testa E, Palazzo C, Mastrantonio R, et al. Dynamic interactions between tumor cells and brain microvascular endothelial cells in glioblastoma. Cancers. 2022;14(13):3128. doi:10.3390/cancers14133128
35. Arvanitis CD, Ferraro GB, Jain RK. The blood-brain barrier and blood-tumour barrier in brain tumours and metastases. Nat Rev Cancer. 2020;20(1):26–41. doi:10.1038/s41568-019-0205-x
36. Wang Q, He Z, Huang M, et al. Vascular niche IL-6 induces alternative macrophage activation in glioblastoma through HIF-2α. Nat Commun. 2018;9(1):559. doi:10.1038/s41467-018-03050-0
37. Cui X, Morales R-TT, Qian W, et al. Hacking macrophage-associated immunosuppression for regulating glioblastoma angiogenesis. Biomaterials. 2018;161:164–178. doi:10.1016/j.biomaterials.2018.01.053
38. Zhu C, Chrifi I, Mustafa D, et al. CECR1-mediated cross talk between macrophages and vascular mural cells promotes neovascularization in malignant glioma. Oncogene. 2017;36(38):5356–5368. doi:10.1038/onc.2017.145
39. Xuan W, Lesniak MS, James CD, et al. Context-dependent glioblastoma-macrophage/microglia symbiosis and associated mechanisms. Trends Immunol. 2021;42(4):280–292. doi:10.1016/j.it.2021.02.004
40. Chen P, Hsu W-H, Han J, et al. Cancer stemness meets immunity: from mechanism to therapy. Cell Rep. 2021;34(1):108597. doi:10.1016/j.celrep.2020.108597
41. Larráyoz IM, Martínez-Herrero S, García-Sanmartín J, et al. Adrenomedullin and tumour microenvironment. J Transl Med. 2014;12:339. doi:10.1186/s12967-014-0339-2
42. He Z, Cheng M, Hu J, et al. miR-1297 sensitizes glioma cells to temozolomide (TMZ) treatment through targeting adrenomedullin (ADM). J Transl Med. 2022;20(1):443. doi:10.1186/s12967-022-03647-6
43. Huang L, Wang D, Feng Z, et al. Inhibition of Intermedin (Adrenomedullin 2) suppresses the growth of glioblastoma and increases the antitumor activity of temozolomide. Mol Cancer Ther. 2021;20(2):284–295. doi:10.1158/1535-7163.MCT-20-0619
44. Hofbauer KH, Schoof E, Kurtz A, et al. Inflammatory cytokines stimulate adrenomedullin expression through nitric oxide-dependent and -independent pathways. Hypertension. 2002;39(1):161–167. doi:10.1161/hy1201.097201
45. Wang S, Wang J, Liu C, et al. Neoplastic ICAM-1 protects lung carcinoma from apoptosis through ligation of fibrinogen. Cell Death Dis. 2024;15(8):605. doi:10.1038/s41419-024-06989-9
46. Lanzloth R, Harris NL, Cannon AM, Kaplan MH, O’Hagan H, et al. Mast cells interact directly with colorectal cancer cells to promote epithelial-to-mesenchymal transition. bioRxiv. 2025. doi:10.1101/2025.03.19.644113
47. Mosteiro A, Pedrosa L, Ferrés A, et al. The vascular microenvironment in glioblastoma: a comprehensive review. Biomedicines. 2022;10(6):1285. doi:10.3390/biomedicines10061285
48. Wu M, Shi Y, Zhu L, et al. Macrophages in glioblastoma development and therapy: a double-edged sword. Life. 2022;12(8):1225. doi:10.3390/life12081225
 © 2025 The Author(s). This work is published and licensed by Dove Medical Press Limited. The
full terms of this license are available at https://www.dovepress.com/terms
and incorporate the Creative Commons Attribution
- Non Commercial (unported, 4.0) License.
By accessing the work you hereby accept the Terms. Non-commercial uses of the work are permitted
without any further permission from Dove Medical Press Limited, provided the work is properly
attributed. For permission for commercial use of this work, please see paragraphs 4.2 and 5 of our Terms.
© 2025 The Author(s). This work is published and licensed by Dove Medical Press Limited. The
full terms of this license are available at https://www.dovepress.com/terms
and incorporate the Creative Commons Attribution
- Non Commercial (unported, 4.0) License.
By accessing the work you hereby accept the Terms. Non-commercial uses of the work are permitted
without any further permission from Dove Medical Press Limited, provided the work is properly
attributed. For permission for commercial use of this work, please see paragraphs 4.2 and 5 of our Terms.