")
Back to Journals » Nature and Science of Sleep » Volume 14
Hypogyrification in Generalized Anxiety Disorder and Associated with Insomnia Symptoms
Authors Zhang T, Xie X, Li Q, Zhang L, Chen Y, Ji GJ , Hou Q, Li T, Zhu C, Tian Y, Wang K
Received 17 January 2022
Accepted for publication 3 May 2022
Published 25 May 2022 Volume 2022:14 Pages 1009—1019
DOI https://doi.org/10.2147/NSS.S358763
Checked for plagiarism Yes
Review by Single anonymous peer review
Peer reviewer comments 2
Editor who approved publication: Prof. Dr. Ahmed BaHammam
Ting Zhang,1– 3,* Xiaohui Xie,2– 4,* Qianqian Li,1– 3,* Lei Zhang,2,3,5,6 Yue Chen,2,4 Gong-Jun Ji,2,3,5 Qiangqiang Hou,2– 4 Tianxia Li,7 Chunyan Zhu,2,3,5,6 Yanghua Tian,4,8,9 Kai Wang2– 5,9
1Department of Psychiatry, The First Affiliated Hospital of Anhui Medical University, Hefei, Anhui Province, People’s Republic of China; 2Collaborative Innovation Center of Neuropsychiatric Disorders and Mental Health, Hefei, Anhui Province, People’s Republic of China; 3Anhui Province Key Laboratory of Cognition and Neuropsychiatric Disorders, Hefei, People’s Republic of China; 4Department of Neurology, The First Affiliated Hospital of Anhui Medical University, Hefei, Anhui Province, People’s Republic of China; 5School of Mental Health and Psychological Sciences, Anhui Medical University, Hefei, Anhui Province, People’s Republic of China; 6Department of Psychiatry, The Second Affiliated Hospital of Anhui Medical University, Hefei, Anhui Province, People’s Republic of China; 7Anhui Mental Health Center, Hefei, Anhui Province, People’s Republic of China; 8Department of Neurology, The Second Affiliated Hospital of Anhui Medical University, Hefei, Anhui Province, People’s Republic of China; 9Institute of Artificial Intelligence, Hefei Comprehensive National Science Center, Hefei, People’s Republic of China
*These authors contributed equally to this work
Correspondence: Chunyan Zhu; Yanghua Tian, Email [email protected]; [email protected]
Purpose: Insomnia is a recognized feature of generalized anxiety disorder (GAD). The underlying neural substrate of insomnia in GAD is still unclear. Cortical folding is a reliable index and possibly an endophenotype of psychiatric disease. The aim of this study was to explore whether the aberrant cortical morphology was associated with insomnia in GAD.
Patients and Methods: We enrolled 73 patients with GAD and 74 matched healthy controls (HCs) to undergo neuropsychiatric assessment and 3.0 T magnetic resonance imaging scanning. Neuropsychiatric batteries included the 14-item Hamilton Anxiety Rating Scale (HAMA) and the Insomnia Severity Index (ISI). Using FreeSurfer7.1.1, we calculated local gyrification index, cortical thickness and surface area and identified group differences in these parameters. Then, we calculated the functional connectivity of these identified regions and determined functional alterations. The relationship between these neuroimaging indicators and clinical measurement was explored.
Results: Compared with HCs, the LGI in the bilateral orbitofrontal cortex (OFC), bilateral insula, left middle frontal gyrus, left temporal pole, and left fusiform area was significantly decreased in GAD. GAD patients had concurrent decreased surface area in the left OFC and thicker right OFC. GAD patients also exhibited increased functional connectivity between the left insula and frontoparietal control network. In addition, a negative relationship was observed between decreased LGI in these limbic regions and ISI score.
Conclusion: GAD patients presented aberrant cortical folding in limbic network. Cortical morphology is a potential endophenotype in GAD, corresponding to an insomnia phenotype.
Keywords: generalized anxiety disorder, cortical morphology, insomnia, limbic network, frontoparietal control network
Introduction
Generalized anxiety disorder (GAD) is a common mental disorder characterized by repeated and excessive worries about future unpredictable events.1 The life prevalence of GAD is estimated to reach 5%.2 In addition to psychological disorders, patients with GAD frequently exhibit various physical complaints, including insomnia. As a recognized feature of GAD, insomnia amplifies anxiety and negative emotional responses.3,4 Notably, insomnia is the leading cause of hospital admission in patients with GAD. In addition, insomnia hampers the therapeutic response of clinical intervention.5
Previous evidence has highlighted the importance of insomnia in psychiatric illnesses, especially anxiety.6 Insomnia is characterized by difficulties in falling asleep and maintaining sleep or early awakening. Insomnia has been associated with the development and progression of GAD.7 Recent genome-wide association studies report a strong genetic correlation between insomnia and anxiety.8 Given these findings, it seems highly relevant to identify the neural correlates of insomnia severity in patients with GAD.
To date, the neural correlates of insomnia symptoms in GAD have been rarely explored. Revealing the underpinning substrates is beneficial to protecting patients with insomnia from the risk of GAD. Probing such correlates may provide key clues in ultimately revealing the neural correlates of the risk for GAD development.
Converging evidence indicates that abnormality in the limbic system is implicated in the neurobiology of insomnia.9,10 Volumetric research has reported decreased volume in the orbitofrontal cortex (OFC) in patients with insomnia compared with good sleepers.11 As a core node of the salience network, insula has been reported to coordinate internetwork connectivity, including the frontoparietal control network (FPN).9 Functional neuroimaging literature demonstrated decreased functional connectivity of the insula with the OFC in patients with insomnia, which negatively correlated with Insomnia Severity Index (ISI) score.12 In addition, the authors found aberrant functional coupling between the insula and the FPN in primary insomnia. A recent investigation reported abnormal cortical thickness and volume in the OFC, insula, and fusiform area (FFA).13
In addition to the limbic network, the FPN is also involved in the pathogenesis of insomnia. A resting-state functional study reported increased connectivity between the FPN and dorsal attentional network in patients with insomnia.14 Electrophysiological evidence indicated that there was enhanced frontoparietal synchronized activation during the wake–sleep transition in patients with primary insomnia.15 On the contrary, Li et al found decreased connectivity in the FPN that associated with disease duration and anxiety severity.16 A large-scale structural imaging investigation reported that patients with more severe insomnia displayed a smaller surface area in the frontal and parietal cortex.17 In GAD patients, brain structural correlates of insomnia severity have rarely been investigated. Previously published literature observed that patients with comorbid GAD with insomnia had significantly increased network segregation and the posterior cingulate cortex in a hyperarousal state compared with those without insomnia.18
With the development of neuroimaging technology, more advanced analysis methods have emerged. Structural analysis focuses more on cortical parameters (cortical thickness, surface area, and local gyrification index [LGI]) than volumetric measures. Especially, gyrification is established during the prenatal period and the first 2 years of life and can reflect the early neural development of cortical connectivity.19 Cumulative evidence has suggested that abnormal gyrification reflects disrupted functional connectivity of the brain cortex.20,21 Recent research has proposed that the gyrification can represent a potential endophenotype of several psychiatric disorders.19,22 A finding from surface-based morphology research suggested that patients with GAD displayed an aberrant LGI in the FPN and FFA.23
It is tempting to speculate that brain regions involved in the pathogenesis of insomnia also contribute to the severity of insomnia in patients with GAD. Nevertheless, owing to the complexity of the neural network, different neural substrates may contribute to similar sleep disturbances. Herein, we applied a whole-brain analysis to elucidate the neural correlates of insomnia symptoms in GAD patients. First, we evaluated intergroup differences in the LGI and determined whether the identified differences were associated with insomnia severity. Then, we evaluated whether the identified correlates were specific to insomnia or driven by overall anxiety severity. Additionally, we calculated and compared the functional connectivity of the identified regions.
Patients and Methods
Participants
We recruited 73 patients with a diagnosis of GAD according to the Diagnostic and Statistical Manual of Mental Disorders-5 from Anhui Mental Health Center, Anhui, China. The diagnosis was determined by two specialized psychiatrists based on structured clinical interviews. Exclusion criteria included a history of severe physical disease, substance abuse disorder, neurological disease, or other psychiatric illness, and contraindications for magnetic resonance imaging (MRI). Besides, abnormal signal in 3D T1 imaging, excessive head motion (>3mm,>3°) should be excluded. We enrolled 74 healthy controls (HCs) with matched age, gender ratio, and educational level. Exclusion criteria for the HCs were similar to those for GAD, other than a diagnosis of GAD and sleep disturbance.
Participants signed a written informed consent. The study met the requirement of the Declaration of Helsinki and acquired ethical approval from the ethics committee of the Anhui Medical University.
Measures
We applied the 14-item Hamilton Anxiety Scale (HAMA)24 and the ISI to evaluate the severity of anxiety and insomnia,25 respectively. The ISI is a self-reported questionnaire including seven items on severity of sleep onset, sleep maintenance, early-morning waking problems, sleep dissatisfaction, sleep difficulty interference in daytime functioning, noticeability of sleep problems by others, and distress caused by sleep difficulties. Each item is rated from 0 to 4 according to severity (0 = no problem; 4 = very severe problem), so the total assessment score ranges from 0 to 28.
For those who completed clinical assessment, structural and functional MRI scanning were scheduled. All the participants (73 patients with GAD and 74 HCs) successfully completed clinical assessment and neuroimaging scanning.
Image Acquisition
We collected imaging data using a 3.0 T MRI scanner (Discovery GE750w; GE Healthcare, Buckinghamshire, UK) at the University of Science and Technology of China (Hefei, Anhui Province). Participants were required to remain still and close their eyes without thinking during scanning.
We collected a three-dimensional (3D) T1-weighted anatomic image with 188 slices in the sagittal orientation using the following parameters: TR = 8.16 ms; TE = 3.18 ms; flip angle = 12°; field of view = 256×256 mm2; slice thickness = 1 mm; and voxel size = 1 × 1×1 mm3. We also acquired functional images with 46 slices using 217 echo-planar imaging volumes with the following parameters: TR = 2400 ms; TE = 30 ms; flip angle = 90°; matrix size = 64 × 64; field of view = 192×192 mm2; slice thickness = 3 mm; and voxel size = 3 × 3×3 mm3).
Local Gyrification Index Analysis
We processed the 3D T1 images using FreeSurfer software (version 7.1.1, http://surfer.nmr.mgh.harvard.edu) and estimated surface-based features of each subject. The main steps were as follows: 1) conversion of the image format; 2) removal of non-brain tissues; 3) Talairach transformation; 4) segmenting of gray and white matter; 5) tessellation of the pial and white surfaces; and 6) automated correction of topological defects for both surfaces.26 Then, we computed the LGI as the ratio of surface area buried within the sulcal folds to surface area visible on the outer surface.19,27 Once computed, the LGI values were registered to the FreeSurfer average template for subsequent regression analyses, performed using FreeSurfer command-line tools such as mri_glmfit. To ensure accuracy, the reconstructed surfaces were assessed with FreeSurfer quality assurance tools and visually inspected by a trained examiner.
Region of Interest-Based Cortical Thickness and Surface Area Analysis
The cortical thickness was calculated as the distance between the pial surface and the gray/white matter boundary surface using the T-average algorithm. The vertex-wise surface area was calculated by assigning one-third of the area of each triangle to each of its vertices. Prior to statistical analysis, the cortical thickness and surface area maps were resampled. We then extracted the mean cortical thickness and mean surface area of clusters with a significant between-group LGI difference to examine whether the LGI abnormalities correlated with changes in these two morphological indices.
Seed-Based Functional Connectivity Analysis
We preprocessed functional images using the Data Processing Assistant for Resting-State Functional MR Imaging toolkit (DPARSF), which was based on Statistical Parametric Mapping software (SPM8; http://www.fil.ion.ucl.ac.uk/spm) and the Resting State Functional MR Imaging Toolkit.28,29 The following steps were performed: 1) deletion of the first five volumes; 2) slice timing correction; 3) realignment; 4) co-registration to respective 3D T1 images; 5) regressing out 24 Friston motion parameters, and white matter high and cerebrospinal fluid signals; 6) spatial normalization based on the unified segmentation of structural images; 7) spatial smoothing with a 4-mm Gaussian kernel full-width at half-maximum; and finally 8) detrending.
To examine the functional significance of the gyrification abnormalities, we converted the clusters with intergroup difference into the Montreal Neurological Institute space and identified them as seeds. Then we computed Pearson’s correlations of seeds with all other voxels in the whole brain. The Fisher’s z r-to-z transformation was then employed to construct functional connectivity maps.
Statistical Analysis
For further imaging analysis, cortical maps were smoothed using a Gaussian kernel with a full-width at half-maximum of 10 mm. Query Design Estimate Contrast (QDEC; version 1.4), a tool within FreeSurfer, was used in the statistical analysis. We compared brain-wide cortical parameters between GAD patients and HCs using a general linear model controlling for the effect of age, gender, educational level, and total intracranial volume. We adopted a different offset, same slop (DOSS) statistical model and cluster-wise correction (cwp <0.05).
Demographical features including age, educational level were compared between GAD group and HCs using two-sample t-tests in IBM SPSS 23. Chi-square test was used to match gender ratio. Two-sample t-tests were applied to compare the between-group differences in mean cortical thickness and surface area of the significant region in the LGI analysis using IBM SPSS 23. In seed-based functional connectivity analysis, two-sample t-tests were used to compare the functional connectivity between two groups, using the DPARSF. The statistical maps were corrected using a Gaussian random field method with the significance of the voxel level set at a p <0.001 and the cluster level set at a p <0.05 (two-tailed). Effect sizes of two-sample t-tests were calculated by an online effect size calculator (https://lbecker.uccs.edu/).
To reveal the association between aberrant cortical index and functional connectivity and clinical features, we performed Pearson’s correlation analysis to explore the relationship between LGI and ISI scores in GAD group. Due to non-normally distributed, we performed Spearman correlation analysis to explore the relationship between neuroimaging indexes and HAMA score in GAD group, as well as in HCs. The significance threshold was set at 0.05 (two-tailed) with no correction.
Results
Demographic and Clinical Characteristics
No significant differences in age, gender ratio, educational levels, and total intracranial volume were found (t = 0.876, df = 145, p = 0.382; χ2 = 0.109, p =0.741; t = −1.622, df = 145, p = 0.107; t = 0.217, df = 145, p = 0.829). Other information including duration, onset age, and medication is shown in Table 1.
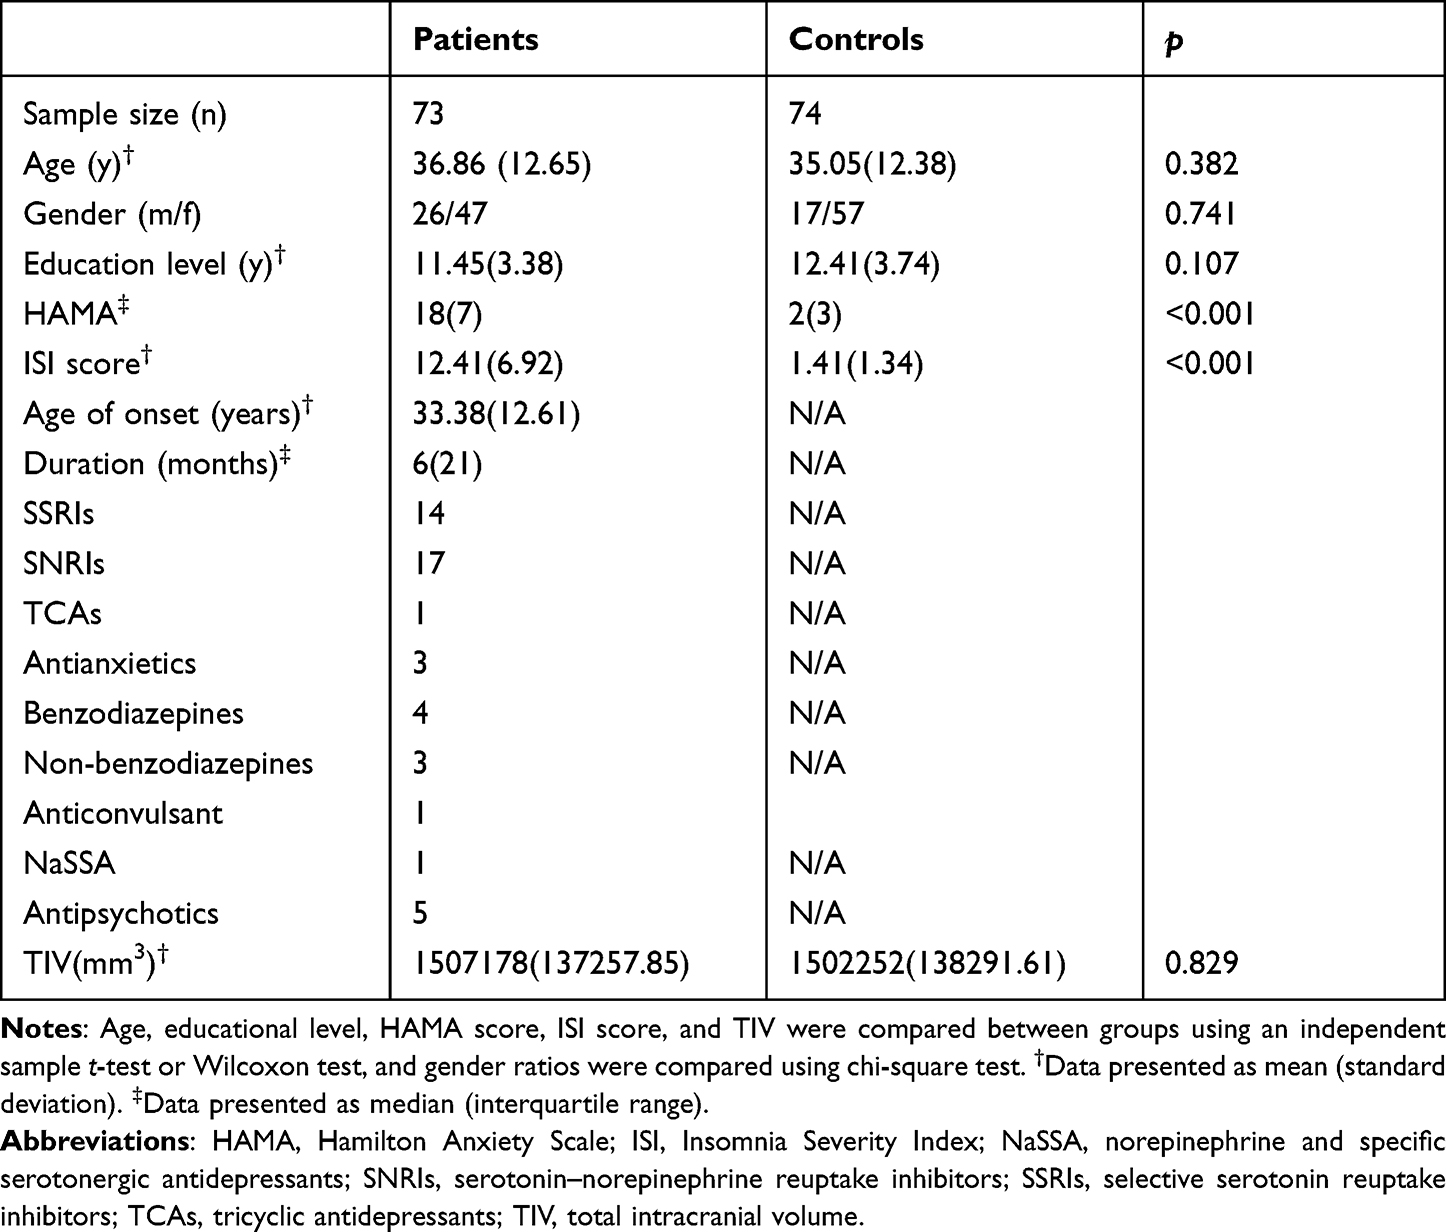 |
Table 1 Demographic and Clinical Characteristics of Participants |
Local Gyrification Index Analysis
Compared to HCs, patients with GAD displayed a lower LGI in the limbic network (bilateral OFC, insula, left temporal pole), left middle frontal gyrus (MFG), and left FFA. A significant negative relationship was found between the LGI of the left MFG, insula, bilateral OFC, and ISI score (r = −0.315, p = 0.007; r = −0.261, p = 0.026; r = −0.280, p = 0.017; r = −0.301, p = 0.01) in GAD group.(Figures 1,2 and Table 2). There was negative relationship between the LGI of the left insula, FFA and ISI score (r = −0.270, p = 0.020; r = −0.230, p = 0.049) in HCs. However, no significant association was found between aberrant LGI and HAMA score.
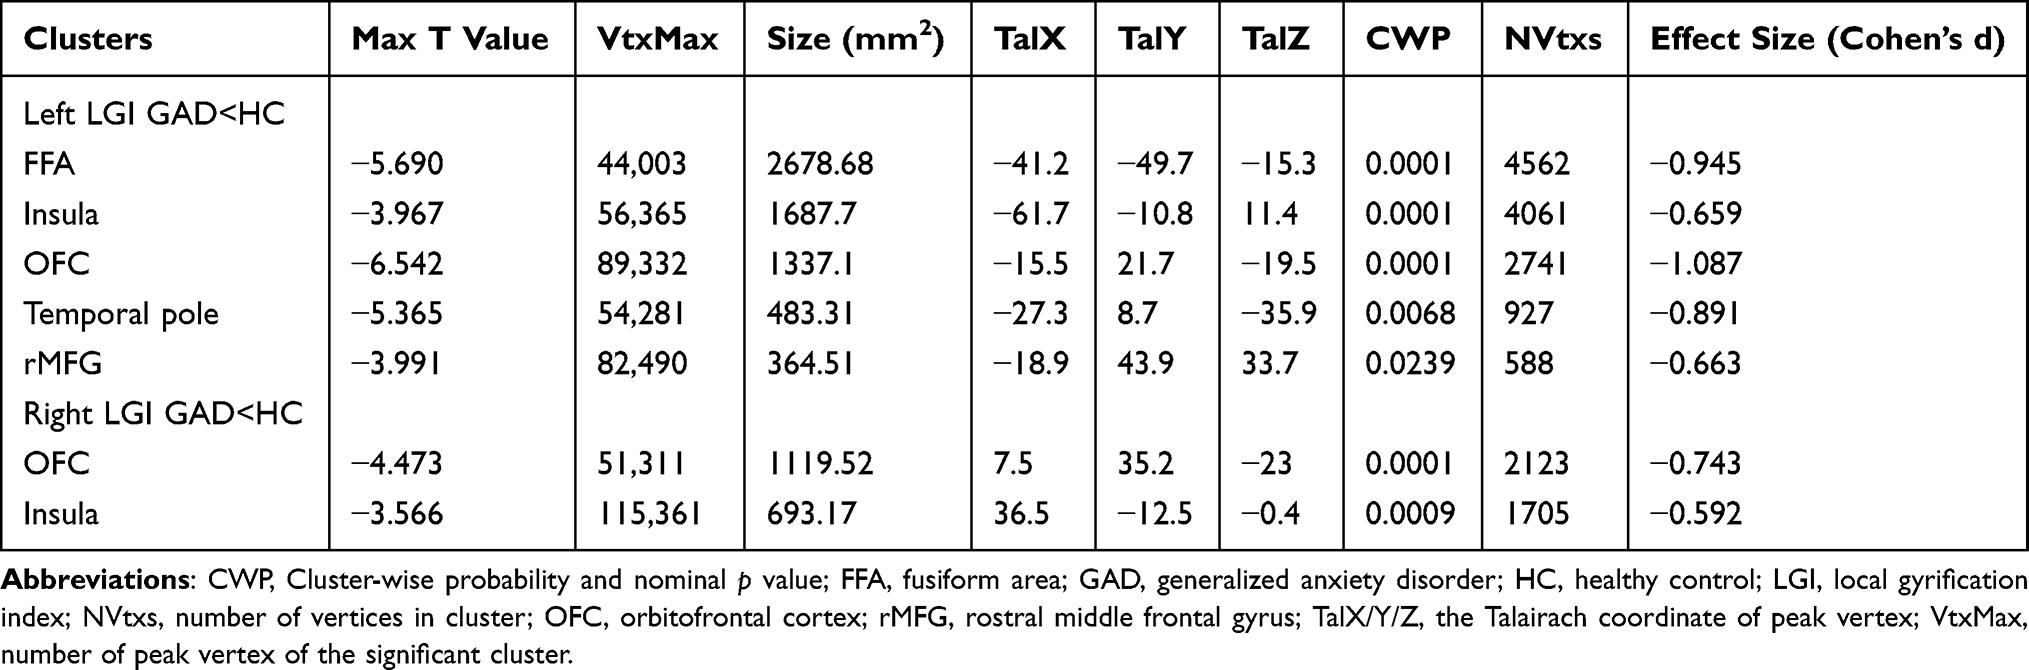 |
Table 2 Comparison of Local Gyrification Index Between Patients with Generalized Anxiety Disorder and Healthy Controls |
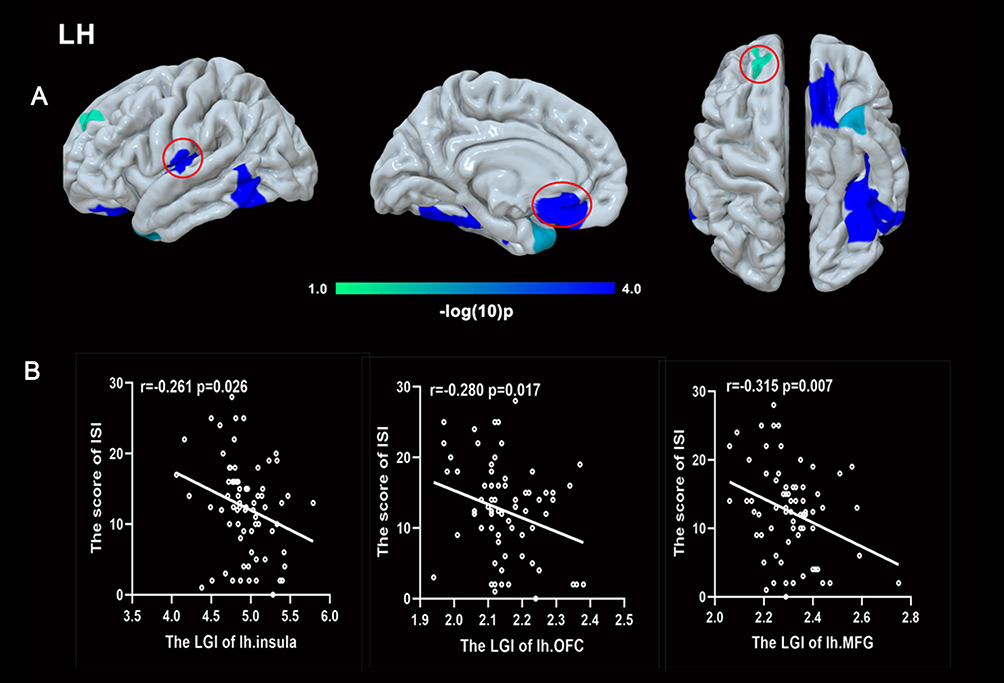 |
Figure 1 Local gyrification index (LGI) comparison in the left hemisphere. (A) Patients with GAD displayed hypogyrification in the insula, orbitofrontal cortex (OFC), middle frontal gyrus (MFG), temporal pole, and fusiform area. (B) A negative relationship between the LGI of the OFC, insula, MFG, and insomnia was found. |
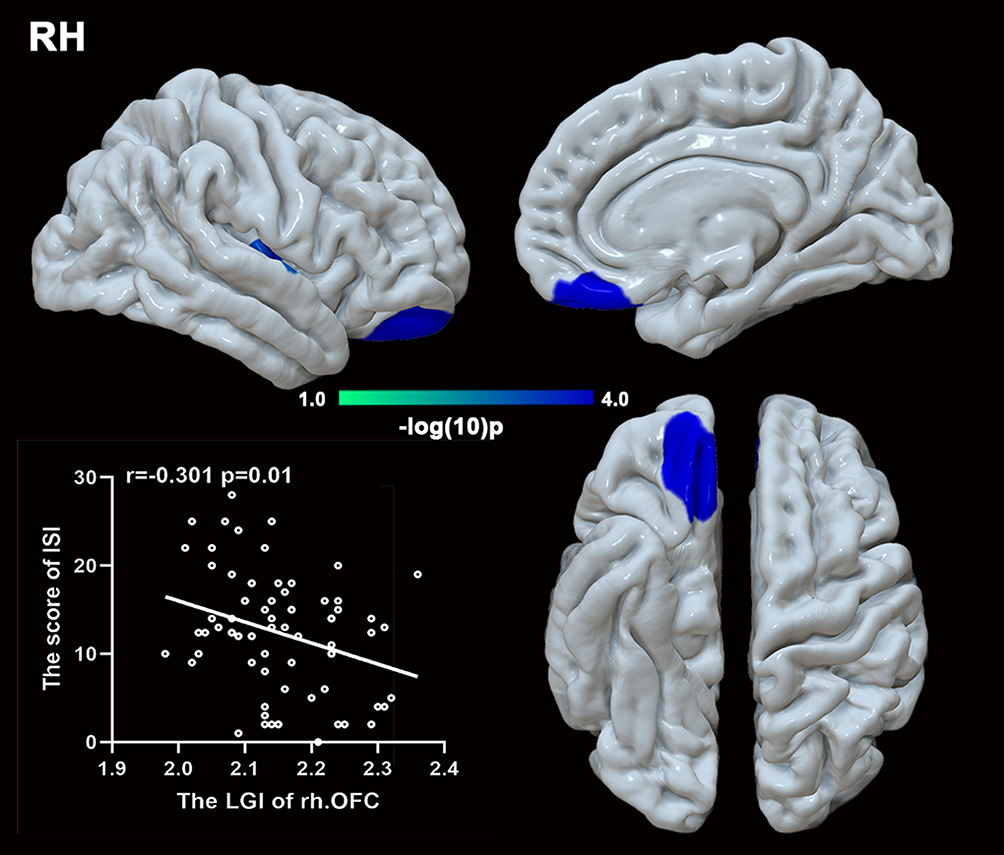 |
Figure 2 Local gyrification index (LGI) comparison in the right hemisphere. Patients with GAD displayed hypogyrification in the insula and orbitofrontal cortex (OFC). A negative relationship was found between the LGI of the OFC and insomnia. |
Seed-Based Cortical Thickness and Surface Area Analysis
Compared to HCs, patients with GAD had a lower surface area of the left OFC (t = −2.83, df = 145, p = 0.005) (Figure 3). No significant between-group surface area differences were found in other ROIs. Compared with HCs, patients with GAD displayed higher cortical thickness in the right OFC (t = 2.287, df = 145, p = 0.024) (Figure 3). However, no significant between-group cortical thickness differences were found in other regions of interest.
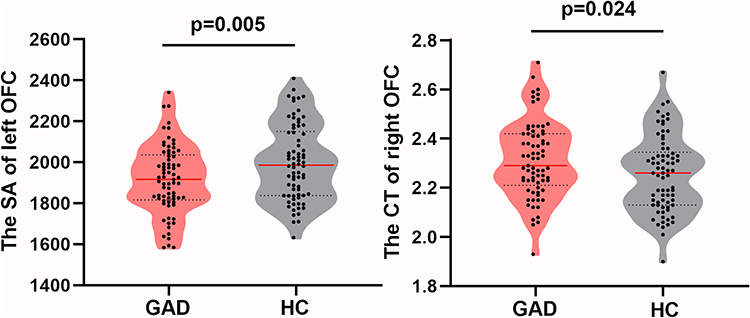 |
Figure 3 Cortical thickness (CT) and surface area (SA) in GAD patients compared with controls in the region with LGI reduction in GAD. CT in the right orbitofrontal cortex (OFC) was increased whereas SA was reduced in the left OFC. |
Seed-Based Functional Connectivity Analysis
Compared to HCs, patients with GAD showed increased functional connectivity between the left insula and the FPN (the right superior frontal gyrus and inferior parietal lobe) (Figure 4 and Table 3). However, no significant differences were found in the functional connectivity of other seeds between the two groups.
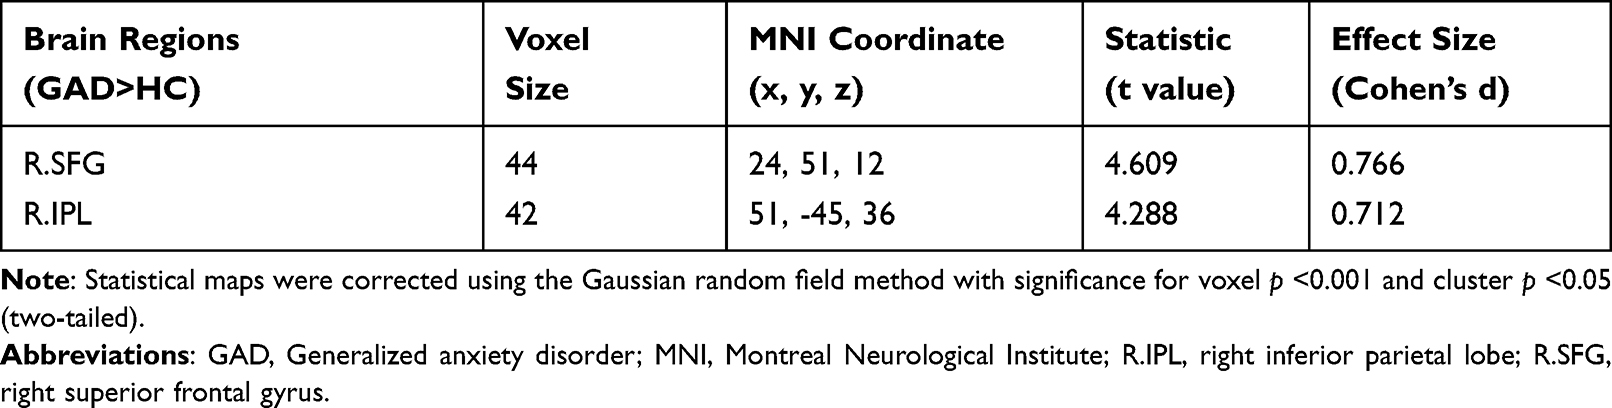 |
Table 3 Regions Showing Significant Differences in Seed-Based Functional Connectivity Analysis |
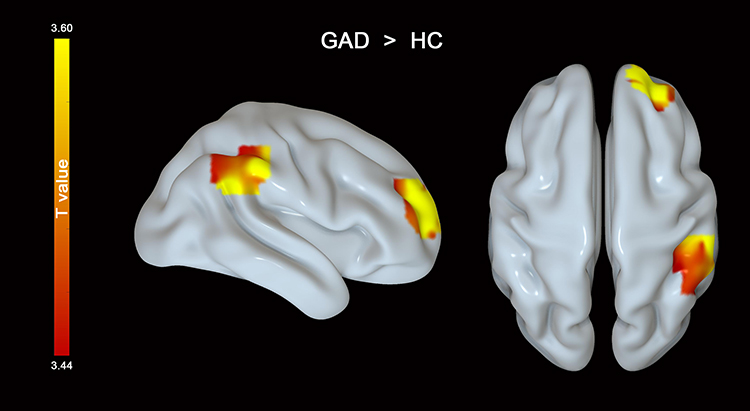 |
Figure 4 Patients with GAD displayed stronger functional connectivity between the left insula and the right superior frontal cortex and inferior parietal lobe than healthy controls. |
Discussion
This study investigated the structural and functional correlates of insomnia severity in GAD and revealed that more severe insomnia was present when the LGI was lower. Patients with GAD displayed hypogyrification in the limbic network (bilateral OFC, insula, and left temporal pole), MFG, and FFA. In those clusters, patients showed increased cortical thickness in the right OFC while decreased surface area in the left OFC. Further functional analysis found increased functional coupling between the left insula and the FPN (right superior frontal gyrus and inferior parietal lobe). A negative association was found between aberrant LGI in the MFG, the OFC, and insula with insomnia severity, but not with overall anxiety severity.
We found that abnormal gyrification was related to insomnia severity, but not with overall anxiety severity. Prior structural research reported no significant association between abnormal LGI and HAMA score.23 A study that focused on anxiety traits indicated that the lower LGI in the parietal cortex was associated with higher levels of anxiety.30 Our current results suggested a greater association of cortical gyrification for the severity of a single-domain phenotype (insomnia symptom) than for the severity of a multi-domain phenotype (overall symptoms of anxiety). This result is in concert with recent literature from the ENIGMA MDD Working Group reporting that cortical associations were specific for insomnia severity, but not for overall depression severity.17 Notably, the explained variance by LGI is relatively slight. Possible explanation is that insomnia is a comprehensive manifestation of anxiety affected by various factors besides LGI, and this may provide a closer understanding of the underlying biological phenomena involved.
Our findings suggested that only LGI is predictive of insomnia severity in GAD, whereas cortical thickness and surface area had no predictive value. Previously published literature considered that different measures correspond to distinct biological processes. For example, LGI, cortical surface area, and cortical thickness are uniquely related to network topology,31 developmental trajectory,32,33 and genetic influences.34 Cortical thickness reflects the cortical maturation process from the fetal period to adolescence (including asymmetrical division of founder cells, synaptic pruning, myelination, and apoptosis). Relative to cortical thickness, surface area is more intensely determined by genetic influences. The LGI enables to reflect different growth substrates of cell layers during brain maturation and therefore is considered to represent cortical connectivity during neurodevelopment.35 Recent works put forward that the LGI is a more sensitive index of abnormalities of cortical macrostructure than other measures.36 Hence, cortical features with various evolutionary and genetic origins differently contribute to insomnia symptoms in GAD. Insomnia symptom in GAD may be driven by cortical folding variations in the limbic regions and FPN, including the OFC, insula, and MFG.37 Another possible explanation for the relationship between abnormal LGI and insomnia score is the consequence of insomnia in GAD. A surface-based morphology study by Yu et al found there was changed cortical thickness in primary insomnia patients, which was correlated with the severity of insomnia.13 In addition, a longitudinal investigation reported acute sleep deprivation is associated with brain atrophy and the regions enlarged with prolong of the duration of deprivation.38 The brain atrophy reversed after a night sleep, namely that insomnia may affect the plasticity on brain morphology.
Recent insights have considered that the pathogenesis of insomnia involved aberrant emotional regulation and interoception.39,40 Our findings indicated that aberrant cortical folding in the limbic system (OFC and insula) was closely associated with insomnia severity. Substantial experimental evidence suggested abnormal structure and function in the OFC and insula in insomniacs.13,41 The ability to evaluate comfort is crucial to maintaining sleep. In previous research, patients with insomnia were found to have poor ability to judge thermal comfort.42 As a cardinal node for the hedonic evaluation of somatosensory input, the OFC activates with pleasant stimuli.43 A recent human brain imaging study showed that a low gray matter volume in the OFC could predispose people to an inferior ability to sense comfort.11 In addition, OFC receive widespread projections from arousal systems, including thalamus and amygdala.44 The aberrant OFC LGI may indicate an abnormal top-down control mechanism for arousal systems and reward processing in patients with GAD and insomnia. The insula is involved in interoceptive processing and therefore plays an important role in evaluating thermal comfort. Due to the spatially distribution of the sympathetic-parasympathetic control in insula, insula can regulate cardiovascular and neural activity during sleep and waking.45 Thus, structural alterations in the insula might cause disturbances in the sleep–wake circle via the dysregulation of sympathetic–parasympathetic related emotional–cognitive components. Besides this, the insula is critically related to the slow oscillations that characterize deep non-REM sleep.46 Therefore, we speculate that a reduced LGI in the insula may induce less firm generation of slow oscillations.
In addition to interoception, emotional regulation participates in the pathogenesis of insomnia. We found reduced cortical folding in the MFG and FFA. As a key node of the FPN, the MFG is responsible for executive control and reorienting attention. Cognitive and frontoparietal region hyperactivation have been associated with trouble falling asleep. Previous evidence from studies of insomnia found enhanced frontoparietal synchronized activation during the wake–sleep transition.15 Inconsistently, other neuroimaging data suggested that insomniacs display decreased connectivity in the FPN.16 One study of volumetric data found gray matter hypertrophy in the MFG and FFA in patients with insomnia.13 The FFA is a part of the visual network, which is critical to the operation of the value-driven attention network. Hypervigilance and excessive hyperarousal related to the visual network is a core predisposing factor in difficulty in initiating or maintaining sleep in insomnia. Patients with insomnia consistently show aberrant intrinsic spontaneous regional brain activity in the left FFA.47,48 A cerebral perfusion MRI study reported significantly reduced cerebral perfusion in the FFA in shift workers who suffered from sleep rhythm inversion.49
Excessive functional coupling between the limbic system and the FPN was found in patients with GAD in our study. Disorganization of multiple brain networks has been thought to induce inefficiency in information transmission from one place to others. Therefore, abnormal functional connectivity between two distinct networks may lead to inefficient processing in initiating sleep, frequent awakenings, or early-morning waking. Additionally, previous neuroimaging evidence implicated that more connectivity in the insula represented abnormality in interception processing in GAD.50 However, no significant relationship between stronger functional connectivity and insomnia symptoms was found in our study. An insufficiently sensitive functional network analysis strategy may induce the negative results. In future studies, graph theory analysis of the networks could be applied to probe the clinical associations.
Notably, there were several limitations in this study. First, most of the patients were taking anxiolytics during the experimental period, and further study of medication-free patients is needed. Next, insomnia symptoms were assessed with a self-report questionnaire, which is relatively subjective. Techniques to objectively measure biological indicators such as polysomnography should be considered in future work. Besides, this study is merely a cross-sectional observational investigation and cannot track longitudinal change of brain structure and function. Thus, it is difficult to clarify the hypogyrification was a consequence of insomnia or a developmental abnormality. In the future, we will conduct a longitudinal follow-up study.
In conclusion, this study aimed to explore the aberrant cortical folding in GAD and its association with insomnia symptoms. The findings suggested that insomnia is more severe in patients with GAD who have less cortical folding, in particular of the bilateral OFC, insula, and left MFG. These neural associations were more specific to insomnia severity than to general anxiety severity, suggesting that insomnia may represent a symptom cluster of GAD with a distinct neurobiological underpinning. In addition, our findings indicated an imperative role of limbic network and FPN in insomnia symptoms of GAD patients. Stronger functional coupling between insula and FPN were found in patients with GAD. As a core node of FPN, right superior frontal gyrus can be considered as a potential target to regulate insomnia. Prior literature demonstrated the effect of that transcranial current stimulation on insomnia in major depression via targeting dorsolateral prefrontal cortex.51 Therefore, our results provide a specific target for modulating insomnia in GAD patients.
Data Sharing Statement
The data that support the findings of this study are available from the corresponding authors upon reasonable request.
Acknowledgments
We thank the Anhui Mental Health Center and the University of Science and Technology of China for their support.
Funding
This study was funded by the Natural Science Foundation of China (82090034, 31970979, 91432301, 31571149, 81171273, and 91232717 to K.W.; 81671354, 32071054 and 91732303 to Y.T.) and the Science Fund for Distinguished Young Scholars of Anhui Province (1808085J23 to Y.T.).
Disclosure
The authors declare no conflicts of interest.
References
1. Moreno-Peral P, Conejo-Ceron S, Motrico E, et al. Risk factors for the onset of panic and generalised anxiety disorders in the general adult population: a systematic review of cohort studies. J Affect Disord. 2014;168:337–348. doi:10.1016/j.jad.2014.06.021
2. Kessler RC, Petukhova M, Sampson NA, Zaslavsky AM, Wittchen HU. Twelve-month and lifetime prevalence and lifetime morbid risk of anxiety and mood disorders in the United States. Int J Meth Psych Res. 2012;21(3):169–184. doi:10.1002/mpr.1359
3. Baum KT, Desai A, Field J, Miller LE, Rausch J, Beebe DW. Sleep restriction worsens mood and emotion regulation in adolescents. J Child Psychol Psyc. 2014;55(2):180–190. doi:10.1111/jcpp.12125
4. Babson KA, Trainor CD, Feldner MT, Blumenthal H. A test of the effects of acute sleep deprivation on general and specific self-reported anxiety and depressive symptoms: an experimental extension. J Behav Ther Exp Psychiatry. 2010;41(3):297–303. doi:10.1016/j.jbtep.2010.02.008
5. Hartwig EM, Rufino KA, Palmer CA, et al. Trajectories of self-reported sleep disturbance across inpatient psychiatric treatment predict clinical outcome in comorbid major depressive disorder and generalized anxiety disorder. J Affect Disord. 2019;251:248–255. doi:10.1016/j.jad.2019.03.069
6. Benca RM, Obermeyer WH, Thisted RA, Gillin JC. Sleep and psychiatric disorders. A meta-analysis. Arch Gen Psychiatry. 1992;49(8):
7. Neckelmann D, Mykletun A, Dahl AA. Chronic insomnia as a risk factor for developing anxiety and depression. Sleep. 2007;30(7):873–880. doi:10.1093/sleep/30.7.873
8. Hammerschlag AR, Stringer S, de Leeuw CA, et al. Genome-wide association analysis of insomnia complaints identifies risk genes and genetic overlap with psychiatric and metabolic traits. Nat Genet. 2017;49(11):1584–1592. doi:10.1038/ng.3888
9. Schiel JE, Holub F, Petri R, et al. Affect and arousal in insomnia: through a lens of neuroimaging studies. Curr Psychiat Rep. 2020;22(9). doi:10.1007/s11920-020-01173-0
10. Ben Simon E, Rossi A, Harvey AG, Walker MP. Overanxious and underslept. Nat Hum Behav. 2020;4(1):100. doi:10.1038/s41562-019-0754-8
11. Stoffers D, Moens S, Benjamins J, et al. Orbitofrontal gray matter relates to early morning awakening: a neural correlate of insomnia complaints? Front Neurol. 2012;3:105. doi:10.3389/fneur.2012.00105
12. Li C, Dong M, Yin Y, Hua K, Fu S, Jiang G. Aberrant effective connectivity of the right anterior insula in primary insomnia. Front Neurol. 2018;9:317. doi:10.3389/fneur.2018.00317
13. Yu S, Feng F, Zhang Q, et al. Gray matter hypertrophy in primary insomnia: a surface-based morphometric study. Brain Imaging Behav. 2020;14(5):1309–1317.
14. Dong X, Qin H, Wu T, et al. Rest but busy: aberrant resting-state functional connectivity of triple network model in insomnia. Brain Behav. 2018;8(2):e00876. doi:10.1002/brb3.876
15. Corsi-Cabrera M, Figueredo-Rodriguez P, Del Rio-Portilla Y, Sanchez-Romero J, Galan L, Bosch-Bayard J. Enhanced frontoparietal synchronized activation during the wake-sleep transition in patients with primary insomnia. Sleep. 2012;35(4):501–511. doi:10.5665/sleep.1734
16. Li S, Tian J, Li M, et al. Altered resting state connectivity in right side frontoparietal network in primary insomnia patients. Eur Radiol. 2018;28(2):664–672. doi:10.1007/s00330-017-5012-8
17. Leerssen J, Blanken TF, Pozzi E, et al. Brain structural correlates of insomnia severity in 1053 individuals with major depressive disorder: results from the ENIGMA MDD Working Group. Transl Psychiatry. 2020;10(1):425. doi:10.1038/s41398-020-01109-5
18. Li CH, Xia LK, Ma J, et al. Dynamic functional abnormalities in generalized anxiety disorders and their increased network segregation of a hyperarousal brain state modulated by insomnia. J Affect Disord. 2019;246:338–345. doi:10.1016/j.jad.2018.12.079
19. Nanda P, Tandon N, Mathew IT, et al. Local gyrification index in probands with psychotic disorders and their first-degree relatives. Biol Psychiatry. 2014;76(6):447–455. doi:10.1016/j.biopsych.2013.11.018
20. Dauvermann MR, Mukherjee P, Moorhead WT, et al. Relationship between gyrification and functional connectivity of the prefrontal cortex in subjects at high genetic risk of schizophrenia. Curr Pharm Design. 2012;18(4):434–442. doi:10.2174/138161212799316235
21. Nixon NL, Liddle PF, Nixon E, Worwood G, Liotti M, Palaniyappan L. Biological vulnerability to depression: linked structural and functional brain network findings. Brit J Psychiat. 2014;204(4):283–289. doi:10.1192/bjp.bp.113.129965
22. Janssen J, Aleman-Gomez Y, Schnack H, et al. Cortical morphology of adolescents with bipolar disorder and with schizophrenia. Schizophr Res. 2014;158(1–3):91–99. doi:10.1016/j.schres.2014.06.040
23. Molent C, Maggioni E, Cecchetto F, et al. Reduced cortical thickness and increased gyrification in generalized anxiety disorder: a 3 T MRI study. Psychol Med. 2018;48(12):2001–2010. doi:10.1017/S003329171700352X
24. Hamilton M. The assessment of anxiety states by rating. Br J Med Psychol. 1959;32(1):50–55. doi:10.1111/j.2044-8341.1959.tb00467.x
25. Bastien CH, Vallieres A, Morin CM. Validation of the insomnia severity index as an outcome measure for insomnia research. Sleep Med. 2001;2(4):297–307. doi:10.1016/S1389-9457(00)00065-4
26. Desikan RS, Segonne F, Fischl B, et al. An automated labeling system for subdividing the human cerebral cortex on MRI scans into gyral based regions of interest. Neuroimage. 2006;31(3):968–980. doi:10.1016/j.neuroimage.2006.01.021
27. Schaer M, Cuadra MB, Tamarit L, Lazeyras F, Eliez S, Thiran JP. A surface-based approach to quantify local cortical gyrification. IEEE Trans Med Imaging. 2008;27(2):161–170. doi:10.1109/TMI.2007.903576
28. Song XW, Dong ZY, Long XY, et al. REST: a toolkit for resting-state functional magnetic resonance imaging data processing. PLoS One. 2011;6(9):e25031. doi:10.1371/journal.pone.0025031
29. Chao-Gan Y, Yu-Feng Z. DPARSF: a MATLAB toolbox for “Pipeline” data analysis of resting-state fMRI. Front Syst Neurosci. 2010;4:13. doi:10.3389/fnsys.2010.00013
30. Miskovich TA, Pedersen WS, Belleau EL, Shollenbarger S, Lisdahl KM, Larson CL. Cortical gyrification patterns associated with trait anxiety. PLoS One. 2016;11(2):e0149434. doi:10.1371/journal.pone.0149434
31. Sanabria-Diaz G, Melie-Garcia L, Iturria-Medina Y, et al. Surface area and cortical thickness descriptors reveal different attributes of the structural human brain networks. Neuroimage. 2010;50(4):1497–1510. doi:10.1016/j.neuroimage.2010.01.028
32. Wierenga LM, Langen M, Oranje B, Durston S. Unique developmental trajectories of cortical thickness and surface area. Neuroimage. 2014;87:120–126. doi:10.1016/j.neuroimage.2013.11.010
33. Hirjak D, Huber M, Kirchler E, et al. Cortical features of distinct developmental trajectories in patients with delusional infestation. Prog Neuropsychopharmacol Biol Psychiatry. 2017;76:72–79. doi:10.1016/j.pnpbp.2017.02.018
34. Wang T, Shi F, Jin Y, Jiang W, Shen D, Xiao S. Abnormal changes of brain cortical anatomy and the association with plasma MicroRNA107 level in amnestic mild cognitive impairment. Front Aging Neurosci. 2016;8:112. doi:10.3389/fnagi.2016.00112
35. van Os J, Jones P, Lewis G, Wadsworth M, Murray R. Developmental precursors of affective illness in a general population birth cohort. Arch Gen Psychiatry. 1997;54(7):625–631. doi:10.1001/archpsyc.1997.01830190049005
36. Kohli JS, Kinnear MK, Martindale IA, Carper RA, Muller RA. Regionally decreased gyrification in middle-aged adults with autism spectrum disorders. Neurology. 2019;93(20):e1900–e1905. doi:10.1212/WNL.0000000000008478
37. Hirjak D, Kubera KM, Northoff G, et al. Cortical contributions to distinct symptom dimensions of catatonia. Schizophr Bull. 2019;45(6):1184–1194. doi:10.1093/schbul/sby192
38. Dai XJ, Jiang J, Zhang Z, et al. Plasticity and susceptibility of brain morphometry alterations to insufficient sleep. Front Psychiatry. 2018;9:266. doi:10.3389/fpsyt.2018.00266
39. Galbiati A, Sforza M, Fasiello E, et al. The association between emotional dysregulation and REM sleep features in insomnia disorder. Brain Cogn. 2020;146:105642.
40. Wei Y, Ramautar JR, Colombo MA, et al. I keep a close watch on this heart of mine: increased interoception in insomnia. Sleep. 2016;39(12):2113–2124. doi:10.5665/sleep.6308
41. Wang TY, Yan JH, Li SM, et al. Increased insular connectivity with emotional regions in primary insomnia patients: a resting-state fMRI study. Eur Radiol. 2017;27(9):3703–3709. doi:10.1007/s00330-016-4680-0
42. Raymann RJEM, Van Someren EJW. Diminished capability to recognize the optimal temperature for sleep initiation may contribute to poor sleep in elderly people. Sleep. 2008;31(9):1301–1309.
43. Kringelbach ML. The human orbitofrontal cortex: linking reward to hedonic experience. Nat Rev Neurosci. 2005;6(9):691–702. doi:10.1038/nrn1747
44. Rolls ET. The orbitofrontal cortex. Philos Trans R Soc Lond B Biol Sci. 1996;351(1346):
45. Park B, Palomares JA, Woo MA, et al. Aberrant insular functional network integrity in patients with obstructive sleep apnea. Sleep. 2016;39(5):989–1000. doi:10.5665/sleep.5738
46. Massimini M, Huber R, Ferrarelli F, Hill S, Tononi G. The sleep slow oscillation as a traveling wave. J Neurosci. 2004;24(31):6862–6870. doi:10.1523/JNEUROSCI.1318-04.2004
47. Dai XJ, Peng DC, Gong HH, et al. Altered intrinsic regional brain spontaneous activity and subjective sleep quality in patients with chronic primary insomnia: a resting-state fMRI study. Neuropsychiatr Dis Treat. 2014;10:2163–2175. doi:10.2147/NDT.S69681
48. Wang T, Li S, Jiang G, et al. Regional homogeneity changes in patients with primary insomnia. Eur Radiol. 2016;26(5):1292–1300. doi:10.1007/s00330-015-3960-4
49. Park YK, Kim JH, Choi SJ, Kim ST, Joo EY. Altered regional cerebral blood flow associated with mood and sleep in shift workers: cerebral perfusion magnetic resonance imaging study. J Clin Neurol. 2019;15(4):438–447. doi:10.3988/jcn.2019.15.4.438
50. Li J, Zhong Y, Ma Z, et al. Emotion reactivity-related brain network analysis in generalized anxiety disorder: a task fMRI study. BMC Psychiatry. 2020;20(1):429. doi:10.1186/s12888-020-02831-6
51. Zhou Q, Yu C, Yu H, et al. The effects of repeated transcranial direct current stimulation on sleep quality and depression symptoms in patients with major depression and insomnia. Sleep Med. 2020;70:17–26. doi:10.1016/j.sleep.2020.02.003
 © 2022 The Author(s). This work is published and licensed by Dove Medical Press Limited. The full terms of this license are available at https://www.dovepress.com/terms.php and incorporate the Creative Commons Attribution - Non Commercial (unported, v3.0) License.
By accessing the work you hereby accept the Terms. Non-commercial uses of the work are permitted without any further permission from Dove Medical Press Limited, provided the work is properly attributed. For permission for commercial use of this work, please see paragraphs 4.2 and 5 of our Terms.
© 2022 The Author(s). This work is published and licensed by Dove Medical Press Limited. The full terms of this license are available at https://www.dovepress.com/terms.php and incorporate the Creative Commons Attribution - Non Commercial (unported, v3.0) License.
By accessing the work you hereby accept the Terms. Non-commercial uses of the work are permitted without any further permission from Dove Medical Press Limited, provided the work is properly attributed. For permission for commercial use of this work, please see paragraphs 4.2 and 5 of our Terms.