Back to Journals » Diabetes, Metabolic Syndrome and Obesity » Volume 11
Hypoglycemic activity and constituents analysis of blueberry (Vaccinium corymbosum) fruit extracts
Authors Huang W, Yao L, He X, Wang L, Li M, Yang YX, Wan C ![]()
Received 15 March 2018
Accepted for publication 2 May 2018
Published 17 July 2018 Volume 2018:11 Pages 357—366
DOI https://doi.org/10.2147/DMSO.S166728
Checked for plagiarism Yes
Review by Single anonymous peer review
Peer reviewer comments 3
Editor who approved publication: Professor Ming-Hui Zou
Weifeng Huang,1 Liangliang Yao,2 Xiao He,1 Lei Wang,1 Mingxi Li,3 Youxin Yang,3 Chunpeng Wan3–5
1Department of Microbiology and Immunology, Medical College, China Three Gorge University, Yichang, Hubei 443002, China; 2Affiliated Hospital of Jiangxi University of Traditional Chinese Medicine, Nanchang, Jiangxi 330006, China; 3College of Agronomy, Jiangxi Agricultural University, Nanchang 330045, China; 4Jiangxi Key Laboratory for Postharvest Technology and Nondestructive Testing of Fruits & Vegetables, Nanchang 330045, China; 5Collaborative Innovation Center of Post-Harvest Key Technology and Quality Safety of Fruits and Vegetables, Jiangxi Agricultural University, Nanchang 330045, China
Background: To investigate hypoglycemic activity and elucidate the active composition of the fruit blueberry (Vaccinium corymbosum).
Methods: Methanol extracts of blueberry (MEB) were separated using a D101 macroporous resin column to yield quinic acid derivative (Fr.1)- and flavonoid (Fr.2)-rich fractions. The effects of the blueberry extracts on mRNA expression of GLUT-2 (glucose transporter type 2) and PPARγ (peroxisome proliferator-activated receptor-γ), as well as on the activities of PPRE (peroxisome proliferator response element) and NF-κB were analyzed in LO2 normal liver cells. Real-time PCR was used to detect the expression of GLUT-2, PPARγ, TNF-α, IL-1β, and IL-6 mRNA. The PPRE and NF-κB activities were detected by a luciferase reporter assay. Western blotting was used to detect the levels of PPARγ, GLUT-2, and p65. The active compositions were isolated using various chromatography columns, and were analyzed by NMR.
Results: mRNA and protein expression of GLUT-2 and PPARγ were significantly increased upon treatment with 400 μg/mL extracts of blueberry (P<0.05). The PPRE activity was also significantly increased in a dose-dependent manner upon administration of MEB (P<0.05). Furthermore, the NF-κB activity induced by lipopolysaccharides was inhibited by MEB (P<0.05). No fraction separated from MEB exhibited PPRE activation or NF-κB inhibition activity. Blueberry extract may execute its hypoglycemic activity by stimulating expression of GLUT-2 and PPARγ, and by inhibiting the inflammatory pathway. Together, quinic acid derivatives and flavonoids may result in a synergistic effect. Fourteen phenolic acids, including eight flavonoids, four quinic acid derivatives, and two other phenolic acids, were isolated and identified, and caffeoylquinic acid derivatives and quercetin glycosides were found to be the major constituents of blueberry.
Conclusion: Blueberry may have hypoglycemic activity that functions through synergistic effects with caffeoylquinic acid derivatives and quercetin glycosides.
Keywords: blueberry, hypoglycemic activity, liver cells, caffeoylquinic acid derivatives, flavonoids, synergistic effect
Introduction
Diabetes is a type of endocrine and metabolic disease caused by an absolute deficiency (type I) or relative deficiency (type II, insulin resistance) of insulin secretion, which is characterized by hyperglycemia, as well as complications, such as chronic impairment of the eyes, kidney, heart, blood vessels, and nervous system.1 Currently, diabetes is one of the most harmful diseases to human health, and the number of diabetes patients in China has reached more than 150 million.2 Patients with type II diabetes account for more than 90% of the total number of diabetes patients, and the incidence of diabetes is associated with many factors, including changes in dietary patterns, unhealthy lifestyles, reduction of physical activity, increase in mental stress, environmental pollution, smoking, lack of public awareness and self-awareness, and population aging.3 The main target drugs for the treatment of type II diabetes include insulin secretagogues (sulfonylureas, glibenclamides), insulin sensitizers (thiazolidinediones, biguanides), amylin analogs (Planklin), α-glucosidase and amylase inhibitors (acarbose), DPP-VI inhibitors, glucagon-like peptide-1 (GLP-1), sodium-glucose cotransporter-2 (SGLT-2) inhibitors, protein tyrosine phosphatase 1B (PTP-1B) inhibitors, and peroxisome proliferator-activated receptor-γ (PPARγ) agonists, among others.4–9 Glucose transporter 2 (GLUT-2) is a membrane protein that mediates glucose transport. Hepatic cell expression of GLUT-2 not only plays an important role in glucose metabolism, but also has a close association with diabetes or its associated complications. In the diabetic rat model, glucose-impaired insulin secretion has been proven to be associated with the reduction or inhibition of GLUT-2 expression by islet b cells, which plays an important role in the development of diabetes.10 Recent studies have shown that inhibition of CB1R can downregulate GLUT-2 expression and reduce glucose reabsorption, which may support the rationale for clinical testing of peripherally restricted CB1R antagonists or the development of novel renal-specific GLUT-2 inhibitors against diabetic nephropathy.11 PPARγ is a nuclear receptor that is mainly expressed in the large intestine, adipose tissue, and liver. PPARγ binds to PPRE (peroxisome proliferator response element), which has a variety of biological effects and plays an important role in adipocyte differentiation, glucose and lipid metabolism, insulin resistance, and the inflammatory response. PPARγ is also the effective target of thiazolidinedione (TZD) hypoglycemic drugs for the treatment of type II diabetes. PPARγ expression is down-regulated in liver tissues in type II diabetic db/db mice, and amelioration of hyperlipidemia and hyperglycemia are related to the up-regulation of PPARγ expression.12 The transcription factor nuclear factor (NF-κB) mediates inflammation and stress signals. Numerous studies have indicated that there is a close relationship between NF-κB signaling and diabetes. Inhibition of the NF-κB cell signaling pathway improves insulin sensitivity in the liver.13 Suppression of the NF-κB signaling pathway prevents diabetic liver injury in type II diabetic rat models.14
Blueberry belongs to the genus Vaccinium of Ericaceae. Vaccinium are perennial shrub fruit trees that originated in North America. There are more than 400 species of Vaccinium all over the world. Blueberries are mainly grown in the US, and are also known as American blueberries. Wild blueberries in China are mostly grown on Changbai Mountain, the Da Hinggan Mountains, and in the forest area of the Xiao Hinggan Mountains, most of which are in the Da Hinggan Mountain region. Previous research has shown that blueberries contain abundant nutritional elements, such as anthocyanins, organic acids, phenolic acids, superoxide dismutase (SOD), pectin, polysaccharides, and pterostilbene, among others.15–18 Blueberry is one of the five healthy fruits recommended by the Food and Agriculture Organization of the United Nations (FAO), because dietary consumption of blueberries has been demonstrated to be very beneficial to human health and provides effective protection against diseases, including lowering blood pressure, inhibiting tumorigenesis, and potentially preventing neurodegenerative disease.19–21 These effects play an important role in the treatment of diseases such as diabetes, liver disease, cancer, cardiovascular disease, and anemia, among others.22,23 A previous report showed that blueberry extract has good hypoglycemic activity. The study demonstrated that anthocyanins from blueberry have the potency to alleviate symptoms of hyperglycemia using a diabetic mice model;24 however, its effective mechanism is not clear. To investigate the underlying mechanism of blueberry extract in decreasing the blood glucose level, the intent of the present research was to investigate the effect of blueberry extract on GLUT-2 and PPARγ mRNA expression, as well as on PPRE and NF-κB activity in liver cells, and to identify the chemical composition of the main active components by means of separation using various chromatography columns to clarify the hypoglycemic mechanism of blueberry.
Materials and methods
General experimental procedures
1H and 13C nuclear magnetic resonance (NMR) data were recorded on a Varian 500 MHz instrument (Varian Inc., Palo Alto, USA) with TMS as the internal standard. Electrospray ionization mass spectral (ESI-MS) data were acquired on a Q-Star Elite mass spectrometer (Applied Biosystems MDS, Waltham, MA, USA). The UV spectra were measured on a SHIMADZU UV-2450 UV-visible spectrophotometer (Shimadzu Corporation, Kyoto, Japan). High-performance liquid chromatography (HPLC) was performed on a Hitachi Elite LaChrom system (Elite Lachrom Hitachi, Japan) consisting of a L2130 pump, L-2200 autosampler, and L-2455 diode array detector, all of which were operated by EZChrom Elite software (Scientific Software, Agilent Technologies, Santa Clara, USA). All solvents were of either analytical or HPLC grade and were purchased from Wilkem Scientific (Thermo Fisher Scientific, Shanghai, China).
Cell culture
Dulbecco’s modified Eagle’s medium (DMEM) and fetal bovine serum (FBS) were purchased from Gibco (Grand Island, NY, USA). Human non-tumor hepatic LO2 cells were purchased from the Chinese Academy of Sciences (Shanghai, China). Cells were maintained in DMEM supplemented with 10% FBS and incubated in a humidified incubator at 37°C in 5% CO2.
Extraction and isolation
The fruits of the blueberry species (Vaccinum corymbosum) were collected locally from Xinqizhou blueberry farms (Nanchang, Jiangxi, China) in June 2015. Fresh fruits (10.0 kg, fresh weight) were extracted exhaustively with MeOH (3×20 L) at room temperature to yield MeOH extracts. A part of the extracts (50 g) was dissolved in distilled deionized water (250 mL), filtered, and then loaded onto a D101 macroporous resin column (5×60 cm).25 A 5-fold column volume of water was first used to wash the polysaccharide and protein materials. Next, a 5-fold column volume of 30% ethanol was used to wash the quinic acid derivatives (Fr.1), and 70% ethanol was further used to wash the flavonoid (Fr.2) constituents.
Fr.1 (15 g) was chromatographed on a C18 MPLC column (3.5×40 cm) and eluted with a gradient system of MeOH/H2O (1:9 to 8:2, v/v) to afford five sub-fractions (A1–A5), which were combined based on analytical HPLC analyses. Fraction A2 was separated using a Sephadex LH-20 column (3.5×120 cm), eluted with MeOH, further separated by semi-preparative HPLC, and eluted with a gradient system of MeOH/H2O to yield compounds 9–12. Fraction A4 was separated by semi-preparative HPLC and eluted with a gradient system of MeOH/H2O to yield compounds 13 and 14.
Fr.2 (11 g) was separated using a Sephadex LH-20 column (3.5×120 cm) and eluted with MeOH to afford three sub-fractions (B1–B3). Fraction B2 was separated by a C18 MPLC column (3.5×40 cm) and eluted with a gradient system of MeOH/H2O (2:8 to 8:2, v/v) to afford five sub-fractions (C1–C5), which were combined based on analytical HPLC analyses. Sub-fraction C2 was separated by semi-preparative HPLC and eluted with MeOH/H2O to yield compound 6. Sub-fraction C3 was separated by semi-preparative HPLC and eluted with a gradient system of MeOH/H2O to yield compounds 1–4. Sub-fraction C4 was separated by semi-preparative HPLC and eluted with a gradient system of MeOH/H2O to yield compounds 5, 7, and 8.
Luciferase reporter assays
For detecting PPRE activity, LO2 cells were co-transfected with p-PPRE-luc and pSV40-β-galactosidase.26 After 6 h, the cells were subjected to different fractions of blueberry extracts for 24 h and then harvested to measure the luciferase activity. For detection of the NF-κB activity, LO2 cells were co-transfected with p-NF-κB-luc and pSV40-β-galactosidase. After 6 h, the cells were subjected to lipopolysaccharides or different fractions of blueberry extracts for 24 h and then harvested for measurement of the luciferase activity.
Quantitative real-time RT-PCR analyses
Total RNA was isolated from hepatocytes using TRIzol reagent according to the manufacturer’s instructions (Invitrogen Life Technology, Carlsbad, CA, USA). Total RNA was reverse-transcribed to cDNA using ReverTraAce (TOYOBO, Tokyo, Japan), as instructed. Quantitative real-time PCR was performed by standard methods using species-specific primer pairs (Table 1). The 18S rRNA expression levels were amplified and used for the calibration of real-time RT-PCR.
 | Table 1 Primers used for quantitative real-time PCR Abbreviations: PCR, polymerase chain reaction; GLUT-2, glucose transporter type 2; PPARγ, peroxisome proliferator-activated receptor-γ. |
Western blotting
LO2 cells were washed in ice cold saline, collected, and lysed with a lysis buffer contained protease inhibitors cocktail (Roche Diagnostics, Neuilly SurSeine, France). The total protein was extracted by NE-PER (Pierce Biotechnology, Rockford, IL, USA), and the concentration of protein was quantified by bichinconinic acid (BCA) protein assay kit (Thermo Fisher Scientific, Waltham, MA, USA) according to the protocols of manufacturer. Samples (40 μg proteins per lane) were boiled for 100°C for 5 min and loaded on 8%–12% SDS–polyacrylamide gel electrophoresis (SDS-PAGE). The separated proteins of each lane representing one mouse were transferred to a polyvinylidene difluoride (PVDF) membrane (Millipore, MA, USA) and blocked in 5% nonfat milk solution for 1 h at room temperature with gentle shaking. Membranes were incubated with primary antibodies for GAPDH, GLUT-2, PPARγ, and NF-kB p65 (Abcam, MA, USA), diluted in 5% nonfat milk/TBST at 4°C overnight. Subsequently, each membrane was washed with TBST three times following incubation with horseradish peroxidase-conjugated secondary antibodies (rabbits and mouse) for 1 h at room temperature. Finally, specific bands of the membrane were performed using chemiluminescence (ECL) reagents (Millipore) and detected by Fluorescent Image Analyzer (FUJIFILM Corp, Tokyo, Japan).
Statistical analyses
All statistical analyses were performed with GraphPad Prism software. Values are expressed as the mean±SEM. Pairwise comparisons were performed with Student’s t-test (two-tailed), and multiple-group comparisons were performed with one-way ANOVA with Bonferroni’s post-hoc test. A P-value<0.05 was considered to be significant.
Results
Effects of blueberry extracts on PPRE activity
Quinic acid derivatives and flavonoid glycosides were two major classes of the chemical constituents of blueberry. Methanol extracts of blueberry (MEB) were separated using a D101 macroporous resin column. A 5-fold column volume of water was used to wash the polysaccharide and protein materials. Next, a 5-fold column volume of 30% ethanol was used to wash the quinic acid derivatives (Fr.1), and 70% ethanol was further used to wash the flavonoids (Fr.2). The UV spectra of Fr.1 and Fr.2 were typical of quinic acid derivatives and flavonol, respectively. PPRE activity in liver cells has been linked to beneficial hypoglycemic effects. To determine the potential hypoglycemic activities of blueberry extracts, the effects of blueberry extracts on PPRE activity were determined by luciferase reporter assays. Three extracts (MEB, Fr.1, and Fr.2) from blueberry were used to treat human non-tumor hepatic LO2 cells. As shown in Figure 1A, MEB treatment (200 and 400 μg/mL) stimulated PPRE activity by 1.3- and 1.8-fold compared with the control. As indicated, there was no significant difference in the PPRE activity upon administration of extracts Fr.1 and Fr.2 of blueberry (Figures 1B and 1C). These results indicate that MEB may affect the hypoglycemic activity of blueberry through the synergistic effects of quinic acid derivatives and flavonols.
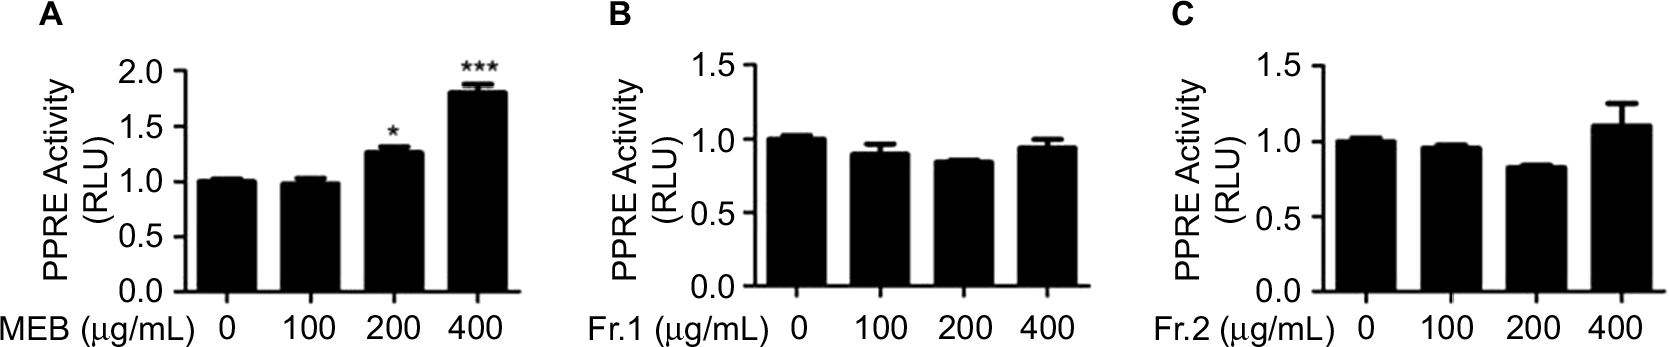 | Figure 1 Effects of blueberry extract on PPRE activity. (A) Effects of MEB on PPRE activity. (B) Effects of extract Fr.1 of blueberry on PPRE activity. (C) Effects of extract Fr.2 of blueberry on PPRE activity. LO2 cells were co-transfected with p-PPRE-luc and pSV40-β-galactosidase. After 6 h, the cells were subjected to different extracts of blueberry for 24 h and then harvested for measurement of the luciferase activity. All of the results are presented as the means±SD of three independent experiments (n=3). *p<0.05; ***p<0.001. Abbreviations: PPRE, peroxisome proliferator response element; MEB, methanol extracts of blueberry; RLU, relative luciferase unit; SD, standard deviation. |
Effects of blueberry extracts on NF-κB activity
Taking into account the importance of the NF-κB signaling pathway in diabetic liver injury and insulin resistance,27 we evaluated the effects of blueberry extracts on NF-κB activity using luciferase reporter assays. In consistent with the results of previous reports, LPS (10 ng/mL) activated the reporter gene by 6.9-fold compared with the control.28 MEB (100, 200, and 400 μg/mL) markedly repressed the NF-κB-driven luciferase gene by 15%, 27%, and 40% (Figure 2A), respectively, compared with the levels in LPS-stimulated cells. However, extracts Fr.1 and Fr.2 of blueberry had no inhibitory effect on LPS-increased NF-κB activity (Figures 2B and 2C). To further explore the influence of MEB on the major inflammatory signaling pathway of NF-κB, p65 was then examined by Western blotting (Figure 2D). LPS increased protein levels of p65 compared to the control cell, while MEB inverted these variations (Figure 2D). Moreover, to test whether MEB suppressed downstream inflammatory cytokines of the pathway in mRNA, RT-qPCR was utilized to detect the expression of TNF-α, IL-1β, and IL-6 following LPS treatment (Figure 2E). Interestingly, MEB did produce a marked change with a significant decrease in these inflammation mediators when compared to LPS treated cells. These results confirmed that MEB are effective components of blueberry with regards to its hypoglycemic activity.
 | Figure 2 Effects of blueberry extracts on NF-κB activity. (A) Effects of MEB on NF-κB activity. (B) Effects of extract Fr.1 of blueberry on NF-κB activity. (C) Effects of extract Fr.2 of blueberry on NF-κB activity. LO2 cells were co-transfected with p-NF-κB-luc and pSV40-β-galactosidase. After 6 h, the cells were subjected to LSP (10 ng/mL) and/or different extracts of blueberry for 24 h, and then harvested for measurement of the luciferase activity. (D) Effects of MEB on p65 expression. (E) Effects of MEB on mRNA expression of TNF-a, IL-1β, and IL-6. The LO2 cells were subjected to LPS (10 ng/mL) and/or different extracts of blueberry for 24 h and then harvested for Western blotting and quantitative real-time RT-PCR. All results are presented as the means±SD of three independent experiments (n=3). *p<0.05; **p<0.01; ***p<0.001. Abbreviations: NF-κB, transcriptional factor nuclear factor; MEB, methanol extracts of blueberry; LPS, lipopolysaccharides; RT-PCR, real time polymerase chain reaction; SD, standard deviation. |
Effects of MEB on the expression of GLUT-2 and PPARγ mRNA and protein
To further detect the hypoglycemic activity of MEB, mRNA expression of GLUT-2 and PPARγ were measured in LO2 cells under treatment with MEB. We found that MEB induced GLUT-2 and PPARγ mRNA expression. Blueberry extract at a dose of 400 μg/mL enhanced GLUT-2 and PPARγ mRNA expression by 1.5- and 1.4-fold (Figures 3A and 3B), respectively, compared with the control. The effects of MEB on the mRNA expression of GLUT-2 and PPARγ were confirmed by the Western blotting results in Figures 3C and 3D.
 | Figure 3 Effects of MEB on the mRNA expression of GLUT-2 (A), PPARγ (B), and protein expression of GLUT-2, PPARg (C and D). LO2 cells were maintained in DMEM supplemented with 10% FBS and incubated in a humidified incubator at 37°C in 5% CO2 for 24 h. Then, the cells were further incubated with MEB (100, 200, and 400 μg/mL) for another 24 h. Cells were then collected for quantitative real-time RT-PCR and Western blotting. All of the results are presented as the means±SD of three independent experiments (n=3). *p<0.05; **p<0.01; ***p<0.001. Abbreviations: MEB, methanol extracts of blueberry; GLUT-2; glucose transporter type 2; PPARγ, peroxisome proliferator-activated receptor-γ; DMEM, Dulbecco’s Modified Eagle’s Medium; FBS, fetal bovine serum; RT-PCR; real time polymerase chain reaction; SD, standard deviation. |
Chemical compositions analysis of blueberry extracts
To elucidate the chemical compositions of the blueberry extracts, MEB were first fractionated using a D101 macroporous resin column to yield the Fr.1 and Fr.2 fractions. The two fractions were further purified using various chromatographic columns, including a Sephadex LH-20, octadecylsilane, and semi-preparative HPLC, to yield pure compounds. The isolated compounds were characterized by 1H-unclear magnetic resonance (1H-NMR), 13C-NMR, and ESI-MS. Fourteen phenolic acids, including eight flavonoids, four quinic acid derivatives, and two other phenolic acids, were isolated, and their structures were identified as isoquercetin (1),29 hyperin (2),29 guajavarin (3),29,30 quercitrin (4),29 astragalin (5),31 isomyricitrin (6),32 helichrysoside (7),33 tiliroside (8),33,34 5-O-caffeoylquinic acid (9),31,35 3-O-caffeoylquinic acid (10),35 5-O-caffeoylquinic acid methyl ester (11),33 3-O-caffeoylquinic acid methyl ester (12),35 methyl cinnamate (13),33 and methyl caffeate (14).33
Compounds 1–4 were obtained as yellowish amorphous powders. The UV spectrum showed a λmax at approximately 255 nm (band II) and 355 nm (band I). The 1H-NMR spectrum (Table 2) showed two meta proton peaks at approximately δ 6.10 (1H, d, J =2.0 Hz) and 6.30 (1H, d, J =2.0 Hz) ppm, consistent with the H-6 and H-8 on A-ring of flavonoid, and an ABX system at approximately 7.25–7.74 (1H, d, J=2.2 Hz, H-2′), 7.20–7.48 (1H, dd, J=2.2 Hz, 8.4 Hz, H-6′), and 6.78 (1H, d, J=8.4 Hz, H-5′), corresponding to the catechol protons on the B-ring. One anomeric proton signal was found at [1: δ 5.15(1H, d, J=7.6), 2: δ 5.07(1H, d, J=7.6), 3: δ 5.07(1H, d, J=6.6), 4: δ 5.27(1H, d, J=1.1)]. These signals showed that compounds 1–4 contained the same aglycone of quercetin. Additionally, one methyl signal at δ 0.87(3H, d, J=6.1) of compound 4 was found, which can be easily identified as quercitrin (4). Through careful comparison of the 13C-NMR data of the sugar moiety carbon signals of compounds 1−3 at [1: 102.8(C-1’’), 74.3(C-2’’), 76.7(C-3’’), 69.8(C-4’’), 77.0(C-5’’), 61.1(C-6’’). 2: 103.9(C-1’’), 71.7(C-2’’), 73.7(C-3’’), 68.6(C-4’’), 75.7(C-5’’), 60.5(C-6’’). 3: 102.3(C-1’’), 71.4(C-2’’), 72.7(C-3’’), 67.7(C-4’’), 65.6(C-5’’)], the compounds were identified as isoquercetin (1), hyperin (2), and guajavarin (3), respectively. Compounds 5 and 6 showed the same sugar moiety proton signals as those of compound 1 in the 1H-NMR and 13C-NMR data, although the B-rings were different. An AA’BB’ system was found at 7.97 (2H, d, J=8.8 Hz, H-2’, 6’) and 6.84 (2H, d, J=7.8 Hz, H-3’, 5’) of compound 5 and at 7.30 (2H, s, H-2’, 6’) of compound 6; therefore, compounds 5 and 6 were identified as astragalin (5) and isomyricitrin (6).
 | Table 2 1H-NMR (500 MHz, CD3OD) characteristics of flavonol glycosides 1–6 isolated from blueberry extracts Abbreviation: 1H-NMR, 1H-nuclear magnetic resonance. |
Compound 7 showed the same aglycone as seen in compounds 1–4. The UV spectrum showed λmax values at 259 nm (band II) and 314 nm (band I), typical of the UV spectrum of the coumaroyl substituent quercetin glycoside.36 1H-NMR data confirmed this speculation, showing signals of quercetin glycoside signals [δ 7.60 (1H, d, J=2.0 Hz, H-2’), 7.55 (1H, dd, J=8.4, 2.0 Hz, H-6’), 6.81 (1H, d, J=8.4 Hz, H-5’), 6.28 (1H, d, J=2.0 Hz, H-8), 6.11 (1H, d, J=2.0 Hz, H-6), 5.28 (1H, d, J=7.6 Hz, H-1”), 4.33 (1H, d, J=11.5 Hz, H-6”a), 4.21 (1H, dd, J=11.5, 6.7 Hz, H-6”b), 3.55–3.40 (3H, H-2”, 3”, 5”), and 3.32 (1H, t, J=9.6 Hz, H-4”)]. One additional coumaroyl signal was detected at δ 7.40 (1H, d, J=15.8 Hz, H-7’”), 7.30 (2H, d, J=8.2 Hz, H-2’”, 6’”), 6.78 (2H, d, J=8.2 Hz, H-3’”, 5’”), and 6.07 (1H, d, J=15.8 Hz, H-8”’). The downfield shift of H-6 (δ 4.33 and 4.21) indicated that coumaroyl was linked to C-6 of the sugar. Compound 7 was identified as helichrysoside (7), which was further confirmed by HR-ESI-MS, m/z 611.1097 [M+H]+ (calcd. for C30H27O14, 611.1401). Compound 8 showed the same aglycone as that of 5, and the UV spectrum showed λmax values at 266 nm (band II) and 312 nm (band I), which is the typical UV spectrum of the coumaroyl substituent kaempferol glycoside.36 Thus, compound 8 was identified as tiliroside (8). 1H-NMR (500 MHz, CD3OD) δ 7.98 (2H, dd, J=8.8, 2.0 Hz, H-2’,6’), 6.82 (2H, d, J=8.8, 2.0 Hz, H-3’,5’), 7.40 (1H, d, J=15.9 Hz, H-7’”), 7.31 (2H, d, J=8.2 Hz, H-2’”, 6’”), 6.80 (2H, d, J=8.2 Hz, H-3’”, 5’”), 6.30 (1H, d, J=2.0 Hz, H-8), 6.12 (1H, d, J=2.0 Hz, H-6), 6.00 (1H, d, J=15.9 Hz, H-8”’), 5.24 (1H, d, J=7.6 Hz, H-1”), 4.30 (1H, brd, J=11.5 Hz, H-6”a), 4.19 (1H, dd, J=11.5, 6.7 Hz, H-6”b), 3.40–3.48 (3H, H-2”, 3”, 5”), 3.31 (1H, m, H-4”).
Compounds 9−12 showed similar 1H-NMR spectra (Table 3) and UV spectra, with λmax values at 327, 298 (shoulder), and 242 nm, suggesting that compounds 9−12 were caffeoyl-substituted quinic acid derivatives.35 The substituted position of caffeoyl was used to identify the oxygenated methine protons of the quinic acid core, as detailed in the discussion previously.35 Compounds 9 and 10 were identified as 5-O-caffeoylquinic acid (9) and 3-O-caffeoylquinic acid (10). There was one additional OCH3 signal found in the spectra of compounds 11 and 12, for which the other proton signals were very similar to those of compounds 9 and 10. Compounds 11 and 12 were identified as 5-O-caffeoylquinic acid methyl ester (11) and 3-O-caffeoylquinic acid methyl ester (12). m/z 201.0480 [M+Na]+ (calcd. for C10H10NaO3, 201.0528). 1H-NMR (500 MHz, CD3OD): δ 7.60 (1H, d, J=16.1 Hz, H-7), 7.44 (2H, d, J=8.3 Hz, H-2, 6), 6.80 (2H, d, J=8.3 Hz, H-3, 5), 6.30 (1H, d, J=16.1 Hz, H-8), 3.75 (3H, s, OCH3). Compound 13 was identified as methyl cinnamate.
 | Table 3 1H-NMR (500 MHz, CD3OD) characteristics of compounds 9–12 from blueberry extracts Abbreviation: 1H-NMR, 1H-nuclear magnetic resonance. |
The UV spectrum of compound 14 showed λmax at 325, 297, 240 nm, (+) HR-ESIMS, m/z 217.0453 [M+Na]+ (calcd for C10H10NaO4, 217.0477). 1H-NMR (500 MHz, CD3OD): δ 7.57 (1H, d, J=15.9 Hz, H-7), 7.04 (1H, d, J=1.8 Hz, H-2), 6.94 (1H, dd, J=8.2, 1.8 Hz, H-6), 6.79 (1H, d, J=8.2 Hz, H-5), 6.28 (1H, J=15.9 Hz, H-8), 3.79 (3H, s, OCH3). Compound 14 was identified as methyl caffeate.
Discussion
Most experimental and clinical studies have strongly suggested that blueberry is a source of bioactive compounds for the treatment of obesity and type II diabetes.37 However, the mechanisms have not been illuminated in detail. A D101 macroporous resin column was used to separate MEB, and the effect of the resulting fractions on PPRE and NF-κB activity were detected. Inflammation contributes to the pathogenesis of type II diabetes, and anti-inflammation strategies for the treatment of this disease simultaneously lower blood glucose levels and potentially reduce the severity and prevalence of the associated complications.38 Previous research has shown that blueberry polyphenol extract effectively inhibits the LPS-induced inflammatory response and decreases the activity of NF-κB,39 lowering proinflammatory mediators, including nitric oxide (NO), tumor necrosis factor-alpha (TNF-α), and interleukin-1 beta (IL-1β), and down-regulating NO synthase (iNOS) and cyclooxygenase 2 (COX2). Inconsistent with the results of previous reporting, MEB markedly repressed the NF-κB-driven luciferase gene. MEB were separated into two groups, quinic acid derivatives (Fr.1) and flavonoid glycosides (Fr.2). Interestingly, neither of the separated MEB fractions demonstrated inhibitory effects on NF-κB activity. This phenomenon supported the notion that quinic acid derivatives and flavonoids result in a synergistic effect in the repression of NF-κB activity. Hyperglycemia induces inflammatory responses, producing free radicals that can lead to type II diabetes.40 Polyphenols exert their protective effects against diabetes mellitus by suppressing inflammatory responses.41,42 It is supposed that the hypoglycemic effects of MEB are mediated, at least in part, by the inhibition of NF-κB activity. Activation of PPARs in the treatment of type II diabetes mellitus (T2DM) has proven effective in improving insulin sensitivity, hyperglycemia, and lipid metabolism.43
PPARs are important in controlling the expression of genes involved in the regulation of glucose, lipid, and cholesterol metabolism; cell growth; and cell differentiation by binding to specific PPREs at the enhancer sites of target genes.44 Activation of PPARs contributed to anti-inflammatory effects in several cell types, including liver cells.12 The anti-inflammatory properties of PPARs are often associated with the repression of transcriptional pathways involved in inflammatory responses, such as modulation of NF-κB signaling. Currently, MEB have been shown to stimulate PPRE activity and induce up-regulation of PPARγ mRNA expression. This suggested that the repression of NF-κB activity by MEB is closely related to the simultaneous PPRE activity. This result is further supported by the observation that quinic acid derivatives and flavonoids have no effect on PPRE activity. However, the existing result could not rule out the contribution of PPARα and PPARβ to PPRE activity. The potential mechanism of PPRE activity mediation by MEB requires further study.
Recently, GLUT-2 has drawn attention as a molecule that might be involved in the pathogenesis of diabetes mellitus. Improvement of insulin signaling in HepG2 is involved in enhancing the GLUT-2 expression.45 GLUT-2 is a glucose transporter that is mainly present in the plasma membrane of pancreatic β-cells. GLUT-2 has been shown to have blood glucose regulation functions through the control of insulin secretion,46 and it was reported that GLUT-2 mRNA and protein expression were reduced by hyperinsulinemia and increased by hyperglycemia in the liver of diabetic rats.47 Rutin, a flavonoid isolated from Toona sinensis Roem, has the ability to enhance insulin-dependent receptor kinase (IRK) activity and glucose transporter 4 (GLUT4) translocation in differentiated myotubes.48 Chlorogenic acid (CGA), a common dietary polyphenol with numerous biologically activities, reversed the downregulation of GLUT-2 induced by a HFD (high-fat diet).49 Consistently, the present study demonstrated that MEB stimulated GLUT-2 mRNA expression in liver cells. Polyphenol-rich Chrysanthemum morifolium extract (CME) also showed the ability to reverse the decline of PPARα/γ and GLUT-2 induced by alloxan. Chemical constituents analysis showed that chlorogenic acid, dicaffeoylquinic acid, and apigenin were the major polyphenols of CME, and those polyphenols might exert a synergic hypoglycemic effect via PPARα/γ-mediated mechanisms.50 Pongamia glabra (PBME) and Ficus glomerata (FBME) produced a synergistic hypoglycemic effect with combined therapy at low doses. The primary constituents in the two plants were flavonoids, furanoflavonoids, sterols, saponins, glycosides, glaunol, tannins, and other polyphenol compounds.51 Through inhibition of oxidative stress, polyphenols protect against the effects of chronic diseases mediated by inflammatory responses.52
Taken together, blueberry extract may exert hypoglycemic properties through the synergistic effects of caffeoylquinic acid derivatives and quercetin glycosides, and the hypoglycemic effect is involved in an increase of GLUT-2 and PPARγ expression and inhibition of the relevant inflammatory pathways. Although further efforts are needed to define the hypoglycemic mechanisms of blueberry extract in diabetic animal model, a diet rich in blueberry extract may be a potential chemopreventive tool useful for the management of diabetes.
Acknowledgments
The project was supported by the National Natural Science Foundation of China (31500286) and the Natural Science Foundation of Jiangxi Province (20161BAB214167). We thank Nature Research Editing Service for its linguistic assistance during the preparation of this manuscript.
Author contributions
Weifeng Huang and Chunpeng Wan conceived and designed the experiments; Liangliang Yao, Xiao He, Lei Wang, Mingxi Li, and Youxin Yang performed the experiments; Weifeng Huang and Chunpeng Wan analyzed the data; Chunpeng Wan contributed reagents/materials/analysis tools; Weifeng Huang and Chunpeng Wan wrote the paper. All authors contributed toward data analysis, drafting and revising the paper and agree to be accountable for all aspects of the work.
Disclosure
The authors declare no conflicts of interest in this work.
References
 © 2018 The Author(s). This work is published and licensed by Dove Medical Press Limited. The
full terms of this license are available at https://www.dovepress.com/terms
and incorporate the Creative Commons Attribution
- Non Commercial (unported, 3.0) License.
By accessing the work you hereby accept the Terms. Non-commercial uses of the work are permitted
without any further permission from Dove Medical Press Limited, provided the work is properly
attributed. For permission for commercial use of this work, please see paragraphs 4.2 and 5 of our Terms.
© 2018 The Author(s). This work is published and licensed by Dove Medical Press Limited. The
full terms of this license are available at https://www.dovepress.com/terms
and incorporate the Creative Commons Attribution
- Non Commercial (unported, 3.0) License.
By accessing the work you hereby accept the Terms. Non-commercial uses of the work are permitted
without any further permission from Dove Medical Press Limited, provided the work is properly
attributed. For permission for commercial use of this work, please see paragraphs 4.2 and 5 of our Terms.