Back to Journals » Diabetes, Metabolic Syndrome and Obesity » Volume 15
Hyperferritinemia Correlates to Metabolic Dysregulation and Steatosis in Chinese Biopsy-Proven Nonalcoholic Fatty Liver Disease Patients
Authors Wang Q, Zhu M, Li H, Chen P, Wang M, Gu L ![]() , Zhang X, Chen L
, Zhang X, Chen L ![]()
Received 4 February 2022
Accepted for publication 22 April 2022
Published 17 May 2022 Volume 2022:15 Pages 1543—1552
DOI https://doi.org/10.2147/DMSO.S361187
Checked for plagiarism Yes
Review by Single anonymous peer review
Peer reviewer comments 2
Editor who approved publication: Prof. Dr. Antonio Brunetti
Qingling Wang,1,2,* Mingyu Zhu,2,* Hu Li,3 Peizhan Chen,4 Mingjie Wang,2 Leilei Gu,2 Xinxin Zhang,5 Li Chen2
1The Affiliated Hospital of Kunming University of Science and Technology, Kunming, People’s Republic of China; 2Department of Gastroenterology, Ruijin Hospital, School of Medicine, Shanghai Jiao Tong University, Shanghai, People’s Republic of China; 3Department of Infectious Disease, Shanghai Jiao Tong University Affiliated Sixth People’s Hospital, Shanghai, People’s Republic of China; 4Central Laboratory, Ruijin Hospital, School of Medicine, Shanghai Jiao Tong University, Shanghai, People’s Republic of China; 5Department of Infectious Disease, Research Laboratory of Clinical Virology, Ruijin Hospital, Shanghai Jiao Tong University School of Medicine, Shanghai, People’s Republic of China
*These authors contributed equally to this work
Correspondence: Li Chen, Department of Gastroenterology, Ruijin Hospital, Shanghai Jiao Tong University, School of Medicine, Shanghai, People’s Republic of China, Email [email protected]
Purpose: Elevated serum ferritin (SF), also defined as hyperferritinemia, is commonly seen in patients with nonalcoholic fatty liver disease (NAFLD). However, the clinical significance of SF in NAFLD remains controversial. The aim of this study was to characterize the NAFLD patients with elevated SF and to explore the association of hyperferritinemia with the severity of NAFLD proved by liver biopsy in the Chinese population.
Patients and Methods: A total of 136 NAFLD patients proved by liver biopsy were enrolled. The demographic, anthropometric, clinical historic, laboratory, and histological characteristics were compared between elevated and normal SF groups. The independent factors for elevated SF were determined using multivariate logistic regression analysis.
Results: The median age and body mass index were 41.00 (33.00– 57.75) years and 28.28 (26.28– 31.34) kg/m2, respectively. Hyperferritinemia was detected in 57 (41.9%) patients. Patients in the elevated SF group presented with more severe lipo- and glucometabolic disorder, and higher aminotransferases compared to those in the normal SF group (p < 0.05). In terms of histopathology, elevated SF was associated with worse steatosis and a higher proportion of positive iron staining (p < 0.05). Multivariate logistic regression analysis identified homeostasis model assessment of insulin resistance (OR: 1.170, 95% CI: 1.036– 1.322, p = 0.012), alanine aminotransferase (OR: 1.012, 95% CI: 1.005– 1.019, p < 0.001), and positive Perl’s staining (OR: 4.880, 95% CI: 2.072– 11.494, p < 0.001) as independent risk factors of hyperferritinemia.
Conclusion: NAFLD patients with hyperferritinemia were characterized as more severe metabolic dysfunction and liver injury. More attention should be paid to the metabolism state of NAFLD patients with elevated SF. Hyperferritinemia was correlated to hepatic steatosis in Chinese NAFLD patients.
Keywords: nonalcoholic fatty liver disease, hyperferritinemia, histopathology, metabolic dysregulation, steatosis
Introduction
Non-alcoholic fatty liver disease (NAFLD) is the liver manifestation of systemic metabolic dysregulation. In parallel with the continued growth of obesity incidence, the prevalence of NAFLD in the general population increases to 29.2% in China,1 similar to the global prevalence of 30%.2 As a continuum of liver dysfunctions, NAFLD encompasses a disease spectrum, ranging from non-alcoholic fatty liver, non-alcoholic steatohepatitis (NASH), to liver cirrhosis, and even hepatocellular carcinoma. NAFLD is tightly correlated to multiple extrahepatic complications, including cardiovascular disease and extrahepatic malignancy.3 Due to the limitation of invasiveness and sampling bias of liver biopsy, as well as the unsatisfactory performance of serum aminotransferases for assessing the severity of NAFLD, novel biomarkers were an unmet need in the clinic.
Ferritin is a shell protein that sequesters a majority of iron to prevent iron-mediated oxidative damage by the Fenton reaction.4 Serum ferritin (SF) can be synthesized by hepatocyte and Kupffer cells, and is originally considered as a biomarker of body iron content, or an acute-phase protein.5 In recent years, the association of SF and several metabolic abnormalities gains high attention. Under the condition of overload, iron not only reduces the beta-cell function, but also affects glucose and lipid homeostasis by impairing the response to insulin in the liver, muscle, and adipose tissue.6 Hence, SF is closely associated with insulin resistance and metabolic syndrome (MetS).7
Although hyperferritinemia is commonly seen in patients with NAFLD, the clinical significance of SF remains controversial. Some studies reported that elevated SF is associated with steatosis, lobular inflammation, or hepatocellular ballooning,8 while others suggest hyperferritinemia is correlated with liver fibrosis9,10 in patients with NAFLD proved by liver biopsy in the western population. Several studies in Chinese NAFLD patients suggest that SF is a valuable non-invasive biomarker in predicting advanced fibrosis diagnosed by FIB-4 ≥1.3,11 and the risk of NAFLD diagnosed by ultrasonography.12,13 However, the association between SF and the histopathological severity of NAFLD is not well defined in Chinese biopsy-proven patients. Thus, the present study aims to characterize NAFLD patients with hyperferritinemia, and to explore the association of hyperferritinemia with the severity of NAFLD in Chinese NAFLD patients confirmed by liver biopsy.
Patients and Methods
Study Population
A total of 178 NAFLD patients who received liver biopsy during 2018, November to 2021, November were enrolled in this study. All patients had no excessive alcohol uptake (more than 30 g daily for men or 20 g daily for women).14
The exclusion criteria were: (1) younger than 18 years; (2) lack of SF value three months before and after the day of liver biopsy, or iron deficiency indicated by SF lower than the low limit of normal (ie, 11.0 ng/mL for women and 23.9 ng/mL for men); (3) coexisted with other etiologies, such as hepatitis B/C infection, hepatolenticular degeneration, autoimmune liver disease, hyperthyroidism, hereditary hemochromatosis, drug induced fatty liver, and polycystic ovary syndrome.15
This study was approved by the Institutional Ethics Committee of Ruijin Hospital, Shanghai Jiao Tong University and complied with the Declaration of Helsinki. Written informed consent was obtained from all enrolled patients.
Definitions
NAFLD was defined as histological hepatocyte steatosis associated with metabolic dysfunction in the absence of excessive alcohol uptake and other etiologies, according to the practice guidance from the American Association for the Study of Liver Disease.16 Hyperferritinemia was defined as the value of SF above the upper limit of normal (336.2ng/mL in male or 306.8 ng/mL in female). Hypertension was diagnosed when blood pressure was higher than 140/90mmHg measured at least two times on different days, or subjects had a definite history of hypertension. Type 2 diabetes mellitus (T2DM) was diagnosed when patients had the definite history of T2DM regardless of treatment with hypoglycemic agents, or serum fasting blood glucose (FBG) level ≥7.0 mmol/L, or glycated hemoglobin A1c (HbA1c) ≥6.5%.17 The diagnosis of MetS was considered when patients met at least three of the following terms according to the International Joint Interim Statement:18 (1) waistline ≥85cm in males or ≥80cm in females, (2) history of hypertension, or systolic blood pressure ≥130mmHg, or diastolic blood pressure ≥85mmHg, (3) history of T2DM or FBG ≥5.6mmol/L, (4) fasting serum triglyceride (TG) ≥1.7mmol/L or lipid-lowering drug treatment, (5) fasting serum high-density lipoprotein (HDL) <1.0mmol/L in males or <1.3mmol/L in females.
Data Collection and Laboratory Assessment
The demographic characteristics (age, sex), anthropometric information (height, weight, waistline), and medical history (presence of T2DM, hypertension) were collected at the day before liver biopsy. The body mass index (BMI) was computed via weight (Kg) divided by the square of height (m2).
Blood samples were obtained from peripheral vein after 8 hours of overnight fasting at the day of biopsy, and then tested at the Clinical Laboratory Diagnostic Center of Ruijin Hospital, Shanghai Jiao Tong University School of Medicine. Serum biochemical test was carried out using an automatic biochemistry analyzer (AU5800 Automatic Biochemical Analyzer, Beckman Coulter, USA). SF was measured using the automatic immunoassay device (UniCel DXL800 Automatic Immunoassay system; Beckman Coulter; USA). Serum insulin was analyzed through electrochemical luminescence automatic immune analysis system (Roche Cobas E 601, Roche, Switzerland). Plasma HbA1c was examined using high performance liquid chromatography (D-100 Hemoglobin Testing System, BIO-RAD, USA). Total blood cell counts were analyzed using an automatic blood cell analyzer (LH750 Automatic Blood Cell Analyzer, Beckman Coulter, USA). All laboratory tests were standardized and certified. The homeostasis model assessment of insulin resistance (HOMA-IR) was calculated through FBG (mmol/L) multiplied insulin (μU/mL) and then divided by 22.5.
Histopathology Evaluation
All liver specimens were obtained through percutaneous liver puncture guided by abdominal ultrasonography. Each specimen was routinely stained with Hematoxylin & Eosin, Masson triple, Sirius Red, and Perl’s blue staining.
The histological features were evaluated according to the Steatosis-Activity-Fibrosis scoring system by two experienced pathologists based on the following criteria:19 the degree of hepatocyte steatosis less than 5%, 5–33%, 34–66%, and more than 67% was defined S0, S1, S2, and S3, respectively. Hepatocellular ballooning was graded as follows: 0 point means normal cuboidal hepatocytes with pink eosinophilic cytoplasm; 1 point means the presence of clusters of rounded hepatocytes with pale cytoplasm usually reticulated and quite similar size to that of normal hepatocyte although the shape is different; 2 points means the presence of at least one enlarged hepatocyte with the size of 2-fold or more than that of normal cells based on features of 1 point. Lobular inflammation was defined as a focus of two or more inflammatory cells counted at 20x magnification with foci within the lobule: none, ≤2, and >2 foci per 20x were considered as 0, 1, and 2 points, respectively. The sum of lobular inflammation and hepatocellular ballooning was considered as inflammation activity score ranging from 0 to 4 points. The severity of fibrosis was graded according to the scoring system proposed by the Pathology Committee of the NASH-Clinical Research Network:20 absence of fibrosis, zone 3 perisinusoidal or perivenular fibrosis, zone 3 perisinusoidal and perivenular fibrosis, bridging fibrosis, and cirrhosis was defined as F0, F1, F2, F3, and F4, respectively.
Statistical Analysis
The qualitative variables were defined as categorical data, and described as frequencies and percentages, while Pearson’s Chi-square or Fisher’s exact test was exploited to analyze the difference of proportion when appropriate. The quantitative variables were deemed as continuous variables, and described as medians and interquartile range. The Kolmogorov–Smirnov test was used to evaluate whether the continuous variables are distributed normally. The Student’s t test or Analysis of Variance were performed when variables distributed normally; otherwise, Mann–Whitney U or Kruskal–Wallis H-test was employed. Binary logistic regression analysis was used to examine the independent risk factors of hyperferritinemia.
All analyses were performed using IBM SPSS software (version 22.0, IBM, USA), using two-sided p values, while all figures were pictured using GraphPad Prism (version 8.4.3, GraphPad, USA). In all analyses, p < 0.05 was deemed as statistically significant and presented as *while p < 0.01 as **p < 0.001 as ***and not significant as ns.
Results
Clinical Characteristics of Study Population
A total of 136 patients who met the inclusion criteria were enrolled in the final analysis, while 42 were excluded for various reasons (Figure 1). The clinical and demographic parameters of overall patients are summarized in Table 1. The median age and BMI were 41.00 (33.00–57.75) years and 28.28 (26.28–31.34) Kg/m2, respectively. There were 57 (41.9%) patients showed elevated ferritin level [514.50 (414.30–644.40) ng/mL], while 79 (58.1%) patients exhibited normal serum ferritin level [179.50 (120.60–246.70) ng/mL]. The age of patients with elevated SF was younger than those with normal SF [38.00 (31.00–55.50) vs 45.00 (35.00–60.00) years, p = 0.018].
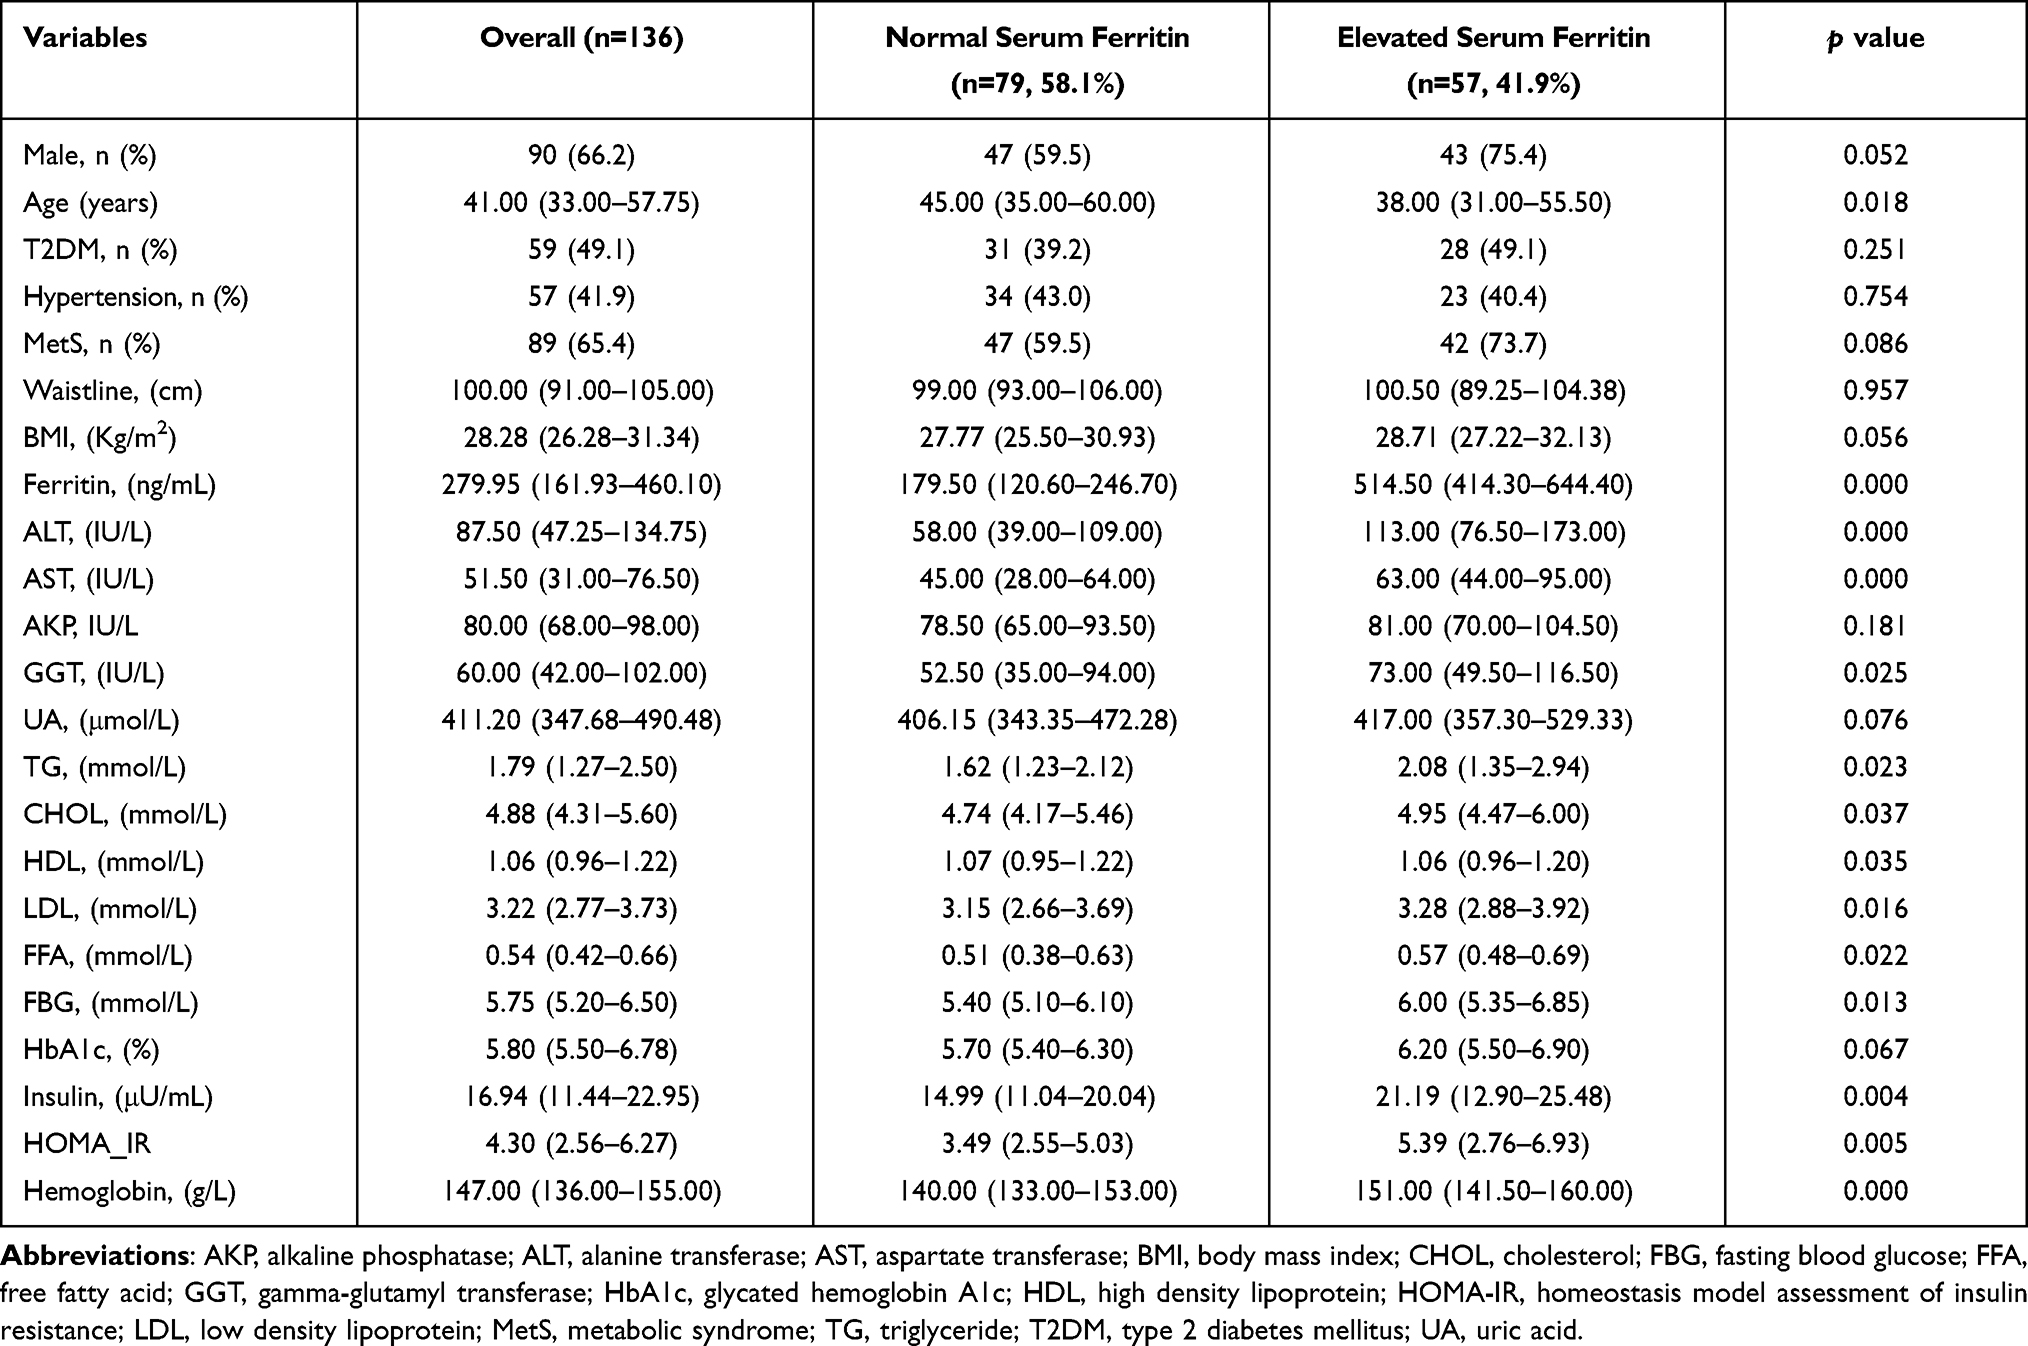 |
Table 1 The Clinical and Demographic Characteristics of Enrolled NAFLD Patients |
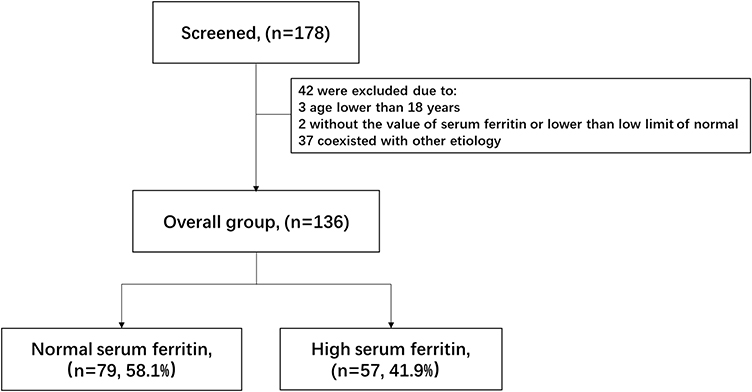 |
Figure 1 The flow chart for patient inclusion. |
Differences of Laboratory Characteristics Between Elevated and Normal SF Groups
All laboratory data are shown in Table 1. The serum level of alanine aminotransferase (ALT), aspartate aminotransferase (AST), and gamma-glutamyl transferase (GGT) of patients in the elevated SF group were higher than those in the normal SF group [113.00 (76.50–173.00) vs 58.00 (39.00–109.00) IU/L, 63.00 (44.00–95.00) vs 45.00 (28.00–64.00) IU/L, 73.00 (49.50–116.50) vs 52.50 (35.00–94.00) IU/L, p < 0.05]. In terms of lipid and glycometabolism, the serum level of triglyceride (TG), cholesterol, low-density lipoprotein, free fatty acid, FBG, insulin, and HOMA-IR of patients were significantly higher in the elevated SF group compared to those in the normal SF group [2.08 (1.35–2.94) vs 1.62 (1.23–2.12) mmol/L, 4.95 (4.47–6.00) vs 4.74 (4.17–5.46) mmol/L, 3.28 (2.88–3.92) vs 3.15 (2.66–3.69) mmol/L, 0.57 (0.48–0.69) vs 0.51 (0.38–0.63) mmol/L, 6.00 (5.35–6.85) vs 5.40 (5.10–6.10) mmol/L, 21.19 (12.90–25.48) vs 14.99 (11.04–20.04) μIU/mL, and 5.39 (2.76–6.93) vs 3.49 (2.55–5.03), p < 0.05], while the uric acid and HbA1c were not different between two groups (p > 0.05).
The Association Between Hyperferritinemia and Liver Histopathology
The association between elevated SF and severity of hepatic histopathology was analyzed, respectively, with hepatocyte steatosis, inflammatory activity, and fibrosis. As shown in Table 2, the proportion of patients who exhibited steatosis ≥33% was significantly greater in the elevated SF group than that in the normal SF group (80.7% vs 64.6%, p = 0.040), and the median level of SF in patients with steatosis ≥33% was higher than those that in those with steatosis <33% [304.30 (188.05–506.21) vs 205.70 (124.20–416.10) ng/mL, p = 0.037, Figure 2A]. The proportion of patients with 4-point inflammation activity was significantly higher compared to those in the normal SF group (63.2% vs 43.0%, p = 0.021). In addition, there is a positive trend between the SF and inflammation activity with the exception of 1 point (p = 0.093, Figure 2B). Meanwhile, a increasing trend between the SF and fibrosis stage 1 to 3 (p = 0.196), except stage 4, was found (Figure 2C).
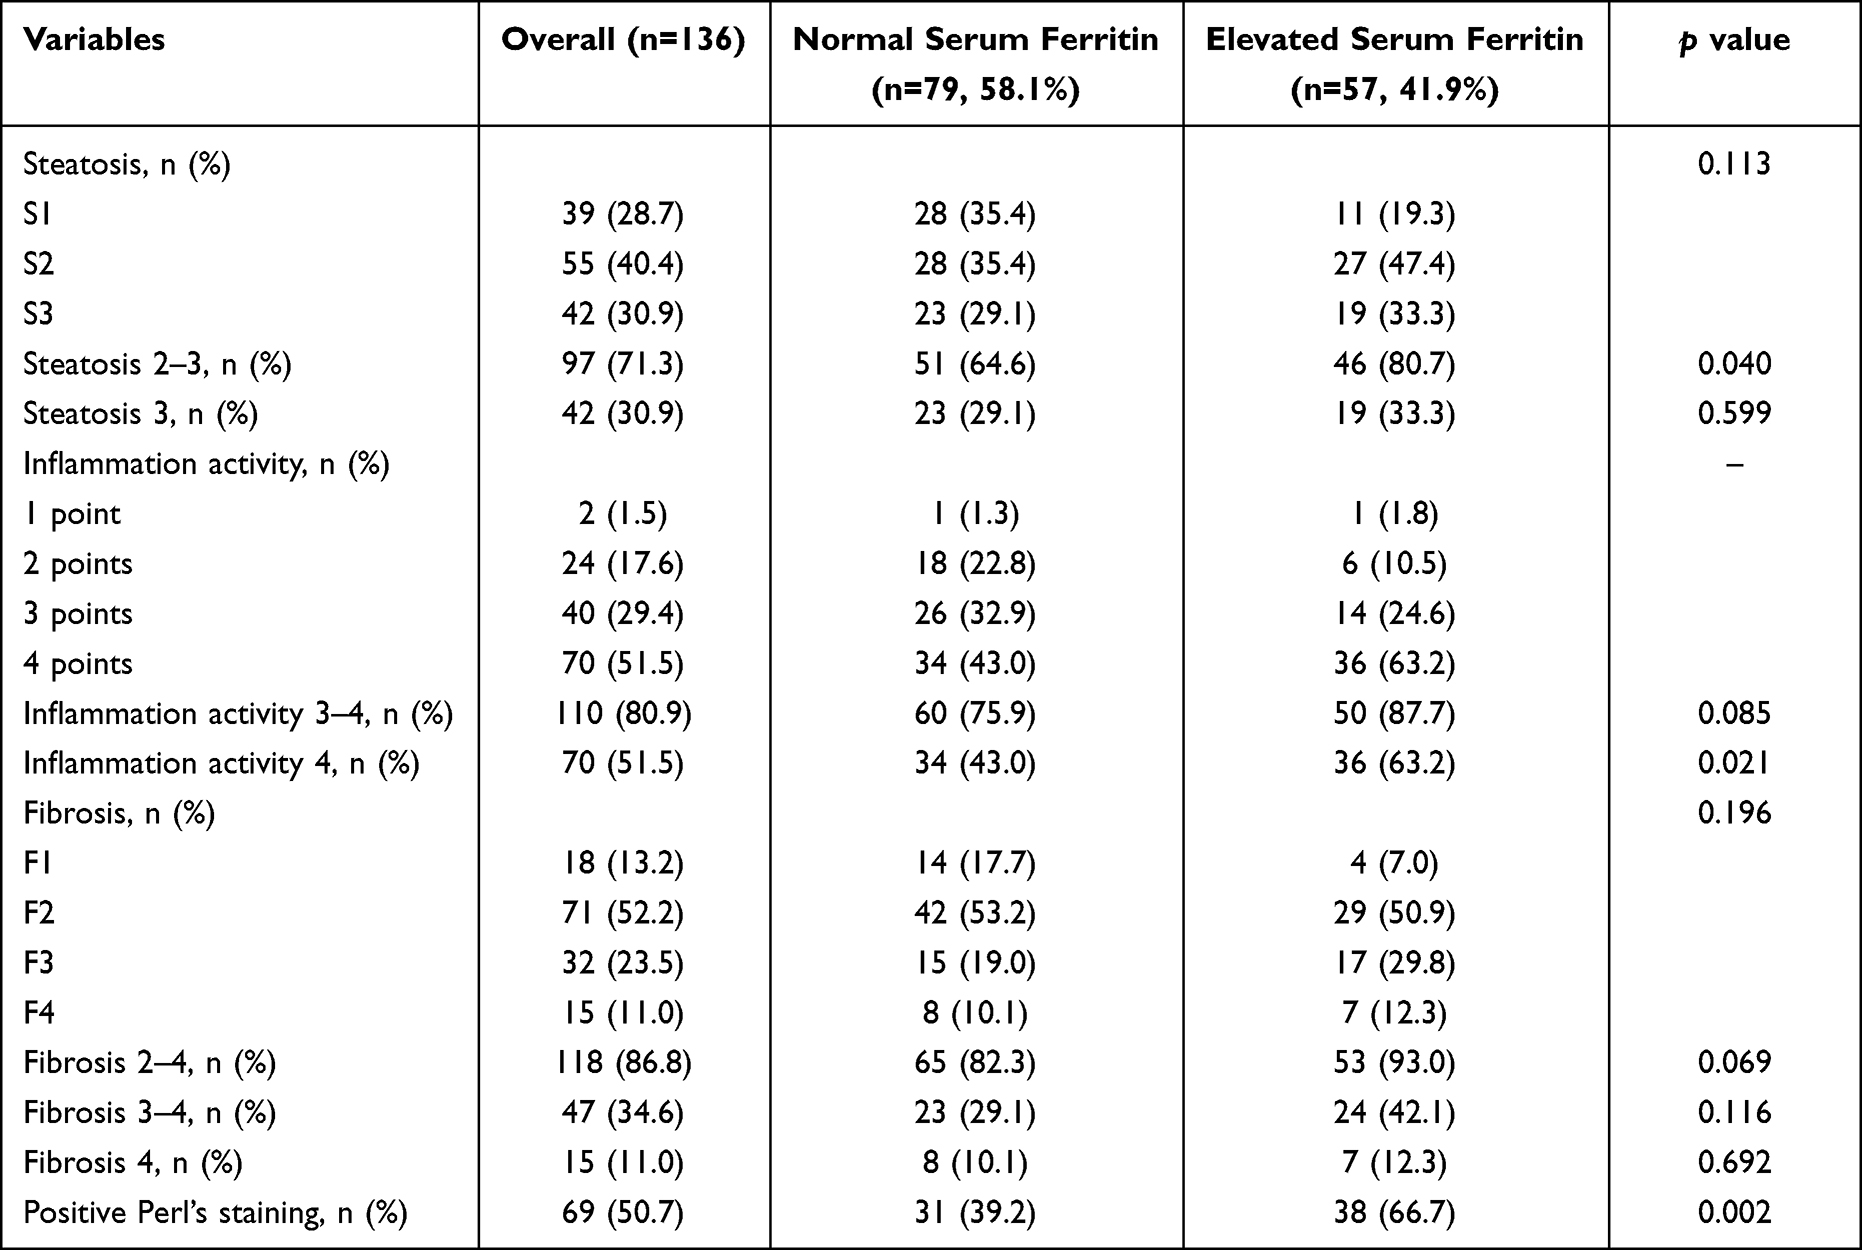 |
Table 2 The Histopathological Features of Enrolled NAFLD Patients |
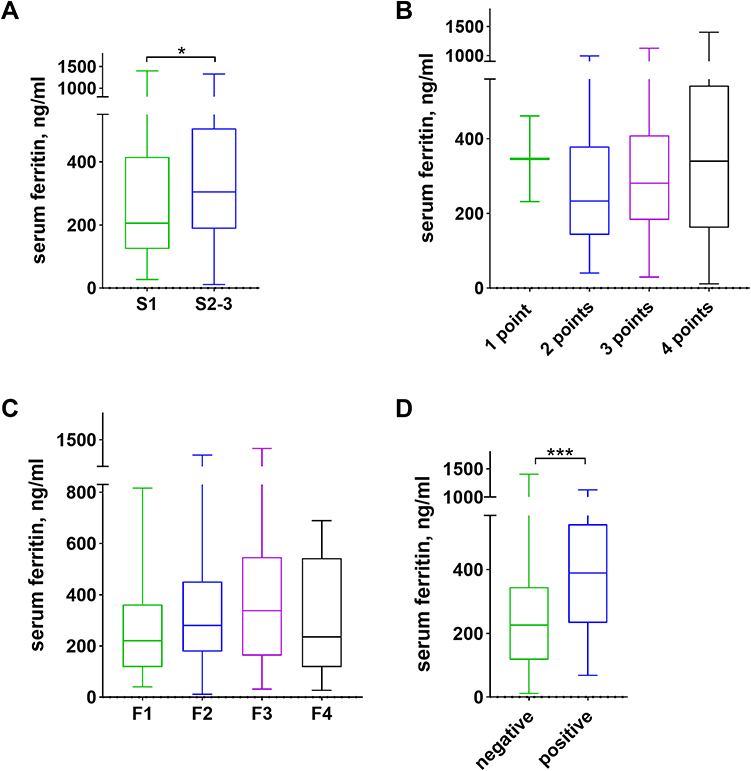 |
Figure 2 The relationship of serum ferritin levels and the liver histopathology. (A) Steatosis stage 1 vs 2–3, (B) inflammation activity from 1 to 4 points, (C) fibrosis stage from 1 to 4, (D) negative vs positive Perl’s staining. The value within the box ranges from the 25th to the 75th percentiles. The median is shown by the horizontal bar. The vertical bars represent the values between the minimum and the maximum. The * Indicates as p < 0.05 while *** as p < 0.001. |
The Association Between Hyperferritinemia and Hepatic Iron Deposition
The hepatic iron deposition indicated by positive Perl’s staining was found in 69 (50.7%) patients. The proportion of hepatic iron deposition in the elevated SF group was significantly greater than that in the normal SF group (66.7% vs 39.2%, p = 0.002). The median level of SF in patients with hepatic iron deposition was significantly higher than that in those with negative Perl’s staining [389.20 (232.50–542.95) vs 226.50 (117.00–345.70) ng/mL, p < 0.001, Figure 2D].
Risk Factors Associated with Hyperferritinemia in NAFLD Patients
To identify the risk factors of hyperferritinemia in patients, multivariable logistic regression was performed including statistically associated variables. After adjustment of sex and presence of T2DM, the HOMA-IR (OR: 1.170, 95% CI: 1.036–1.322, p = 0.012), ALT (OR: 1.012, 95% CI: 1.005–1.019, p < 0.001), and positive Perl’s staining (OR: 4.880, 95% CI: 2.072–11.494, p < 0.001) were independently associated with elevated SF level (Table 3).
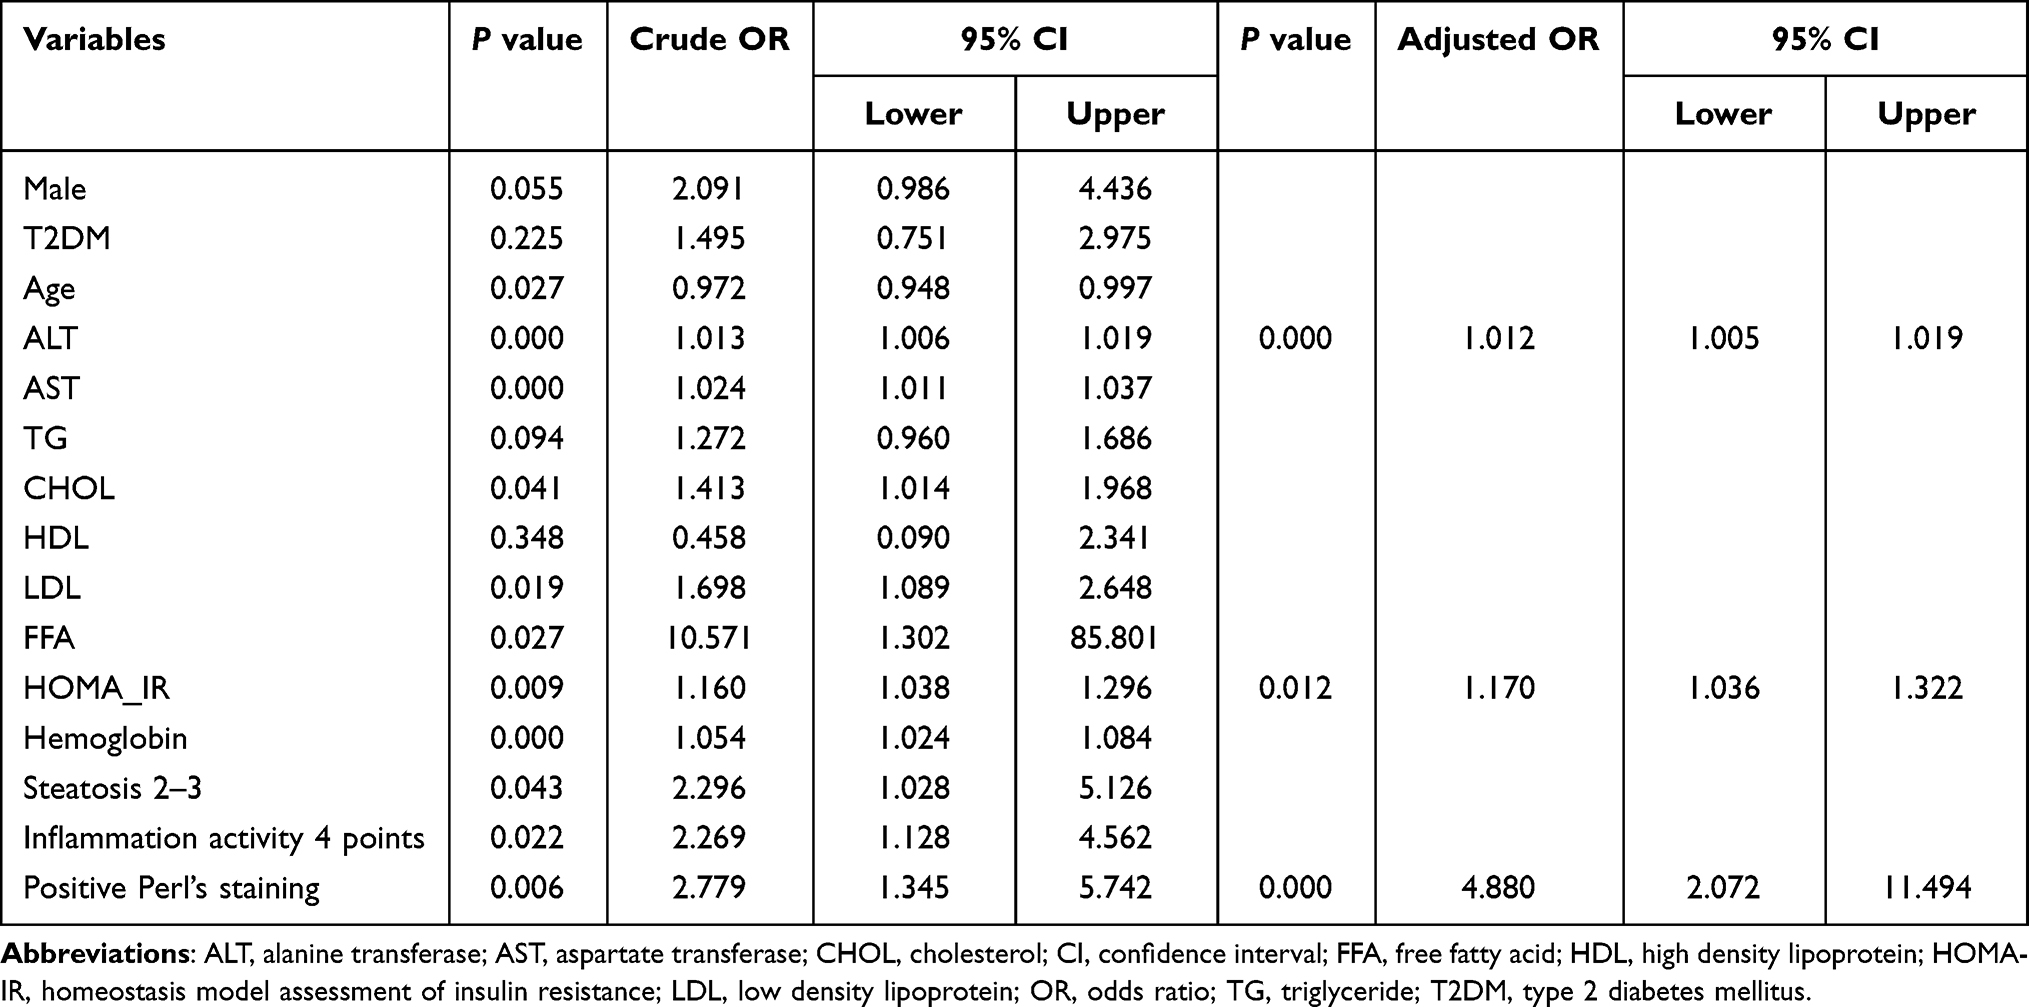 |
Table 3 Risk Factors of Hyperferritinemia on Univariate and Multivariable Logistic Regression Analysis |
Discussion
This is the first study to investigate the significance of serum ferritin in Chinese biopsy-proven NAFLD patients. The present study showed that 41.9% of patients had elevated SF in biopsy confirmed NAFLD patients from the Chinese population. The NAFLD patients with elevated SF exhibited different clinical characteristics including more severe metabolic dysregulation and liver function abnormality. Histologically, hyperferritinemia was correlated to worse hepatic steatosis and higher hepatic iron deposition. After adjusting the cofounders, HOMA-IR, ALT, and hepatic iron deposition were independent risk factors of hyperferritinemia.
Iron plays a vital role in mammalian homeostasis, while its various sources and limited excretion lead to a tendency of iron retention and bring an extensive risk of iron overload. The liver is not only the main organ maintaining iron homeostasis, but also the target of iron toxicity as it stores excessive iron.21 Iron can catalyze the formation of reactive oxygen species by Fenton reaction. Once the physiological antioxidative capacity is overwhelmed, these reactive oxygen species would promote oxidative stress, immune cell activation, and hepatocellular injury.22 Thus, SF increased in order to orchestrate the cellular defense system. Similar to previous studies,8,9,23 our study also showed that SF was associated with liver iron deposition indicated by positive Perl’s staining, which was one of the independent risk factors of hyperferritinemia.
Existing literature have proposed an association of iron overload with metabolic dysregulation. The oxidative products induced by iron through the Fenton reaction may lead to dyslipidemia and glucose dysmetabolism.24 Ferritin can post-translationally block the secretion of apolipoprotein B, which transports intracellular cholesterol ester and TG in very low-density lipoprotein particles.25 In the present study, the lipid and glucose dysmetabolic biomarkers of NAFLD patients with elevated SF were significantly higher than those with normal SF, and HOMA-IR was independently associated with hyperferritinemia. In turn, metabolic abnormalities are correlated with more progressive disease in patients with NAFLD. A meta-analysis manifested that T2DM is associated with a 2.25-fold increased risk of advanced fibrosis, cirrhosis with or without complications, and liver-related mortality, while lipid dysmetabolism and hypertension are associated with a smaller hazard ratio of those adverse events.26 Thus, evaluation of metabolism associated parameters is of importance for NAFLD patients with hyperferritinemia, not only for timely diagnosis and intervention, but also for improvement of prolonged prognosis.
Our study also found an association of hyperferritinemia with histological steatosis, which is similar to previous literature that SF was associated with liver fat content measured by magnetic resonance imaging.27 This can be explained by that SF is a biomarker of insulin resistance, which leads to the accumulation of free fatty acid in the liver. The trend that SF increases along with the degree of fibrosis, however, decreases at cirrhosis is similar to the “burn-out” effect that liver steatosis obviously regresses at cirrhosis28 further supports this view.
A previous study showed that SF higher than 1.5 times the upper limit of normal was associated with a 1.66-fold higher risk of advanced fibrosis (grade 3 or 4).9 Another study enrolled 1014 Japanese NAFLD patients with histological evidence also suggested that increased SF was correlated to the presence of fibrosis although the diagnostic accuracy was low.10 However, in the present study, there was only a trend between the SF and fibrosis stage 1 to 3 (p = 0.196), except stage 4. Such discrepancy could be explained by the following reasons. Firstly, compared to the patients with a median age of 41.00 (33.00–57.75) years in our group, the age of patients in other studies were obviously older (47.7 ± 11.8 and 46.9 ± 0.4 years, respectively)9,10 which indicates a longer history of the disease. The previous study showed that fibrosis progresses one stage gradually in patients with NAFL for 14.3 years and NASH for 7.1 years,29 thus the fibrosis was more severe in elderly patients with NAFLD.30 Secondly, the BMI of patients [28.28 (26.28–31.34) Kg/m2] in our study were apparently lower than that in those studies (34.0 ± 6.3 and 31.3 ± 0.2 Kg/m2, respectively).9,10 Literature have shown that higher BMI is associated with more deteriorating NAFLD fibrosis score.31,32 Hence, we proposed that the association between SF and fibrosis of NAFLD should be evaluated based on age and BMI. In the young and low BMI population, high SF level was associated with liver steatosis; while in old and high BMI individuals, high SF level was associated more with liver fibrosis. A study that the combination with SF higher than 240 ng/mL and BMI greater than 28.2 kg/m2 can identify patients at risk of fibrosis with an 82% sensitivity and a 79% specificity,33 further supports our view. However, such assumption needs to be verified in further research that more patients with a wide range of age and BMI will be enrolled.
In the present study, the change of SF showed a tendency that SF increased along with the point of inflammation activity with the exception of 1 point. In the group of inflammation activity with 1 point, there are only two patients. As an inflammatory protein, SF would increase under chronic inflammatory diseases, including NAFLD.3 Indeed, biomarkers of liver injury, including serum ALT, AST, and GGT were significantly higher in patients with elevated SF, particularly ALT was independently associated with elevated SF.
The superiority of the present study is that the diagnosis of NAFLD relies on liver pathophysiology through liver biopsy. However, the previous studies were based on ultrasonography. Liver biopsy is still the gold standard for diagnosis of NAFLD, which makes our conclusion more reliable. Furthermore, the objects enrolled in this study represent the characters of the Chinese population, who are notably different from the western population. Chinese are more likely to have visceral fat deposition with a low BMI and cutoff value of overweight and obesity.34
There are also limitations in this study. First is the bias of selection, which makes patients enrolled distributed unequally in each histological stage, with seldom mild NAFLD or definite cirrhosis. Secondly, the sample size is relatively small. In the real world, because of the inconvenience and risks of liver biopsy, it is not readily acceptable in NAFLD patients. NAFLD is a usually asymptomatic disease, and is not taken seriously. Therefore, only those patients with suspicious advanced fibrosis, indefinitely diagnosis, or progressive liver injury although after the positive intervention, are suggested to perform liver biopsy, thus the bias is inevitable and the number of patients is limited.
Conclusion
In summary, NAFLD patients with elevated SF presented with more severe lipid and glucose dysmetabolism. The routine evaluation of metabolic state is necessary for Chinese NAFLD patients with hyperferritinemia. Once coexistence with metabolic dysregulation, more positive and effective intervention is needed to improve hepatic or extrahepatic-related adverse events. Histologically, hyperferritinemia was more associated with steatosis and higher hepatic iron deposition. We proposed that the association between SF and the severity of NAFLD should be evaluated based on age and BMI, which needs further investigation.
Acknowledgments
We thank the staff in the Clinical Laboratory Diagnostic Center for their technical assistance and all the participants enrolled in the study.
Author Contributions
All authors made a significant contribution to the work reported, whether that is in the conception, study design, execution, acquisition of data, analysis and interpretation, or in all these areas; took part in drafting, revising or critically reviewing the article; gave final approval of the version to be published; have agreed on the journal to which the article has been submitted; and agree to be accountable for all aspects of the work.
Funding
This work was supported in part by the Ruijin Hospital Research Initiative Project (grant number 2019ZX01).
Disclosure
The authors report no conflicts of interest in this work.
References
1. Zhou F, Zhou J, Wang W, et al. Unexpected rapid increase in the burden of NAFLD in China from 2008 to 2018: a systematic review and meta-analysis. Hepatology. 2019;70(4):1119–1133. doi:10.1002/hep.30702
2. Targher G, Tilg H, Byrne C. Non-alcoholic fatty liver disease: a multisystem disease requiring a multidisciplinary and holistic approach. Lancet Gastroenterol Hepatol. 2021;6(7):578–588. doi:10.1016/S2468-1253(21)00020-0
3. Friedman SL, Neuschwander-Tetri BA, Rinella M, Sanyal AJ. Mechanisms of NAFLD development and therapeutic strategies. Nat Med. 2018;24(7):908–922. doi:10.1038/s41591-018-0104-9
4. Torti F, Torti S. Regulation of ferritin genes and protein. Blood. 2002;99(10):3505–3516. doi:10.1182/blood.V99.10.3505
5. Kernan K, Carcillo J. Hyperferritinemia and inflammation. Int Immunol. 2017;29(9):401–409. doi:10.1093/intimm/dxx031
6. Fernández-Real J, McClain D, Manco M. Mechanisms linking glucose homeostasis and iron metabolism toward the onset and progression of type 2 diabetes. Diabetes Care. 2015;38(11):2169–2176. doi:10.2337/dc14-3082
7. Zhang W, Xing Y, Shao B. Serum ferritin and the risk of metabolic syndrome: a systematic review and dose-response meta-analysis of cross-sectional studies. Biomed Environ Sci. 2021;34(8):623–631. doi:10.3967/bes2021.086
8. Buzzetti E, Petta S, Manuguerra R, et al. Evaluating the association of serum ferritin and hepatic iron with disease severity in non-alcoholic fatty liver disease. Liver Int. 2019;39(7):1325–1334. doi:10.1111/liv.14096
9. Kowdley K, Belt P, Wilson L, et al. Serum ferritin is an independent predictor of histologic severity and advanced fibrosis in patients with nonalcoholic fatty liver disease. Hepatology. 2012;55(1):77–85. doi:10.1002/hep.24706
10. Angulo P, George J, Day C, et al. Serum ferritin levels lack diagnostic accuracy for liver fibrosis in patients with nonalcoholic fatty liver disease. Clin Gastroenterol Hepatol. 2014;12(7):1163–1169.e1161. doi:10.1016/j.cgh.2013.11.035
11. Yao J, Dai Y, Zhang J, Zhang X, Zheng R. Association between serum ferritin level and nonalcoholic fatty liver disease in a non-obese Chinese population: a cross-sectional study. Clin Lab. 2019;65(6). doi:10.7754/Clin.Lab.2019.181250
12. You G, Ding J, Shen J, Wang Y, Sun Y. Association between serum ferritin and non-alcoholic fatty liver disease among middle-aged and elderly Chinese with normal weight. Asia Pac J Clin Nutr. 2019;28(4):747–753. doi:10.6133/apjcn.201912_28(4).0011
13. Pan X, Chen B, Liu W, et al. Circulating iron levels interaction with central obesity on the risk of nonalcoholic fatty liver disease: a case-control study in Southeast China. Ann Nutr Metab. 2019;74(3):207–214. doi:10.1159/000497228
14. Powell E, Wong V, Rinella M. Non-alcoholic fatty liver disease. Lancet. 2021;397(10290):2212–2224. doi:10.1016/S0140-6736(20)32511-3
15. Juanola O, Martínez-López S, Francés R, Gómez-Hurtado I. Non-alcoholic fatty liver disease: metabolic, genetic, epigenetic and environmental risk factors. Int J Environ Res Public Health. 2021;18(10):5227. doi:10.3390/ijerph18105227
16. Chalasani N, Younossi Z, Lavine J, et al. The diagnosis and management of nonalcoholic fatty liver disease: practice guidance from the American Association for the Study of Liver Diseases. Hepatology. 2018;67(1):328–357. doi:10.1002/hep.29367
17. American Diabetes Association. Standards of medical care in diabetes-20202. Classification and diagnosis of diabetes. Diabetes Care. 2020;43:S14–S31. doi:10.2337/dc20-S002
18. Alberti K, Eckel R, Grundy S, et al. Harmonizing the metabolic syndrome: a joint interim statement of the international diabetes federation task force on epidemiology and prevention; National Heart, Lung, and Blood Institute; American Heart Association; World Heart Federation; International Atherosclerosis Society; and International Association for the Study of Obesity. Circulation. 2009;120(16):1640–1645. doi:10.1161/CIRCULATIONAHA.109.192644
19. Bedossa P, Poitou C, Veyrie N, et al. Histopathological algorithm and scoring system for evaluation of liver lesions in morbidly obese patients. Hepatology. 2012;56(5):1751–1759. doi:10.1002/hep.25889
20. Kleiner D, Brunt E, Van Natta M, et al. Design and validation of a histological scoring system for nonalcoholic fatty liver disease. Hepatology. 2005;41(6):1313–1321. doi:10.1002/hep.20701
21. Pietrangelo A. Iron and the liver. Liver Int. 2016;36:116–123. doi:10.1111/liv.13020
22. Handa P, Morgan-Stevenson V, Maliken B, et al. Iron overload results in hepatic oxidative stress, immune cell activation, and hepatocellular ballooning injury, leading to nonalcoholic steatohepatitis in genetically obese mice. Am J Physiol Gastrointest Liver Physiol. 2016;310(2):G117–127. doi:10.1152/ajpgi.00246.2015
23. Ryan J, Armitage A, Cobbold J, et al. Hepatic iron is the major determinant of serum ferritin in NAFLD patients. Liver Int. 2018;38(1):164–173. doi:10.1111/liv.13513
24. Al Akl N, Khalifa O, Errafii K, Arredouani A. Association of dyslipidemia, diabetes and metabolic syndrome with serum ferritin levels: a Middle Eastern population-based cross-sectional study. Sci Rep. 2021;11(1):24080. doi:10.1038/s41598-021-03534-y
25. Hevi S, Chuck S. Ferritins can regulate the secretion of apolipoprotein B. J Biol Chem. 2003;278(34):31924–31929. doi:10.1074/jbc.M303081200
26. Jarvis H, Craig D, Barker R, et al. Metabolic risk factors and incident advanced liver disease in non-alcoholic fatty liver disease (NAFLD): a systematic review and meta-analysis of population-based observational studies. PLoS Med. 2020;17(4):e1003100. doi:10.1371/journal.pmed.1003100
27. Morwald K, Aigner E, Bergsten P, et al. Serum ferritin correlates with liver fat in male adolescents with obesity. Front Endocrinol (Lausanne). 2020;11:340. doi:10.3389/fendo.2020.00340
28. Kage M, Aishima S, Kusano H, Yano H. Histopathological findings of nonalcoholic fatty liver disease and nonalcoholic steatohepatitis. J Med Ultrason. 2020;47(4):549–554. doi:10.1007/s10396-020-01061-3
29. Singh S, Allen A, Wang Z, Prokop L, Murad M, Loomba R. Fibrosis progression in nonalcoholic fatty liver vs nonalcoholic steatohepatitis: a systematic review and meta-analysis of paired-biopsy studies. Clin Gastroenterol Hepatol. 2015;13(4):
30. Pitisuttithum P, Chan W, Piyachaturawat P, et al. Predictors of advanced fibrosis in elderly patients with biopsy-confirmed nonalcoholic fatty liver disease: the GOASIA study. BMC Gastroenterol. 2020;20(1):88. doi:10.1186/s12876-020-01240-z
31. Angulo P, Hui J, Marchesini G, et al. The NAFLD fibrosis score: a noninvasive system that identifies liver fibrosis in patients with NAFLD. Hepatology. 2007;45(4):846–854. doi:10.1002/hep.21496
32. Tutunchi H, Naeini F, Ebrahimi-Mameghani M, Najafipour F, Mobasseri M, Ostadrahimi A. Metabolically healthy and unhealthy obesity and the progression of liver fibrosis: a cross-sectional study. Clin Res Hepatol Gastroenterol. 2021;45(6):101754. doi:10.1016/j.clinre.2021.101754
33. Manousou P, Kalambokis G, Grillo F, et al. Serum ferritin is a discriminant marker for both fibrosis and inflammation in histologically proven non-alcoholic fatty liver disease patients. Liver Int. 2011;31(5):730–739. doi:10.1111/j.1478-3231.2011.02488.x
34. Chan J, Malik V, Jia W, et al. Diabetes in Asia: epidemiology, risk factors, and pathophysiology. JAMA. 2009;301(20):2129–2140. doi:10.1001/jama.2009.726
 © 2022 The Author(s). This work is published and licensed by Dove Medical Press Limited. The
full terms of this license are available at https://www.dovepress.com/terms
and incorporate the Creative Commons Attribution
- Non Commercial (unported, 3.0) License.
By accessing the work you hereby accept the Terms. Non-commercial uses of the work are permitted
without any further permission from Dove Medical Press Limited, provided the work is properly
attributed. For permission for commercial use of this work, please see paragraphs 4.2 and 5 of our Terms.
© 2022 The Author(s). This work is published and licensed by Dove Medical Press Limited. The
full terms of this license are available at https://www.dovepress.com/terms
and incorporate the Creative Commons Attribution
- Non Commercial (unported, 3.0) License.
By accessing the work you hereby accept the Terms. Non-commercial uses of the work are permitted
without any further permission from Dove Medical Press Limited, provided the work is properly
attributed. For permission for commercial use of this work, please see paragraphs 4.2 and 5 of our Terms.