Back to Journals » International Journal of Women's Health » Volume 9
Household food insecurity is associated with both body mass index and middle upper-arm circumference of mothers in northwest Ethiopia: a comparative study
Authors Motbainor A ![]() , Worku A, Kumie A
, Worku A, Kumie A
Received 22 December 2016
Accepted for publication 31 March 2017
Published 26 May 2017 Volume 2017:9 Pages 379—389
DOI https://doi.org/10.2147/IJWH.S130870
Checked for plagiarism Yes
Review by Single anonymous peer review
Peer reviewer comments 2
Editor who approved publication: Professor Elie Al-Chaer
Achenef Motbainor, Alemayehu Worku, Abera Kumie
School of Public Health, College of Health Sciences, Addis Ababa University, Addis Ababa, Ethiopia
Background: Food insecurity and associated malnutrition result in serious health problems in developing countries. This study determined levels of maternal undernutrition and its association with food insecurity in northwest Ethiopia.
Materials and methods: This was a community-based comparative cross-sectional study conducted May 24–July 20, 2013. Multistage random sampling was used to select 4,110 samples. Availability of Ethiopia’s Productive Safety Net Programme was used for grouping the study areas. A food-security access scale developed by the Food and Nutrition Technical Assistant project was used to measure food security. Sociodemographic data were collected using a structured questionnaire. A binary logistic regression model was used to assess the association of food insecurity and maternal undernutrition.
Results: From the total participants, 12.6% (95% confidence interval [CI] 11.6%–13.6%) had a body mass index (BMI) <18.5 kg/m2. Comparison of maternal undernutrition in the two study areas revealed 8.8% (95% CI 7.6%–10.2%) in the program area and 16.4% (95% CI 14.8%–18.1%) in nonprogram areas were undernourished. Severe food insecurity was significantly associated with BMI of mothers (adjusted odds ratios [AORs] 3.6 and 2.31, 95% CI 2.32–5.57 and 1.52–3.5, respectively) in both program and nonprogram areas. Mild (AOR 1.77, 95% CI 1.21–2.6) and moderate (AOR 1.6, 95% CI 1.18–2.16) food insecurity significantly associated with maternal undernutrition in nonprogram areas. In the same way, all forms of food insecurity significantly associated with maternal middle upper-arm circumference in both program and nonprogram areas. The odds of mothers who did not exercise decision-making practice on the household income was also 4.13 times higher than those who did (AOR 4.13, 95% CI 2.2–7.77) in the program area.
Conclusion: Food insecurity significantly associated with both maternal BMI and middle upper-arm circumference in both study areas. Female authority also significantly associated with BMI of the mothers in the program area. Maternal nutrition-intervention programs should focus on women-empowerment strategies that enable them to decide on the income for household-nutrition provision.
Keywords: food insecurity, undernutrition, BMI, MUAC, Ethiopia, food-security, maternal nutrition
Introduction
Food insecurity can be defined as a state or condition in which people experience limited or uncertain physical and economic access to safe, sufficient, and nutritious food to meet their dietary needs or food preferences for a productive, healthy, and active life.1–3 Food insecurity and associated malnutrition result in serious health problems and loss of human potential toward development in developing countries.3 Potential public health consequences of food insecurity are not only restricted to hunger and acute malnutrition but also include severe chronic disease, such as hypertension, hyperlipidemia, and reduced health and quality of life.1,4
Food insecurity remains highly prevalent in developing countries, and over the past two decades it has increasingly been recognized as a serious public health problem in both developing and developed countries.4 Based on the recent estimates of the Food and Agriculture Organization, 842 million people, accounting for about 12% of the global population, were unable to meet their dietary energy requirements. This shows that around one in eight people in the world is likely to have suffered from chronic food shortage or not having sufficient food for an active and healthy life.5 Although levels of food insecurity decreased globally, the difference was only 0.6% between 2010 and 2012 (14.9%) and 2011 and 2013 (14.3%) according to reports of undernourishment in developing countries.5,6
Research findings have shown that the level of food insecurity is still very high and needs special attention. In low-income households of Los Angeles, for instance, the food insecurity level was 24.4%.4 In Canada, a study done to differentiate the sociodemographic risk factors between aboriginal and nonaboriginal households revealed 33% of aboriginal households were food-insecure compared with 9% of nonaboriginal households.7
Levels of food insecurity in developing countries are still substantially higher than developed countries. In Kenya, a recent study showed that of all households involved, 70.1% were severely food-insecure, 21.9% were moderately food-insecure, and 3.7% were mildly food-insecure, whereas food-secure accounted for only 4.3%.3
According to a recent cross-sectional study done in Farta district, Ethiopia, about 70.7% of total study participants were categorized as food-insecure.8 Similarly, a study done in Addis Ababa city showed that 58.16% of the total households were below the food-insecurity cutoff point.9 According to another longitudinal study result in Ethiopia on adolescent food-security levels, there were different food-insecurity magnitudes identified during the study period. Overall, 20.5% of adolescents were food-insecure in the first-round survey, while the proportion of adolescents with food insecurity increased to 48.4% 1 year later. During the 1-year follow-up period, more than half (54.8%) of the youth encountered transient food insecurity.10
Different literature has shown that food insecurity is found to be a significant modifiable determinant of maternal nutritional status that resulted in undernutrition at different levels. For example, a study in Colombia showed that food insecurity was a significant determinant of maternal underweight.11 Another study in Guatemala showed that the nutritional status of women of reproductive age, explained by short stature (height <145 cm), was associated with greater food insecurity; however, there was no significant difference in the body mass index (BMI) of women from households classified as moderately or severely food-insecure.12 Similarly, a study result in Jordan showed food-insecure women with hunger were at higher risk of malnutrition.13
Many developing countries women have a weight-for-height (BMI) outcome of <18.5 kg/m2. The 2011 Ethiopian Demographic and Health Survey (EDHS) and study results from Tigray region, Ethiopia showed that the prevalence of maternal undernutrition was 27% and 25%, respectively.14,15 The government of Ethiopia designed and implemented the Productive Safety Net Programme as a response to chronic food-insecurity problems, an intensive and innovative strategy in addition to other measures to address the problem.16 The program targeted poor and food-insecure households.17
Women are more likely to suffer from nutritional deficiencies than other household members for many reasons, including food insecurity. Evidence-based information regarding maternal undernutrition and the association of food insecurity with maternal nutrition is lacking. Information on female undernutrition and associated factors is definitely needed for designing intervention programs aimed at maternal nutrition improvements. Therefore, this study was conducted to determine levels of maternal undernutrition and to assess the association of food insecurity with maternal nutrition in study areas grouped into two study populations, based on the availability of the safety-net program.
Materials and methods
Study area and period
The study was conducted in Amhara regional state, which covers some 157,647 km2 across northwestern and eastern Ethiopia and has a total projected population of 20,018,999 (10,011,795 males and 10,007,204 females), based on the 2007 census.18,19 The region is divided into a number of highland blocks separated by deep river valleys and the eastern and western escarpments and their associated lowlands.19 Specifically, the study was conducted in the East and West Gojjam zones of the region. East Gojjam has a total population of 2,451,959 (1,199,952 males and 1,252,006 females). West Gojjam has a total population of 2,474,254 (1,220,477 males and 1,253,777 females).18 The mean annual temperatures of the region are 22°C–27°C in the lowlands and 10°C–22°C in the highlands up to 3,000 m above sea level.19 Within the region, four major cereal systems have been recognized: the sorghum–maize system in the lowland agroecological zone, the wheat–teff system in the single-rain-season area of the midland agroecological zone, the wheat–teff system in the double rain seasons of the midland agroecological zone, and the barley system in the highland agroecological zone.19 The study considered two zones classified by their agricultural production: one with the Productive Safety Net Programme and one without the program.
Study design, sample-size determination, and sampling techniques
A community-based comparative cross-sectional study design was used to determine the level of maternal undernutrition and the association between food insecurity and undernutrition. The comparison was used for food-security determination in the two study areas. Households in the study areas were used as a sampling unit, and all necessary data were drawn from the mothers. The two groups were considered based on the availability of the Productive Safety Net Programme: group 1 with the program and group 2 without the program. The current study used the sample size determined for another larger study that was used to determine nutritional status of children aged under 5 years and the association between food insecurity and child undernutrition (the detail is available elsewhere).20 The required sample size for the other study was 4,110 households, and the adequacy of the sample size for the current study to address both levels of maternal nutritional status and the association between food insecurity and maternal undernutrition was checked and found to be sufficient. With similar assumptions and presence of food insecurity as an exposure and maternal undernutrition (33% for program area and 27% for nonprogram area) as an outcome variable, the estimated sample size was 3,017 households, which is less than the current sample. Therefore, a sample of 4,110 was considered sufficient for the analysis.
Multistage random sampling technique was employed to reach and select the final study units. In the first place, the two zones (East and West Gojjam) were selected purposely by taking into account the variability and absence of the Productive Safety Net Programme in the two zones. East Gojjam was selected as it has the program, while West Gojjam is considered a nonprogram area. Six districts from the two zones (three from each zone) were selected. All three districts in East Gojjam covered by the program (Enebsie Sar Midir, Goncha Siso Enese, and Shebel Berenta) were selected and included in the study. Three districts in West Gojjam (Mecha, North Achefer, and Jabi Tehinan) were selected randomly from the total 14 districts. The two zones are more comparable on many sociocultural characteristics than the other zones of the region.
Once the six districts (three from each zone) had been identified, kebeles (the smallest administrative unit in the country) were randomly selected from these selected districts. The kebeles were selected based on agroecological zones and urban/rural settings. Four town kebeles (two from each zone), three rural highland kebeles (two from the nonprogram area, and one from the program area; it was proposed to include two highland kebeles from the program area, but unfortunately there was only one highland kebele covered by the program). The other eleven rural midland kebeles (six from the program area and five from the nonprogram area) and six rural lowland kebeles (three from each area) were selected randomly.
Then, the total sample size was distributed to the kebeles proportionally. The households from these kebeles were selected using systematic random sampling using household registration as a sampling frame. For the program area, program registration was used as a sampling frame. The total number of households in each kebele was divided by the allocated sample size to get the sampling interval. The first household was identified by lottery, and then the spin of a bottle. When there were no children aged under 5 years in the identified household, the next household was used as a sampling unit. This was done because the data-collection process included children aged under 5 years. When there was more than one mother with children aged under 5 years in the same household, one mother was selected by lottery.
Data-collection tools and techniques
A structured questionnaire adapted from different standard questionnaires15,21 and anthropometric measuring devices were used to collect the data. Some of the areas in the questionnaire included sociodemographic characteristics, such as household head, marital status, family size, educational level, occupation, female authority, household monthly income, household food security/insecurity, and food/dietary diversity.
Female-authority information was collected by asking the respondent mothers whether they had the right to exercise decision-making practices on the household income. Specifically, respondents asked whether they sold income-generating items and bought food supplies for household consumption by themselves or not. Two alternative answers (0 for no and 1 for yes) were given to them.
Anthropometric data were collected using the procedure stipulated by the World Health Organization/United Nations Children’s Fund for taking anthropometric measurements. The height of the mother was measured using an adjustable wooden measuring board, specifically designed to provide accurate measurements (to the nearest 0.1 cm) in developing-country field situations. Similarly, the weight of the mother was measured by using a Seca 876 scale. The weight and height data were used to calculate the BMI, which is defined as weight in kilograms divided by the height in meters squared (kg/m2). A BMI result of 18.5–24.9 was taken as normal, and 17–18.49, 16–16.99, and 16 or less were taken as mild (grade I), moderate (grade II), and severe (grade III) undernutrition, respectively. On the other hand, BMI values of 25–29.9 and ≥30 were defined as overweight and obese, respectively.22,23 Middle upper-arm circumference (MUAC) was measured on the left arm, at the midpoint between the elbow and the shoulder. The arm was relaxed and hanging down the side of the body. MUAC measuring tape was placed around the arm. The value was read from the window of the tape without pinching the arm or leaving the tape loose. An MUAC of less than 23 cm was considered to be a sign of poor nutrition.22–24
Household food-security (access) information was collected by using the questionnaire adopted from the Household Food Insecurity Access Scale, which was developed by the Food and Nutrition Technical Assistance project.25 This instrument consists of nine questions that measure uncertainty on obtaining food, limited access to high-quality foods, and reduction in food quantity in the past 4 weeks. The precoded options were never (0 points), rarely (once or twice in the past 4 weeks; 1 point), sometimes (three to ten times in the past 4 weeks; 2 points), and often (more than ten times in the past 4 weeks; 3 points). Scores for answers to these questions were summed (0–27), and thus a higher value signified a worse condition with more household food insecurity.25 Food diversity was measured by adapting a questionnaire from other standard questionnaires26,27 using the 12 food groups of dietary diversity. The respondents were asked to recall the food items eaten by the household in the previous 7 days. Households who had consumed at least four food groups in the specified period were considered as having diversified food. The questionnaire was pretested in a similar setting after translation into the local language – Amharic. In the process of adapting the questionnaire to the local setting and preparing the 12 food groups, emphasis was given to including each food item consumed in the local population, taking into account the raw materials used to prepare the meal or the dish. The respondents were asked to recall and list all the dishes the household members had eaten during the week. First, the data collectors let the participants describe the dish types and food items consumed in the household in this period, and then the list of the food groups in the questionnaire was explained to be sure that no meal had been forgotten. The 12 food groups and the items included in each group included cereals and cereal products (pasta, macaroni, injera, bread, porridge [kolo, nfro]), meat, offal (goat, camel, beef, chicken/poultry), eggs, roots, tubers (potatoes, sweet potatoes, arrowroot), vegetables (leafy vegetables like cabbage, spinach, Habesha Gomen, tomatoes, carrots, onions), fruit (mango, apple, papaya, banana, orange, strawberry), pulses/legumes, nuts (beans, lentils, peas, guaya), milk and milk products (cheese, yogurt, milk powder), oils/fats (fat, butter, ghee, margarine), sugar and honey, fish and seafood (fried/boiled/roasted), and miscellaneous (including fenugreek, ginger, mace, and pepper). The data collectors were well trained to differentiate easily in which food group the items mentioned by the respondents would be. During training, data collectors became familiar with (and demonstrated understanding well) the meaning of the local terms to differentiate easily and classify in which food groups they could be included. The data collectors and supervisors were university-graduate Bachelor of Science holders.
Data-quality control
To assure the quality of the data and to make sure all assessment-team members were able to administer the questionnaires properly, 5-day rigorous training of enumerators and supervisors was done. Before actual data collection was undertaken, data collectors and supervisors carried out role-play routines and then pretest field activities. At the end of every data-collection day, each questionnaire was examined for its completeness and consistency by the field supervisors and the principal investigator, and pertinent feedback was given to the data collectors and supervisors.
Data management and analysis
The data were coded, entered, and cleaned with Epi Info version 3.5.3 and exported to SPSS version 20 for further analysis. Descriptive summaries of frequencies, proportions, percentages, mean, standard deviations, and prevalence were determined. To identify predictor variables for maternal nutritional status, a logistic regression model was employed. For determinant-variable identification, first bivariate logistic regression analyses were carried out to identify candidate variables with a P-value <0.25 in the bivariate model, and then all independent variables with P-values <0.25 were entered into the multivariate model.28 At this step, model fitness and the presence of multicollinearity were assessed. The model fitness was checked by observing the difference of the −2 log-likelihood ratio between the model with only the constant and with the predictors. Moreover, Hosmer–Lemeshow goodness-of-fit test was used. The significance of each predictor in the equation was also assessed by Wald statistical test at a significance level of P<0.05.
Ethical clearance
Ethical clearance was obtained from the Institutional Review Board (IRB) of the College of Health Sciences of Addis Ababa University and the Amhara Regional Health Bureau. Participation in the study was on a voluntary basis, and written consent, signed or verified by fingerprint, was obtained from study participants. The consent form was attached with each questionnaire, and before the interview each study participant gave her/his consent. Prior to the questions, the data collectors read the consent form that was available on the front page of the questionnaire, and the respondents mentioned their willingness and the questioning continued on a voluntary basis. The consent form was approved by the IRB and the regional health bureau during ethical approval processes. The IRB approved this research with meeting 050/2013 and protocol 051/12/SPH. Privacy and confidentiality were maintained.
Results
Sociodemographic characteristics
Among the 4,110 households visited, 3,964 respondents (response rate 96.5%) gave complete responses. The age distribution of the respondents was 15–49 years; the majority were in the 20- to 29-year age-group (53.6%), and the fewest were in the 15- to 19-year age-group (1.3%). A total of 1,985 (50.1%) respondents were from the program area, and the other 1,979 (49.9%) were from the nonprogram area. From the total participants, 86.8% from the program area and 78.8% from the nonprogram area had no formal education exposure.
Generally, about 86% of the respondents were rural residents; of these, 96.9% were from the program area and 75.7% from the nonprogram area. Of the fathers, 69.6% were farmers and 1.6% lived on different activities, such as tailor, weaver, blacksmith, carpenter, church servant, woodwork, and pension. Similarly, about 1.9% of mothers were local beer and liquor sellers and students (Table 1). The agroecological zone distribution of the respondents was 363 (9.2%) from the highlands (elevation >2,400 m), 2,373 (59.9%) from the mid-highlands (elevation 1,500–2,400 m), and 1,228 (31%) from the lowlands (elevation <1,500 m).
 | Table 1 Sociodemographic characteristics of study population with program (n=1,985) and without program (n=1,979) |
Maternal nutritional status
The mean (± standard deviation) BMI, height, weight, and MUAC of the mothers were 20.97 (2.3) kg/m2, 156.5 (8.2) cm, 51.3 (5.9) kg, and 23.2 (1.9) cm, respectively. Of the total participants, 12.6% (95% confidence interval [CI] 11.6%–13.6%) had a BMI less than 18.5 kg/m2. Mothers with height ≤145 cm and weight ≤45 kg were 9.5% and 12.8%, respectively. Almost 9% (8.8%, 95% CI 7.6%–10.2%) of mothers from the program area and 16.4% (95% CI 14.8%–18.1%) of mothers from the nonprogram area were undernourished. Of the total participants included in the study, 52.9% had less than 23 cm MUAC. Comparing MUACs of the mothers between the two areas showed that 56.2% and 49.6% were from program and nonprogram areas, respectively.
Association of food insecurity with maternal undernutrition
Based on the logistic regression model, in the program area, the odds of becoming undernourished were 4.13 times higher among mothers who did not have authority in the household to decide on household income than mothers who had such authority (adjusted odds ratio [AOR] 4.13, 95% CI 2.2–7.77; Table 2). This variable was not significantly associated with maternal undernutrition in the nonprogram area. On the other hand, residential area significantly associated with maternal undernutrition in the nonprogram area but not in the program area. The odds of undernutrition among rural resident mothers were 1.5 times higher than the odds of urban mothers (AOR 1.5, 95% CI 1.1–2.12).
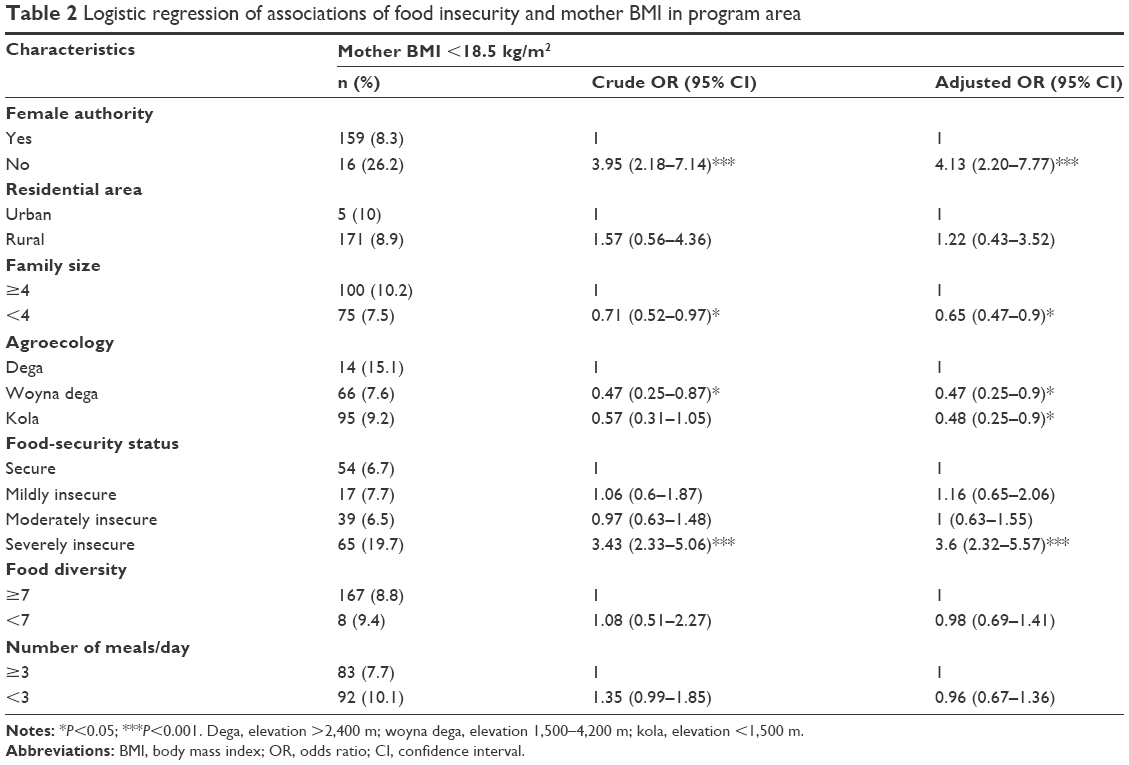 | Table 2 Logistic regression of associations of food insecurity and mother BMI in program area |
The odds of undernutrition in severely food-insecure households were 3.6 times higher than food-secure household mothers in the program area (Table 2) and 2.31 times higher in the nonprogram area (Table 3) (AOR 3.6, 95% CI 2.32–5.57; AOR 2.31, 95% CI 1.52–3.5) for program and nonprogram areas, respectively. In the same way, in the nonprogram area the odds of undernutrition among mildly food-insecure household mothers was 1.77 times higher than mothers in food-secure households. The odds of undernutrition in moderately food-insecure household mothers were 1.6 times higher than food-secure household mothers: mild (AOR 1.77, 95% CI 1.21–2.6), moderate (AOR 1.6, 95% CI 1.18–2.16) (Table 3).
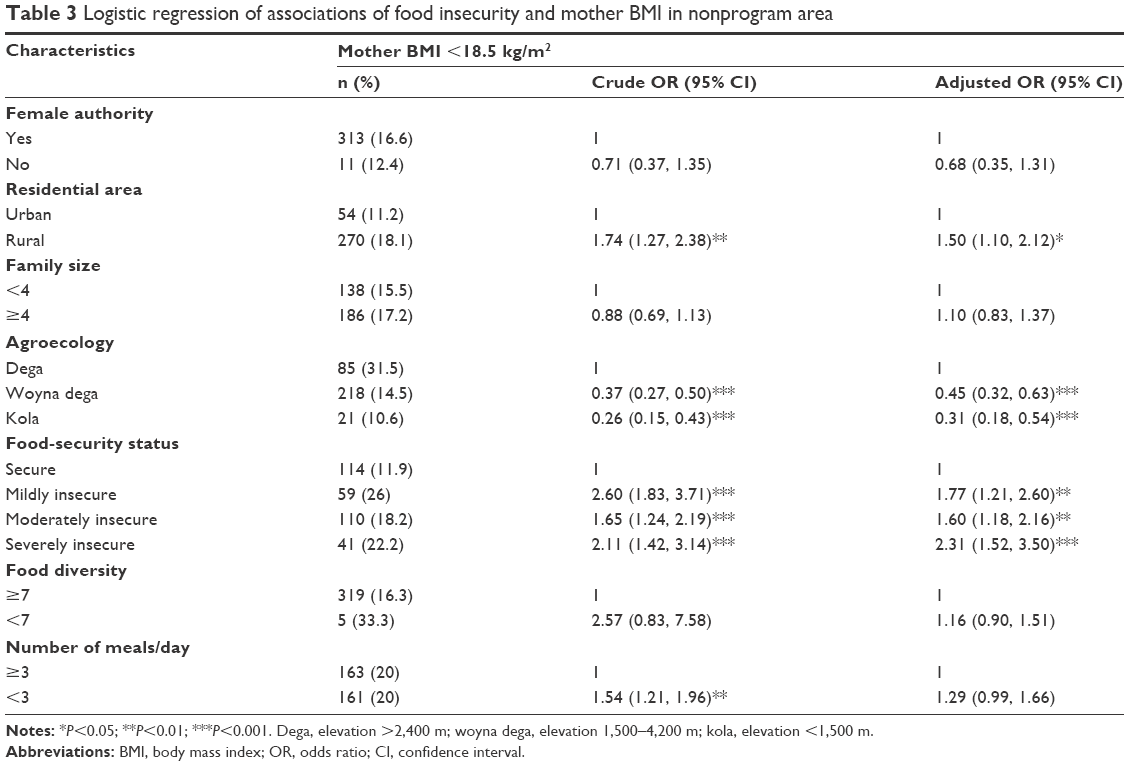 | Table 3 Logistic regression of associations of food insecurity and mother BMI in nonprogram area |
In addition to the BMI of mothers, this research assessed the association of maternal MUAC with food insecurity. All forms of food insecurity were significantly associated with maternal MUAC in both program and nonprogram areas. The odds of MUAC less than 23 cm in mildly food-insecure households were 2.41 times higher than in food-secure households in the program area and 1.77 times higher in the nonprogram area (AOR 2.41, 95% CI 1.75–3.33 and AOR 1.77, 95% CI 1.21–2.6 for program and nonprogram areas, respectively) (Tables 4 and 5). Food diversity and number of meals the mother ate per day were the other variables significantly associated with MUAC of the mothers in the nonprogram area (AOR 1.39, 95% CI 1.14–1.69 and AOR 1.3, 95% CI 1.1–1.58, respectively) (Table 5).
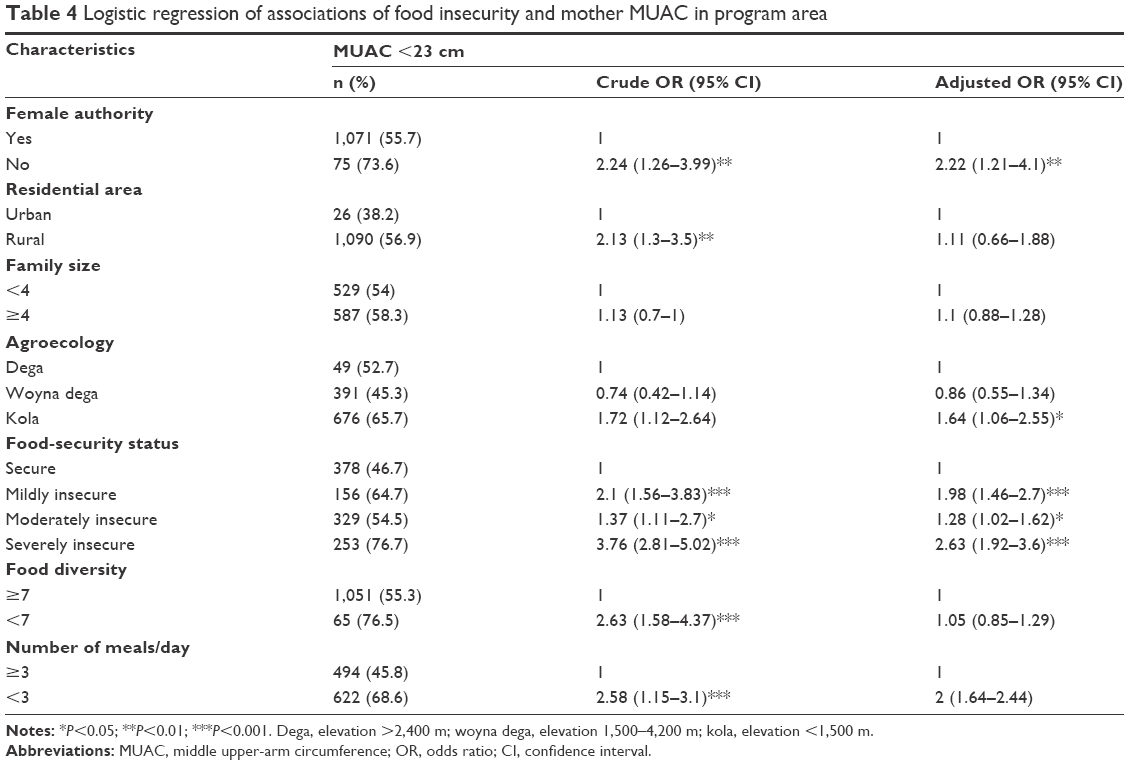 | Table 4 Logistic regression of associations of food insecurity and mother MUAC in program area |
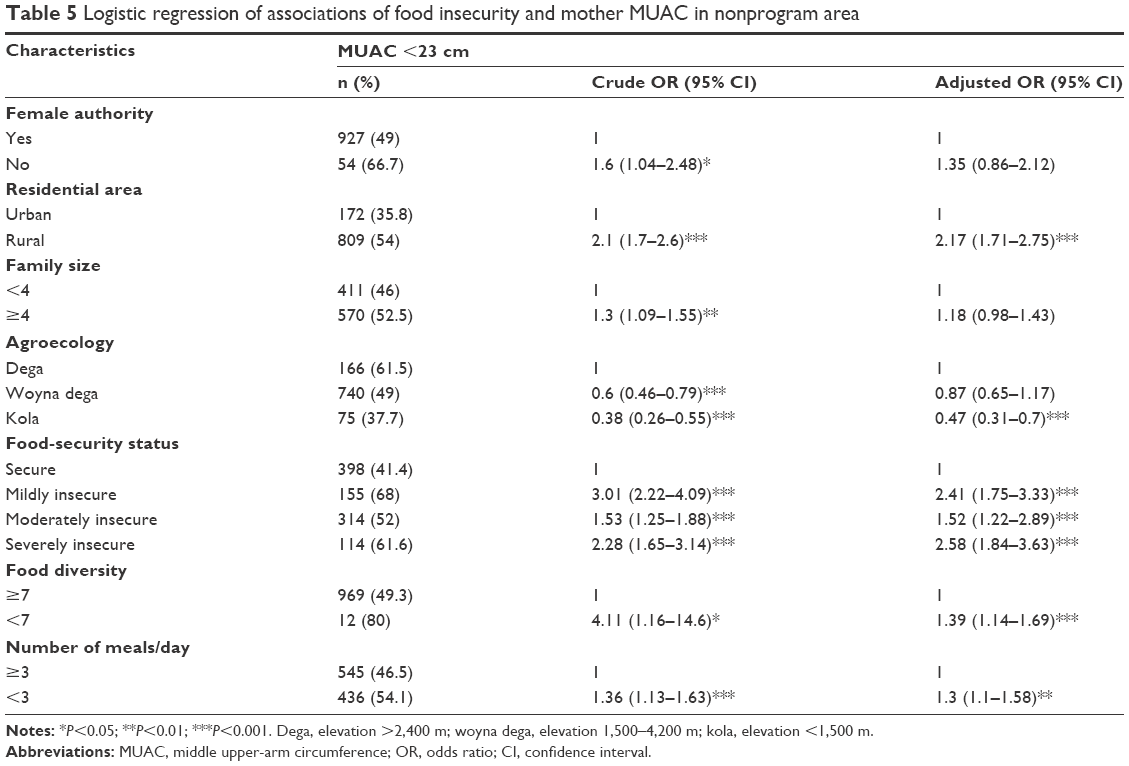 | Table 5 Logistic regression of associations of food insecurity and mother MUAC in nonprogram area |
Discussion
The prevalence of undernutrition among mothers was 12.6%, which was very much lower than the 2011 Ethiopian Demographic and Health Survey findings (27%).15 The probable reason for this discrepancy were interventions on maternal health and nutrition and other woman-empowering programs of the government and other agents to have an effect on maternal nutritional status. The national nutrition strategy of Ethiopia also gave special focus and priorities to pregnant and lactating mothers that could serve as undernutrition-reduction methods.29 This woman-empowerment contribution on the reduction of women undernutrition was supported by this research finding in that mothers who did not have authority (decision-making practice of mothers on incomes) in the household were more likely to be undernourished than women who had it in the household.
Inequalities among humans and household food insecurity breach the basic human right to freedom from hunger with enough nutritious and safe food.30 The current study showed that both forms of food insecurity were significant determinants of maternal nutritional status in the nonprogram area and severe forms in the program area. Using BMI as an undernutrition indication, mothers in households that faced forms of food insecurity (mild, moderate, and severe) in the nonprogram area were more likely to be undernourished compared to mothers within food-secure households. Similarly, mothers from severely food-insecure households in the program area were more likely to be undernourished than mothers from food-secure households. This finding is consistent with other studies done in Jordan and Canada.13,31–33 All the studies showed that mothers in food-insecure households were at greater risk of being undernourished than mothers in food-secure households.
It is expected that food security is the basic requirement to ensure optimal nutrition and to prevent hunger and undernutrition.30 Although it is understood that food insecurity was the significant determinant of maternal undernutrition, the proportion of undernourished women in the nonprogram area, which was considered food-secure, was found to be higher than the program area, where the safety-net program is running. These results, in which there were more undernourished mothers in the nonprogram area than the program area, could be explained by the safety-net program making its own contribution related to nutrition information. For example, mothers might receive nutrition-related information with which they enhance their knowledge of appropriate household-feeding practices. Research has also shown that efforts to improve diet quality among food-insecure households beyond physical access to their food is required to reduce the prevalence of insufficient nutrition.33
Moreover, this study result may be explained by households that are food-secure not having quality diets in terms of dietary diversity, and there could be inequality in distribution of food among the household members. The last concept was supported by the research finding that women in households that did not exercise decision-making practices on the household income were more likely to be undernourished than women who did. This could be explained in such a way that authorized women have the right to decide on the income of the household and may allocate the required budget to buy better and nutritious foods, and in addition when females authorized in the household there could be fairer distribution of food among the household. The evidence is consistent in that female authority or decision-making practices between the two areas showed statistically significant (χ2=7.32, P<0.01) differences, and this may have resulted from the presence of the program. This is because the program invites and encourages female beneficiaries to be involved with payment and build their own assets.
Susceptibility to food insecurity is a familiar feature along the semiarid lowlands and degraded high lands of Ethiopia, where rural households rely on rain-fed agriculture.34 In both study areas, households in the highland agroecological zones were more likely to be food insecure than lowland zones, but there was no difference between lowland and mid-highland households. These findings are similar to other studies done in different parts of Ethiopia in which households in the highland agroecological zone were more likely to become food-insecure than households in lowlands.33,34 Most highland areas are mountainous and prone to soil erosion and degradation, and these could be risk factors for a reduction in agricultural productivity. In Ethiopia, soil erosion and degradation are common events, since there are no sustainable soil- and water-management practices. Soil erosion and degradation substantially affect food security.35 In relation to this, there were nutritional status differences in mothers that lived in different agroecological zones. Again, in both study areas, mothers from households who lived in highland agroecological zones were more likely to become undernourished than mothers who lived in lowland agroecological zones. This nutritional difference between the two agroecological zones might be explained by the food-security status of the households in the two agroecological zones. This condition is supported by the fact that more mothers from food-insecure households become undernourished than mothers from food-secure households.
The study also showed that urban dwellers were less likely to be undernourished than their counterparts. This finding is supported by studies done in Bangladesh and Nigeria.36,37 This might be due to the fact that urban dwellers have better access to nutrition information and have better educational levels than rural residents, which in turn has a significant association with maternal nutritional status.36,38 Therefore, urban mothers have better nutrition-related knowledge, which might contribute to better feeding practices.
To summarize, although food security is considered a prerequisite for optimal nutrition, by itself it is not sufficient for optimal nutrition attainment. By its very nature, the nutritional status of a certain community might be affected by different interrelated factors. Within the same scenario, different variables had different effects on the nutritional status of mothers in the two study sites of this research. The effect or association differences of the variables for the two areas could be explained by the nutritional status of mothers being affected by other variables not addressed by this research, including health service-related factors, environmental health-related factors, and infectious disease.
Conclusion and recommendations
Based on the study results, there was maternal undernutrition in both study areas. Among the studied variables, food insecurity, female authority, agroecology, number of meals the mothers ate per day, and residential area were significantly associated with maternal BMI and MUAC. When mothers become authorized in the household, they might get a chance to decide on expenditure and distribute the available food among the family fairly. Therefore, at the district level, agricultural offices and administrative bodies need to design and implement effectively women-owned and -controlled income-generating activities like production of vegetables, poultry, eggs, milk, and milk products. There was a significant difference between urban and rural mothers’ nutritional status. This difference might have resulted from variations in educational level and availability and dissemination of nutrition-related education between the two settings. Therefore, nutrition-related education that emphasizes rural settings should be designed and implemented. It is also fundamentally important to design and implement food-insecurity intervention programs in both study areas to alleviate maternal undernutrition. Moreover, maternal undernutrition-intervention programs should be designed differently in different agroecological zones.
Author contributions
AM conceived of the study, carried out the analysis and interpretations, and drafted and edited the manuscript. AW helped to conceive the study, provided statistical expertise, and drafted and critically edited the manuscript. AK helped to conceive the study, helped in drafting, and critically edited all versions of the manuscript. All authors have read and given approval for this manuscript to be published.
Disclosure
The authors report no conflicts of interest in this work.
References
Seligman KH, Laraia AB, Kushel BM. Food insecurity is associated with chronic disease among low-income NHANES participants. J Nutr. 2010;140(2):304–310. | ||
Willows N, Veugelers P, Raine K, Kuhle S. Associations between household food insecurity and health outcomes in the aboriginal population (excluding reserves). Health Rep. 2011;22(2):15–20. | ||
Keino S, Plasqui G, van den Borne B. Household food insecurity access: a predictor of overweight and underweight among Kenyan women. Agric Food Secur. 2014;3:2. | ||
Furness WB, Simon AP, Wold MC, Asarian-Anderson J. Prevalence and Predictors of food insecurity among low-income households in Los Angeles County. Public Health Nutr. 2004;7(6):791–794. | ||
Food and Agriculture Organization. The State of Food Insecurity in the World: The Multiple Dimensions of Food Security. Rome: FAO; 2013. | ||
Food and Agriculture Organization. The State of Food Insecurity in the World: Economic Growth is Necessary but not Sufficient to Accelerate Reduction of Hunger and Malnutrition. Rome: FAO; 2012. | ||
Willows DN, Veugelers P, Raine K, Kuhle S. Prevalence and sociodemographic risk factors related to household food security in aboriginal peoples in Canada. Public Health Nutr. 2008;12(8):1150–1156. | ||
Endale W, Mengesha ZB, Atinafu A, Adane AA. Food insecurity in Farta district, northwest Ethiopia: a community based cross-sectional study. BMC Res Notes. 2014;7:130. | ||
Gebre GG. Determinants of food insecurity among households in Addis Ababa city, Ethiopia. Interdiscip Descrip Complex Syst. 2012;10(2):159–173. | ||
Belachew T, Lindstrom D, Gebremariam A, et al. Predictors of chronic food insecurity among adolescents in southwest Ethiopia: a longitudinal study. BMC Public Health. 2012;12:604. | ||
Isanaka S, Mora-Plazas M, Lopez-Arana S, Baylin A, Villamor E. Food insecurity is highly prevalent and predicts underweight but not overweight in adults and school children from Bogotá, Colombia. J Nutr. 2007;137(12):2747–2755. | ||
Chaparro C. Household Food Insecurity and Nutritional Status of Women of Reproductive Age and Children under 5 Years of Age in Five Departments of the Western Highlands of Guatemala: An Analysis of Data from the National Maternal-Infant Health Survey 2008–2009 of Guatemala. Washington, DC: FHI 360; 2012. | ||
Bawadi HA, Tayyem RF, Dwairy AN, Al-Akour N. Prevalence of food insecurity among women in northern Jordan. J Health Popul Nutr. 2012;30(1):49–55. | ||
Haileslassie K, Mulugeta A, Girma M. Feeding practices, nutritional status and associated factors of lactating women in Samre Woreda, south eastern zone of Tigray, Ethiopia. Nutr J. 2013;12:28. | ||
Central Statistical Agency. Ethiopia Demographic and Health Survey 2011. Addis Ababa: Central Statistical Agency; 2012. | ||
Slater R, Ashley S, Tefera M, Buta M, Esubalew D. Ethiopia productive safety net program: policy, program, and institutional linkages. Final Report 2006. Available from: https://www.odi.org/resources/docs/3964.pdf. Accessed April 18, 2017. | ||
Coll-Bank S, Gilligan OD, Hoddinott J, Kumar N, Seyoum A, Wiseman W. Targeting Food Security Interventions: The Case Of Ethiopia’s Productive Safety Net Program. International Food Policy Research Institute. 2013. Available from: http://www.ifpri.org/sites/default/files/publications/essprn26.pdf. Accessed April 18, 2017. | ||
Amhara Bureau of Finance and Economic Development. Population size by sex and age-group and urban and rural. 2014. Available from: http://www.amharabofed.gov.et/population_report.html. Accessed April 18, 2017. | ||
Amhara Regional State. A strategic plan for the sustainable development, conservation, and management of the woody biomass resources, final report. 2002. Available from: www.eap.gov.et/sites/default/files/amhara%20strategic%20plan.pdf. Accessed April 18, 2017. | ||
Motbainor A, Worku A, Kumie A. Stunting is associated with food diversity while wasting with food insecurity among underfive [sic] children in east and west Gojjam zones of Amhara region, Ethiopia. PLoS One. 2015;10(8):e0133542. | ||
World Food Programme. Emergency Food Security Assessment Handbook. 2nd ed. Rome: WFP; 2009. | ||
Cogill B. Anthropometric Indicators Measurement Guide. Washington, DC: FHI 360; 2003. | ||
World Health Organization. Physical Status: The Use and Interpretation of Anthropometry. Geneva: WHO; 1995. | ||
Assefa N, Berhane Y, Worku A. Wealth status, mid upper arm circumference (MUAC) and antenatal care (ANC) are determinants for low birth weight in Kersa, Ethiopia. PLoS One. 2012;7(6):e39957. | ||
Coates J, Swindale A, Bilinsky P. Household Food Insecurity Access Scale (HFIAS) for Measurement of Household Food Access: Indicator Guide. Version 3. WA: Academy for Educational Development; 2007. | ||
Swindale A, Bilinsky P. Household Dietary Diversity Score (HDDS) for Measurement of Household Food Access: Indicator Guide. Washington, DC: Academy for Educational Development; 2005. | ||
Food and Agriculture Organization. Guidelines for Measuring Household and Individual Dietary Diversity. Rome: FAO; 2011. | ||
Hosmer DW, Lemeshow S. Applied Logistic Regression. 2nd ed. Hoboken, NJ: Wiley; 2000. | ||
Ethiopia Federal Ministry of Health. National Nutrition Strategy. Addis Ababa: Federal Ministry of Health; 2008. | ||
Ghattas H. Food security and nutrition in the context of the global nutrition transition. 2014. Available from: http://www.fao.org/3/a-i3862e.pdf. Accessed April 4, 2017. | ||
Kirkpatrick IS, Tarasuk V. Food insecurity is associated with nutrient inadequacies among Canadian adults and adolescents. J Nutr. 2008;138(3):604–612. | ||
Tarasuk SV. Household food insecurity with hunger is associated with women’s food intakes, health and household circumstances. J Nutr. 2001;131(10):2670–2676. | ||
McIntyre L, Tarasuk V, Li JT. Improving the nutritional status of food-insecure women: first, let them eat what they like. Public Health Nutr. 2007;10(11):1288–1298. | ||
Bayu TY. An agro-ecological assessment of household food insecurity in mid-Deme catchment, south-western Ethiopia. Glob Adv Res J Geogr Reg Plann. 2013;2(8):185–192. | ||
Beyene F, Muche M. Determinants of food security among rural households of central Ethiopia: an empirical analysis. Q J Int Agric. 2010;49(4):299–318. | ||
Kamal SM, Avnul IM. Socio-economic correlates of malnutrition among married women in Bangladesh. Malays J Nutr. 2010;16(3):349–359. | ||
Idowu OS, Ibiyemi OO, Wasiu AA, Olayinka CS. Maternal and child under-nutrition in rural and urban communities of Lagos state, Nigeria: the relationship and risk factors. BMC Res Notes. 2013;6:286. | ||
Demissie T, Mekonen Y, Haider J. Agroecological comparison of levels and correlates of nutritional status of women. Ethiop J Health Dev. 2003;17(3):189–196. |
 © 2017 The Author(s). This work is published and licensed by Dove Medical Press Limited. The
full terms of this license are available at https://www.dovepress.com/terms
and incorporate the Creative Commons Attribution
- Non Commercial (unported, 3.0) License.
By accessing the work you hereby accept the Terms. Non-commercial uses of the work are permitted
without any further permission from Dove Medical Press Limited, provided the work is properly
attributed. For permission for commercial use of this work, please see paragraphs 4.2 and 5 of our Terms.
© 2017 The Author(s). This work is published and licensed by Dove Medical Press Limited. The
full terms of this license are available at https://www.dovepress.com/terms
and incorporate the Creative Commons Attribution
- Non Commercial (unported, 3.0) License.
By accessing the work you hereby accept the Terms. Non-commercial uses of the work are permitted
without any further permission from Dove Medical Press Limited, provided the work is properly
attributed. For permission for commercial use of this work, please see paragraphs 4.2 and 5 of our Terms.