")
Back to Journals » Cancer Management and Research » Volume 11
Histone deacetylase inhibitors reinforce the phenotypical markers of breast epithelial or mesenchymal cancer cells but inhibit their migratory properties
Authors Wawruszak A , Gumbarewicz E , Okon E , Jeleniewicz W , Czapinski J , Halasa M , Okla K , Smok-Kalwat J , Bocian A , Rivero-Muller A , Stepulak A
Received 26 March 2019
Accepted for publication 4 September 2019
Published 13 September 2019 Volume 2019:11 Pages 8345—8358
DOI https://doi.org/10.2147/CMAR.S210029
Checked for plagiarism Yes
Review by Single anonymous peer review
Peer reviewer comments 2
Editor who approved publication: Dr Antonella D'Anneo
Anna Wawruszak,1 Ewelina Gumbarewicz,1 Estera Okon,1 Witold Jeleniewicz,1 Jakub Czapinski,1,2 Marta Halasa,1 Karolina Okla,3,4 Jolanta Smok-Kalwat,5 Artur Bocian,6 Adolfo Rivero-Muller,1,7,* Andrzej Stepulak1,*
1Department of Biochemistry and Molecular Biology, Medical University of Lublin, Lublin, Poland; 2School of Molecular Medicine, Medical University of Warsaw, Warsaw, Poland; 3The First Department of Gynecologic Oncology and Gynecology, Medical University of Lublin, Lublin, Poland; 4Tumor Immunology Laboratory, Medical University of Lublin, Lublin, Poland; 5Department of Clinical Oncology, Holy Cross Cancer Centre, Kielce, Poland; 6Department of Oncological Surgery, Holy Cross Cancer Centre, Kielce, Poland; 7Faculty of Science and Engineering, Cell Biology, Abo Akademi University, Turku, Finland
*These authors contributed equally to this work
Correspondence: Andrzej Stepulak; Adolfo Rivero-Muller
Department of Biochemistry and Molecular Biology, Medical University of Lublin, Chodzki 1, Lublin 20-093, Poland
Tel +48 81 448 6350
Fax +48 81 448 6350
Email [email protected]; [email protected]
Introduction: Histone deacetylase inhibitors (HDIs) are a group of compounds that exhibit anticancer activity, but their significance and usefulness in breast cancer (BC) treatment are still controversial. The ability of cancer cells to invade and migrate is augmented by the acquisition of a mesenchymal phenotype – a process known as epithelial-to-mesenchymal transition (EMT). Changes in the expression level of different cadherins, so-called cadherin switches, have been used to monitor the EMT process in development and tumor progression, in particular migration and invasion potential. The aim of this study was to analyze the influence of two HDIs – valproic acid (VPA) and vorinostat (SAHA) – on the migration potential of different BC cell types, as well as on EMT, or its reverse process – mesenchymal-to-epithelial transition, progression by means of shift in epithelial and mesenchymal marker expression.
Methods: HDI treatment-induced expression of E- and N-cadherin at the mRNA and protein levels was evaluated by qPCR, Western blotting and immunostaining methods, respectively. BC cell proliferation and migration were assessed by BrdU, xCELLigence system and wound-healing assay.
Results: VPA and SAHA inhibited the proliferation and migration in a dose- and time-dependent manner, regardless of the BC cell type. Unawares, BC cells having a more mesenchymal phenotype (MDA-MB-468) were found to overexpress N-cadherin, whereas BC lines having an epithelial phenotype (T47D, MCF7) responded to HDI treatment by a significant increase of E-cadherin expression.
Discussion: We suggest that HDAC inhibition results in a more relaxed chromatin concomitant to an increase in the expression of already expressing genes.
Conclusion: By using multiple cancer cell lines, we conclude that HDI induction or reversal of EMT is not a universal mechanism, yet inhibition of cell migration is, and thus EMT should not be considered as the only measurement for tumor aggressiveness.
Keywords: breast cancer, HDIs, VPA, SAHA, EMT, migration
Introduction
Breast cancer (BC) is the most common malignancy among women worldwide, contributing 24% of the total number of new cases diagnosed with cancer in 2018. Furthermore, it was the most frequent cause of cancer death (15% of total) in 2018.1 BC is a heterogeneous disease, consisting of tumors with different pathologic and molecular characteristics, which presents significant challenges for treatment.2,3 Classification of BC is currently based on molecular subtypes in order to reflect the hormone responsiveness of the tumor. According to the specific molecular features, BCs can be separated into two main classes (expressing hormone receptors or not) and five intrinsic subtypes (luminal subtype A, luminal subtype B, human epidermal growth factor receptor 2 (HER2)-enriched subtype, basal-like subtype, normal breast-like type). This classification reflects the BC heterogeneity and complexity of diagnosis, prognosis, and treatment.4,5 Advancement in the therapy has significantly improved the survival of patients diagnosed with hormone receptor-positive BC.6 However, the therapy of triple-negative breast cancer (TNBC), defined by the lack of immunohistochemical expression of estrogen receptor (ER), progesterone receptor (PR) and absence of overexpression and/or amplification of HER2 characterized by aggressive clinical course, early development of visceral metastases and a destitute long-term prognosis, is one of the most important challenges of medicine.6,7 Hence, there is a need to find novel therapeutic agents against BC, in order to outrank the resistance and the invasiveness of already existing therapy, and to increase the effectiveness of treatment.
Given the fact that epigenetic mechanisms control the initiation and progression of BC, there is an increasing interest in the molecules which participate in epigenetic modifications of genes expressed in tumorigenesis.8 Histone acetylation is a crucial epigenetic modification controlled by a balance in activity between histone acetyltransferases and histone deacetylases (HDACs) enzymes, enabling to activate or repress numerous genes. Aberrant histone acetylation patterns are found in different types of cancer. Low levels of H4K16 and H4K12 acetylation are suggested as an early event in BC development.9,10 Thereby, compounds ameliorating these and other histone modifications may become potential drugs in BC treatment.
Histone deacetylase inhibitors (HDIs) are a structurally diversified group of compounds that, by inhibiting HDACs, increase histone acetylation and thereby alter gene transcription. It has been suggested that their anticancer effects are exerted through induction of apoptosis, autophagy eliciting cell death, cell-cycle arrest, inhibition of migration and invasion, induction of re-differentiation of cancer cells, immunomodulatory responses, inhibition of stress responses, increased generation of oxidative stress and regulation of noncoding RNA expression in tumor cells, utilizing different intracellular mechanisms including upregulation of p21 (p21Cip1/Waf1); hyperacetylation of Runt-related transcription factor 3 (Runx3); downregulation of Bcl-2, Bcl-xl, Mcl-1, X-linked inhibitor of apoptosis protein (Xiap) or survivin and transcriptional upregulation of autophagic key regulators such as Lc3, Beclin-1 and Atg proteins.11,12 The mechanisms of the anticancer activities of individual HDIs differ since these agents act by modifying downstream signaling pathways.13 These anticancer mechanisms have not been fully resolved, partly as their effects are cell type, dose, and time dependent. Moreover, HDIs do not only affect histone–DNA complexes, but also the acetylation status of nonhistone proteins, eg, p53 or signal transducer and activator of transcription 3 (STAT3).11 In contrast, HDIs have been reported to act selectively toward cancer cells over normal cells.12
Cell migration is an essential process during embryonic development, inflammation, wound healing and metastasis of cancer cells. The ability of cancer cells to migrate has been associated with a process called epithelial-to-mesenchymal transition (EMT) where the loss of epithelial phenotype, characterized by the expression of E-cadherin, is followed by the gain of a mesenchymal phenotype characterized by the expression of N-cadherin, vimentin and fibronectin.14,15 E-cadherin (E-cad), the product of the E-cadherin gene (CDH1) located on the long arm of chromosome 16 (16q22.1), is a calcium-dependent epithelial transmembrane glycoprotein that mediates cell-to-cell adhesion and helps maintain the morphological integrity of epithelial cells by forming homodimers with E-cadherin molecules on adjacent cells via its extracellular domain.16 N-cadherin (N-cad) is a 140 kDa protein and is an integral membrane, calcium-binding glycoprotein that mediates the intercellular adhesion.17,18 Presence of N-cadherin is associated with more aggressive behavior of epithelial-derived solid malignancies and can be regarded as a predictor of poor survival, based on meta-analysis involving 36 studies with 5705 patients.19 Therefore, in our study, we elected to investigate the effect of the two representative HDIs – valproic acid (VPA) and vorinostat (SAHA) – on the migration and proliferation of T47D, MCF7, MDA-MB-231 and MDA-MB-468 human BC cells as a measure of invasion potency in parallel with analyzing potential shifts in expression of epithelial and mesenchymal markers involved in EMT/mesenchymal-to-epithelial transition (MET) progression.
Materials and methods
Drugs
Suberoylanilide hydroxamic acid (SAHA) and VPA were purchased from Cayman Chemical (San Diego, CA, USA) and Sigma Chemicals (Saint Louis, MO, USA), respectively. Stock solutions of SAHA (10 μM) and VPA (100 mM) were prepared in dimethyl sulfoxide (DMSO) and PBS with Ca2+ and Mg,2+ respectively. The drugs were diluted with culture medium to the respective concentration just before use.
Cell lines
T47D (ATCC® HTB-133™), MCF7 (ATCC® HTB-22™), MDA-MB-231 (ATCC® CRM-HTB-26™), MDA-MB-468 (ATCC® HTB-132™) and BT-549 (ATCC® HTB-122™) human BC cell lines were obtained from the American Type Culture Collection (Manassas, VA, USA). T47D, MCF7, MDA-MB-231 and MDA-MB-468 cancer cells were grown in DMEM/Nutrient F-12 Ham (DMEM/F12) culture medium (Sigma) with 10% FBS (Sigma), penicillin (100 IU/mL) (Sigma) and streptomycin (100 μg/mL) (Sigma). BT-549 cells were maintained in Roswell Park Memorial Institute Medium (RPMI) culture medium (ATTC) with 0.023 U/mL insulin (Sigma), 10% FBS (ATTC), penicillin (100 IU/mL) (Sigma) and streptomycin (100 μg/mL) (Sigma). Mycoplasma-free cultures were maintained in a humidified atmosphere with 5% CO2 at 37°C.
Cell proliferation ELISA, BrdU assay
T47D, MCF7, MDA-MB-231 and MDA-MB-468 cells were placed on 96-well plates (Nunc, Roskilde, Denmark) at a density of 1×10⁴cells/mL. After 24 hrs, cells were treated with 0.25–10 mM VPA or 0.25–5 µM SAHA for 48 hrs. DNA synthesis in proliferating cells was evaluated by measurement of 5-bromo-2ʹ-deoxyuridine (BrdU) incorporation using Cell Proliferation ELISA, Brdkit (Roche, Basel, Switzerland). Absorbance was measured at 450 nm with the use of an Infinite M200 Pro microplate reader (Tecan, Männedorf, Switzerland).
Wound-healing assay
Scratch assay was used to assess the effects of VPA and SAHA on migration of BC cells. T47D, MCF7, MDA-MB-231 and MDA-MB-468 cancer cells were plated at 5×10⁵ cells/mL in 2 mL of complete growth medium on culture dishes (4 cm in diameter) (Nunc). On the following day, the monolayer of cells was scratched using a pipet tip (P300) to create one linear wound. The cells were rinsed with PBS and covered with a fresh medium with 1% FBS (control) or fresh medium supplemented with VPA (2 mM, 5 mM) or SAHA (2 µM, 5 µM). After 24 hrs, plates were stained with May–Grünwald–Giemsa method. The observation was performed with Nikon Eclipse TS100 Microscope (Nikon Precision Inc, Tokyo, Japan).
Real-time migration monitoring – xCELLigence RTCA DP
Cell migration was monitored using the xCELLigence RTCA DP (Real-Time Cell Analyzer Dual Plate) Instrument (ACEA Biosciences Inc., San Diego, CA, USA) in a humidified atmosphere at 37°C and 5% CO2. In this system, cells migrate from the upper chamber through the microporous polyethylene terephthalate (PET) membrane containing microfabricated gold electrodes into the bottom chamber, in response to a chemoattractant. Migrating cells adhere to the electronic gold sensors on the underside of the membrane, resulting in an increase in the electrical impedance. The increase in the impedance correlates with increasing numbers of migrated cells. BC cells were maintained in the culture medium supplemented with 1% FBS for 24 hrs and seeded (4×10⁴/well) in Real-Time Cell Analyzer (RTCA) Cell Invasion and Migration (CIM)-16 plates in medium containing 1% FBS (control) or medium with 1% FBS and VPA (2 mM, 5 mM) or SAHA (2 µM, 5 µM), respectively. The upper chamber was placed on the lower part of the CIM plate containing growth medium supplemented with 20% FBS as a chemoattractant or medium without FBS (negative control of migration). After 30 mins of incubation at room temperature (RT), CIM plates were placed onto the RTCA station. Cell migration was continuously monitored throughout 48 hrs by measuring changes in the electrical impedance. Recording of cell index (CI) as well as subsequent data analysis was performed using the RTCA Software 1.2 (ACEA Biosciences Inc.).
Immunostaining
T47D and MDA-MB-468 BC cells were seeded into 8-well culture slides (Corning, New York, NY, USA) at a density of 4×10⁴ cells/mL/chamber and grown in a complete medium (control) or medium containing selected concentrations of SAHA and VPA. After 48 hrs of treatment, the cells were washed in PBS and fixed with methanol at −20°C for 10 mins. Next, the cells were washed 3×5 mins in PBS, quenched 2×5 mins with PBS containing 50mM of NH4Cl and blocked with Boehringer blocking reagent (Sigma) and 0.2% Triton X-100 (Sigma) for 60 mins, then the cells were probed 2 hrs with anti-E-cadherin (1:50, rabbit polyclonal, Santa Cruz Biotechnology (Dallas, TX, USA)) or anti-N-cadherin (1:50, mouse monoclonal, Santa Cruz Biotechnology, Inc) antibodies in blocking reagent. Subsequently, the cells were washed 3×5 mins in PBS containing 0.2% Triton X-100, incubated in darkness for 1 hr at RT with donkey anti-mouse JgG Alexa Fluor 555 (1:500, Invitrogen, Carlsbad, CA, USA) or donkey anti-rabbit IgG Alexa Fluor 647 (1:500, Invitrogen) antibodies in blocking reagents, respectively. Next, the cells were washed 3×5 mins in PBS, mounted with antifade medium with DAPI (Invitrogen) and analyzed under a confocal laser-scanning microscope (Nikon Eclipse Ti, Tokyo, Japan) equipped with 100x oil immersion objective. Secondary antibody controls were designed for each experiment.
RNA isolation and cDNA synthesis
BC cells were seeded into 6-well culture plates at a density of 2.5×10⁵ cells/mL. The next day, the cells were incubated with selected concentrations of VPA and SAHA for 24 hrs. Total RNA from the cells was isolated using the High Pure RNA Isolation Kit (Roche) following the manufacturer’s instruction. The RNA concentration was determined using NanoQuant Plate and Tecan Infinite M200 Pro (Männedorf, Switzerland) at 260/280 nm. 1 μg of total RNA was reverse transcribed for 60 mins at 50°C using an anchored-oligo(dT)18 primer and the Transcriptor High Fidelity cDNA Synthesis Kit (Roche) followed by 5-min inactivation of Transcriptor Reverse Transcriptase at 85°C according to manufacturer’s protocol.
qPCR
Quantitative real-time expression analysis was performed using a LightCycler®480 II instrument (Roche). cDNA was used as a template for RT-PCR run using LightCycler® 480 SYBR Green I Master (Roche). The relative amount of mRNA was normalized to the expression of GAPD. Amplification was performed in 10 μL of reaction mixture containing: cDNA amount corresponding to 12.5 ng of total RNA, x SYBR Green Master Mix and appropriate set of 0.5 μM primers for each gene. The gene-specific oligonucleotide primer sequences used in the present study were as follows: E-cadherin (forward: 5ʹ-CAGGCTCAAGCTATCCTTGC-3ʹ, reverse: 5ʹ-AGTCATGCGTAGTGGTGCAT-3ʹ); N-cadherin (forward: 5ʹ- GGTGGAGGAGAAGAAGACCAG-3ʹ, reverse: 5ʹ-GGCATCAGGCTCCACAGT-3ʹ), GAPD (forward: 5ʹ-CTCTGCTCCTCCTGTTCGAC-3ʹ, reverse: 5ʹ-GCCCAATACGACCAAATCC-3ʹ). After 5 mins of initial incubation at 95°C, cDNA was amplified in 45 cycles consisting of 10 s denaturation at 95°C, 30 s annealing at 60°C and 10 s elongation at 75°C. A melting curve analysis was performed to distinguish specific products from nonspecific products and primer dimers. Obtained fluorescence data were calculated using a relative quantification method with efficiency correction.
Protein extraction and Western blotting analysis
T47D, MCF7, MDA-MB-231 and MDA-MB-468 BC cells (2.5×10⁵ cells/mL) were incubated in the culture medium for 24 hrs in 6-well plates (Nunc). The next day, cancer cells were treated with different concentrations of VPA and SAHA for 48 hrs. After 48 hrs of incubation, the cells were washed in PBS and lysed in RIPA buffer (ready-to-use solution containing 150 mM NaCl, 1.0% IGEPAL® CA-630, 0.5% sodium deoxycholate, 0.1% SDS, 50 mM Tris, pH 8.0) (Sigma) enriched with protease inhibitor cocktail (Sigma) for 60 mins at 4°C. Then, the lysates were centrifuged at 4000×g for 10 mins at 4°C. Protein concentration was quantified using a BCA protein assay kit (Pierce® BCA Protein Assay Kit, Thermo Scientific, Rockford, IL. USA). For Western-blot analysis, supernatants of RIPA cell lysates were solubilized in 6×Laemmli sample buffer (50% glycerol, 10% SDS, 300 mM Tris-HCl pH 6.8, 0.05% bromophenol blue, 6.25% β-mercaptoethanol) and boiled for 5 mins at 100°C. 20 µg of protein extracts was separated on 10% SDS-PAGE and transferred onto the Immobilon P membrane (Merck, Darmstadt, Germany). Following the transfer, the membrane was blocked with blocking buffer (5% nonfat dried milk in TBS/0.1% Tween-20 (TBST)) for 1 hr at RT and incubated overnight at 4°C with the following primary antibodies: E-cadherin (1:1000 in 5% non-fat dried milk/TBST, rabbit polyclonal, Santa Cruz), N-cadherin (1:1000 in 5% non-fat dried milk/TBST, mouse monoclonal, Santa Cruz), β-actin (1:500 in 5% nonfat dried milk/TBST, mouse monoclonal, Santa Cruz). β-actin was used as a loading control. On the following day, the membrane was washed and then incubated with an appropriate horseradish peroxidase-labeled secondary antibody (1:250 in 5% nonfat dried milk/TBST, Santa Cruz) for 1 hr at RT. Finally, target proteins were visualized using a Lumi-Light Western blotting substrate (Roche) according to the manufacturer’s protocol.
Statistics
Statistical analysis was performed by GraphPad Prism. The differences between groups were evaluated using the one-way ANOVA; Tukey’s post-hoc test. Data are expressed as the mean ± SD (*p<0.05, **p<0.01, ***p<0.001).
Results
VPA and SAHA inhibit proliferation and the migratory activity of T47D, MCF7, MDA-MB-231 and MDA-MB-468 BC cells in a dose- and time-dependent manner
VPA and SAHA reduced the proliferation of all analyzed BC cells in a dose-dependent manner after 48 hrs of incubation with VPA (0.25–10 mM) or SAHA (0.25–5 µM). The most statistically significant antiproliferative effect of VPA and SAHA on B cells was observed in T47D cell line, whereas MDA-MB-468 cells were the most resistant for VPA and SAHA treatment among all analyzed BC cell lines (Figure 1).
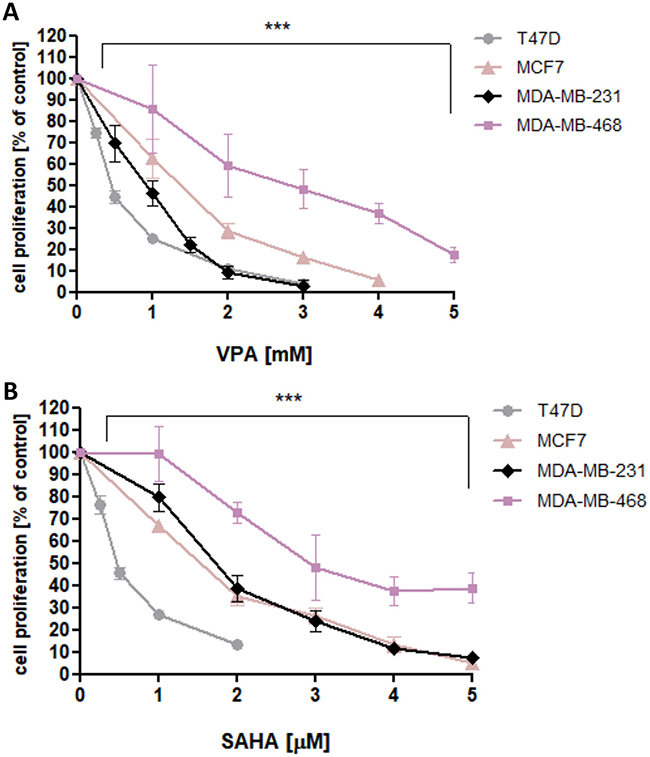 |
Figure 1 Effect of VPA (A) and SAHA (B) on proliferation of T47D, MCF7, MDA-MB-231 and MDA-MB-468 breast cancer cells in Brdassay. Notes: T47D, MCF7, MDA-MB-231 and MDA-MB-468 cells were incubated for 48 hrs alone (control) or in the presence of VPA (0.25-10 mM) or SAHA (0.25-5 µM). The differences between groups were evaluated using the one-way ANOVA; Tukey’s post-hoc test. p<0.05 was considered to indicate a statistically significant difference. Results were presented as mean ± SD of the mean. Abbreviations: SAHA, vorinostat; VPA, valproic acid. |
VPA and SAHA reduced the migration of all BC cells in a dose-dependent manner in a wound-healing assay (Figure 2). A significant inhibitory effect of VPA and SAHA on the cell migration of all BC cells was observed already after using lower doses of tested drugs. To assess, if inhibition of BC cells is also time dependent, we employed the xCELLigence RTCA DP, a highly quantitative real-time monitoring system. VPA (2 mM; 5 mM) and SAHA (2 µM; 5 µM) decreased in a time- and dose-dependent manner MCF7, MDA-MB-231 and MDA-MB-468 cell migration as compared with the control cells (Figure 3). We observed a continuous and permanent increase of migration of untreated MCF7, MDA-MB-231 and MDA-MB-468 cells over the time, which was inhibited in a dose-dependent manner in a similar fashion after HDI treatment. We did not observe significant mobility of T47D cells in xCELLigence System.
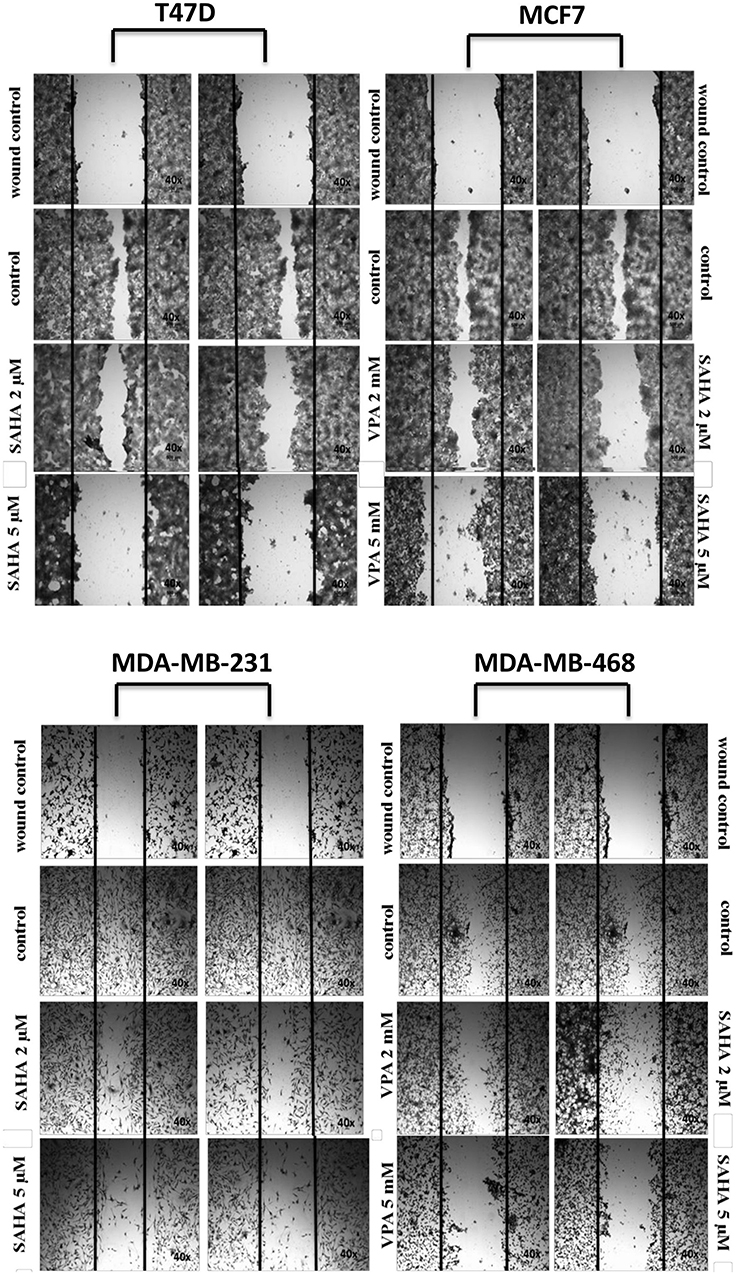 |
Figure 2 Effect of VPA and SAHA on migration of T47D, MCF7, MDA-MB-231 and MDA-MB-468 breast cancer cells in wound-healing assay. Notes: Scratched monolayers of T47D, MCF7, MDA-MB-231 and MDA-MB-468 cells were incubated for 24 hrs alone (control) or in the presence of VPA (2 mM, 5 mM) or SAHA (2 µM, 5 µM). Representative images from 3 independent experiments are shown. Magnification 40×. Abbreviations: SAHA, vorinostat; VPA, valproic acid. |
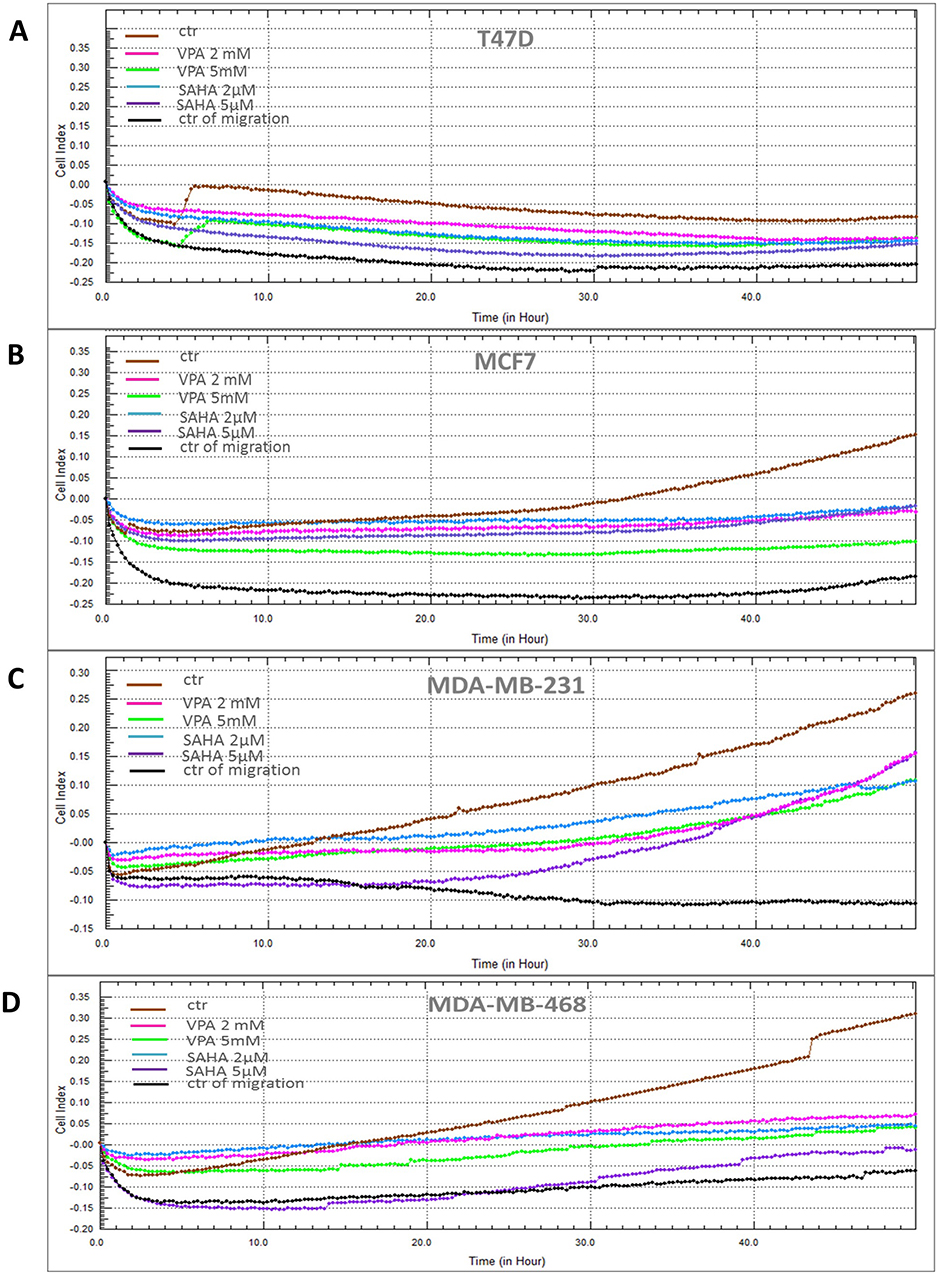 |
Figure 3 Effect of VPA and SAHA on migration of breast cancer cells in xCELLigence RTCA DP system. Notes: T47D (A), MCF7 (B), MDA-MB-231 (C) and MDA-MB-468 (D) breast cancer cells were treated with VPA (2 mM, 5 mM) or SAHA (2 µM, 5 µM), or left untreated (control) and seeded in triplicate on a CIM-plates. Migration was monitored in real time for 48 hrs in the xCELLigence system. Abbreviations: SAHA, vorinostat; VPA, valproic acid. |
VPA and SAHA increase E-cadherin and N-cadherin gene expression in BC cells
Since HDIs inhibited migration of BC cells observed in our studies, and migration capability has been associated with EMT, more mesenchymal cells migrate more, and we were expecting that HDI treatment will ameliorate epithelial phenotype of cancer cells, including reduction of N-cadherin expression with concomitant increase of E-cadherin expression, as observed previously in other cancer cell types.20–23
Epithelial-like BC cells responded to HDIs by increasing E-cadherin (CDH1) expression
After 24 hrs of incubation of T47D cells with 2 mM VPA, qPCR revealed an increase of CDH1 mRNA expression by more than twofold. The dose of 5 mM increased further the expression of CDH1. CDH1 mRNA levels in T47D cells after treatment with 2 µM and 5 µM SAHA increased by 35% and 90%, respectively, compared to the untreated cells. In MCF7 BC cells, the doses of 2 mM VPA and 2 µM SAHA slightly increased the expression of CDH1, compared to the control. Marked induction (75%) of these genes was detected after incubation with 5 mM VPA and 5 µM SAHA. In MDA-MB-231 and MDA-MB-468 cells, expression of CDH1 was very low, although VPA and SAHA treatment also caused an increase in expression of CDH1 (Figure 4). There were no significant differences in CDH2 expression between T47D, MCF7 and MDA-MB-231 cells. All these BC cell lines have an epithelial-like phenotype and thus normally express neglectable levels of CDH2, which does not change significantly after VPA and SAHA treatment.
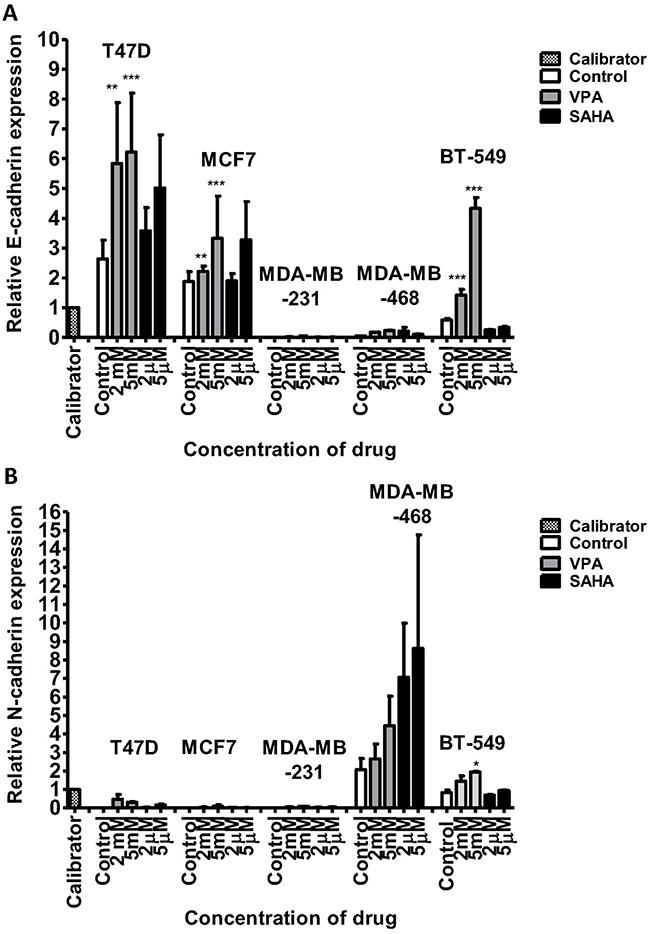 |
Figure 4 mRNA expression of CDH1 (E-cadherin) and CDH2 (N-cadherin) in breast cancer cell lines after VPA or SAHA treatment. Notes: Expression of CDH1 (A) and CDH2 (B) was analyzed by qPCR in T47D, MCF7, MDA-MB-231, MDA-MB-468 and BT-549 cells exposed to either culture medium alone (control) and VPA (2 mM, 5 mM) or SAHA (2 µM, 5µM) for 24 hrs. The differences between groups were evaluated using the one-way ANOVA; Tukey’s post-hoc test. p<0.05 was considered to indicate a statistically significant difference. Results were presented as mean ± SD. Abbreviations: SAHA, vorinostat; VPA, valproic acid. |
Mesenchymal-like BC cells responded to HDIs by increasing N-cadherin (CDH2) expression
In contrast, we found a dose-dependent upregulation of CDH2 mRNA level in MDA-MB-468 cells after HDI treatment. CDH2 mRNA increased by 30% and 120% after 2 mM and 5 mM VPA treatment, respectively, compared to the untreated cells. In MDA-MB-468 cells exposed to 2 µM and 5 µM SAHA, CDH2 mRNA increased 3.5- and 4-fold compared with control (untreated cells) (Figure 4). However, in this case, no statistical significance has been achieved.
Hybrid-like BC cells responded to HDIs by increasing both E-cadherin (CDH1) and N-cadherin (CDH2) expression
After 24 hrs of incubation with 2 mM VPA, BT-549 cells revealed a more than 2-fold increase of CDH1 mRNA expression. The dose of 5 mM increased further 7-fold the expression of CDH1 vs control. In contrast, we observed about a 2-fold decrease in CDH1 expression level after SAHA treatment in these cells. Moreover, in BT-549 cells exposed to 2 mM and 5 mM VPA, CDH2 mRNA level increased about 2-fold. A slight increase in CDH2 expression level was observed after 5 µM SAHA treatment compared with control (untreated cells) (Figure 4).
VPA and SAHA increase of E-cadherin and N-cadherin protein expression in BC cells
Expression of both E- and N-cadherin was analyzed by Western blot and immunochemistry in T47D, MCF7, MDA-MB-231 and MDA-MB-468 cell lines treated with HDIs. The Western blotting and immunocytochemistry experiments using antibodies against E-cadherin and N-cadherin showed that VPA and SAHA treatment resulted in similar dose-dependent changes in expression of these proteins (Figure 5–7) as at the mRNA level. Immunocytochemistry experiments revealed that the incubation of T47D cells with VPA and SAHA upregulated the levels of E-cadherin expression after 48 hrs, in comparison to the control (Figure 6). In MDA-MB-468 cells, we did not observe E-cadherin expression in the control and any changes in expression of this protein after HDI treatment (Figure 7). As shown in Figure 6, treatment of T47D cells with VPA and SAHA for 48 hrs and visualized under a confocal microscope did not affect N-cadherin expression. The remarkable increase of N-cadherin expression was found in MDA-MB-468 cells after both HDI treatments (Figure 7). Similar results were obtained in Western blotting experiments, but in most cases, no statistical significance was demonstrated. The most remarkable activation of N-cadherin was found at 2 µM and 5 µM SAHA in MDA-MB-468 cells. In contrast, the exposure to HDIs did not have an influence on the expression of N-cadherin in MDA-MB-231 cells. No N-cadherin protein expression changes were observed in control cells (untreated) (Figure 5).
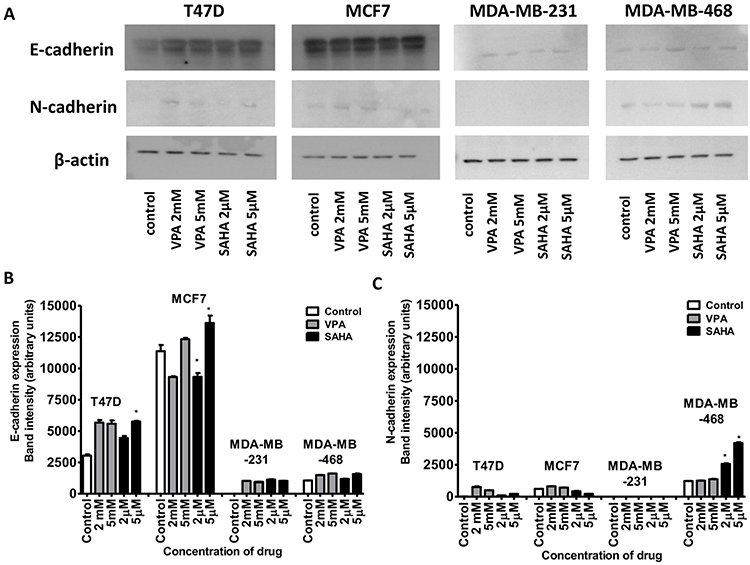 |
Figure 5 Effect of VPA and SAHA on the E-cadherin (A,B) and N-cadherin (A,C) protein expression. Notes: T47D, MCF7, MDA-MB-231 and MDA-MB-468 breast cancer cells were exposed to increasing concentrations of VPA (2 mM, 5 mM) or SAHA (2 µM, 5 µM) for 48 hrs. The expression of the E-cadherin and N-cadherin was analyzed by immunoblotting with the respective antibodies as described in “Materials and methods“ section. Image J was used to assess the intensity of the bands (densitometric measurement). Anti-β-actin antibody was used as a control. The differences between groups were evaluated using the one-way ANOVA; Tukey’s post-hoc test. p<0.05 was considered to indicate a statistically significant difference. Results were presented as mean ± SD. Abbreviations: VPA, valproic acid; SAHA, vorinostat. |
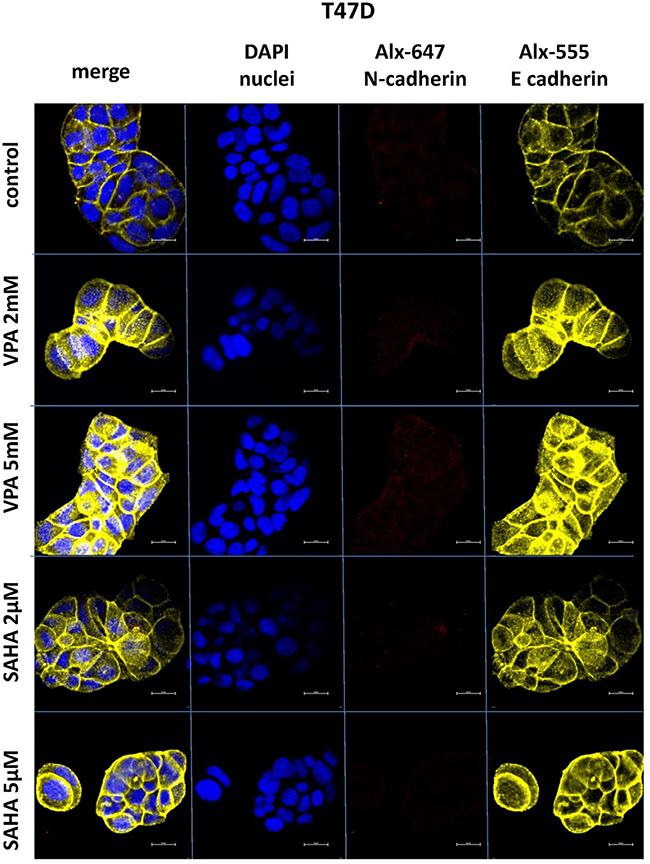 |
Figure 6 Confocal imaging of E-cadherin and N-cadherin expression in T47D cells cultured alone (control) or in the presence of VPA (2 mM, 5 mM) and SAHA (2 µM, 5 µM). Notes: Fixed cells were blocked and incubated with an anti-E-cadherin and anti-N-cadherin antibodies, followed by the respective secondary antibodies conjugated with Alexa fluorochromes as described in Material and methods. Nuclei were stained with DAPI. 100x oil immersion objective was used. Representative images are shown. Abbreviations: SAHA, vorinostat; VPA, valproic acid. |
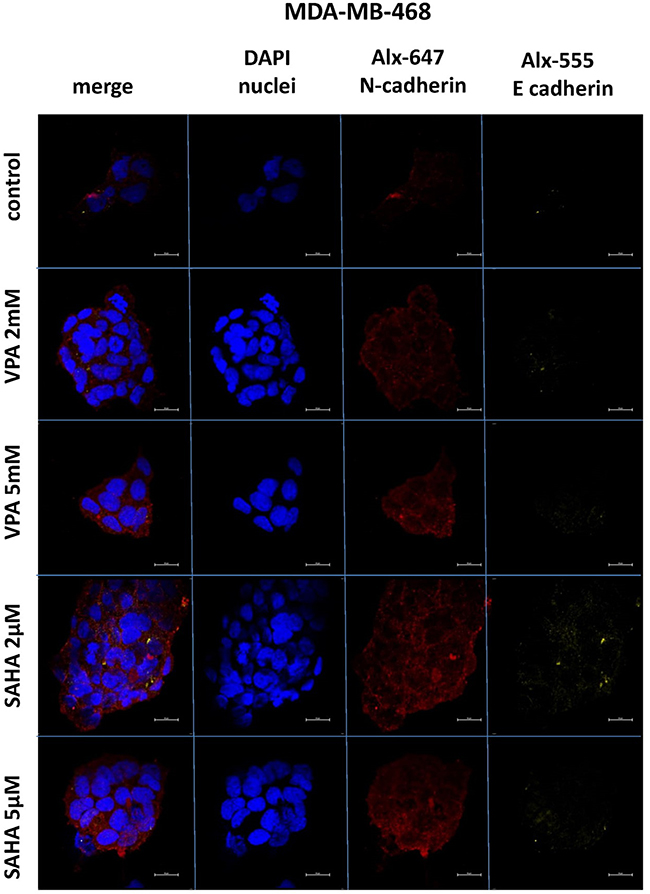 |
Figure 7 Confocal imaging of E-cadherin and N-cadherin expression in MDA-MB-468 cells cultured alone (control) or in the presence of VPA (2 mM, 5 mM) and SAHA (2 µM, 5 µM). Notes: Fixed cells were blocked and incubated with an anti-E-cadherin and anti-N-cadherin antibodies, followed by the respective secondary antibodies conjugated with Alexa fluorochromes as described in “Material and methods“ section. Nuclei were stained with DAPI. 100 x oil immersion objective was used. Representative images are shown.Abbreviations: SAHA, vorinostat; VPA, valproic acid. |
Discussion
HDIs are promising anticancer drugs due to their ability to inhibit proliferation and induce apoptosis and cell cycle arrest in numerous cancer cells, including breast carcinoma.24 Although in clinical trials, HDIs did not display spectacular effects as single agents in BC treatment, it has been shown that HDIs increase the sensitivity of BC to radiotherapy and chemotherapy.25,26 As presented in our previous studies, two HDIs –- VPA and suberanilohydroxamic acid (SAHA) – show synergistic or additive interactions with other chemotherapeutic agents such as cisplatin in vitro inhibiting proliferation of different cancer cell types, including BC cells.24,27,28 In several other reports, the FDA-approved HDAC inhibitors VPA and SAHA have been shown to reduce proliferation, survival, cell migration, and modulate hormone receptor expression of BC cells in both the preclinical and clinical settings.29 Yet, there are contradictory studies showing that SAHA or VPA might, in some cases, promote the migration of TNBC cells.30,31 In our present studies using two different experimental approaches, we demonstrated that VPA and SAHA reduce migration of both – ER-expressing BC and TNBC cells in a time- and dose-dependent manner. However, cancer cell migration has been associated with EMT and cancer invasion, which has been considered a potential mechanism of action by the HDIs, although this effect is cancer-type dependent.11 The switch from E-cadherin, associated with epithelial phenotype, to the mesenchymal cell associated with N-cadherin has often been observed during cancer progression.6 Acquired N-cadherin expression in BC cells is considered a driver for invasive and metastatic tumor cell behaviors, as pro-N-cadherin expression is directly associated with BC grade.32,33 Previous reports have shown that BC cells treated with different HDIs resulted in either increase of E-cadherin expression, or increase of E-cadherin with down-regulated N-cadherin expression (considered as MET), or upregulated N-cadherin only.22,31,34 In our study, we show that BC cells that express high amounts of E-cadherin with very low level of N-cadherin, such as MCF7 and T47D ER-positive BC cells, respond to HDIs by further increasing the E-cadherin levels. In contrast, MDA-468 TNBC cells revealed the opposite phenotype – with a very low level of E-cadherin and high level of N-cadherin expressions. VPA or SAHA treatment resulted in a dose-dependent increase of expression of N-cadherin. Surprisingly, in MDA-MB-468 cells, the increase in N-cadherin expression, and thus a more mesenchymal phenotype, and inhibition of migration appear to be independent processes. Interestingly, in the BT-549 cells with hybrid-like phenotype (baseline relatively high expression of both cadherins), an increase in both CDH1 and CDH2 expression after VPA treatment was observed.
We suggest that increase of N-cadherin or E-cadherin expression in cells already expressing these genes is the result of immediate changes in chromatin structure upon HDAC inhibition, mostly affecting open-chromatin, while repressed genes in closed-chromatin changed little as multiple factors are involved in their regulation. Additionally, cancer cells might be adapting to the HDI treatment by increasing the expression of these structural proteins in order to increase their chances of survival. This phenomenon is of clinical interest as knowing the phenotype of tumor cells might be essential for successful therapy. The role of EMT in tumor progression and metastasis is still a matter of debate due to conflicting results. TNBC cells that survived short-term treatment with docetaxel exhibit a more invasive behavior than pre-treated cells, these selected cell population had an increase in cell surface expression of N-cadherin precursor.35 Likewise, human cancer samples obtained from patients postchemotherapy support such observation as N-cadherin signaling potentiates mammary tumor metastasis via enhanced extracellular signal-regulated kinase (ERK) and Akt kinase activation.35–37 Yet, suppression of E-cadherin in BC (MDA-MB-468) xenografts significantly reduced tumor growth, suggesting an important role of E-cadherin in cancer cell proliferation. This might not be surprising in neoplasias of epithelial origin since E-cadherin has been found to be homogeneously expressed in BC samples by immunohistochemical analyses.38 While one could think that E-cadherin is important for primary tumors to grow and proliferate, there is evidence that E-cadherin is also involved in distant metastasis formation, suggesting an unknown metastatic role of E-cadherin.39 This is of important clinical relevance as an increase of mesenchymal markers (N-cadherin and vimentin) has been used to define migratory phenotypes, if taken solely as the markers for migration potential of tumor samples. Our data question the direct link between higher N-cadherin expression and migration under the current HDI treatments.
By using multiple BC cell lines, we are able to notice the differential patterning caused by HDIs in these cells. By comparing cell proliferation, migration and EMT markers, we suggest to reevaluate the role of HDIs in EMT/MET and cell migration. Previous reports on inhibition of tumor cell migration and EMT-related expression showed that VPA inhibits migration of MDA-MB-231 cells and upregulates Nm23H1 gene expression in a concentration-dependent manner, whereas cholangiocarcinoma cell lines augmented both E-cadherin and vimentin expression after VPA treatment, yet reduced their migration and invasion capabilities.30,40 Many questions remain: are both cadherins playing roles in tumor progression and metastasis? Are the intermediate stages of EMT, such as hybrid E/M stage, more aggressive? There is some evidence supporting the latter.41 Then, how are HDIs acting on cell proliferation and migration despite the cell type-dependent change? These issues require further investigation.
Conclusion
Taken together, our data suggest that HDIs, VPA and SAHA, block cell migration and proliferation, an event usually associated with increased epithelial characteristics. Yet, instead mesenchymal and hybrid-like cells, such as MDA-MB-468 or BT-549, responded by increasing N-cadherin. Summarizing, HDIs affect the expression of both epithelial and mesenchymal markers depending on the already existing cellular context, but inhibit migratory properties of BC cells regardless of their phenotype. This is a surprising finding that questions the overuse of EMT markers alone as measurement of invasion and migration potential. The clinical results of treatments using HDIs should also be evaluated on the phenotypical characteristics of the tumors in order to understand better their potential.
Acknowledgments
The study was supported by Medical University of Lublin DS440/2018-2019 grant, The Polish Ministry of Science and Higher Education MNmb 402/2018-2019, MNmb 510/2016-2017 grants, and Polish National Science Centre (NCN): DEC-2015/17/B/NZ1/01777 and DEC-2017/25/B/NZ4/02364 grants. The authors thank Agnieszka Styczynska for the editorial assistance and proofreading.
Disclosure
The authors report no conflicts of interest in this work.
References
1. Bray F, Ferlay J, Soerjomataram I, Siegel RL, Torre LA, Jemal A. Global cancer statistics 2018: GLOBOCAN estimates of incidence and mortality worldwide for 36 cancers in 185 countries. CA Cancer J Clin. 2018;68(6):394–424. doi:10.3322/caac.21492
2. Makki J. Diversity of breast carcinoma: histological subtypes and clinical relevance. Clin Med Insights Pathol. 2015;8:23–31. doi:10.4137/CPath.S31563
3. Rivenbark AG, O’Connor SM, Coleman WB. Molecular and cellular heterogeneity in breast cancer: challenges for personalized medicine. Am J Pathol. 2013;183(4):1113–1124. doi:10.1016/j.ajpath.2013.08.002
4. Zhang MH, Man HT, Zhao XD, Dong N, Ma SL. Estrogen receptor-positive breast cancer molecular signatures and therapeutic potentials (Review). Biomed Reports. 2014;2(1):41–52. doi:10.3892/br.2013.187
5. Perou CM, Sørlie T, Eisen MB, et al. Molecular portraits of human breast tumours. Nature. 2000;406(6797):747–752. doi:10.1038/35021093
6. Sethi S, Sarkar FH, Ahmed Q, et al. Molecular markers of epithelial-to-mesenchymal transition are associated with tumor aggressiveness in breast carcinoma. Transl Oncol. 2011;4(4):222–226. http://www.ncbi.nlm.nih.gov/pubmed/21804917.
7. Adamo B, Ricciardi GRR, Ieni A, et al. The prognostic significance of combined androgen receptor, E-Cadherin, Ki67 and CK5/6 expression in patients with triple negative breast cancer. Oncotarget. 2017;8(44):76974–76986. doi:10.18632/oncotarget.20293
8. Fedele P, Orlando L, Cinieri S. Targeting triple negative breast cancer with histone deacetylase inhibitors. Expert Opin Investig Drugs. 2017;26(11):1199–1206. doi:10.1080/13543784.2017.1386172
9. Falahi F, van Kruchten M, Martinet N, Hospers G, Rots MG. Current and upcoming approaches to exploit the reversibility of epigenetic mutations in breast cancer. Breast Cancer Res. 2014;16(4):412. doi:10.1186/s13058-014-0412-z
10. Guo P, Chen W, Li H, Li M, Li L. The histone acetylation modifications of breast cancer and their therapeutic implications. Pathol Oncol Res. 2018;24(4):807–813. doi:10.1007/s12253-018-0433-5
11. Wawruszak A, Kalafut J, Okon E, et al. Histone deacetylase inhibitors and phenotypical transformation of cancer cells. Cancers (Basel). 2019;11(2):148. doi:10.3390/cancers11020148
12. Mrakovcic M, Bohner L, Hanisch M, Fröhlich LF. Epigenetic targeting of autophagy via HDAC inhibition in tumor cells: role of p53. Int J Mol Sci. 2018;19(12):3952. doi:10.3390/ijms19123952
13. Shah RR. Safety and tolerability of histone deacetylase (HDAC) inhibitors in oncology. Drug Saf. 2019. doi:10.1007/s40264-018-0773-9
14. Heerboth S, Housman G, Leary M, et al. EMT and tumor metastasis. Clin Transl Med. 2015;4:6. doi:10.1186/s40169-015-0048-3
15. Santamaria PG, Moreno-Bueno G, Portillo F, Cano A. EMT: present and future in clinical oncology. Mol Oncol. 2017;11(7):718–738. doi:10.1002/1878-0261.12091
16. Lacerda L, Debeb BG, Smith D, et al. Mesenchymal stem cells mediate the clinical phenotype of inflammatory breast cancer in a preclinical model. Breast Cancer Res. 2015;17(1):42. doi:10.1186/s13058-015-0549-4
17. Kendall K. Cell adhesion century: culture breakthrough. Philos Trans R Soc B Biol Sci. 2014;370(1661):20140025. doi:10.1098/rstb.2014.0025
18. Blaschuk OW. N-cadherin antagonists as oncology therapeutics. Philos Trans R Soc B Biol Sci. 2014;370(1661):20140039. doi:10.1098/rstb.2014.0039
19. Luo Y, Yu T, Zhang Q, et al. Upregulated N-cadherin expression is associated with poor prognosis in epithelial-derived solid tumours: A meta-analysis. Eur J Clin Invest. 2018;48(4). doi:10.1111/eci.12903
20. Nalls D, Tang S-N, Rodova M, Srivastava RK, Shankar S. Targeting epigenetic regulation of mir-34a for treatment of pancreatic cancer by inhibition of pancreatic cancer stem cells. Batra SK, ed. PLoS One. 2011;6(8):e24099. doi:10.1371/journal.pone.0024099
21. Mateen S, Raina K, Agarwal C, Chan D, Agarwal R. Silibinin synergizes with histone deacetylase and DNA methyltransferase inhibitors in upregulating e-cadherin expression together with inhibition of migration and invasion of human non-small cell lung cancer cells. J Pharmacol Exp Ther. 2013;345(2):206–214. doi:10.1124/jpet.113.203471
22. Shah P, Gau Y, Sabnis G. Histone deacetylase inhibitor entinostat reverses epithelial to mesenchymal transition of breast cancer cells by reversing the repression of E-cadherin. Breast Cancer Res Treat. 2014;143(1):99–111. doi:10.1007/s10549-013-2784-7
23. Wang JH, Lee EJ, Ji M, Park SM. HDAC inhibitors, trichostatin A and valproic acid, increase E‑cadherin and vimentin expression but inhibit migration and invasion of cholangiocarcinoma cells. Oncol Rep. 2018;40(1):346–354. doi:10.3892/or.2018.6441
24. Wawruszak A, Luszczki JJ, Grabarska A, et al. Assessment of interactions between cisplatin and two histone deacetylase inhibitors in MCF7, T47D and MDA-MB-231 human breast cancer cell lines – an isobolographic analysis. Asselin E, ed. PLoS One. 2015;10(11):e0143013. doi:10.1371/journal.pone.0143013
25. Chiu H-W, Yeh Y-L, Wang Y-C, et al. Suberoylanilide hydroxamic acid, an inhibitor of histone deacetylase, enhances radiosensitivity and suppresses lung metastasis in breast cancer in vitro and in vivo. Agoulnik IU, ed. PLoS One. 2013;8(10):e76340. doi:10.1371/journal.pone.0076340
26. Raha P, Thomas S, Thurn KT, Park J, Munster PN. Combined histone deacetylase inhibition and tamoxifen induces apoptosis in tamoxifen-resistant breast cancer models, by reversing Bcl-2 overexpression. Breast Cancer Res. 2015;17(1):26. doi:10.1186/s13058-015-0533-z
27. Grabarska A, Łuszczki JJ, Nowosadzka E, et al. Histone deacetylase inhibitor SAHA as potential targeted therapy agent for larynx cancer cells. J Cancer. 2017;8(1):19–28. doi:10.7150/jca.16655
28. Gumbarewicz E, Luszczki JJ, Wawruszak A, et al. Isobolographic analysis demonstrates additive effect of cisplatin and HDIs combined treatment augmenting their anti-cancer activity in lung cancer cell lines. Am J Cancer Res. 2016;6(12):2831–2845. http://www.ncbi.nlm.nih.gov/pubmed/28042503.
29. Heers H, Stanislaw J, Harrelson J, Lee MW. Valproic acid as an adjunctive therapeutic agent for the treatment of breast cancer. Eur J Pharmacol. 2018;835:61–74. doi:10.1016/j.ejphar.2018.07.057
30. Wu S, Luo Z, Yu P-J, Xie H, He Y-W. Suberoylanilide hydroxamic acid (SAHA) promotes the epithelial mesenchymal transition of triple negative breast cancer cells via HDAC8/FOXA1 signals. Biol Chem. 2016;397(1):75–83. doi:10.1515/hsz-2015-0215
31. Debeb BG, Lacerda L, Xu W, et al. Histone deacetylase inhibitors stimulate dedifferentiation of human breast cancer cells through WNT/β-catenin signaling. Stem Cells. 2012;30(11):2366–2377. doi:10.1002/stem.1219
32. Maret D, Gruzglin E, Sadr MS, et al. Surface expression of precursor N-cadherin promotes tumor cell invasion. Neoplasia. 2010;12(12):1066–1080. doi:10.1593/neo.10954
33. Hazan RB, Phillips GR, Qiao RF, Norton L, Aaronson SA. Exogenous expression of N-cadherin in breast cancer cells induces cell migration, invasion, and metastasis. J Cell Biol. 2000;148(4):779–790. doi:10.1083/JCB.148.4.779
34. Srivastava RK, Kurzrock R, Shankar S. MS-275 sensitizes TRAIL-resistant breast cancer cells, inhibits angiogenesis and metastasis, and reverses epithelial-mesenchymal transition in vivo. Mol Cancer Ther. 2010;9(12):3254–3266. doi:10.1158/1535-7163.MCT-10-0582
35. Nelson ER, Li S, Kennedy M, et al. Chemotherapy enriches for an invasive triple-negative breast tumor cell subpopulation expressing a precursor form of N-cadherin on the cell surface. Oncotarget. 2016;7(51):84030–84042. doi:10.18632/oncotarget.12767
36. Hulit J, Suyama K, Chung S, et al. N-cadherin signaling potentiates mammary tumor metastasis via enhanced extracellular signal-regulated kinase activation. Cancer Res. 2007;67(7):3106–3116. doi:10.1158/0008-5472.CAN-06-3401
37. Qian X, Anzovino A, Kim S, et al. N-cadherin/FGFR promotes metastasis through epithelial-to-mesenchymal transition and stem/progenitor cell-like properties. Oncogene. 2014;33(26):3411–3421. doi:10.1038/onc.2013.310
38. Tramm T, Kyndi M, Sørensen FB, Overgaard J, Alsner J. Influence of intra-tumoral heterogeneity on the evaluation of BCL2, E-cadherin, EGFR, EMMPRIN, and Ki-67 expression in tissue microarrays from breast cancer. Acta Oncol (Madr). 2018;57(1):102–106. doi:10.1080/0284186X.2017.1404128
39. Hugo HJ, Gunasinghe NPAD, Hollier BG, et al. Epithelial requirement for in vitro proliferation and xenograft growth and metastasis of MDA-MB-468 human breast cancer cells: oncogenic rather than tumor-suppressive role of E-cadherin. Breast Cancer Res. 2017;19(1):86. doi:10.1186/s13058-017-0880-z
40. Li G-F, Qian T-L, Li G-S, et al. Sodium valproate inhibits MDA-MB-231 breast cancer cell migration by upregulating NM23H1 expression. Genet Mol Res. 2012;11(1):77–86. doi:10.4238/2012.January.13.1
41. Butti R, Gunasekaran VP, Kumar TVS, Banerjee P, Kundu GC. Breast cancer stem cells: biology and therapeutic implications. Int J Biochem Cell Biol. 2019;107:38–52. doi:10.1016/j.biocel.2018.12.001
 © 2019 The Author(s). This work is published and licensed by Dove Medical Press Limited. The full terms of this license are available at https://www.dovepress.com/terms.php and incorporate the Creative Commons Attribution - Non Commercial (unported, v3.0) License.
By accessing the work you hereby accept the Terms. Non-commercial uses of the work are permitted without any further permission from Dove Medical Press Limited, provided the work is properly attributed. For permission for commercial use of this work, please see paragraphs 4.2 and 5 of our Terms.
© 2019 The Author(s). This work is published and licensed by Dove Medical Press Limited. The full terms of this license are available at https://www.dovepress.com/terms.php and incorporate the Creative Commons Attribution - Non Commercial (unported, v3.0) License.
By accessing the work you hereby accept the Terms. Non-commercial uses of the work are permitted without any further permission from Dove Medical Press Limited, provided the work is properly attributed. For permission for commercial use of this work, please see paragraphs 4.2 and 5 of our Terms.