")
Back to Journals » OncoTargets and Therapy » Volume 9
Histone deacetylase inhibitor sodium butyrate suppresses proliferation and promotes apoptosis in osteosarcoma cells by regulation of the MDM2–p53 signaling
Authors Xie C, Wu B, Chen B, Shi Q, Guo J, Fan Z, Huang Y
Received 30 January 2016
Accepted for publication 15 April 2016
Published 4 July 2016 Volume 2016:9 Pages 4005—4013
DOI https://doi.org/10.2147/OTT.S105418
Checked for plagiarism Yes
Review by Single anonymous peer review
Peer reviewer comments 3
Editor who approved publication: Dr Faris Farassati
Chuhai Xie, Boyi Wu, Binwei Chen, Qunwei Shi, Jianhong Guo, Ziwen Fan, Yan Huang
Department of Orthopedics, The Second Affiliated Hospital of Guangzhou Medical University, Guangzhou, People’s Republic of China
Abstract: Histone deacetylase inhibitors have been reported to induce tumor cell growth arrest, differentiation, and apoptosis. This study aimed to investigate the effects of one histone deacetylase inhibitor – sodium butyrate (SB) – on osteosarcoma (OS) cell proliferation and apoptosis and also the molecular mechanisms by which SB exerts regulatory effects on OS cells. U2OS and MG63 cells were treated with SB at various concentrations. Then, cell proliferation and apoptosis were determined by 3-(4, 5-dimethylthiazol-2-yl)-2, 5-diphenyltetrazolium bromide and flow cytometry assays, respectively; the expression of Ki67, Bax, Bcl-2, MDM2, and p53 proteins was determined by using Western blot assay. The results showed that SB suppressed proliferation in a concentration-dependent manner and promoted apoptosis of OS cells. In addition, SB enhanced p53 expression and decreased MDM2 expression, indicating that SB can regulate MDM2–p53 feedback loop. p53 inhibited proliferation and promoted apoptosis, whereas MDM2 promoted proliferation and suppressed apoptosis, which indicated that functional effect of SB on OS cell lines at least in part depended on the MDM2–p53 signaling. We also explored the effect of SB on OS cells in vivo and found that SB suppressed the growth of OS cells with no noticeable effect on activity and body weight of mice in vivo. These findings will offer new clues for OS development and progression and offer SB as a potent targeted agent for OS treatment.
Keywords: osteosarcoma, histone deacetylase inhibitor, sodium butyrate, MDM2–p53 feedback loop
Introduction
Osteosarcoma (OS) is the most common primary tumors of bone and usually arises around the metaphysis of tubular long bones such as tibia, femur, and humerus.1 Inchoate, a main symptom of OS, is violent pain that can even cause fracture of the affected bones. The incidence of OS is three to five cases per million population per year, and it is seen mainly in adolescents and children.2 The incidence is markedly higher in males than in females, and mildly higher incidence is seen in Hispanics and Blacks than Caucasians.2 OS recurs in over 80% of the children, and 35%–40% of them die of recurrent OS within the first 2 years after diagnosis.3,4 Although OS was a lethal disease in the past, the development of multiagent chemotherapy followed by surgical resection and postoperative chemotherapy has improved the 5-year survival of OS patients, which increased from only 20% to nearly 75% during the last 30 years.5 However, there are still many OS patients whose tumors respond poorly to chemotherapy and who are at high risk of relapse and metastasis. These OS patients do not benefit from the advanced therapies and techniques and still die early. Furthermore, common chemotherapeutic agents are cytotoxic drugs and often cause nonspecific adverse reactions.6,7 Thus, the treatment of OS remains a challenging issue. Undoubtedly, a better understanding of the molecular mechanism of the tumorigenesis and development of OS will contribute to the finding of novel and effective therapeutic approaches for OS treatment.
It has been reported that various risk factors such as sex, age, genetic, and familial factors contribute to the progression of OS.8 As in other tumors, genetic factor plays a fundamental role in the progression of OS. Histone acetylation is a crucial determinant of gene expression, because acetylation and deacetylation of histones can change the chromatin structure by influencing the interaction of histone and DNA.4 Histone acetylation level, modulated by a dynamic balance between deacetylation by histone deacetylases (HDACs) and acetylation by histone acetyltransferases, decides the transcriptional status of chromatin.9 Deacetylated histones are often associated with cell growth, whereas hyperacetylated histones are generally associated with cell growth arrest, differentiation, and/or apoptosis.10 The abnormal recruitment of HDAC can inhibit transcription of specific genes such as tumor suppressor genes, thereby resulting in transcriptional regulation.11 HDAC inhibitors (HDACIs) have been demonstrated to have potent antiproliferative activity against a vast variety of cell lines, including those from breast cancer, ovary cancer, colon cancer, and lung cancer.12–15 Many studies have also reported that various HDACIs, including sodium butyrate (SB), valproic acid, and suberoylanilide hydroxamic acid, have significant anticancer activity in OS by inducing OS cell growth arrest, differentiation, and apoptosis.16,17 However, how they exert their effect on OS cells remains unclear. p53 is a tumor suppressor and is primarily regulated by the human oncoprotein MDM2 (the human homologue of the mouse double minute 2). MDM2 binds p53 to regulate its function by repressing p53-mediated transcriptional activity and promoting p53 degradation.18,19 Interestingly, p53 enhances MDM2 transcription by binding to p53-responsive elements located in the promoter region of MDM2, thereby forming an autoregulatory negative feedback loop, which is crucial to maintain the balance of p53 and MDM2.20 Numerous studies have documented that the MDM2–p53 feedback loop is impaired with MDM2 amplification or p53 mutation in various tumors, including OS.20,21 Recent studies have reported that HDACIs can inhibit the growth of some tumors by regulation of the MDM2–p53 feedback loop.22,23 Therefore, we hypothesize that HDACI may suppress OS by regulation of the MDM2–p53 feedback loop.
In the present study, the effects of HDACI SB on OS cell proliferation and apoptosis were investigated in vitro. The effects of SB on the expression levels of MDM2 and p53 proteins and the effects of MDM2 and p53 proteins on OS cell proliferation and apoptosis were also investigated. Furthermore, the animal experiments were performed to explore the anticancer activity of SB in vivo. These findings will offer new clues for OS development and progression and a novel potential therapeutic agent for OS treatment.
Materials and methods
Cell culture and transfection
Two human OS cell lines, U2OS and MG63, were obtained from the American Type Culture Collection (ATCC, Manassas, VA, USA) and cultured in Dulbecco’s Modified Eagle’s Medium (Thermo Fisher Scientific, Waltham, MA, USA) supplemented with 10% fetal bovine serum (Thermo Fisher Scientific), 5 μg of streptomycin/mL, 50 U of penicillin/mL, and 2 mM/L glutamine in a 5% CO2 humidified incubator at 37°C. SB was purchased from Sangon Biotech, Co., Ltd (Shanghai, People’s Republic of China) and dissolved in saline to make a stock concentration of 32 mM. This study was approved by the Second Affiliated Hospital of Guangzhou Medical University Institutional Review Board.
Cells were transfected with a plasmid containing either MDM2 small interfering (si-MDM2) or the wild-type p53 gene (Pp53) alone, or both (Pmp53), or neither (negative control [NC]), using the Lipofectamine 2000 reagent (Thermo Fisher Scientific), in accordance with manufacturer’s instructions.
Cell proliferation assay
The effect of SB on OS cell growth was assessed by the colorimetric 3-(4, 5-dimethylthiazol-2-yl)-2, 5-diphenyltetrazolium bromide (MTT) assay. Briefly, the cell suspensions of 2×10⁴ cells per well were seeded in 96-well plates in culture medium and incubated for 24 hours at 37°C, 5% CO2. The medium was replaced with fresh medium containing different concentrations of SB (0, 1, 4, 16, 64, and 256 μM), and incubated for 48 hours. Next, 20 μL MTT (5 mg/mL; Sigma-Aldrich, St Louis, MO, USA) was added to each well, followed by further incubation for 4 hours. Then, the culture medium was removed from each well and 150 μL dimethyl sulfoxide was added to dissolve the formazan crystals. The optical density was determined at 490 nm using a microplate reader. OS cells transfected with the si-MDM2, Pp53, Pmp53, or NC plasmids were also subjected to MTT assay to investigate the effects of MDM2 and p53 proteins on OS cell proliferation.
Cell apoptosis assay
Apoptosis was assessed using the PE Annexin V Apoptosis Detection Kit I (BD Biosciences, San Diego, CA, USA). Briefly, U2OS and MG63 cells in six-well plates were treated with SB (64 μM) for 48 hours, trypsinized, and washed twice with phosphate-buffered saline (PBS). Then the cells were stained with 5 μL PE Annexin V and 5 μL 7-aminoactinomycin D in 1× binding buffer for 10 minutes at 25°C in darkness. The stained cells were analyzed using a flow cytometer (BD Biosciences, San Jose, CA, USA) within 1 hour, and the data were analyzed using CellQuest software V 3.3 (BD Biosciences). OS cells transfected with the si-MDM2, Pp53, Pmp53, or NC plasmids were also subjected to flow cytometry to investigate the effects of MDM2 and p53 proteins on OS cell apoptosis.
Western blot analysis
Cells were washed with PBS, suspended in radioimmunoprecipitation assay lysis buffer (Beytime, Shanghai, People’s Republic of China) containing 60 μg/mL phenylmethylsulfonyl fluoride, and vortexed briefly. The suspension was collected after centrifugation at 15,000× g for 15 minutes at 4°C. Protein concentrations were quantified using the Pierce BCA Protein Assay Kit (Amersham, Little Chalfont, UK). Proteins were separated by sodium dodecyl sulfate–polyacrylamide gel electrophoresis in a 10% gel, transferred to a polyvinylidene fluoride membranes (Thermo Fisher Scientific), and probed sequentially with antibodies against the following proteins: Ki67 (GeneTex, Irvine, CA, USA), Bax (Abcam, Cambridge, UK), Bcl-2 (Abcam), MDM2 (Abcam), p53 (Abcam), and glyceraldehyde 3-phosphate dehydrogenase (GAPDH; Genetex). Peroxidase-conjugated anti-IgG secondary antibodies (Abcam) were used in Western blot assay. The blots were developed using the SuperSignal West Pico Chemiluminescent Substrate Kit (Thermo Fisher Scientific).
Animal experiments
The animal experiments were approved by the Institutional Animal Care and Use Committee at The Second Affiliated Hospital Of Guangzhou Medical University. All animal experiments followed the guidelines of the China Association of Laboratory Animal Care. Seven-week-old adult male athymic nude mice (Vital River Animal Ltd., Beijing, People’s Republic of China) were housed in standard cages with food and water provided ad libitum. U2OS cells (2×10⁶ cells in 200 μL PBS) were injected subcutaneously into the right flank of nude mice. When tumor volume reached 100 mm3 ~15 days after injection of U2OS cells, treatment was initiated. SB (50 mg/kg) was dissolved in saline, and saline was used as a vehicle control, with the dose selection performed according to the paper published by Wu et al16 SB and vehicle were intraperitoneally injected into nude mice daily for 4 weeks. Tumor sizes were measured weekly using a vernier caliper, and tumor volume was calculated using the formula: tumor volume = length × width2/2. After 4 weeks, mice were euthanized, and tumors were then photographed and weighed. Moreover, the expression levels of Ki67, Bax, Bcl-2, MDM2, and p53 proteins in xenografts were detected by Western blot analysis. In addition, during the treatment phase, the mice were monitored for any signs of toxicity, including lack of activity and body weight loss (measured twice per week).
Statistical analysis
SPSS 10.0 (SPSS Inc., Chicago, IL, USA) was used for all statistical analyses. Data are expressed as mean ± standard deviation. Student’s t-tests were performed to analyze the differences between two groups. Statistically significant differences were defined as *P<0.05, **P<0.01, and ***P<0.001.
Results
SB represses OS cell proliferation in vitro
To investigate whether HDACI SB affects the growth of OS cells, U2OS and MG63 cells were exposed to increasing concentrations of SB (0–256 μM) for 48 hours, and MTT assay was performed to assess the effect of SB on OS cell proliferation. As shown in Figure 1A and C, the absorbance of both U2OS and MG63 cells decreases with the increasing concentration of SB, which indicated that SB suppressed OS cell proliferation in a concentration-dependent manner in vitro. In addition, Western blot analysis was performed to detect the expression of proliferation-related protein Ki67. We found that the expression level of Ki67 in U2OS and MG63 cells treated by 64 μM SB markedly decreased compared with that in vehicle-treated cells, which also indicated that SB suppresses OS cell proliferation (Figure 1B and D).
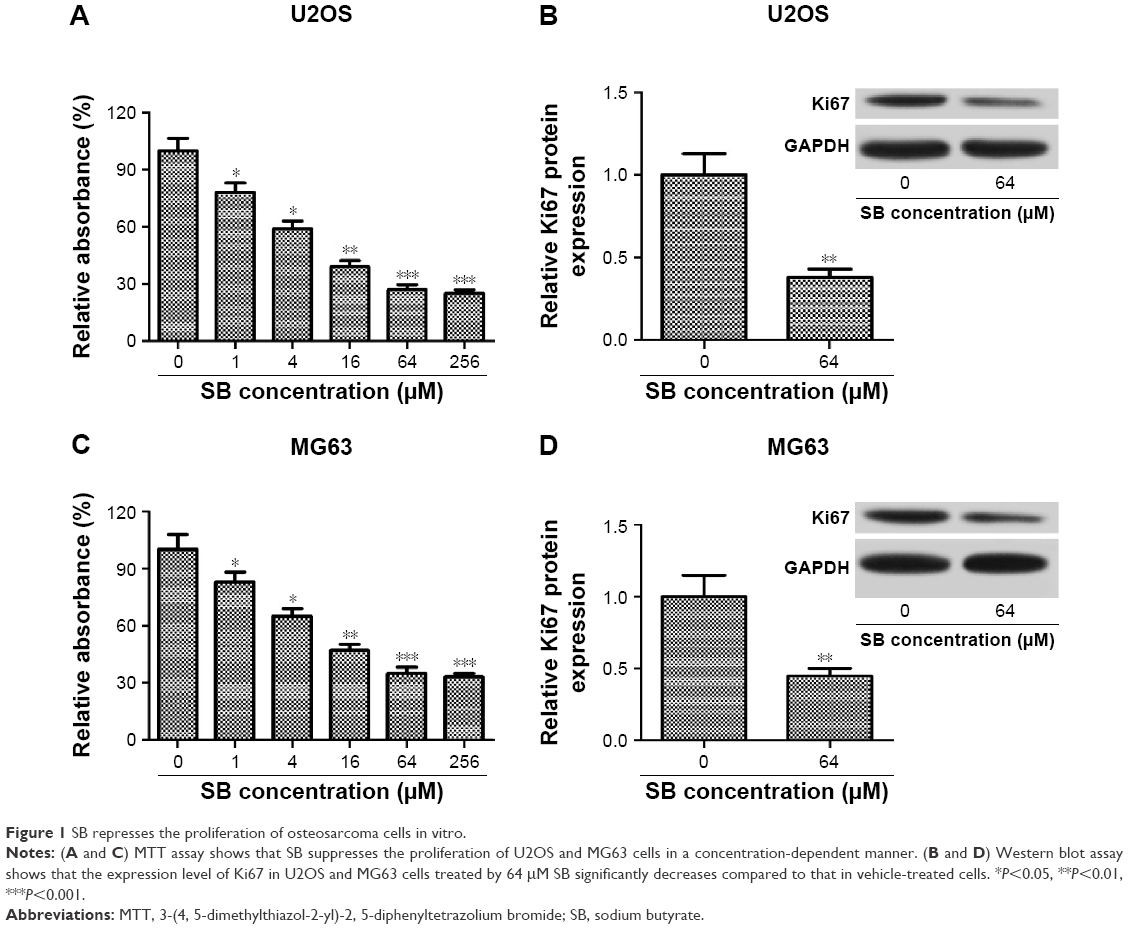 | Figure 1 SB represses the proliferation of osteosarcoma cells in vitro. |
SB promotes OS cell apoptosis in vitro
We performed the flow cytometry assay to evaluate the effect of SB on apoptosis of OS cells. The results demonstrated that U2OS and MG63 cells treated by 64 μM SB had considerably higher apoptosis rates than the vehicle-treated cells (Figure 2A and C). In addition, the expression levels of apoptosis-related proteins Bcl-2 and Bax were determined by Western blot analysis. As shown in Figure 2B and D, U2OS and MG63 cells treated by 64 μM SB both had a lower expression level of Bcl-2 protein and a higher expression level of Bax protein than vehicle-treated cells. These results indicated that SB promotes OS cell apoptosis in vitro.
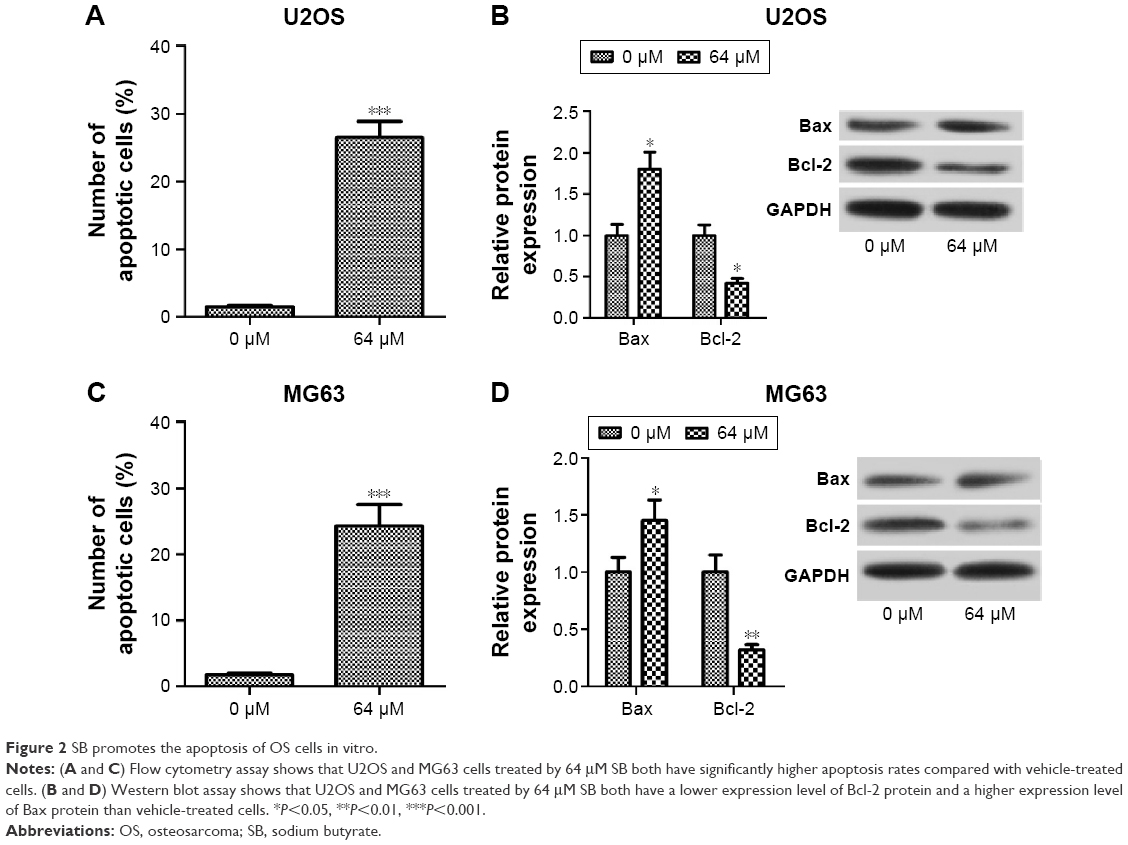 | Figure 2 SB promotes the apoptosis of OS cells in vitro. |
SB regulates the MDM2–p53 signaling in vitro
To investigate whether SB regulates the MDM2–p53 signaling, Western blot assay was performed to determine the expression of oncoprotein MDM2 and tumor suppressor p53 in SB-treated OS cells and vehicle-treated cells. As demonstrated in Figure 3A and B, both U2OS and MG63 cells treated with 64 μM SB had significantly decreased MDM2 expression and markedly increased p53 expression compared with the vehicle-treated cells, which indicated that SB could regulate the MDM2–p53 signaling.
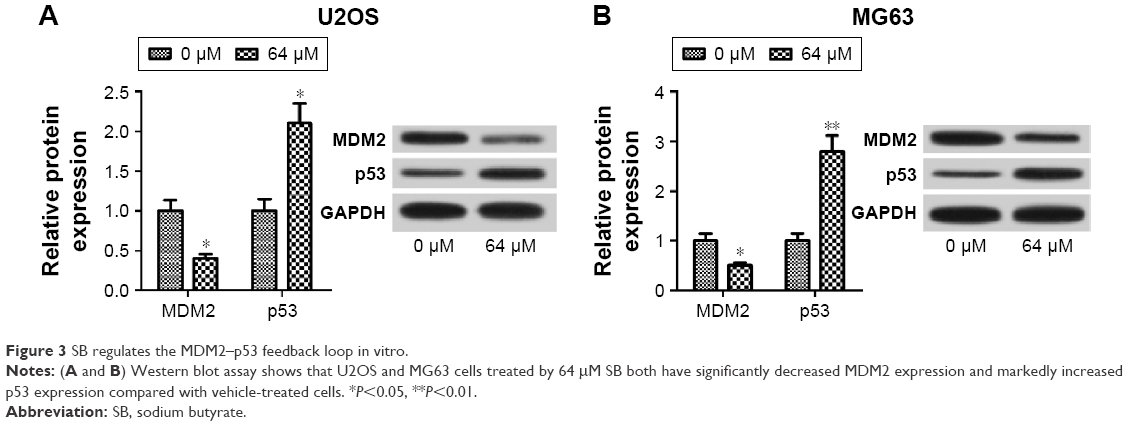 | Figure 3 SB regulates the MDM2–p53 feedback loop in vitro. |
MDM2–p53 signaling regulates OS cell proliferation and apoptosis in vitro
To investigate whether SB suppresses proliferation and promotes apoptosis in OS cells by regulation of the MDM2–p53 signaling, we transfected U2OS and MG63 cells with si-MDM2, Pp53, Pmp53, or NC plasmids, respectively, and then performed MTT and flow cytometer assays. Results demonstrated that compared with the control group, the Pmp53 group showed the most significant inhibition of cell growth and increase in apoptosis, followed by the si-MDM2 and Pp53 groups (Figure 4A–D). In addition, Western blot assay showed that, compared with the control groups, U2OS and MG63 cells transfected with the Pmp53 plasmid had the lowest expression levels of Ki67 and Bcl-2 proteins and the highest expression level of Bax protein, followed by the cells transfected with si-MDM2 and Pp53 (Figure 4E and F). These results indicated that the MDM2–p53 signaling can regulate OS cell proliferation and apoptosis in vitro and that the functional effect of SB on OS cell lines, at least in part, depends on the MDM2–p53 signaling.
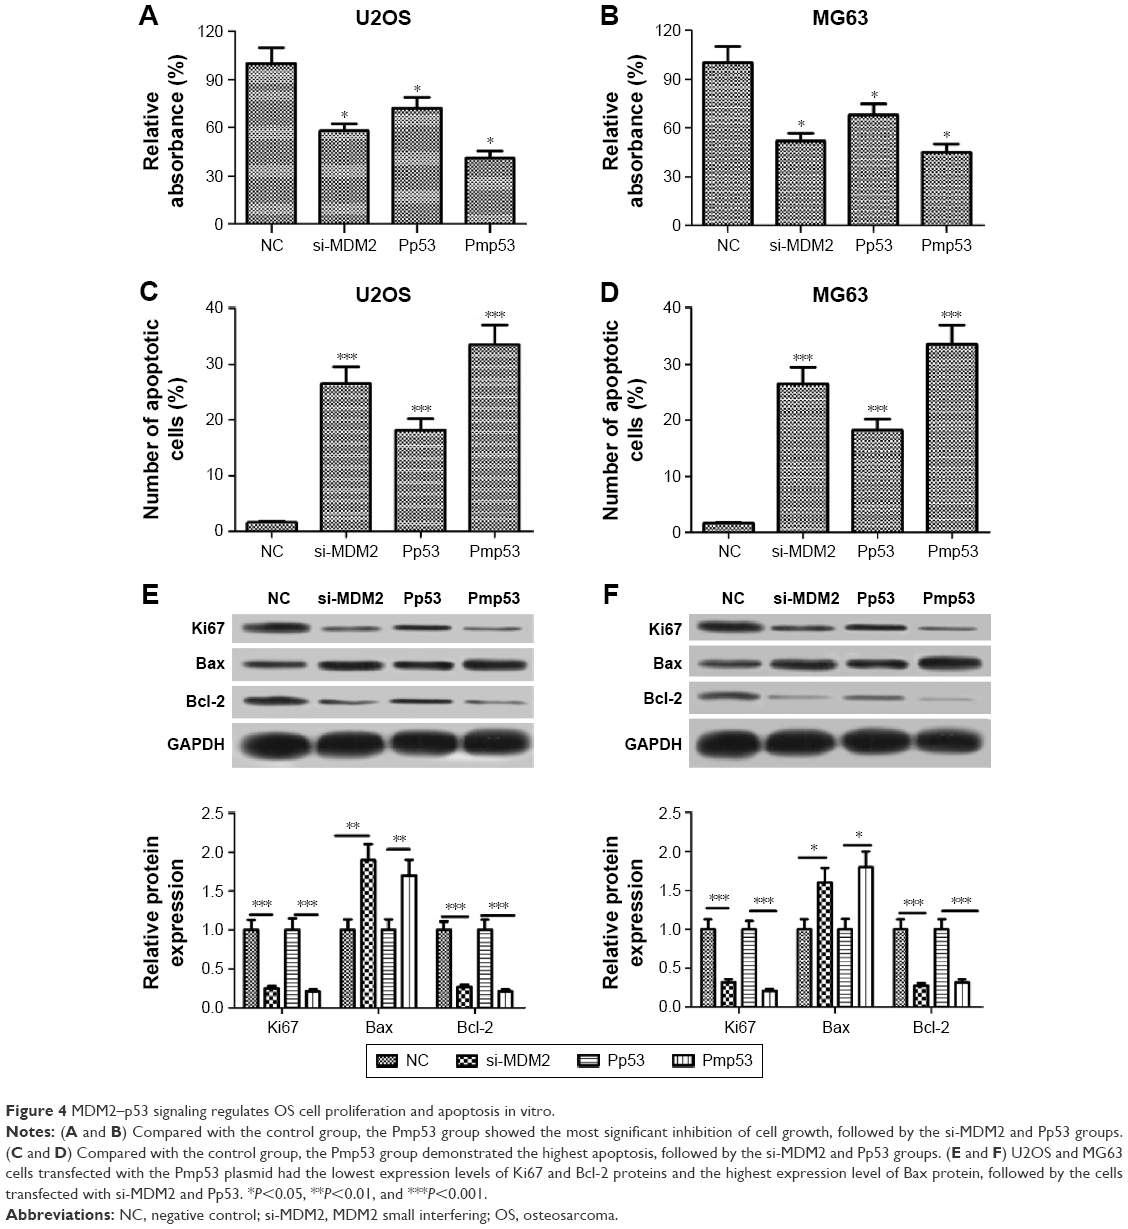 | Figure 4 MDM2–p53 signaling regulates OS cell proliferation and apoptosis in vitro. |
In vivo antitumor effects of SB on OS cells
Our in vitro studies indicated that SB suppresses proliferation and promotes apoptosis in OS cells, at least in part, by regulation of the MDM2–p53 signaling. We further investigated the effect of SB on OS cells in vivo. U2OS cells (2×10⁶ cells) were subcutaneously injected into the right flank of nude mice. When tumor volume reached 100 mm3, SB treatment was initiated. We measured the tumor volume weekly and found that the tumor growth in the treatment group was markedly slow compared with that in the control group (Figure 5A). After 4 weeks treatment, the tested mice were sacrificed. Tumors were isolated, photographed, and weighed. Accordingly, the tumor size and weight in the treatment group were significantly smaller than that in the control group (Figure 5B and C), while in activity or body weight, no significant differences were detected between treatment group and control group (data not shown). In addition, we detected the expression of Ki67, Bax, Bcl-2, MDM2, and p53 proteins in xenografts by Western blot assay. As shown in Figure 5D, the treatment group had significantly increased Bax and p53 expression and markedly decreased in Ki67, Bcl-2, and MDM2 expression compared with the control group. Collectively, these data indicated that SB suppressed the growth of OS cells by regulating the MDM2–p53 signaling pathway in vivo.
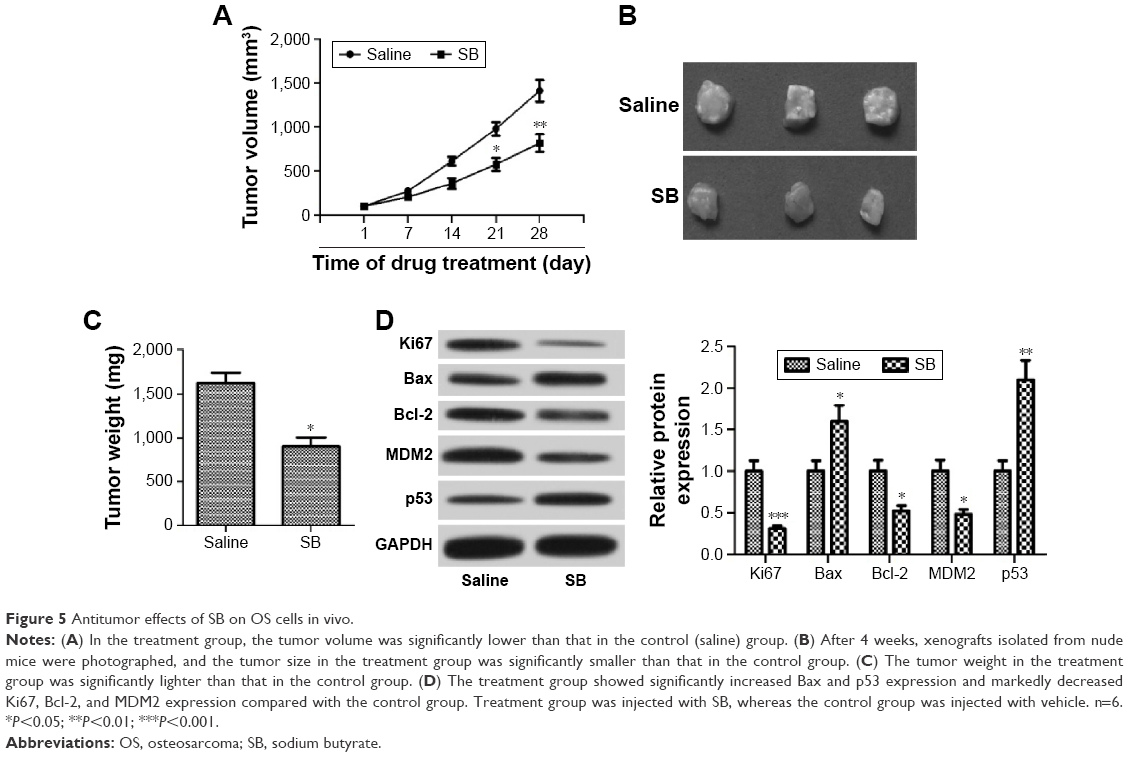 | Figure 5 Antitumor effects of SB on OS cells in vivo. |
Discussion
OS is the most frequently occurring primary malignant bone tumor in children and adolescents. HDACIs are emerging anticancer agents against various cancers that alter the acetylation profile of histone and nonhistone proteins in tumor cells causing gene expression changes, thereby inducing cell growth arrest, differentiation, and apoptosis.10 With the US Food and Drug Administration (USFDA) approval of HDACI vorinostat and romidepsin for T-cell lymphoma treatment in 2006 and 2009, respectively, many other HDACIs including SB have been recently evaluated in cancer clinical trials.24 SB, a four-carbon fatty acid, is found abundantly in milk fat, and is also produced by microbial fermentation of dietary fiber. Many studies have also reported that various HDACIs, including SB, have significant antiproliferation and proapoptosis activities on OS cells.16,17 However, the molecular mechanisms by which HDACIs exert these activities on OS cells are not clear. Therefore, in this study, we chose HDACI SB as our test material to evaluate the effect of SB on OS cells in vitro and in vivo and investigated the potential mechanisms by which SB exerts regulatory effects on OS cells. We first determined the effect of SB on the proliferation and apoptosis of U2OS and MG63 cells in vitro by MTT and flow cytometry assays, respectively. The results showed that SB suppressed the proliferation of U2OS and MG63 cells in a concentration-dependent manner and promoted apoptosis. Consistent results have been reported by Wu et al.16 Then, we explored the potential mechanisms by which SB exerts regulatory effects on OS cell proliferation and apoptosis.
Malignant transformation of cells is ascribed to a series of genetic and epigenetic events involving changes in several tumor-suppressor genes, oncogenes, or microRNAs.25 Tumor suppressor gene inactivation and oncogene activation are the most widely studied mechanisms for carcinogenesis and cancer progression. p53 is a tumor suppressor, and high level of p53 activity induces cell growth arrest, apoptosis, and senescence.26 The tumor suppression function of p53 is well reflected by the fact that ~50% of human tumors possess mutations in the p53 gene.27 For instance, p53 mutation promotes mammary tumorigenesis; mutant p53 prolongs nuclear factor-κB (NF-κB) activation and promotes chronic inflammation and inflammation-associated colorectal cancer; and mutant p53 drives pancreatic cancer metastasis through cell-autonomous platelet-derived growth factor receptor β signaling.28–30 MDM2 is an oncoprotein containing an ubiquitin E3 ligase, and gene amplification and overexpression of MDM2 are observed in more than 17% of human tumors.31 The MDM2 small-molecule inhibitor RG7388 leads to potent tumor inhibition in neuroblastoma; nutlin-3, a small-molecule MDM2 inhibitor, sensitizes Caki cells to tumor necrosis factor-related apoptosis-inducing ligand-induced apoptosis; and a small-molecule MDM2 inhibitor, AMG 232, is widely used for treating cancer.32–34 MDM2 and p53 form a autoregulatory negative feedback loop in which MDM2 promotes p53 degradation and quenches p53 cellular activity, which in turn induces the expression of MDM2.35 The MDM2–p53 feedback loop is impaired by p53 mutation or MDM2 amplification in many types of tumors, including OS which leads to poor prognosis and treatment failure in cancer patients.20,21,36 Therefore, the MDM2–p53 interaction seems to be an important target for cancer therapy and has indeed become a hotspot of research in academia and industry to develop more effective targeted cancer therapeutics. Palani et al23 reported that HDACIs enhance the anticancer activity of nutlin-3 and induce p53 hyperacetylation and downregulation of MDM2 and MDM4 gene expression. Ou et al22 reported that HDACI inhibits liposarcoma via targeting of the MDM2–p53 signaling axis. Based on these findings, we speculate that SB may suppress OS by regulation of the MDM2–p53 feedback loop. The results showed that SB indeed can regulate the MDM2–p53 feedback loop and that functional effect of SB on OS cell lines, at least in part, depends on MDM2–p53 signaling. We also explored the effect of SB on OS cells in vivo and found that SB suppresses the growth of OS cells with no noticeable effect on activity and body weight of mice in vivo. In addition, HDACIs were widely reported through suppression of multiple pathways including hypoxia-inducible factor, NFkB, and mammalian target of rapamycin signaling to repress tumor formation and the growth of tumor cells. Therefore, SB, as a common HDACI, might have the other possible mechanism of suppressing the growth of OS cells.
Conclusion
SB represses OS cell proliferation and promotes apoptosis in vitro. We demonstrated that the functional effect of SB on OS cell lines, at least in part, depends on the MDM2–p53 signaling. Animal experiments have confirmed that SB suppresses the growth of OS cells with no noticeable effect on activity and body weight of mice in vivo. These findings indicate that SB is a potent targeting agent for OS treatment.
Disclosure
The authors report no conflicts of interest in this work.
References
Kundu ZS. Classification, imaging, biopsy and staging of osteosarcoma. Indian J Orthop. 2014;48(3):238–246. | ||
Mirabello L, Troisi RJ, Savage SA. Osteosarcoma incidence and survival rates from 1973 to 2004. Cancer. 2009;115(7):1531–1543. | ||
Aung L, Tin AS, Quah TC, Pho RW. Osteogenic sarcoma in children and young adults. Ann Acad Med Singapore. 2014;43(6):305–313. | ||
Zhao L, Zhang J, Tan H, et al. Gene function analysis in osteosarcoma based on microarray gene expression profiling. Int J Clin Exp Med. 2015;8(7):10401–10410. | ||
Anninga JK, Gelderblom H, Fiocco M, et al. Chemotherapeutic adjuvant treatment for osteosarcoma: where do we stand? Eur J Cancer. 2011;47(16):2431–2145. | ||
Clark JC, Dass CR, Choong PF. A review of clinical and molecular prognostic factors in osteosarcoma. J Cancer Res Clin Oncol. 2008;134(3):281–297. | ||
Meyers PA, Schwartz CL, Krailo M, et al. Osteosarcoma: a randomized, prospective trial of the addition of ifosfamide and/or muramyl tripeptide to cisplatin, doxorubicin, and high-dose methotrexate. J Clin Oncol. 2005;23(9):2004–2011. | ||
Wolffe AP, Guschin D. Review: chromatin structural features and targets that regulate transcription. J Struct Biol. 2000;129(2):102–122. | ||
Ghizzoni M, Haisma HJ, Maarsingh H, Dekker FJ. Histone acetyltransferases are crucial regulators in NF-κB mediated inflammation. Drug Discov Today. 2011;16(11):504–511. | ||
Marks PA, Rifkind RA, Richon VM, Breslow R, Miller T, Kelly WK. Histone deacetylases and cancer: causes and therapies. Nat Rev Cancer. 2001;1(3):194–202. | ||
Marks PA, Richon VM, Breslow R, Rifkind RA. Histone deacetylase inhibitors as new cancer drugs. Curr Opin Oncol. 2001;13(6):477–483. | ||
Kleer CG, Cao Q, Varambally S, et al. EZH2 is a marker of aggressive breast cancer and promotes neoplastic transformation of breast epithelial cells. Proc Natl Acad Sci U S A. 2003;100(20):11606–11611. | ||
Takai N, Kawamata N, Gui D, Said JW, Miyakawa I, Koeffler HP. Human ovarian carcinoma cells: histone deacetylase inhibitors exhibit antiproliferative activity and potently induce apoptosis. Cancer. 2004;101(12):2760–2770. | ||
Krishnan M, Singh A, Smith J, et al. HDAC inhibitors regulate claudin-1 expression in colon cancer cells through modulation of mRNA stability. Oncogene. 2010;29(2):305–312. | ||
Komatsu N, Kawamata N, Takeuchi S, et al. SAHA, a HDAC inhibitor, has profound anti-growth activity against non-small cell lung cancer cells. Oncol Rep. 2006;15(1):187–191. | ||
Wu Z, Ma C, Shan Z, Ju Y, Li S, Zhao Q. Histone deacetylase inhibitors suppress the growth of human osteosarcomas in vitro and in vivo. J BUON. 2013;18:1032–1037. | ||
Wang CK, Yu XD, Li Q, Xie G, Teng Y. Chloroquine and valproic acid combined treatment in vitro has enhanced cytotoxicity in an osteosarcoma cell line. Asian Pac J Cancer Prev. 2013;14(8):4651–4654. | ||
Chen J, Lin J, Levine AJ. Regulation of transcription functions of the p53 tumor suppressor by the mdm-2 oncogene. Mol Med. 1995;1(2):142. | ||
Haupt Y, Maya R, Kazaz A, Oren M. Mdm2 promotes the rapid degradation of p53. Nature. 1997;387(6630):296–299. | ||
Meng X, Franklin DA, Dong J, Zhang Y. MDM2–p53 pathway in hepatocellular carcinoma. Cancer Res. 2014;74(24):7161–7167. | ||
Ladanyi M, Cha C, Lewis R, Jhanwar SC, Huvos AG, Healey JH. MDM2 gene amplification in metastatic osteosarcoma. Cancer Res. 1993;53(1):16–18. | ||
Ou W-b, Li H, Liu L, et al. HDACi inhibits liposarcoma via targeting of the MDM2-p53 signaling axis and PTEN, irrespective of p53 mutational status. Cancer Res. 2014;74(19 Supplement):5136. | ||
Palani CD, Beck JF, Sonnemann J. Histone deacetylase inhibitors enhance the anticancer activity of nutlin-3 and induce p53 hyperacetylation and downregulation of MDM2 and MDM4 gene expression. Invest New Drugs. 2012;30(1):25–36. | ||
Blum KA, Advani A, Fernandez L, et al. Phase II study of the histone deacetylase inhibitor MGCD0103 in patients with previously treated chronic lymphocytic leukaemia. Br J Haematol. 2009;147(4):507–514. | ||
Croce CM. Oncogenes and cancer. N Engl J Med. 2008;358(5):502–511. | ||
Lane DP. Cancer p53, guardian of the genome. Nature. 1992;358(6381):15–16. | ||
Hollstein M, Sidransky D, Vogelstein B, Harris CC. p53 mutations in human cancers. Science. 1991;253(5015):49–53. | ||
Lu X, Liu D P, Xu Y. The gain of function of p53 cancer mutant in promoting mammary tumorigenesis. Oncogene. 2013;32(23):2900–2906. | ||
Cooks T, Pateras IS, Tarcic O, et al. Mutant p53 prolongs NF-κB activation and promotes chronic inflammation and inflammation-associated colorectal cancer. Cancer Cell. 2013;23(5):634–646. | ||
Weissmueller S, Manchado E, Saborowski M, et al. Mutant p53 drives pancreatic cancer metastasis through cell-autonomous PDGF receptor β signaling. Cell. 2014;157(2):382–394. | ||
Momand J, Jung D, Wilczynski S, Niland J. The MDM2 gene amplification database. Nucleic Acids Res. 1998;26(15):3453–3459. | ||
Lakoma A, Barbieri E, Agarwal S, et al. The MDM2 small-molecule inhibitor RG7388 leads to potent tumor inhibition in p53 wild-type neuroblastoma. Cell Death Discov. 2015;1. pii:15026. | ||
Park EJ, Choi KS, Yoo YH, et al. Nutlin-3, a small-molecule MDM2 inhibitor, sensitizes Caki cells to TRAIL-induced apoptosis through p53-mediated PUMA upregulation and ROS-mediated DR5 upregulation. Anticancer Drug. 2013;24(3):260–269. | ||
Rew Y, Sun D. Discovery of a small molecule MDM2 inhibitor (AMG 232) for treating cancer. J Med Chem. 2014;57(15):6332–6341. | ||
Moll UM, Petrenko O. The MDM2-p53 interaction. Mol Cancer Res. 2003;1(14):1001–1008. | ||
Zhang R, Wang H. MDM2 oncogene as a novel target for human cancer therapy. Curr Pharm Des. 2000;6(4):393–416. |
 © 2016 The Author(s). This work is published and licensed by Dove Medical Press Limited. The full terms of this license are available at https://www.dovepress.com/terms.php and incorporate the Creative Commons Attribution - Non Commercial (unported, v3.0) License.
By accessing the work you hereby accept the Terms. Non-commercial uses of the work are permitted without any further permission from Dove Medical Press Limited, provided the work is properly attributed. For permission for commercial use of this work, please see paragraphs 4.2 and 5 of our Terms.
© 2016 The Author(s). This work is published and licensed by Dove Medical Press Limited. The full terms of this license are available at https://www.dovepress.com/terms.php and incorporate the Creative Commons Attribution - Non Commercial (unported, v3.0) License.
By accessing the work you hereby accept the Terms. Non-commercial uses of the work are permitted without any further permission from Dove Medical Press Limited, provided the work is properly attributed. For permission for commercial use of this work, please see paragraphs 4.2 and 5 of our Terms.