Back to Journals » Cancer Management and Research » Volume 13
Histogram Analysis of Diffusion-Weighted Magnetic Resonance Imaging as a Biomarker to Predict Lymph Node Metastasis in T3 Stage Rectal Carcinoma
Authors Li J, Zhou Y ![]() , Wang X, Yu Y
, Wang X, Yu Y ![]() , Zhou X, Luan K
, Zhou X, Luan K
Received 25 December 2020
Accepted for publication 3 March 2021
Published 1 April 2021 Volume 2021:13 Pages 2983—2993
DOI https://doi.org/10.2147/CMAR.S298907
Checked for plagiarism Yes
Review by Single anonymous peer review
Peer reviewer comments 2
Editor who approved publication: Dr Xueqiong Zhu
Jin Li,1,* Yang Zhou,1,2,* Xinxin Wang,2 Yanyan Yu,2 Xueyan Zhou,3 Kuan Luan1
1College of Intelligent Systems Science and Engineering, Harbin Engineering University, Harbin, 150001, Heilongjiang Province, People’s Republic of China; 2Department of Radiology, Harbin Medical University Cancer Hospital, Harbin, 150001, Heilongjiang Province, People’s Republic of China; 3School of Technology, Harbin University, Harbin, 150001, Heilongjiang Province, People’s Republic of China
*These authors contributed equally to this work
Correspondence: Kuan Luan
College of Intelligent Systems Science and Engineering, Harbin Engineering University, Harbin, 150001, Heilongjiang Province, People’s Republic of China
Email [email protected]
Purpose: This study investigated the predictive value of apparent diffusion coefficient (ADC) histogram parameters of the primary tumor for regional lymph node metastasis (LNM) in pathological T3 stage rectal cancer.
Patients and Methods: We retrospectively studied 175 patients with T3 stage rectal cancer who underwent preoperative MRI, including diffusion-weighted imaging, between January 2015 and October 2017. Based on pathological analysis of surgical specimens, 113 patients were classified into the LN− group and 62 in the LN+ group. We analyzed clinical data, radiological characteristics and histogram parameters derived from ADC maps. Then, receiver operating characteristic curve (ROC) analyses were generated to determine the best diagnostic performance.
Results: The mean (p=0.002, cutoff=1.08× 10– 3 s/mm2), coefficient of variation (CV) (p=0.040, cutoff=0.249) of the ADC map, carbohydrate antigen 199, and N stage with magnetic resonance (mrN stage) were independent factors for LNM. Combining these factors yielded the best diagnostic performance, with the area under the ROC curve of 0.838, 72.9% sensitivity, 79.1% specificity, 65.2% positive predictive value, and 84.5% negative predictive value.
Conclusion: With the mean > 1.08× 10– 3 s/mm2 and CV < 0.249, the ADC improved the diagnostic performance of LNM in T3 stage rectal cancer, which could assist surgeons with neoadjuvant chemoradiotherapy.
Keywords: diffusion-weighted magnetic resonance imaging, rectal cancer, lymph node metastasis, histogram analysis
Introduction
Preoperative assessment of rectal cancer mainly relies on magnetic resonance imaging (MRI). At present, the diagnostic ability of T staging, mesorectal fascia (MRF) invasion and extramural vascular invasion (EMVI) are widely recognized clinically and can be used as an important basis for the diagnosis and treatment of rectal cancer.1 However, preoperative assessment of N staging that relies on MR criteria is not optimistic,2 despite lymph node metastasis (LNM) being an important risk factor for disease-free survival and local recurrence.3 The European Society for Medical Oncology (ESMO) guidelines4 recommend that low-risk patients with T3N0 do not need preoperative neoadjuvant chemoradiotherapy (nCRT) and only need treatment with total mesorectal excision (TME). In contrast, for most patients with T3N1-2 cancer, preoperative nCRT is required to achieve the goal of tumor downstaging and to reduce the risk of postoperative recurrence.5 Therefore, accurate judgment for N staging of patients with T3 rectal cancer can guide clinical treatment decisions.
The imaging evaluation of LN status has mainly been based on the evaluation of the LNs and the prediction of primary lesions.6,7 However, the evaluation method with LNs as the target lesions has the limitation of consistency between the imaging technique and pathological sampling. Mizukami et al8 evaluated LN status with high signal intensity detected on diffusion-weighted imaging (DWI), which was confirmed on T1-weighted imaging (T1WI) and T2-weighted imaging (T2WI), and the diagnostic accuracy was up to 84%. However, this method had a high false-negative rate, and the negative predictive value (NPV) was as high as 99% which would lead to low N staging. The primary reason may be that it is difficult to evaluate the invisible LNs in images, which are the main cause of postoperative recurrence and cannot be ignored.9 Another method based on primary lesions for predicting LN status has also attracted much attention in recent years, although this kind of research is less prevalent. By delineating lesions on DWI and T2WI and calculating lesion volume, Chen et al10 obtained a high area under the curve (AUC) (91.1–93.4%) to predict N staging, and indicated that there was an inevitable link between primary lesions and LN status, which can avoid low N staging. However, no subgroup analysis of T staging has been reported in the literature.
In this study, DWI of primary rectal lesions was used for quantitative analysis to improve the predictive ability of LNM of T3 rectal cancer, to provide clinicians with more reliable and accurate preoperative N staging diagnosis, and assist in clinical treatment.
Patients and Methods
Patients
We conducted a retrospective analysis of 710 consecutive patients diagnosed with rectal cancer who received TME between January 2015 and May 2017. This retrospective study was approved by the Institutional Review Board at our institution and the informed consent requirement was waved and no personal information was disclosed. We selected preoperative MR images and postoperative pathological records. Inclusion criteria were: (1) patients with pathologically confirmed T3Nx stage rectal cancer; and (2) patients scheduled to undergo surgery within 2 weeks after MRI. Exclusion criteria were: (1) patients with special histological types confirmed by surgical pathology, such as mucinous adenocarcinoma, or neuroendocrine tumors (n=41); (2) patients who received previous treatment such as nCRT before MRI or surgery (n=414); (3) patients who proceeded to MRI without DWI (n=50); and (4) poor imaging quality or images with motion or susceptibility artefacts (n=30) (Figure 1). Clinical data, including patients’ age, height, weight and history of smoking and alcohol consumption were obtained by reviewing the medical records. Tumor marker information was obtained from laboratory-based tests of each patient. The study assessed the expression status of carcinoma embryonic antigen (CEA), carbohydrate antigen (CA) 199, CA724, and α-fetoprotein (AFP), according to practical guidelines for the use of tumor markers11,12 (Figure 1).
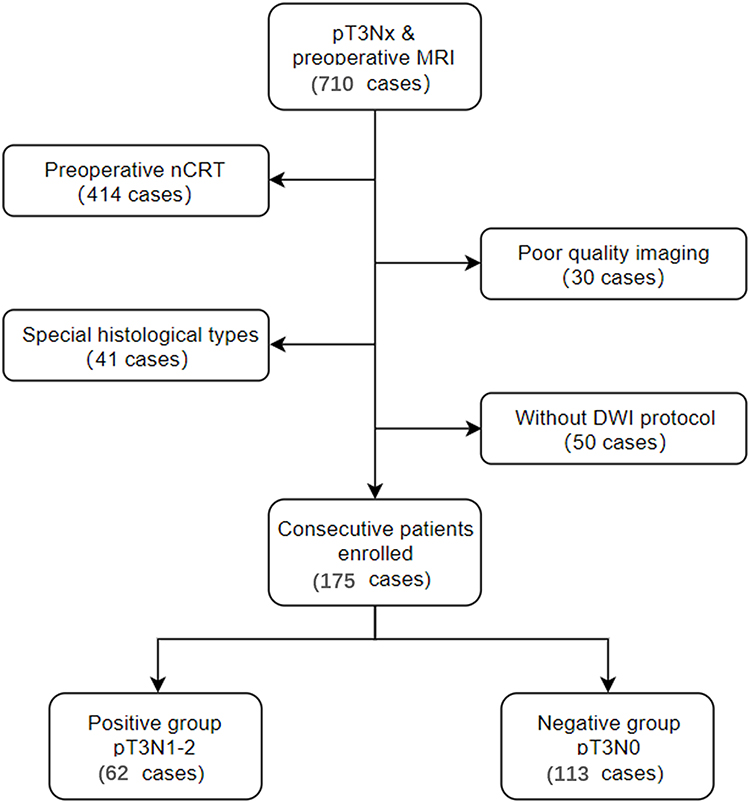 |
Figure 1 Flow chart of inclusion and exclusion criteria of the study sample. |
High-Resolution Rectal MRI Parameters
All patients underwent rectal MRI before surgery using 3.0T MR (Achieva; Philips, Eindhoven, Netherlands), with a 16-channel torso array coil. An MR sagittal T2W scan sequence was obtained with the following parameters: TR/TE = 3000 ms/100 ms; number of signal frequency (NSA) = 2; layer thickness = 3 mm; layer spacing = 0.4 mm; field of view = 240×240 mm. The position of rectal lesions was determined in the sagittal position, which was perpendicular to intestinal canal lesions, with a transverse T2W scan: TR = 3824 ms; TE = 110 ms; NSA = 3; layer thickness = 3.5 mm; and interval = 0.2 mm. According to the sagittal lesion position, patients with parallel pathological changes received a coronal T2W scan: TR = 3824 ms; TE = 110 ms; NSA = 3; layer thickness = 3.0 mm; and layer spacing = 0.2 mm.
MRI Qualitative Assessment
All the images were sent to RIS/PACS (GE Healthcare Centricity, USA). The MR images (original images) were reviewed on medical displays by two abdominal radiologists (R1 with 5-years’ and R2 with 8-years’ rectal cancer MRI diagnostic experience) who were informed of the diagnosis of T3 stage rectal cancer. Information about the rectal lesions on T2W images was recorded in the structural report, including the following. (1) Lesion thickness and length: measured on the maximum T2WI slices. (2) Lesion location: categorized as low (0–5 cm from the anal verge); middle (5.1–10 cm from the anal verge); and high (10.1–15 cm from the anal verge). (3) mrT3 stage: classified into four categories dependent on the distance between the outermost edge of the muscularis propria and the maximum extramural spread of the tumor (mrT3a, <1 mm; mrT3b, 1–5 mm; mrT3c, 5–15 mm; and mrT4d, >15 mm).13 (4) mrN stage: including size and morphological characteristics of malignancy on T2WI, including the presence of irregular borders, heterogeneous signal intensity, and round shape;14 mrN0 is no regional LNM; mrN1 is metastasis in 1–3 regional LNs; mrN2 is metastasis in ≥4 regional LNs.15 (5) EMVI: EMVI is an extension of the tumor to the vessels in the mesorectum, resulting in wall irregularity, focal enlargement, and/or signal intensity of the tumor within the vessel.13 (6) MRF: obtain by measuring the shortest distance between the outermost part of the rectal cancer and the MRF and potentially positive if this measurement is < 1 mm.13 If the opinions of the radiologists differed, any disagreement was resolved by consensus.
Quantitative Analysis
Tumors identified on T2W images as areas of slight high-signal-intensity corresponded to high-signal-intensity areas on DW images. The DW images were evaluated by a radiologist with 5 years’ rectal diagnostic experience (R3) using the software tool Python (v. 2.7, embedded within Mevislab), while the senior radiologist (R2) examined the results. The radiologist was aware of the diagnosis of rectal cancer but was blind to the clinical and pathologic details. The regions of interest (ROIs) were outlined directly along the margin of the whole tumor on the maximum cross-section of the DW images, excluding the intraluminal gas, obvious necrosis and cystic areas using the T2WI sequence as a reference standard. Then, confirming after copying the delineated ROIs on the corresponding apparent diffusion coefficient (ADC) map (Figure 2). The ADC histogram was automatically produced and involved the following parameters: mean, skewness, kurtosis, mode and coefficient of variation (CV). The cumulative frequency distributions (5th, 10th, 25th, 75th, 90th and 95th percentiles) were derived from the curve formed by the histogram x-axis (representing ADC map values) and y-axis (representing number of pixels).
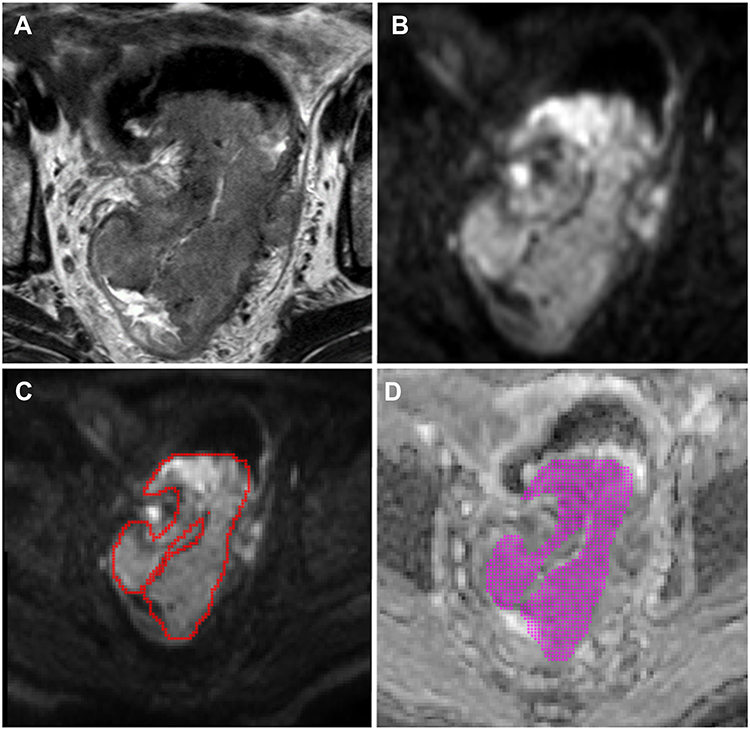 |
Figure 2 An example of manual segmentation of primary tumor on rectal cancer magnetic resonance imaging. (A) Maximum cross-section of primary tumor on T2-weighted (T2W) image in a T3 stage rectal cancer patient. (B) Maximum cross-section of primary tumor on diffusion-weighted (DW) image in the same patient. (C) Regions of interest were outlined directly along the margin of the whole tumor on maximum cross-section of the DW images, excluding the intraluminal gas, obvious necrosis and cystic areas using T2W imaging sequence as a reference standard (red region). (D) Copy of delineated area on the corresponding apparent diffusion coefficient map (magenta region). |
Histological Analysis
Histopathological assessment of LN malignancy is the gold standard. Pathological reports of surgically resected specimens contained the standard data set according to the eighth edition of the American Joint Committee on Cancer TNM staging system. The degree of differentiation, depth of infiltration, and LNM (pathological N stage, pN) were retrospectively collected. According to the pathological data, patients were grouped as LN− (pN0) and LN+ (pN1–2).
Statistical Analysis
Statistical analyses were performed using MedCalc version 11.2. The receiver operating characteristic (ROC) curves of histogram parameters were drawn, and AUCs were calculated. The best cut-off values for maximizing sensitivity and specificity were identified from ROC curve analysis. According to cutoff value, we divided every histogram parameter into greater and lower groups as categorical variables. Quantitative data were compared using independent t test or the Mann–Whitney U-test. Normally distributed quantitative data were expressed as means ± standard deviation. Abnormally distributed quantitative data were expressed as median (interquartile range). Categorical variables were compared between the LN− and LN+ groups using the Chi-square test and were expressed as numbers (percentage). Univariate and multivariate logistic regression analyses were performed to identify features with predictive values. The sensitivity, specificity, positive predictive value (PPV) and NPV, and AUCs of the radiomics model and independent predictive factors model were determined using ROC curve analysis. The AUCs were compared using the Delong test: p<0.05 was considered to be statistically significant.
Results
Clinical Characteristics
A total of 175 patients were enrolled in this study, including 113 men (age 36–84 years, mean 60.6 years; height 150–185 cm, mean 169.3 cm; weight 48–140 kg, mean 68.3 kg) and 62 women (age 31–82 years, mean 61.6 years; height 150–178 cm, mean 162.3 cm; weight 40–83 kg, mean 60.9 kg). The clinical data in the LN− and LN+ groups are summarized in Table 1. No significant differences were found in clinical characteristics between the groups, except in CA199 level (p=0.007).
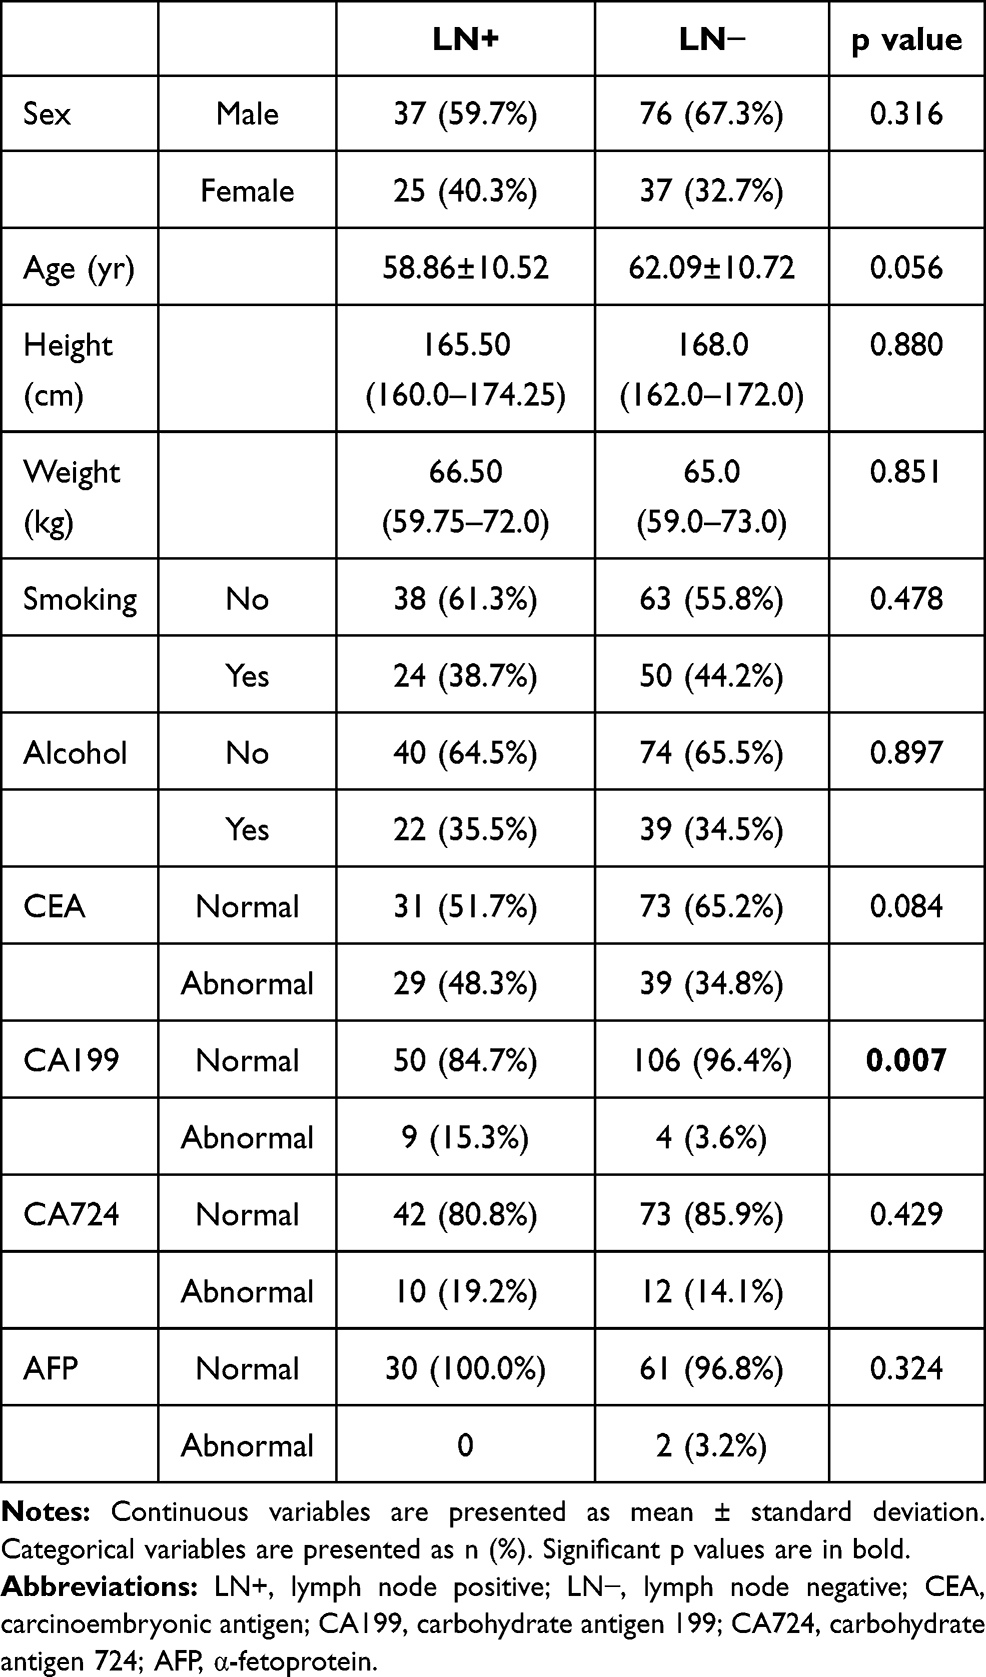 |
Table 1 Comparison of Clinical Data Between the LN− and LN+ Groups |
Radiological Characteristics
The radiological characteristics of the two groups are shown in Table 2. Maximum tumor thickness measured on T2WI ranged from 6.0 to 26.0 mm, with a mean of 13.6 mm. The length of the lesion ranged from 23.0 to 144.0 mm, with a mean of 48.7 mm. MRI revealed that the number of cases of three invading scopes (1/4-1/2, 1/2-3/4 and >3/4) was 20 (11.4%), 84 (48.0%) and 71 (40.6%), respectively. MRI showed four (2.3%), 107 (61.1%), 34 (19.4%) and 30 (17.2%) cases of T3a, T3b, T3c and T3d, respectively. In terms of mrN stage, 124 cases (70.9%) were N0, 41 (23.4%) N1, and 10 (5.7%) N2. MRI also revealed 162 EMVI negative cases, 13 EMVI positive cases, 145 MRF negative cases and 30 MRF positive cases. 71 tumors were located in the lower rectum, 66 in the middle rectum, and 38 in the upper rectum. There were significant differences in mrN stage (p<0.001) and MRF (p=0.008) between the two groups.
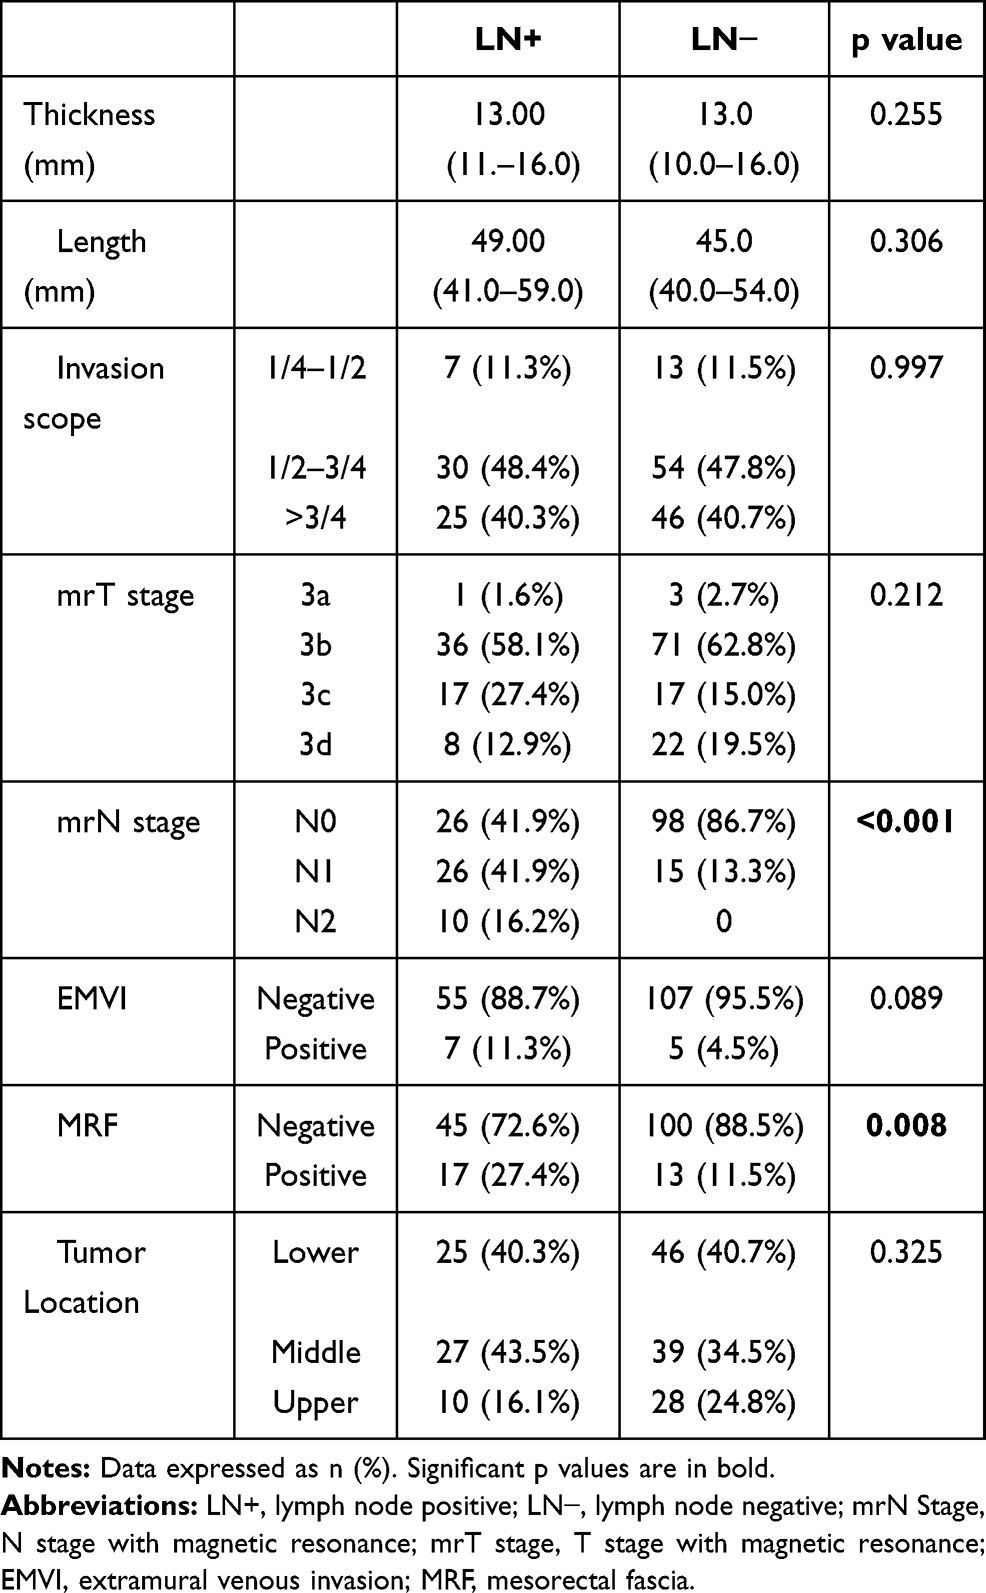 |
Table 2 Comparison of Radiological Characteristics Between the LN− and LN+ Groups |
Histogram Analysis of ADC Maps
The ADC histogram parameters in the two groups are presented in Table 3. Most histogram parameters were significant in evaluating LNM of rectal cancer: P10 (p=0.028, cutoff=0.80×10⁻³ s/mm2), P25 (p=0.007, cutoff=0.89×10⁻³ s/mm2), P50 (p=0.023, cutoff=0.98×10⁻³ s/mm2), P75 (p=0.021, cutoff=1.13×10⁻³ s/mm2), P90 (p=0.035, cutoff=1.58×10⁻³ s/mm2), P95 (p=0.045, cutoff=1.75×10⁻³ s/mm2), mean (p=0.002, cutoff=1.08×10⁻³ s/mm2), and CV (p=0.040, cutoff=0.249) (Figures 3 and 4).
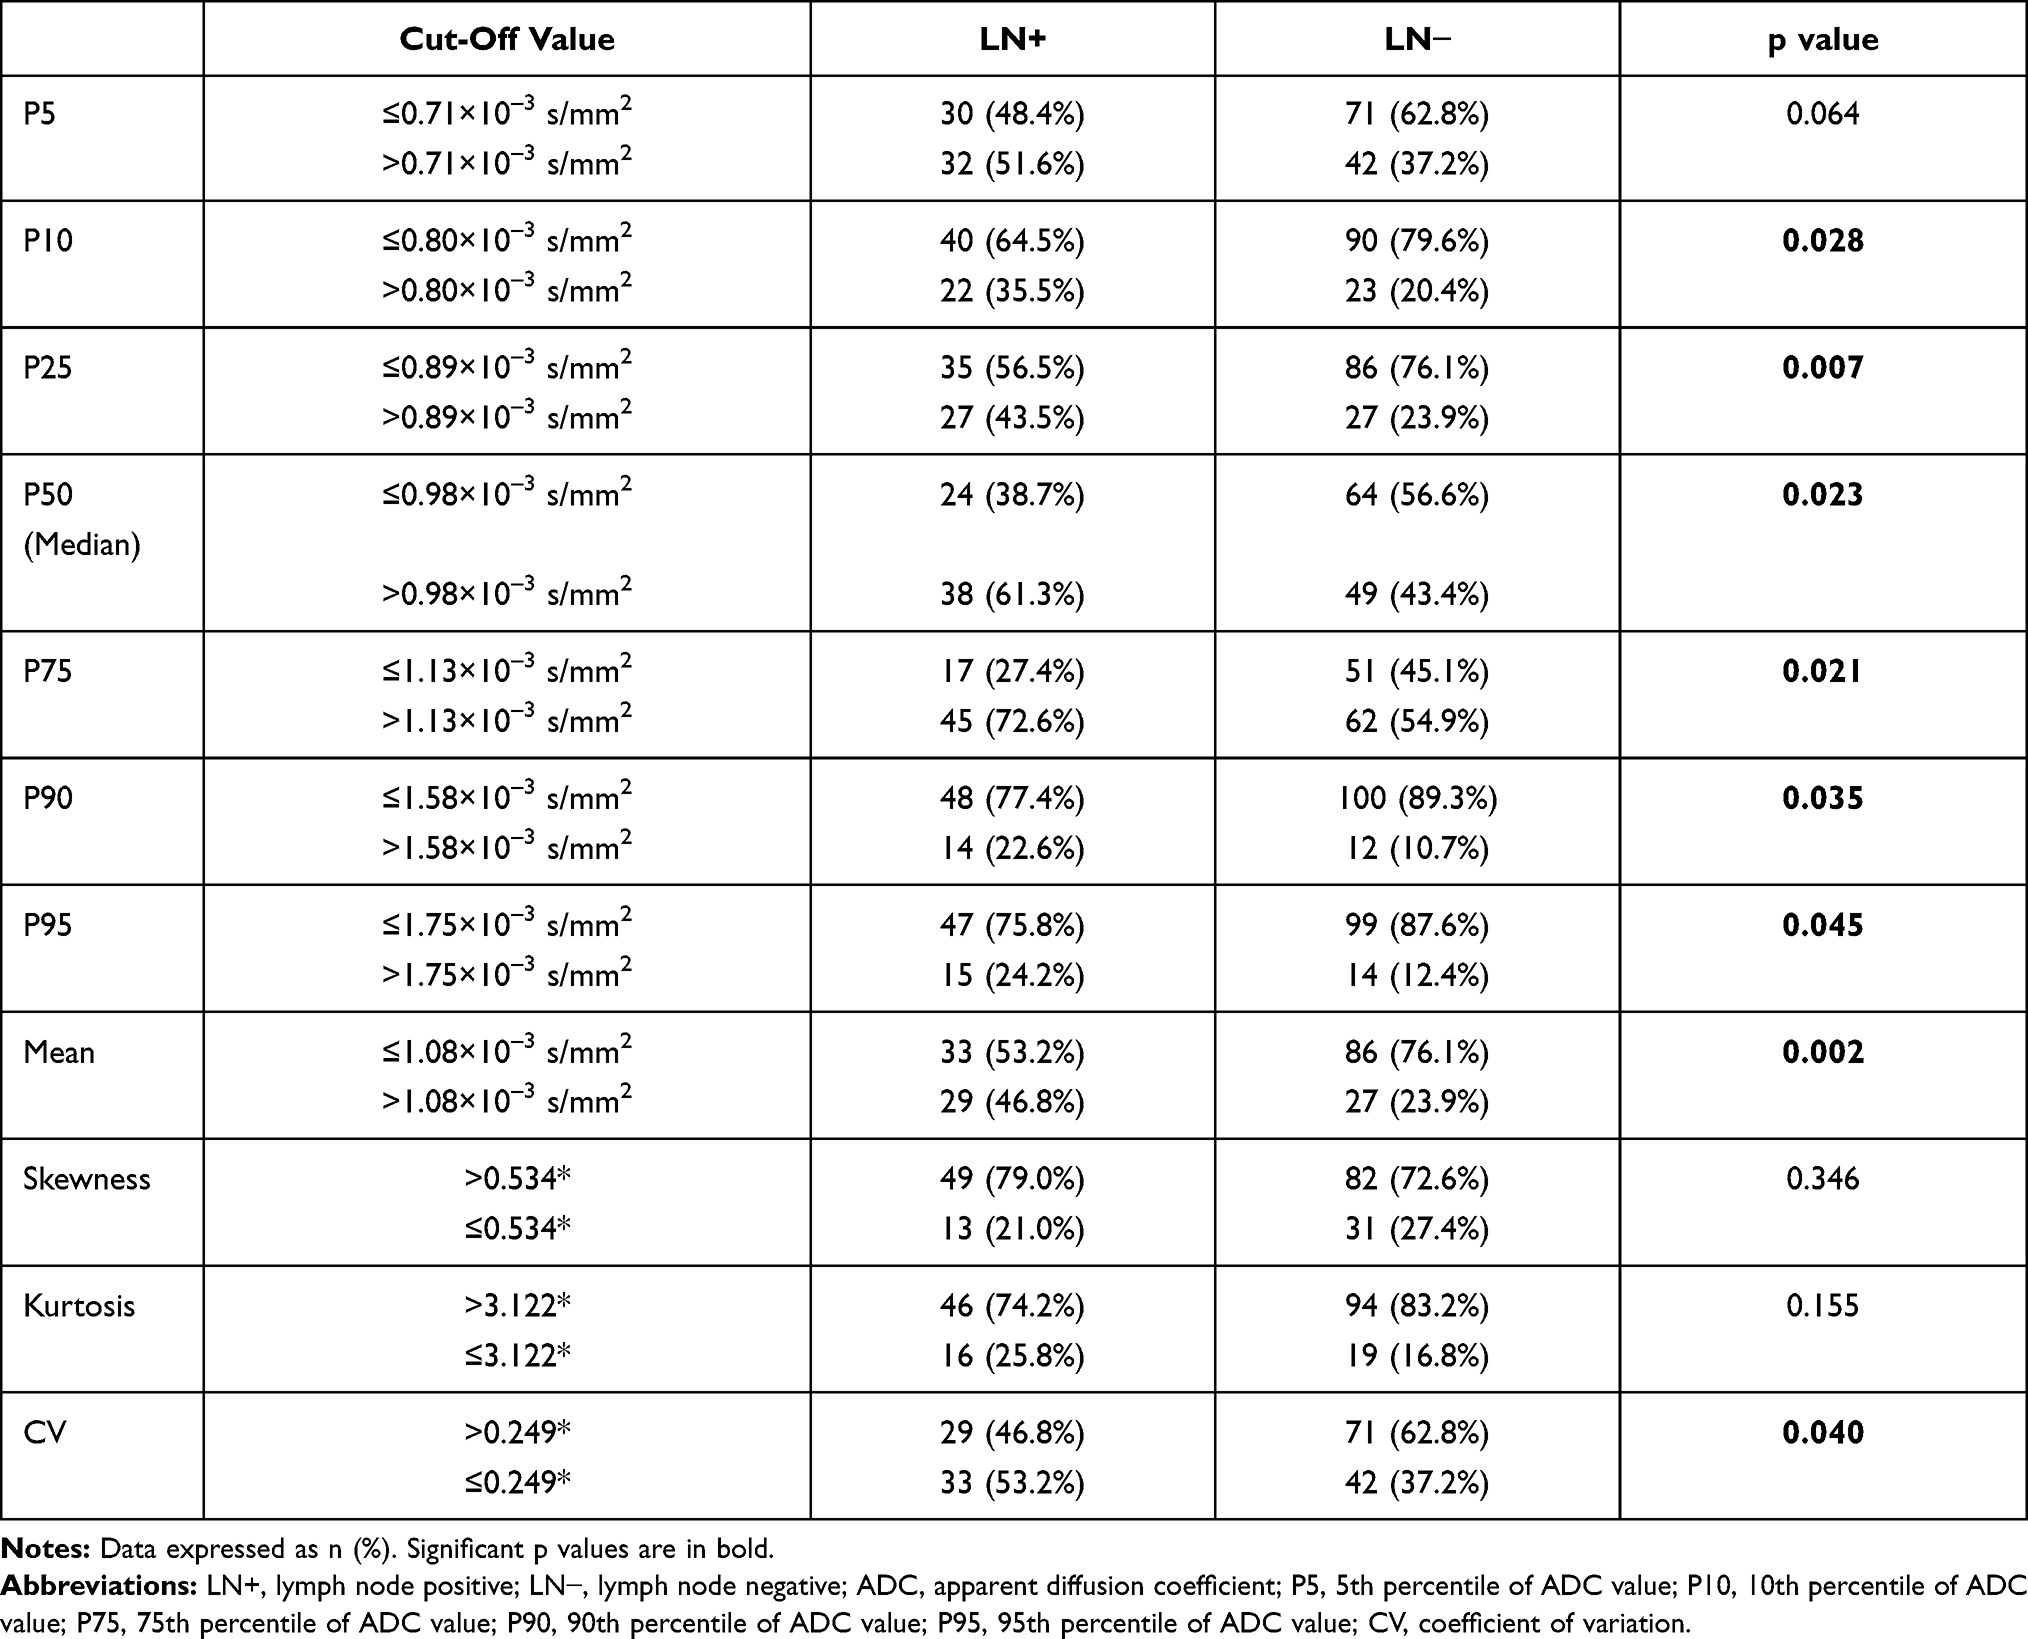 |
Table 3 Comparison of ADC Histogram Parameters Between the LN− and LN+ Groups |
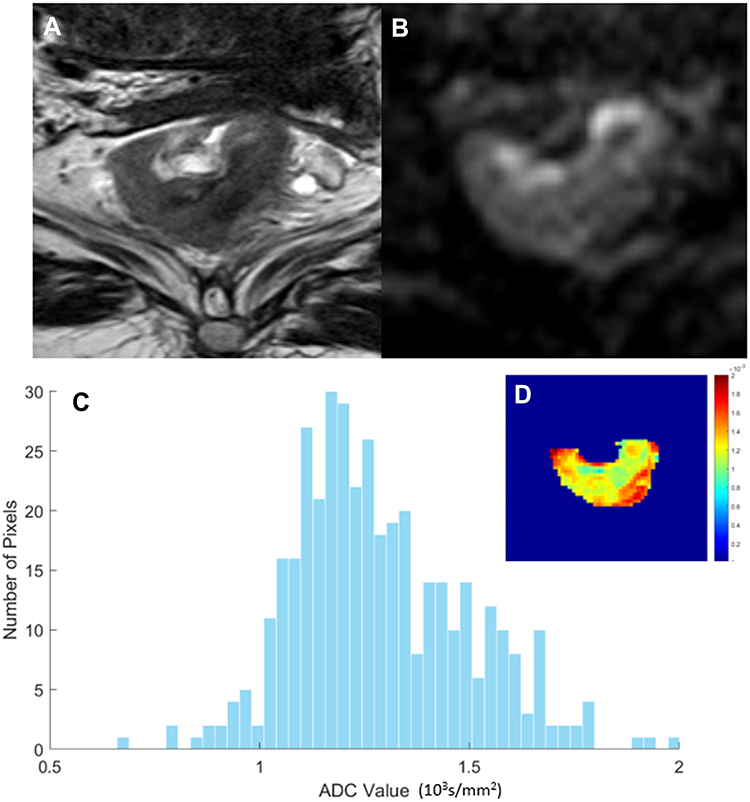 |
Figure 3 A51-year-old male patient with confirmed pT3N1 rectal cancer. (A) Maximum axial T2-weighted image showing irregular thickening of the rectal wall with intermediate signal intensity in the lower segment of the rectum. (B) The corresponding maximum axial diffusion-weighted (DW) image with the same lesion for delineation of regions of interest (ROIs). (C) Corresponding apparent diffusion coefficient (ADC) map histogram copying from ROI of DW image showing that the ADC mean of 1.29×10³ s/mm2 and coefficient of variation of 0.163. (D) ADC pcolor map showing that the brighter the color, the greater the value. |
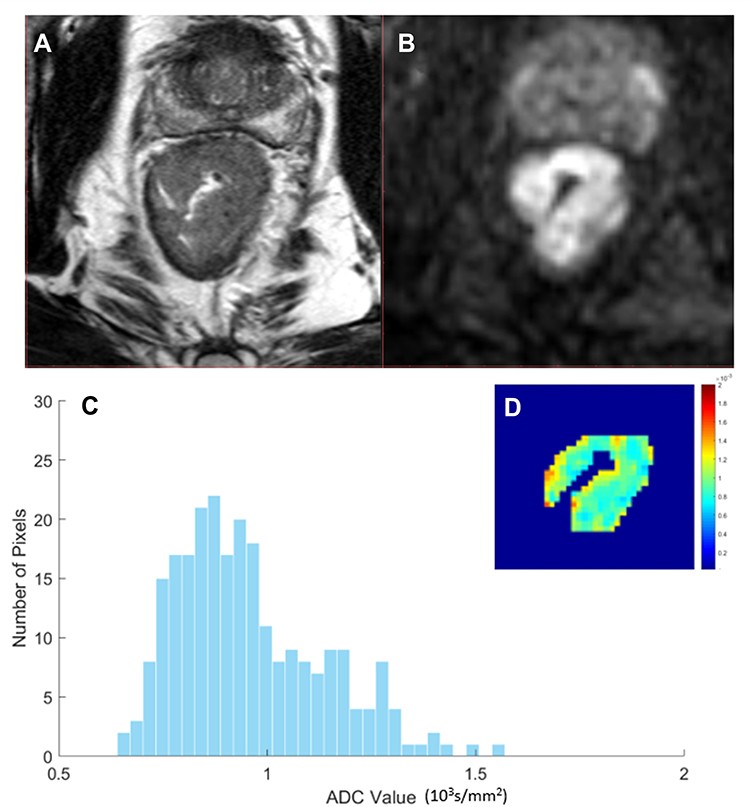 |
Figure 4 A 63-year-old male patient with confirmed pT3N0 rectal cancer. (A) Maximum axial T2-weighted image showing irregular thickening of the rectal wall with intermediate signal intensity in the lower segment of the rectum. (B) The corresponding maximum axial diffusion-weighted image (DW) image of the same lesion for delineation of regions of interest (ROIs). (C) The corresponding apparent diffusion coefficient (ADC) map histogram copied from ROI of DW image showing ADC mean of 0.96×10³ s/mm2 and coefficient of variation of 0.183. (D) ADC pcolor map showing that the brighter the color, the greater the value. |
Multivariate Analysis
Univariate and multivariate analyses are shown in Table 4. Eleven covariates were entered in the final logistic model: CA199, MRF, mrN stage, P10, P25, P50, P75, P90, P95, mean, and CV. The logistic regression analysis demonstrated that CA199 level [odds ratio (OR)=8.518; p=0.004], mrN stage (OR=8.236; p<0.001), mean (OR=5.392; p<0.001), and CV (OR=2.192; p=0.040) were independent risk factors of pathological LNM in the model. Other covariates were not independent risk factors. The combine model showed the highest AUC of 0.838 which was better than CA199 level (AUC=0.558, p<0.0001, Delong test), mrN stage (AUC=0.735, p=0.003, Delong test), mean (AUC=0.614, p<0.0001, Delong test) and CV (AUC=0.580, p<0.0001, Delong test), respectively (Figure 5). Table 5 presents CA199 level, mrN stage, mean, CV and combined model, including AUC, cut-off, sensitivity, specificity, PPV and NPV.
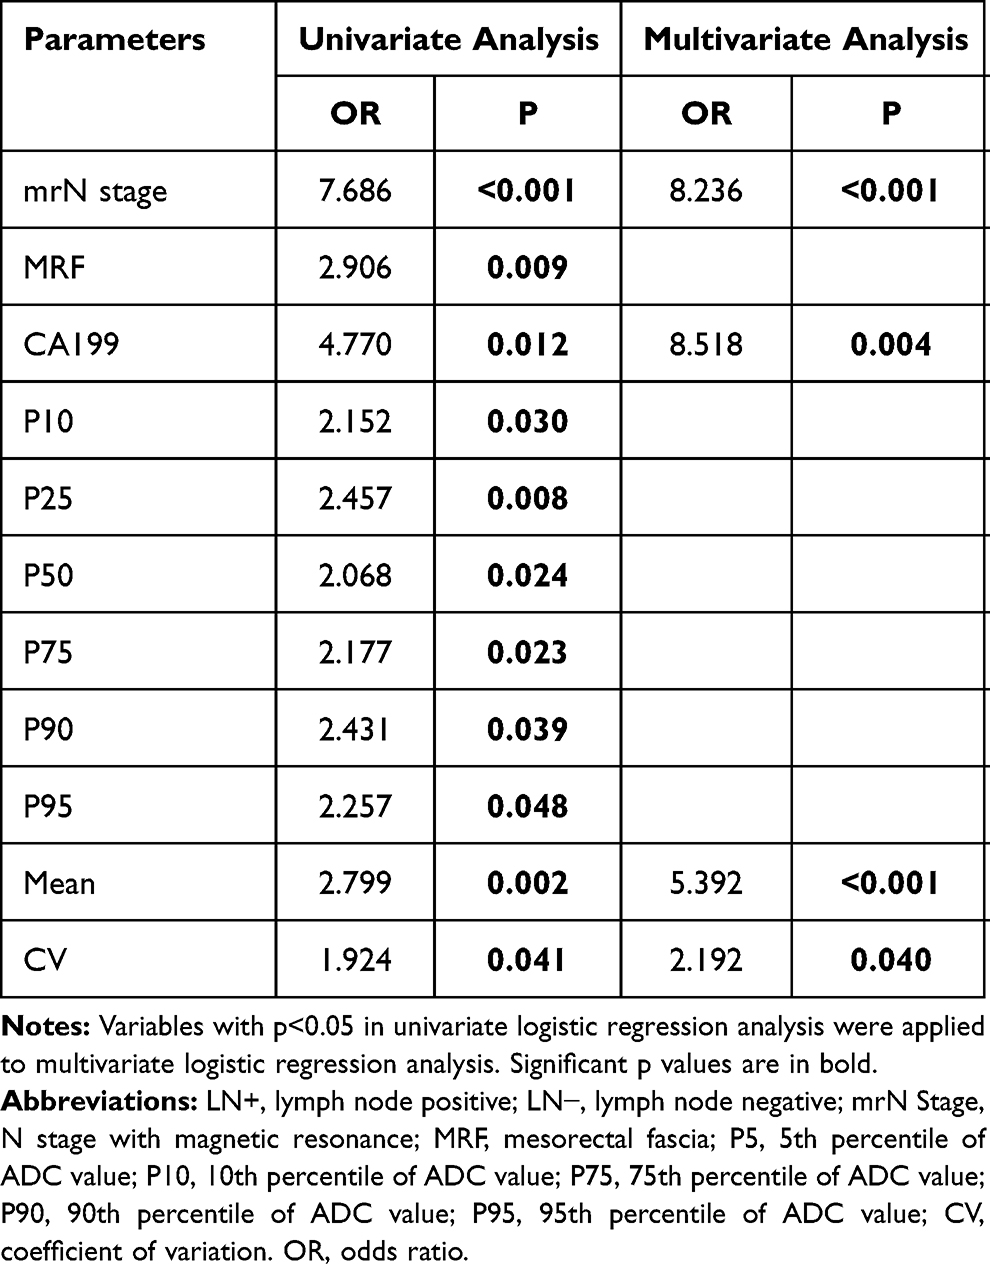 |
Table 4 Univariate and Multivariate Analyses |
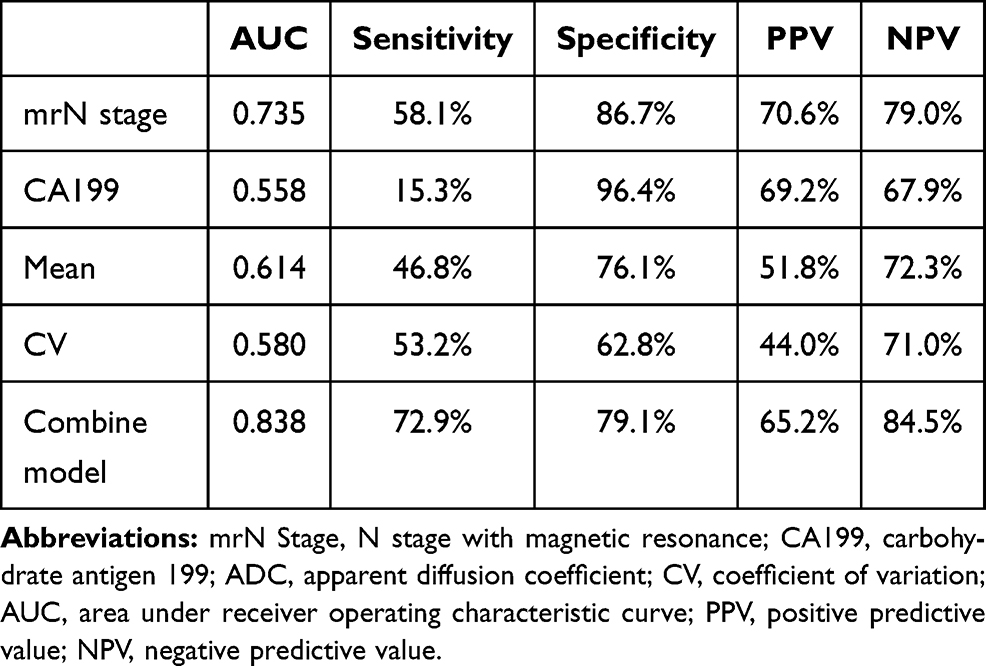 |
Table 5 Predictive Efficacy of the Four Independent Predictive Factors Model and Combined Model |
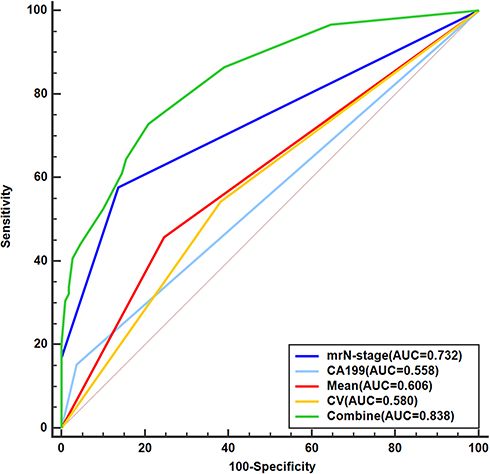 |
Figure 5 Receiver operating characteristic curves and area under the curve values for mrN-stage, carbohydrate antigen 199, apparent diffusion coefficient (ADC) mean, ADC coefficient of variation and combined model with above parameters in predicting pathological lymph node metastasis. |
Discussion
We performed a histogram analysis of preoperative ADC of the primary tumor to explore the potential diagnostic performance of DWI for LNM of T3 rectal cancer and developed a diagnostic pattern that was practical and easy to generalize. The results showed that the structural MRI report, combined with clinical risk factors and the ADC parameters, yielded a higher diagnostic value.
In most cases, the probability of LNM of T3 rectal cancer is greater than that of early T1–2 stage disease and the LNM effected the prognosis of T3 rectal cancer.16–18 Therefore, the guidelines recommend preoperative nCRT for rectal cancer patients with T3N1-2, while T3 patients without LNM can avoid preoperative nCRT.15 However, prediction of LNM by current preoperative imaging remains difficult. As a result, neoadjuvant therapy is adopted in most patients with T3 stage cancer.19 Such potentially excessive treatment adds an economic burden to the patients, and some may delay the best operation time due to poor neoadjuvant efficacy. Therefore, identifying the LN status is an urgent requirement for clinical treatment of T3 stage patients.
At present, preoperative N staging of rectal cancer often relies on subjective diagnosis of tumor morphology, size, heterogeneity, and margins by MRI.14 Our study showed 71% accuracy in assessing LNs based on tumor size and morphological features (mrN stage) alone, which was similar to previous studies. The diagnostic deviation in previous studies was mainly due to larger LNs (≥9 mm) over-staging and downgrading the staging of smaller LNs (<5 mm) or LNs that were not visible by MRI.20,21 There are subjective and methodological limitations using the Mercury criterion for the evaluation of LNs. Therefore, our study analyzed the primary tumor features to predict the LN status, thus avoiding the above limitations.
Our results showed that most of ADC histogram parameters differed significantly between the LN+ and LN− groups. As commonly used functional imaging, DWI can display the movement speed of water molecules in tissues and quantify the limited diffusion of water molecules caused by cell enlargement.22 It can be used to evaluate the density of cells and tissues and reflect tumor heterogeneity, which is an important factor for metastasis.23 Combining DWI and histogram parameters can further quantify the inherent texture features of tumors, which can improve the subjective diagnosis of radiologists. To obtain more texture information and save time, we selected the maximum cross-section of the tumor to depict the ROI. Our model achieved satisfactory predictive results. Previous studies identified that LNM might be closely related to the microscopic characteristics of the primary tumor.24,25 Cho et al5 showed maximum accuracy of 72%, with sensitivity of 78% and specificity of 67% for prediction of LNM, combined with DWI and traditional anatomical imaging features. We acquired improved ROC results, while the sensitivity was lower than in previous research. We considered that the difference was attributable to focusing on T3 stage alone, aiming to guide neoadjuvant therapies and addressing the problem of a clinical hotspot in rectal carcinoma. This study has improved the diagnostic ability and achieved satisfactory results. It may be a new and simple way to diagnose LN status of rectal cancer.
Multivariate analysis was used to demonstrate further the correlation between ADC histogram parameters, clinical risk factors, multi-parameters of rectal cancer structured report and LN status. Multivariate logistic regression analysis showed that preoperative CA199 level, mrN stage, ADC mean and ADC CV were independent predictors. This indicated that the combination of clinical laboratory examination, structured report information and histogram quantitative analysis achieved the best predictive power (AUC=0.838). Our specificity of 79.1% and sensitivity of 72.9% were better than in previous studies.26–30 These were particularly superior over the studies which draw the ROI on lymph node alone.29,30 So, the original tumor information for LN prediction can reduce false-positive rates and avoid excessive treatment. We suggest that clinicians could perform TME earlier in the course of T3 stage rectal cancer with normal CA199 level, negative LN in MRI qualitative assessment, ADC mean <1.08×10⁻³ s/mm2, and ADC CV >0.249. This course of action can reduce treatment costs and achieve greater survival benefits for patients.
Our study had some limitations. First, this study was based on retrospective analysis in a single center with inevitable patient selection biases; therefore, it lacked multicenter validation. Second, our study only used histogram features on DWI, and other textural features and imaging sequences may be investigated in future research. Third, we only used a single slice with the maximum tumor diameter was applied to extract features in this study; whole-tumor ROI might be applied for LN prediction in further research.
In conclusion, this study showed that the histogram features of the primary T3 stage rectal tumor on ADC significantly correlated with LN status, which, combined with clinical risk factor and qualitative assessment, could improve the diagnostic performance of LNM. We recommend clinical laboratory examination, structured report information and ADC histogram quantitative analysis as important clinical references for preoperative prediction of LNM in patients with T3 stage rectal cancer. This could assist in the formulation of clinical therapy decisions and provide a strong basis for individualized treatment.
Abbreviations
LNM, lymph node metastasis; MRI, magnetic resonance imaging; ADC, apparent diffusion coefficient; ROC, receiver operating characteristic curve; CV, coefficient of variation; MRF, mesorectal fascia; EMVI, extramural vascular invasion; ESMO, European Society for Medical Oncology; nCRT, neoadjuvant chemoradiotherapy; TME, total mesorectal excision; DWI, diffusion-weighted imaging; T1WI, T1-weighted imaging; T2WI, T2-weighted imaging; NPV, negative predictive value; AUC, high area under the curve; CEA, carcinoma embryonic antigen; CA, carbohydrate antigen; AFP, α-fetoprotein; ROIs, regions of interest.
Data Sharing Statement
The datasets used and/or analyzed during the current study are available from the corresponding author on reasonable request.
Ethics Approval and Consent to Participate
This study was conducted in accordance with the declaration of Helsinki and Ethical Committee of Harbin Medical University Cancer Hospital approved this retrospective study. The requirement for informed consent was waived by the ethics committee due to the nature of the study, and no personal information was disclosed.
Consent for Publication
Not applicable.
Author Contributions
All authors made a significant contribution to the work reported, whether that is in the conception, study design, execution, acquisition of data, analysis and interpretation, or in all these areas; took part in drafting, revising or critically reviewing the article; gave final approval of the version to be published; have agreed on the journal to which the article has been submitted; and agree to be accountable for all aspects of the work.
These authors contributed equally to this work and should be considered co-first authors: Jin Li and Yang Zhou.
Funding
This study has received funding from Applied Technology Research, the Development Foundation of Harbin City (No. 2016RAQXJ043); National Natural Science Foundation of China (No. 61773134 and No. 81301297); and the Harbin Medical University Cancer Hospital Haiyan Funds (No. JJZD2020-17).
Disclosure
The authors declare that they have no conflicts of interest related to this study.
References
1. Gu C, Yang X, Zhang X, et al. The prognostic significance of MRI-detected extramural venous invasion, mesorectal extension, and lymph node status in clinical T3 mid-low rectal cancer. Sci Rep. 2019;9(1):12523. doi:10.1038/s41598-019-47466-0
2. Ogawa S, Itabashi M, Hirosawa T, Hashimoto T, Bamba Y, Kameoka S. A logistic model including risk factors for lymph node metastasis can improve the accuracy of magnetic resonance imaging diagnosis of rectal cancer. Asian Pac J Cancer Prev. 2015;16(2):707–712. doi:10.7314/APJCP.2015.16.2.707
3. Zhou X, Yi Y, Liu Z, et al. Radiomics-based preoperative prediction of lymph node status following neoadjuvant therapy in locally advanced rectal cancer. Front Oncol. 2020;10:604. doi:10.3389/fonc.2020.00604
4. Glynne-Jones R, Wyrwicz L, Tiret E, et al. Rectal cancer: ESMO Clinical Practice Guidelines for diagnosis, treatment and follow-up. Ann Oncol. 2018;29(Suppl 4):iv263. doi:10.1093/annonc/mdy161
5. Cho EY, Kim SH, Yoon JH, et al. Apparent diffusion coefficient for discriminating metastatic from non-metastatic lymph nodes in primary rectal cancer. Eur J Radiol. 2013;82(11):e662–8. doi:10.1016/j.ejrad.2013.08.007
6. Gröne J, Loch FN, Taupitz M, Schmidt C, Kreis ME. Accuracy of various lymph node staging criteria in rectal cancer with magnetic resonance imaging. J Gastrointest Surg. 2018;22(1):146–153. doi:10.1007/s11605-017-3568-x
7. Akasu T, Iinuma G, Takawa M, Yamamoto S, Muramatsu Y, Moriyama N. Accuracy of high-resolution magnetic resonance imaging in preoperative staging of rectal cancer. Ann Surg Oncol. 2009;16(10):2787–2794. doi:10.1245/s10434-009-0613-3
8. Mizukami Y, Ueda S, Mizumoto A, et al. Diffusion-weighted magnetic resonance imaging for detecting lymph node metastasis of rectal cancer. World J Surg. 2011;35(4):895–899. doi:10.1007/s00268-011-0986-x
9. Yu XP, Wen L, Hou J, et al. Discrimination between metastatic and nonmetastatic mesorectal lymph nodes in rectal cancer using intravoxel incoherent motion diffusion-weighted magnetic resonance imaging. Acad Radiol. 2016;23(4):479–485. doi:10.1016/j.acra.2015.12.013
10. Chen XL, Chen GW, Pu H. et al. DWI and T2-Weighted MRI volumetry in resectable rectal cancer: correlation with lymphovascular invasion and lymph node metastases. AJR Am J Roentgenol;2019. 1–8. doi:10.2214/AJR.18.20564
11. Sturgeon CM, Duffy MJ, Hofmann BR, et al. National Academy of Clinical Biochemistry Laboratory Medicine Practice Guidelines for use of tumor markers in liver, bladder, cervical, and gastric cancers. Clin Chem. 2010;56(6):e1–48.
12. Sturgeon CM, Duffy MJ, Stenman UH, et al. National Academy of Clinical Biochemistry laboratory medicine practice guidelines for use of tumor markers in testicular, prostate, colorectal, breast, and ovarian cancers. Clin Chem. 2008;54(12):e11–79.
13. Horvat N, Carlos Tavares Rocha C, Clemente OB, Petkovska I, Gollub MJ. MRI of Rectal Cancer: tumor Staging, Imaging Techniques, and Management. Radiographics. 2019;39(2):367–387. doi:10.1148/rg.2019180114
14. Brown G, Richards CJ, Bourne MW, et al. Morphologic predictors of lymph node status in rectal cancer with use of high-spatial-resolution MR imaging with histopathologic comparison. Radiology. 2003;227(2):371–377. doi:10.1148/radiol.2272011747
15. Benson AB, Venook AP, Al-Hawary MM, et al. NCCN Guidelines Insights: rectal Cancer, Version 6.2020. J Natl Compr Canc Netw. 2020;18(7):806–815. doi:10.6004/jnccn.2020.0032
16. Wolmark N, Fisher ER, Wieand HS, Fisher B. The relationship of depth of penetration and tumor size to the number of positive nodes in Dukes C colorectal cancer. Cancer. 1984;53(12):2707–2712. doi:10.1002/1097-0142(19840615)53:12<2707::AID-CNCR2820531225>3.0.CO;2-R
17. Tsai HL, Cheng KI, Lu CY, et al. Prognostic significance of depth of invasion, vascular invasion and numbers of lymph node retrievals in combination for patients with stage II colorectal cancer undergoing radical resection. J Surg Oncol. 2008;97(5):383–387. doi:10.1002/jso.20942
18. Räsänen M, Renkonen-Sinisalo L, Mustonen H, Lepistö A. Is there a need for neoadjuvant short-course radiotherapy in T3 rectal cancer with positive lymph node involvement? A single-center retrospective cohort study. World J Surg Oncol. 2019;17(1):139. doi:10.1186/s12957-019-1670-0
19. Al-Sukhni E, Milot L, Fruitman M, et al. Diagnostic accuracy of MRI for assessment of T category, lymph node metastases, and circumferential resection margin involvement in patients with rectal cancer: a systematic review and meta-analysis. Ann Surg Oncol. 2012;19(7):2212–2223. doi:10.1245/s10434-011-2210-5
20. Beets-Tan R, Lambregts D, Maas M, et al. Magnetic resonance imaging for clinical management of rectal cancer: updated recommendations from the 2016 European Society of Gastrointestinal and Abdominal Radiology (ESGAR) consensus meeting. Eur Radiol. 2018;28(4):1465–1475. doi:10.1007/s00330-017-5026-2
21. Park JS, Jang YJ, Choi GS, et al. Accuracy of preoperative MRI in predicting pathology stage in rectal cancers: node-for-node matched histopathology validation of MRI features. Dis Colon Rectum. 2014;57(1):32–38. doi:10.1097/DCR.0000000000000004
22. Schob S, Meyer J, Gawlitza M, et al. Diffusion-weighted MRI reflects proliferative activity in primary CNS lymphoma. PLoS One. 2016;11(8):e0161386. doi:10.1371/journal.pone.0161386
23. Intven M, Reerink O, Philippens ME. Diffusion-weighted MRI in locally advanced rectal cancer: pathological response prediction after neo-adjuvant radiochemotherapy. Strahlenther Onkol. 2013;189(2):117–122. doi:10.1007/s00066-012-0270-5
24. Grøvik E, Redalen KR, Storås TH, et al. Dynamic multi-echo DCE- and DSC-MRI in rectal cancer: low primary tumor Ktrans and ΔR2* peak are significantly associated with lymph node metastasis. J Magn Reson Imaging. 2017;46(1):194–206. doi:10.1002/jmri.25566
25. Huang YQ, Liang CH, He L, et al. Development and validation of a radiomics nomogram for preoperative prediction of lymph node metastasis in colorectal cancer. J Clin Oncol. 2016;34(18):2157–2164. doi:10.1200/JCO.2015.65.9128
26. Yang L, Liu D, Fang X, et al. Rectal cancer: can T2WI histogram of the primary tumor help predict the existence of lymph node metastasis. Eur Radiol. 2019;29(12):6469–6476. doi:10.1007/s00330-019-06328-z
27. Kim SH, Yoon JH, Lee Y. Added value of morphologic characteristics on diffusion-weighted images for characterizing lymph nodes in primary rectal cancer. Clin Imaging. 2015;39(6):1046–1051. doi:10.1016/j.clinimag.2015.07.022
28. Heijnen LA, Lambregts DM, Mondal D, et al. Diffusion-weighted MR imaging in primary rectal cancer staging demonstrates but does not characterise lymph nodes. Eur Radiol. 2013;23(12):3354–3360. doi:10.1007/s00330-013-2952-5
29. Zhang H, Zhang C, Zheng Z, et al. Chemical shift effect predicting lymph node status in rectal cancer using high-resolution MR imaging with node-for-node matched histopathological validation. Eur Radiol. 2017;27(9):3845–3855. doi:10.1007/s00330-017-4738-7
30. Yu J, Dai X, Zou HH, et al. Diffusion kurtosis imaging in identifying the malignancy of lymph nodes during the primary staging of rectal cancer. Colorectal Dis. 2018;20(2):116–125. doi:10.1111/codi.13835
 © 2021 The Author(s). This work is published and licensed by Dove Medical Press Limited. The
full terms of this license are available at https://www.dovepress.com/terms
and incorporate the Creative Commons Attribution
- Non Commercial (unported, 3.0) License.
By accessing the work you hereby accept the Terms. Non-commercial uses of the work are permitted
without any further permission from Dove Medical Press Limited, provided the work is properly
attributed. For permission for commercial use of this work, please see paragraphs 4.2 and 5 of our Terms.
© 2021 The Author(s). This work is published and licensed by Dove Medical Press Limited. The
full terms of this license are available at https://www.dovepress.com/terms
and incorporate the Creative Commons Attribution
- Non Commercial (unported, 3.0) License.
By accessing the work you hereby accept the Terms. Non-commercial uses of the work are permitted
without any further permission from Dove Medical Press Limited, provided the work is properly
attributed. For permission for commercial use of this work, please see paragraphs 4.2 and 5 of our Terms.