")
Back to Journals » Cancer Management and Research » Volume 11
Higher plasma concentration of TP53-induced glycolysis and apoptosis regulator is associated with a lower risk of colorectal cancer metastasis
Authors Lin L, Mi Y , Li X, Peng C, Shangguan Z, Li Z , Liu S
Received 9 October 2018
Accepted for publication 9 November 2018
Published 24 December 2018 Volume 2019:11 Pages 263—272
DOI https://doi.org/10.2147/CMAR.S190272
Checked for plagiarism Yes
Review by Single anonymous peer review
Peer reviewer comments 2
Editor who approved publication: Dr Chien-Feng Li
Lin Lin,1,* Yanjun Mi,2,* Xun Li,3 Cuixin Peng,2 Zhaoshui Shangguan,1 Zhibin Li,4 Suhuan Liu1
1Central Laboratory, The First Affiliated Hospital of Xiamen University, Xiamen, China; 2Division of Oncology, The First Affiliated Hospital of Xiamen University, Xiamen, China; 3Department of Laboratory Medicine, The First Affiliated Hospital of Xiamen University, Xiamen, China; 4Epidemiology Research Unit, The First Affiliated Hospital of Xiamen University, Xiamen, China
*These authors contributed equally to this work
Purpose: We aimed to explore the association of plasma TP53-induced glycolysis and apoptosis regulator (TIGAR) level with colorectal cancer (CRC) metastasis.
Methods: A cross-sectional study of 126 CRC patients was conducted in Xiamen, China. Multivariable logistic regression was used to calculate adjusted OR and 95% CIs of plasma TIGAR concentration for CRC metastasis in different models with adjustment for potential confounders. Area under the curve (AUC) of receiver operating characteristic (ROC) curve was used to evaluate the diagnostic value.
Results: CRC patients with metastasis showed significantly decreased plasma TIGAR concentration compared to their controls (1.97±0.64 vs 2.49±0.69 ng/mL [log transformed], P=0.002). Higher plasma TIGAR was significantly associated with the decreased risk of CRC metastasis, and the adjusted OR (95% CI) was 0.134 (0.027–0.676, P=0.015) for per SD increase in plasma TIGAR concentration, and the trend test for increasing tertiles showed a negative trend of plasma TIGAR on risk of CRC metastasis (P for trend test: 0.005). Pearson correlation coefficients of plasma TIGAR with other cancer biomarkers (carbohydrate antigen 50 [CA50], carbohydrate antigen 199 [CA199], carbohydrate antigen 125 [CA125], carbohydrate antigen 724 [CA724], carcinoembryonic antigen [CEA], and ferritin [FER]) was low (P>0.05). AUC (95% CI) of ROC curve of plasma TIGAR for CRC metastasis was comparable to the values of cancer biomarkers (all P-values <0.05).
Conclusion: Higher level of plasma TIGAR was significantly and independently associated with lower risk of CRC metastasis, and its prognostic value on CRC metastasis was comparable to the common cancer biomarkers.
Keywords: TIGAR, colorectal cancer, metastasis, glycolysis
Introduction
Colorectal cancer (CRC) is the third most commonly diagnosed cancer worldwide.1 The prognosis for individuals diagnosed with CRC remains poor because of nonspecific early clinical manifestations and postponed diagnosis and treatments, in addition to the malignancy of the tumor itself. Furthermore, the molecular mechanisms underlying CRC metastasis remain unclear, and thus, there is an urgent need for screening valid markers for the detection of CRC metastasis.
Measurement of serological cancer biomarkers is commonly applied in cancer screening and prognosis.2 Biomarkers such as carcinoembryonic antigen (CEA), carbohydrate antigen 50 (CA50), carbohydrate antigen 199 (CA199), carbohydrate antigen 125 (CA125), and carbohydrate antigen 724 (CA724) are commonly used for CRC screening.3 An undesirable issue is that these markers, in addition to CRC, are also frequently used for pancreatic cancer, gastric cancer, etc.4,5 Thus, discovery of new markers and/or combination assay of multiple biomarkers for CRC diagnosis and/or prognosis, to get better sensitivity and specificity, is still needed. Furthermore, new technology and method in the measurement of serum biomarkers and CRC diagnosis could also be considered for reference.6,7
TP53-induced glycolysis and apoptosis regulator (TIGAR), a downstream target of P53 in regulating glucose metabolism, shares similarity with the enzyme 6-phosphofructo-2-kinase/fructose-2,6-bisphosphatase (PFK-2/FBPase-2).8 Functioning like FBPase-2, TIGAR lowers intracellular fructose 2,6-biphosphate (FBP) levels, thus decreases the glycolytic rate and diverts the glucose metabolism to the pentose phosphate pathway (PPP).8 Increased expression of TIGAR mRNA and protein was associated with cancer cell survival and metastasis in many cancers,9–13 while the association between plasma TIGAR concentration and CRC metastasis remains unclear. In the present study, we aimed to explore the association of plasma TIGAR concentration with CRC metastasis and the prognostic value of TIGAR as a potential marker for CRC metastasis.
Methods
Study subjects
Study subjects were recruited from August 2016 to August 2017 in the First Affiliated Hospital of Xiamen University, Xiamen, China. One hundred and twenty-six patients with primary CRC, who have accepted surgical resection and have fulfilled the inclusion and exclusion criteria, were involved. The inclusion criteria for patients were as follows: 1) pathological diagnosis of CRC (excluding colorectal polyp, colorectal adenoma, and chronic colitis); 2) never received any radiotherapy or chemotherapy or other antitumor therapies before surgical resection; and 3) complete clinical data record. All subjects with CRC were diagnosed by two experienced pathologists. Demographic information (age, gender, and smoking and alcohol drinking habits) and clinical characteristics (tumor site, size, stage, and histology; biochemical characteristics; and levels of common cancer markers) were collected through face-to-face interview and patient medical records, respectively. The TNM staging of the Union International Cancer Control (UICC) (eighth edition) was used for staging. Metastasis was defined according to the results of radiological diagnosis and tissue biopsy. The study was conducted in accordance with the Helsinki Declaration and the International Conference on Harmonization/Good Clinical Practice guidelines. The study protocol was approved by the Human Ethics Committee of the First Affiliated Hospital of Xiamen University. Written informed consent was obtained from all patients.
Biochemical measurements
Intravenous blood samples for all study subjects were collected with one tube for EDTA anticoagulant (2 mL) and one tube for separation gel coagulation (5 mL). Samples were centrifuged at 3,000 rpm for 10 minutes. All plasma and sera were aliquoted and frozen at –80°C until used. Blood samples were tested in the Clinical Laboratory of the First Affiliated Hospital of Xiamen University. Serum glucose, liver enzymes, and lipid profile were determined by Beckman Coulter automatic biochemical analyzer (Beckman Coulter, Brea, CA, America). Serum cancer biomarkers, including CA50, CA199, CA125, CA724, CEA, and ferritin (FER) were determined on ADVIA Centaur XP immunoassay system (Siemens, Germany) and Cobas E601 electrochemiluminescence immune detection systems (Hoffman-La Roche Ltd., Basel, Switzerland). Plasma TIGAR concentrations were measured using the ELISA kits for human fructose-2,6-bisphosphatase [FBP] TIGAR (E5948h; Wuhan Eiaab Science Co. Ltd., Wuhan, China) according to the manufacturer’s instructions. The sensitivity of this assay was 0.085 ng/mL, and the detection range of the standard was 0.15–10.0 ng/mL. The intraassay coefficient of variance (CV) was ≤6.3%, and the interassay CV was ≤8.5%.
Statistical analyses
Data were presented as the mean±SD for continuous variables or number (%) for categorical variables. Skewness and kurtosis test for normality of plasma TIGAR concentration was analyzed; it was found that it did not follow normal distribution and was thus log transformed to obtain better approximation of normal distribution. Differences between subjects categorized by metastasis and tertiles of plasma TIGAR concentration were analyzed using one-way ANOVA for continuous variables and chi-squared test for categorical variables. Pearson correlation analyses were conducted for correlations of plasma TIGAR with other common serum cancer biomarkers, including CA50, CA199, CA125, CA724, CEA, and FER. Area under the curve (AUC) of receiver operating characteristic (ROC) curve was used to evaluate the diagnostic values of plasma TIGAR for CRC metastasis compared with those of other cancer biomarkers. Pathological diagnosis was used as the gold standard for metastasis.
Multivariable logistic regression was used to calculate adjusted OR and 95% CIs of plasma TIGAR for metastasis in different models with adjustment for potential confounders. In model 1, no confounding variables were adjusted; in model 2, age, sex, smoking, and drinking habits were adjusted; in model 3, body mass index (BMI), blood pressure, glucose, triglyceride, total cholesterol, aspartate aminotransferase (AST), serum uric acid, cancer history, cancer clinical stage, tumor stage, lymph node stage, differentiation, tumor size, serum CA50, CA199, CA125, CA724, CEA, and FER were further adjusted. In each model, plasma TIGAR concentration was presented as per SD increase and tertiles (tertile 2 and tertile 3 vs tertile 1) separately. Trend tests for tertiles of plasma TIGAR were also conducted. All P-values were two sided, and P-value <0.05 was considered statistically significant. All statistical analyses were performed with Stata14.0 (StatCorp, College Station, TX, USA).
Results
Clinical characteristics stratified by metastasis and tertiles of plasma TIGAR
Among the 126 CRC patients, 53 (42.1%) were women, the mean age (±SD) was 56.0 (±12.5) years for women and 58.2 (±11.2) years for men (P=0.306), and 21 (16.7%) patients were diagnosed as having metastasis. Table 1 shows the differences of demographics, lifestyle habits, and clinical characteristics of subjects stratified by metastasis. In general, when compared with controls, subjects with metastasis had significantly higher levels of clinical stage, tumor stage, lymph node stage, serum cancer biomarkers (CA50, CA199, CA724, and CEA), and lower differentiation grade. As for difference of plasma TIGAR concentration, subjects with metastasis showed significantly decreased TIGAR levels compared to their controls (1.97±0.64 vs 2.49±0.69 ng/mL [log transformed], P=0.002). There was no significant difference in CA125 and FER between patients with metastasis and those without metastasis.
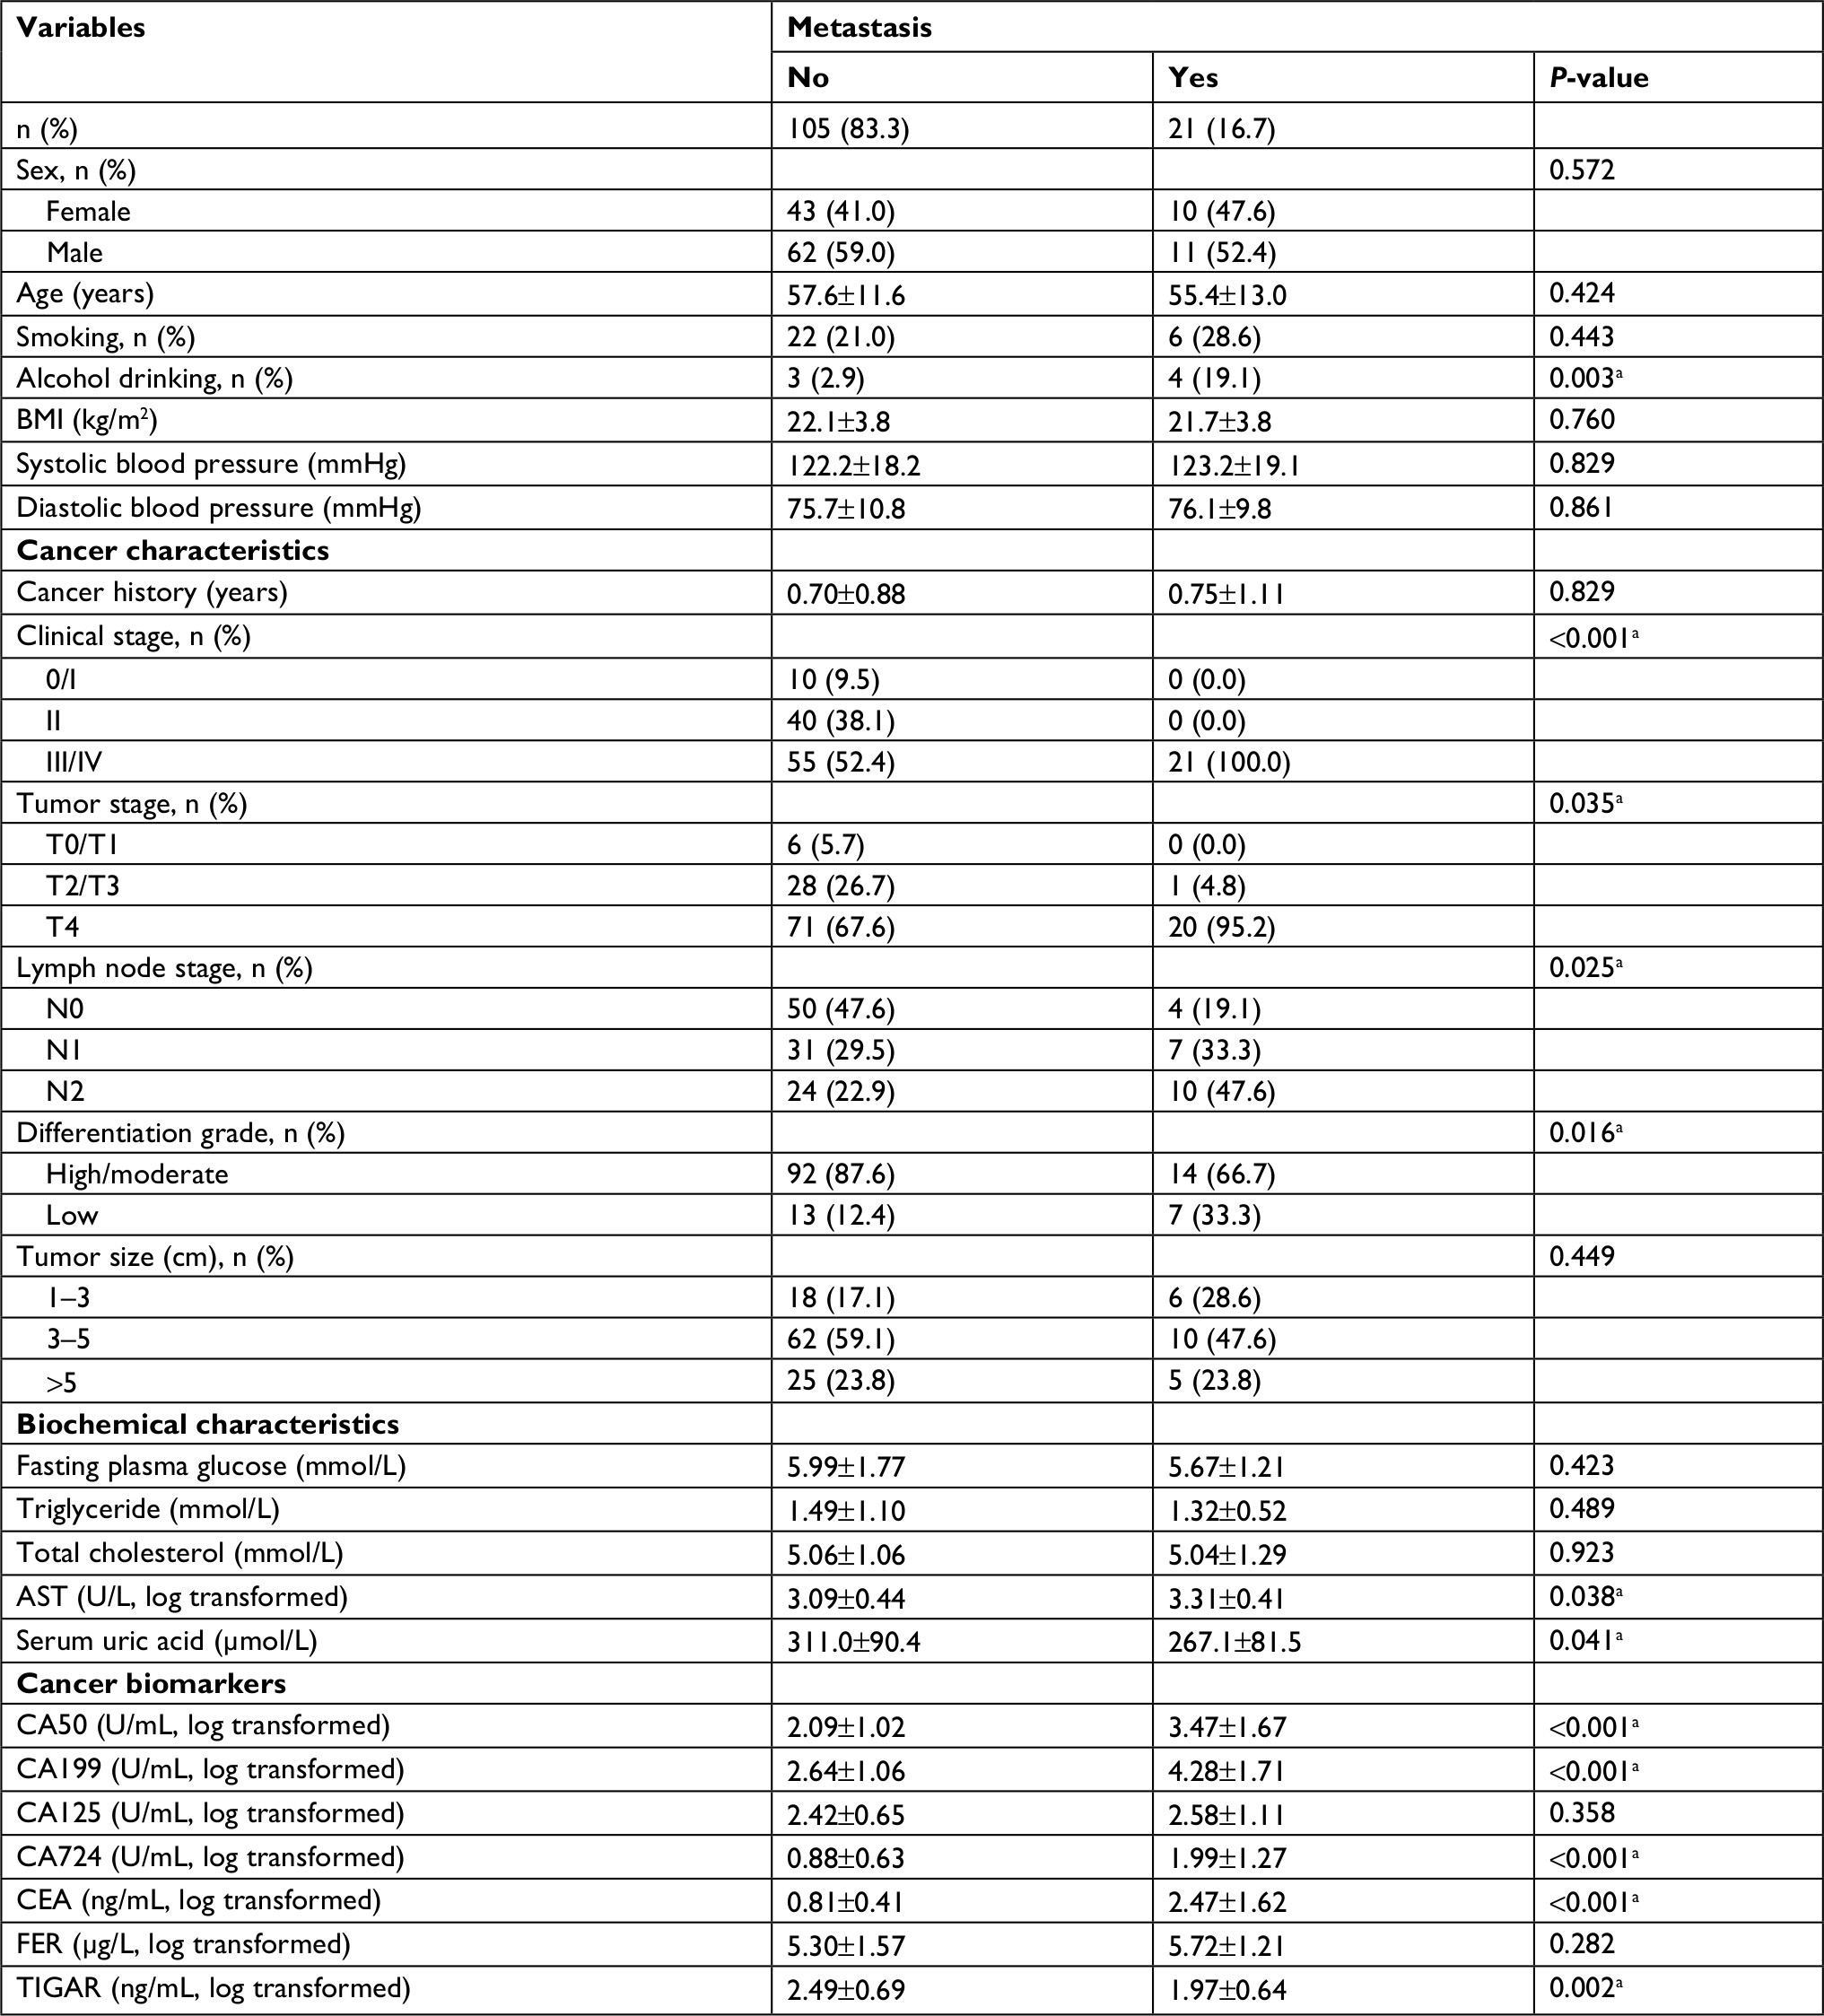 | Table 1 Characteristics of 126 colorectal cancer patients stratified by metastasis statusa Notes: aP<0.05. All percentages are column percentage; except for percentages, all values are represented as mean±SD. Abbreviations: AST, aspartate aminotransferase; BMI, body mass index; CA50, carbohydrate antigen 50; CA125, carbohydrate antigen 125; CA199, carbohydrate antigen 199; CA724, carbohydrate antigen 724; CEA, carcinoembryonic antigen; FER, ferritin; TIGAR, TP53-induced glycolysis and apoptosis regulator. |
Table 2 shows the differences of demographics, lifestyle habits, and clinical characteristics of subjects stratified by tertiles of plasma TIGAR levels (mean±SD): 1.62±0.33, 2.38±0.21, and 3.20±0.29 ng/mL (log transformed) for tertiles 1–3, respectively. Increasing tertiles of plasma TIGAR were only significantly associated with lower prevalence rates of metastasis (33.3%, 9.5%, and 7.1% for tertiles 1–3, respectively, P=0.002) but not with other clinical characteristics.
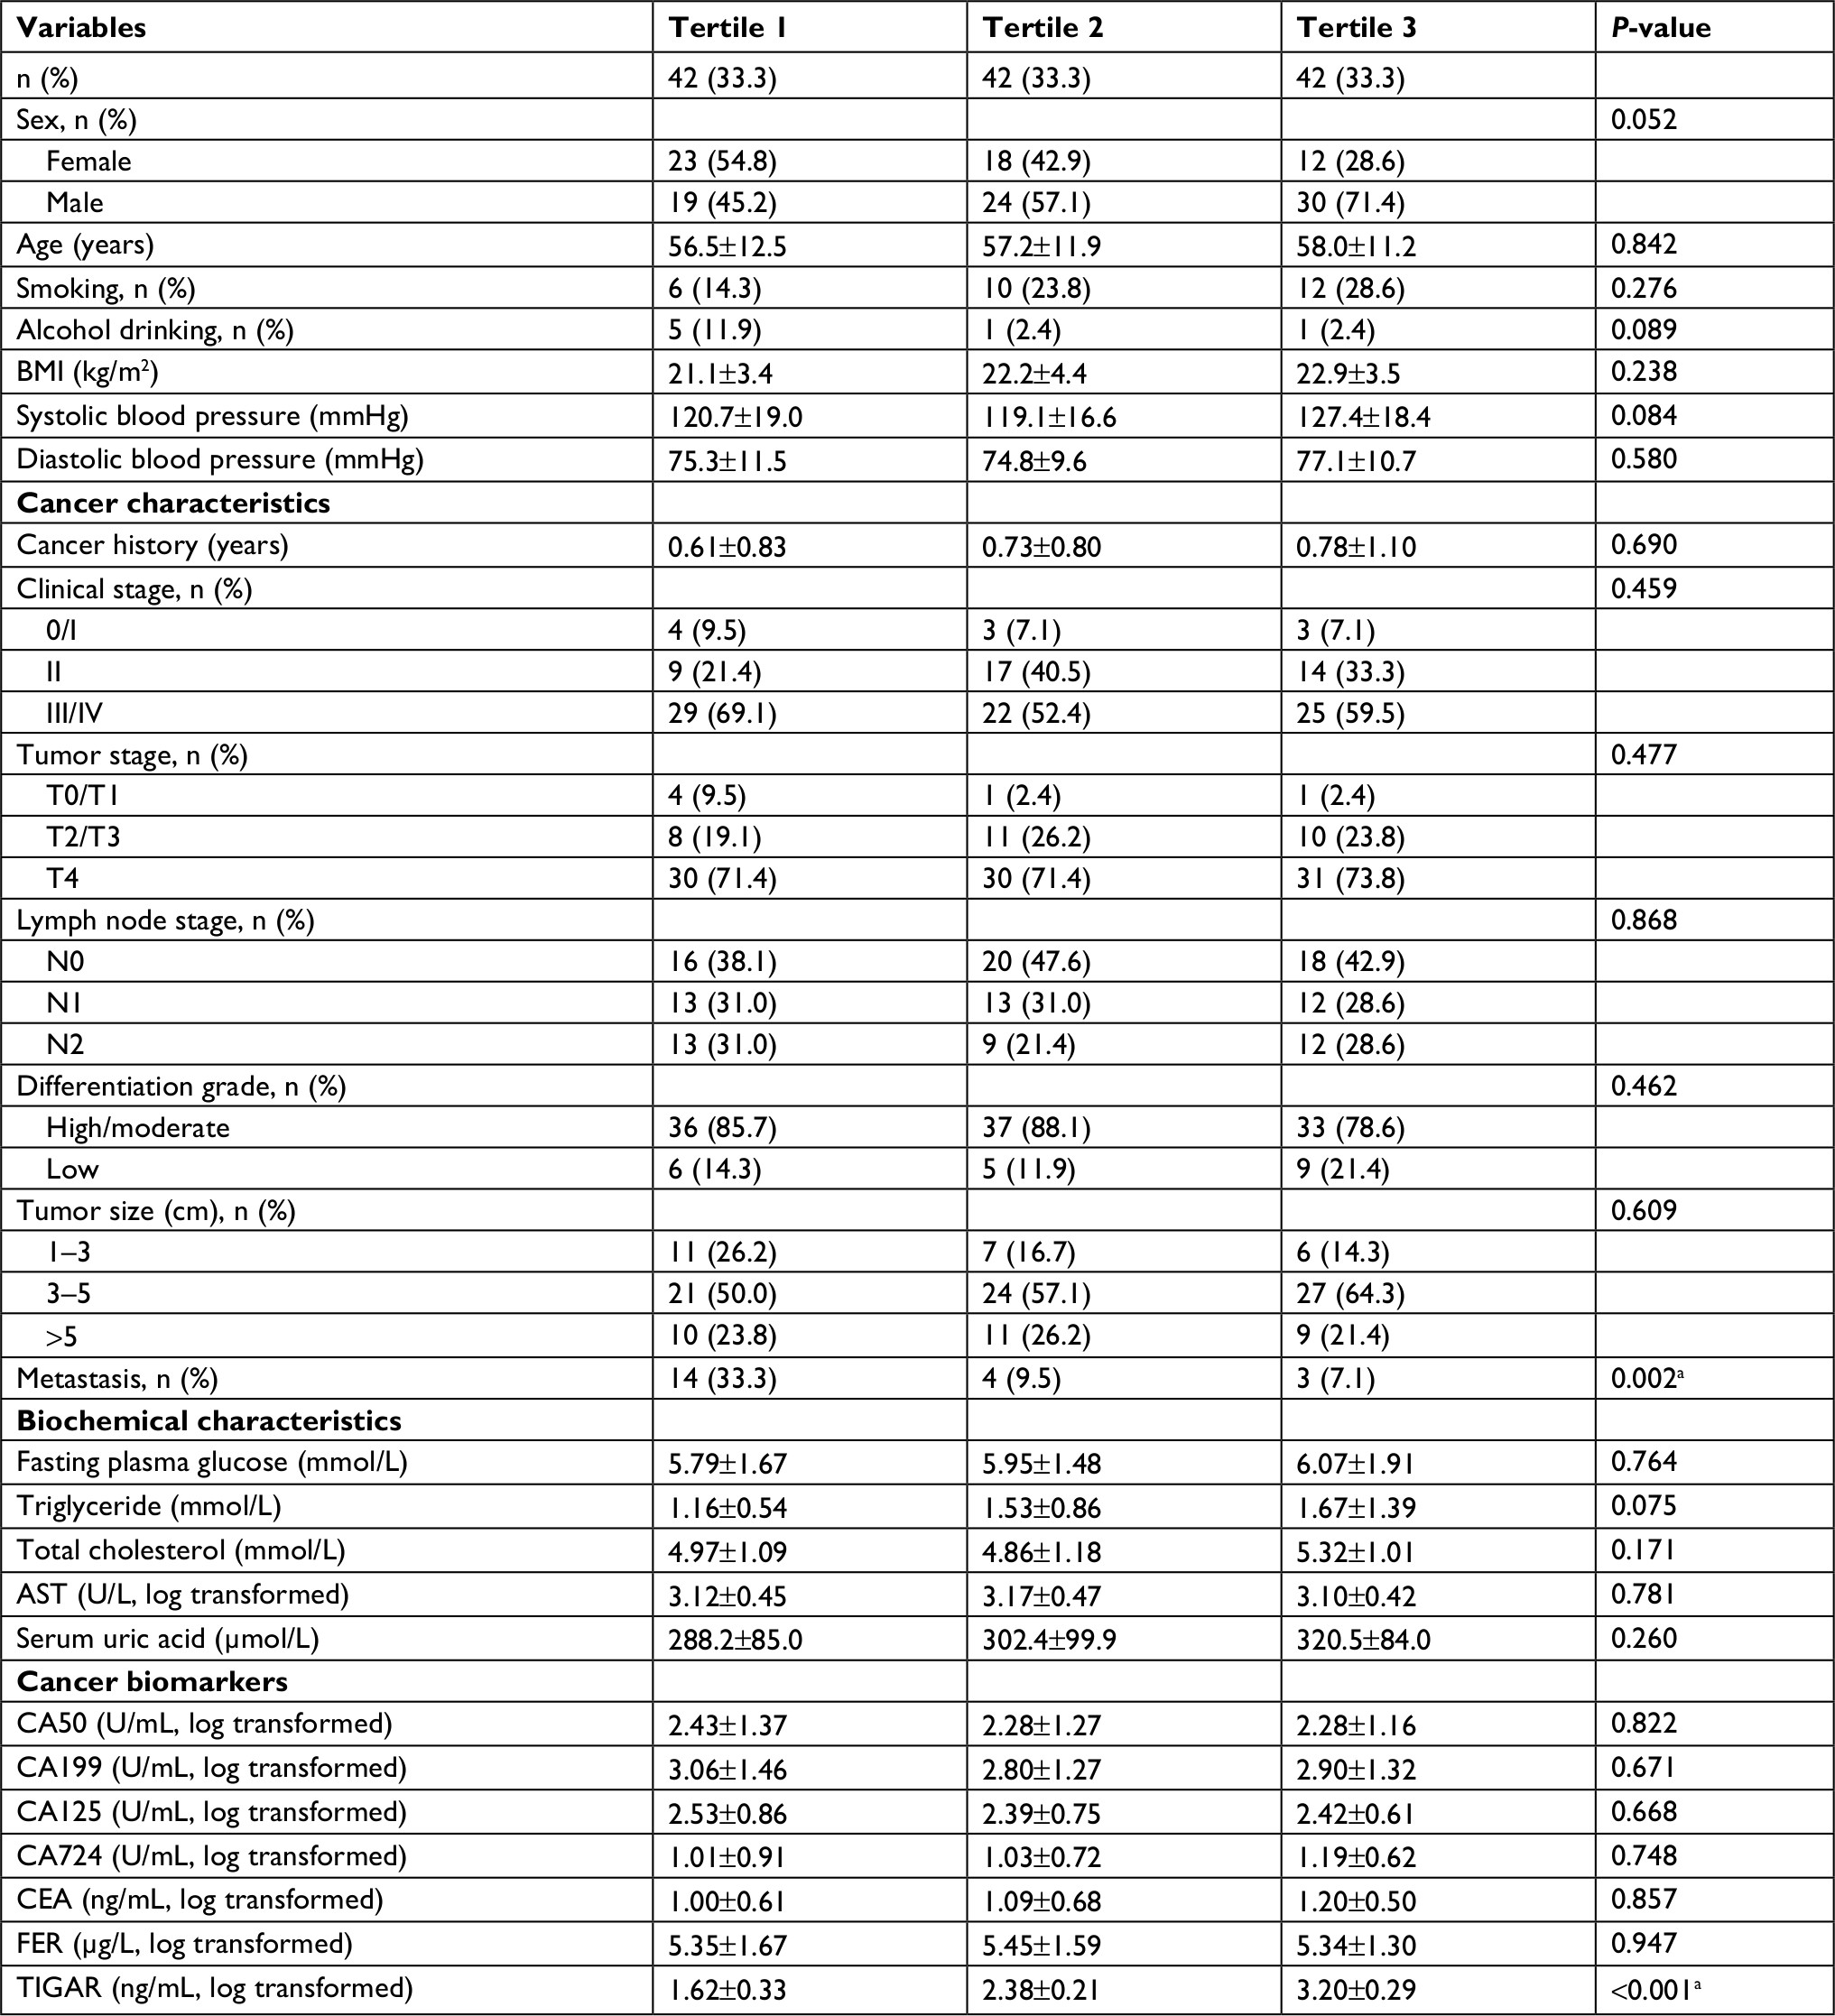 | Table 2 Characteristics of 126 colorectal cancer patients stratified by tertiles of plasma TIGAR levela Notes: aP<0.05. All percentages are column percentage; except for percentages, all values are mean±SD. Abbreviations: AST, aspartate aminotransferase; BMI, body mass index; CA50, carbohydrate antigen 50; CA125, carbohydrate antigen 125; CA199, carbohydrate antigen 199; CA724, carbohydrate antigen 724; CEA, carcinoembryonic antigen; FER, ferritin; TIGAR, TP53-induced glycolysis and apoptosis regulator. |
Correlations of plasma TIGAR with other common cancer biomarkers
Figure 1A–F shows the Pearson correlation of plasma TIGAR with other common serum cancer biomarkers (CA50, CA199, CA125, CA724, CEA, and FER, respectively). All the correlation coefficients were not statistically significant (all P-values >0.05) and low (ranging from –0.068 to –0.032), indicating that there is no correlation between plasma TIGAR and these cancer biomarkers in the studied CRC patients.
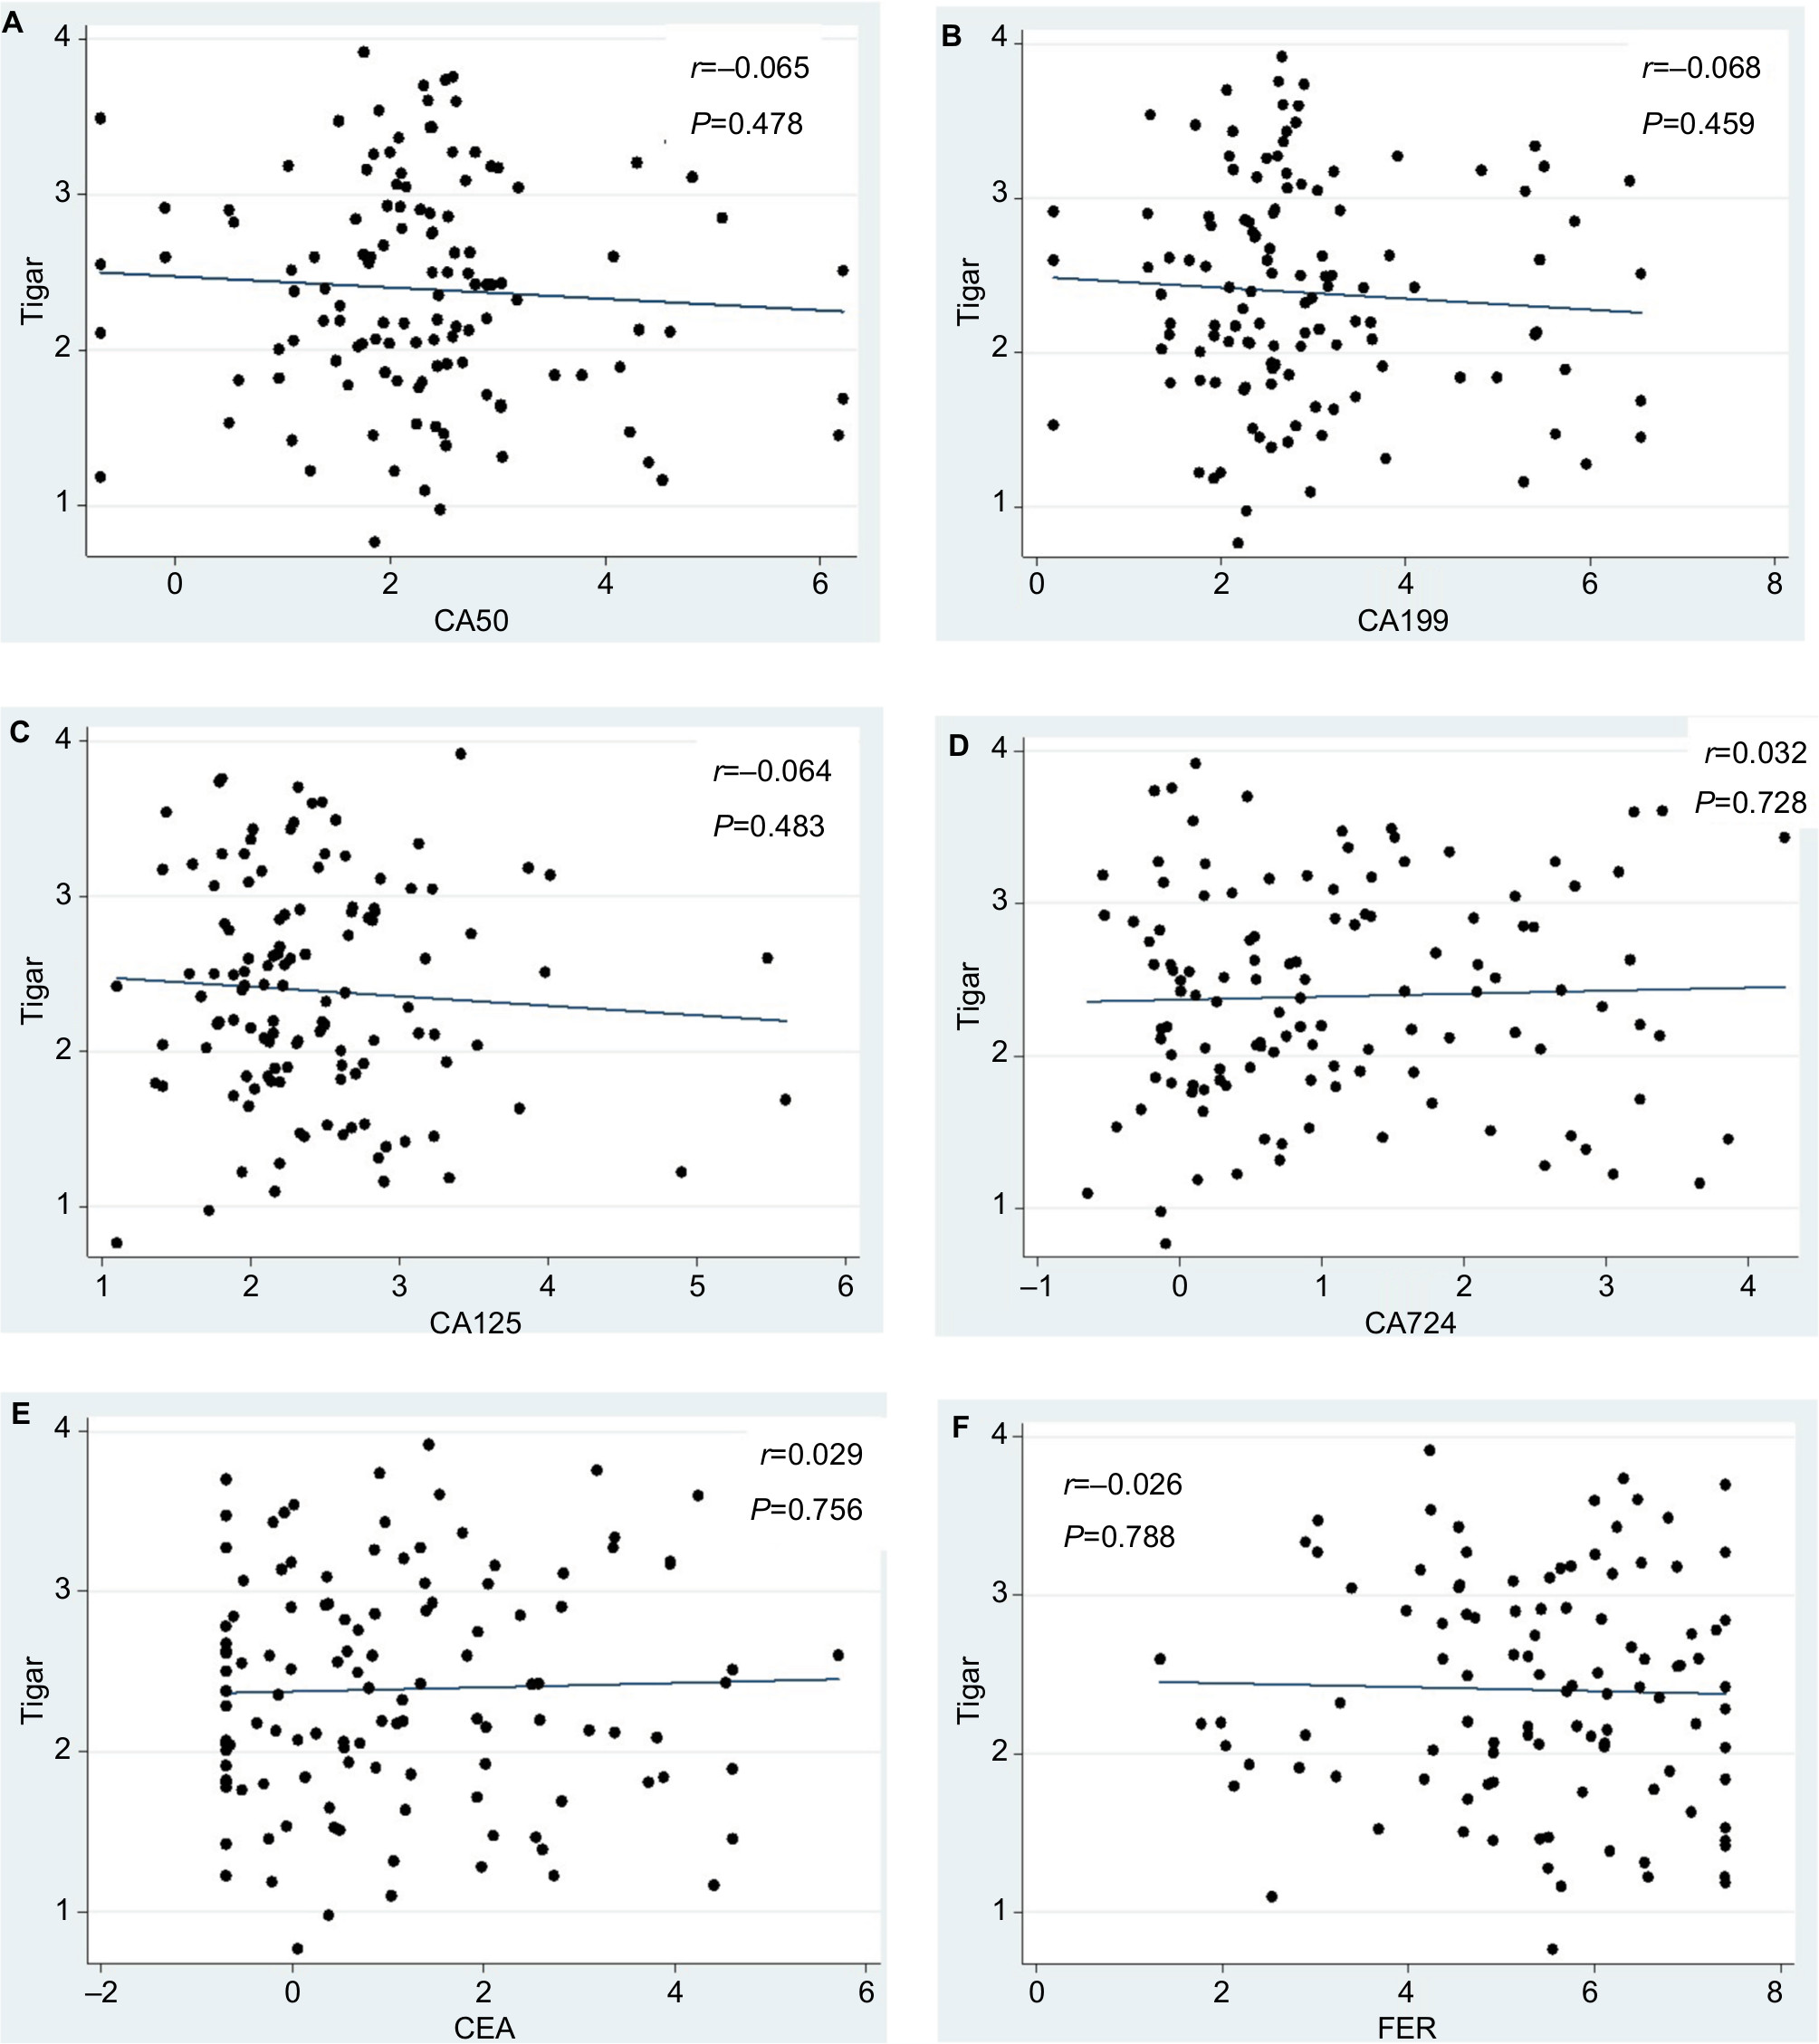 | Figure 1 Correlation between plasma TIGAR and other common serum cancer markers. Notes: (A) Correlation between plasma TIGAR and serum CA50. (B) Correlation between plasma TIGAR and serum CA199. (C) Correlation between plasma TIGAR and serum CA125. (D) Correlation between plasma TIGAR and serum CA724. (E) Correlation between plasma TIGAR and serum CEA. (F) Correlation between plasma TIGAR and serum FER. Abbreviations: CA50, carbohydrate antigen 50; CA199, carbohydrate antigen 199; CA125, carbohydrate antigen 125; CA724, carbohydrate antigen 724; CEA, carcinoembryonic antigen; FER, ferritin; TIGAR, TP53-induced glycolysis and apoptosis regulator. |
Association between plasma TIGAR concentration and CRC metastasis
Table 3 shows the adjusted ORs with associated 95% CI of plasma TIGAR level for CRC metastasis by using the multivariable logistic regression analyses with adjustment for potential confounding factors in three different models. In model 1, without adjustment, higher plasma TIGAR was significantly associated with the decreased risk of CRC metastasis and the adjusted OR (95% CI) of per SD increase in plasma TIGAR was 0.369 (0.166–0.821, P=0.014). When compared with tertile 1 of plasma TIGAR, both tertile 2 and tertile 3 showed significantly decreased risks of CRC metastasis (the adjusted OR [95% CI], 0.211 [0.063–0.709], P=0.012 and 0.154 [0.040–0.586], P=0.006). The trend test showed that increased tertiles of plasma TIGAR were independently associated with the decreased risk of CRC metastasis (P=0.003).
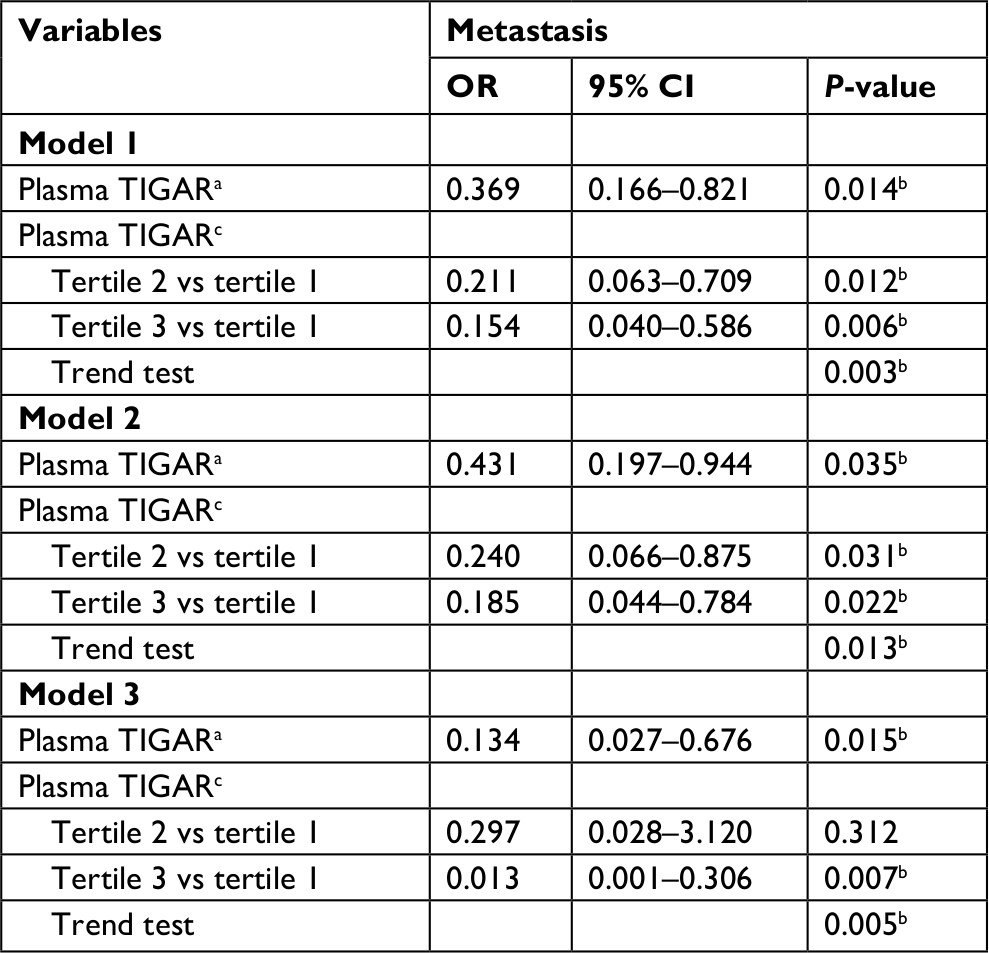 | Table 3 Adjusted ORs with associated 95% CI for association of metastasis with plasma TIGAR Notes: Model 1 was not adjusted. Model 2 was adjusted for age, gender, smoking, and alcohol drinking. Model 3 was further adjusted for BMI, blood pressure, glucose, triglyceride, total cholesterol, AST, serum uric acid, cancer history, cancer clinical stage, tumor stage, lymph node stage, differentiation, tumor size, CA50, CA199, CA125, CA724, CEA, and FER. aOR and 95% CI were expressed by per SD increase in serum TIGAR. bP<0.05. cOR and 95% CI were expressed by the first tertile of serum TIGAR as the reference. Abbreviations: AST, aspartate aminotransferase; BMI, body mass index; CA50, carbohydrate antigen 50; CA125, carbohydrate antigen 125; CA199, carbohydrate antigen 199; CA724, carbohydrate antigen 724; CEA, carcinoembryonic antigen; FER, ferritin; TIGAR, TP53-induced glycolysis and apoptosis regulator. |
In model 2 (adjustments for age, sex, smoking and drinking habits) and model 3 (further adjustments for BMI, blood pressure, glucose, triglyceride, total cholesterol, AST, serum uric acid, cancer history, cancer clinical stage, tumor stage, lymph node stage, differentiation, tumor size, serum CA50, CA199, CA125, CA724, CEA, and FER plus model 2), the adjusted ORs of plasma TIGAR for CRC metastasis were quite similar to those in model 1. In model 3, the adjusted OR (95% CI) was 0.134 (0.027–0.676, P=0.015) for per SD increase of plasma TIGAR concentration and 0.013 (0.001–0.306, P=0.007) for the tertile 3 group compared with the tertile 1 group. Although the adjusted OR for the tertile 2 became statistically unsignificant, the trend test for increasing tertiles significantly showed a negative association between plasma TIGAR level and risk of CRC metastasis (P=0.005).
Diagnostic value of plasma TIGAR concentration on CRC metastasis
Figure 2 shows the ROC curve of plasma TIGAR for CRC metastasis, and the AUC (95% CI) was 0.725 (0.606–0.845, P=0.001). Table 4 shows that the AUCs of CA50, CA199, CA724, and CEA were 0.752 (0.609–0.895), 0.768 (0.643–0.894), 0.763 (0.639–0.886), and 0.771 (0.648–0.894; all P-values<0.05), respectively. When compared differences between AUC of these four serum cancer biomarkers and that of plasma TIGAR, all the differences were not statistically significant (all P-values >0.05).
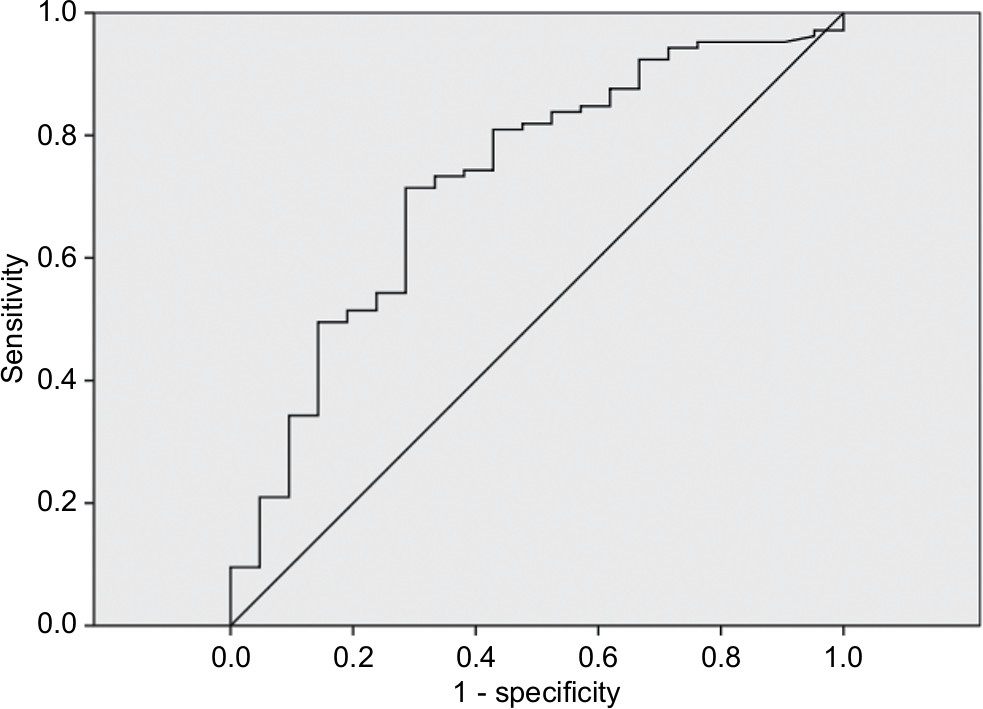 | Figure 2 ROC curve of plasma TIGAR for CRC metastasis. Abbreviations: CRC, colorectal cancer; ROC, receiver operating characteristic; TIGAR, TP53-induced glycolysis and apoptosis regulator. |
 | Table 4 AUC of ROC curves for CRC metastasis Abbreviations: AUC, area under curve; CA50, carbohydrate antigen 50; CA125, carbohydrate antigen 125; CA199, carbohydrate antigen 199; CA724, carbohydrate antigen 724; CEA, carcinoembryonic antigen; CRC, colorectal cancer; FER, ferritin; ROC, receiver operating characteristic; TIGAR, TP53-induced glycolysis and apoptosis regulator. |
Discussion
The present study provided for the first time that CRC patients with metastasis showed significantly decreased plasma TIGAR levels compared to those without metastasis. Even with adjustment for potential confounding factors, higher plasma TIGAR concentration was significantly associated with the decreased risk of CRC metastasis. There was no significant correlation of serum cancer biomarkers, including CA50, CA199, CA724, and CEA, with plasma TIGAR. AUCs of ROC curve of plasma TIGAR for CRC metastasis were moderate and comparable to those cancer biomarkers. We found that an increased plasma TIGAR level is significantly and independently associated with lower risk of CRC metastasis, thus adding a new potential biomarker for CRC metastasis diagnosis.
CRC is the third most commonly diagnosed cancer and cause of cancer-related death worldwide, and almost 90% of CRC-related death results from metastasis.1,2,14 Screening of serological cancer markers is the main noninvasive diagnostic option in monitoring CRC metastasis, while the sensitivity and specificity are still limited.2,15 In the present study, we measured the plasma levels of TIGAR and a serial of serum cancer biomarkers including CA50, CA199, CA125, CA724, CEA, and FER, which are commonly monitored for cancer diagnosis and prognosis of tumor metastasis, recurrence, and survival.2 We found that plasma TIGAR concentration was significantly decreased in CRC patients with metastasis, while the serum levels of CEA, CA50, CA199, and CA724 were all increased. This is consistent with most of the reported results that elevated serum CEA, CA199, CA724, and CA50 levels are associated with CRC metastasis and are useful predictors for CRC metastasis.3,16–18 Due to the limitation of sensitivity and specificity of cancer biomarker assay, combined assay of multiple biomarkers is commonly adopted in cancer screening. Gao et al found that the most sensitive combined markers for two to five were CEA+CA724, CEA+CA724+CA125, CEA+CA199+CA724+CA125, and CEA+CA199+CA724+CA125+FER, respectively, and CEA, CA199, CA724, and CA125 levels were positively correlated with CRC metastasis.3 In our study, we found that patients with metastasis had significantly higher levels of serum cancer biomarkers (CA50, CA199, CA724, and CEA), as well as higher clinical stage, tumor stage, and lymph node stage. We found that AUC of ROC curve of TIGAR on CRC metastasis was about 0.725, which was comparable to those values for the common cancer biomarkers, demonstrating that TIGAR, not identical with traditional cancer biomarkers, has similar diagnosis value for CRC metastasis. Patients with higher serum levels of CA50, CA199, CA724, and CEA and lower levels of plasma TIGAR are more predisposed to CRC metastasis.
Cancer cell survival and proliferation depend predominantly on aerobic glycolysis, which is called the Warburg effect.19 The bifunctional enzyme 6-phoshofructo-2-kinase/fructose-2,6-bisphosphatase (PFK-2/FBPase-2 [PFKFB]) critically controls glycolysis flux via regulating the production of fructose-2, 6-biphosphate (FBP), the most potent positive feedback stimulator for key glycolytic enzyme 6-phoshofructo-1-kinase (PFK-1). TIGAR functions similar to FBPase to inhibit glycolysis, while PFKFB3 (also named as iPFK-2) functions to promote glycolysis. Al-Khayal et al12 showed that TIGAR is expressed in the early stage of CRC and is maintained at high levels through late stages in cancer cells. TIGAR acted as an oncogene in nasopharyngeal carcinoma (NPC) tumorigenesis, and knockdown of TIGAR inhibited tumor growth via activation of NF-κB pathway.20 Deletion of TIGAR sensitizes cancer cells to radiotherapy and chemotherapy in glioma and CRC cells.9,21 When overexpressed, TIGAR protects chronic lymphocytic leukemia (CLL) cells from spontaneous apoptosis and is closely correlated with worse clinical outcome in CLL patients.13 TIGAR protection of cancer cell survival involves the mechanism of reactive oxidative species (ROS) clearance and DNA repairment.8,22As for the prognostic value in tumor invasion and metastasis, Shen et al10 found that downregulation of TIGAR reduced the non-small cell lung cancer (NSCLC) cell invasion and metastasis, and patients with high co-expression of TIGAR and Met showed worse survival. Another study reported that NSCLC patients with negative expression of TIGAR had worse clinical outcome than those with positive TIGAR expression, and TIGAR expression was negatively correlated with glucose uptake.23 In the present study, we found that plasma TIGAR levels were significantly decreased in CRC patients with metastasis, who had higher levels of clinical stage, tumor stage, lymph node stage, serum cancer biomarkers, and lower differentiation grade, and the metastasis more frequently occurred in patients with colon cancer than in patients with rectal cancer. Of note, in most reported studies so far, an increased expression of TIGAR was referred to the mRNA and/or protein levels in solid tumor tissues or cells, implying that higher TIGAR levels is required for maintaining the survival and/or proliferation of cancer cells, at least in situ in solid cancer tissues or cells. This is the first time that we measured TIGAR concentration in the plasma and showed its negative association with CRC metastasis.
TIGAR functions similar to FBPase and protects cancer cell survival via inhibiting glycolysis and promoting PPP, while the allosteric fructokinase, PFKFB3, is found to be overexpressed to promote glycolysis in variety of cancers including CRC and stomach, prostate, breast, ovary, and thyroid cancers and is associated with cancer cell proliferation, migration, invasion, and metastasis.24–27 Cancer cells consume higher amounts of glucose via glycolysis to satisfy their exuberant energetic and anabolic needs. PFKFB3 is closely associated with tumor metastasis, and blockade of PFKFB3 did not affect the tumor growth, but reduced cancer cell invasion, intravasation, and metastasis.27 It would be paradoxical if TIGAR and PFKFB3, the two enzymes with opposite action, work simultaneously on glycolysis to promote cancer cell survival. Indeed, it was reported that TIGAR expression was increased when PFKFB3 was knocked down in Hela cells,28 and knockdown of TIGAR activated glycolysis through PFKFB3 upregulation in human leukemia cells.29 Because of the limitation that this is a cross-sectional observation study, we could not find the original source of plasma TIGAR and thus could not differentiate whether the decreased plasma TIGAR resulted from decreased expression and/or release of TIGAR from the primary cancer cells or was exhausted in supporting or promoting cell migration during metastasis. Metastasis occurrence largely depends on the cross-talk between selected cancer cells (the “seeds”) and specific organ microenvironments,30 and TIGAR does have a complicate interaction with the surrounding microenvironment, with FBPase or even non-FBPase functions.11,31
Conclusion
The present study found that CRC patients with metastasis had increased serum levels of most common cancer biomarkers and decreased plasma levels of TIGAR compared with their controls. Moreover, the decreased plasma TIGAR was independently associated with higher risk of CRC metastasis with adjustment for potential confounding factors. Our results demonstrated the diagnostic value of TIGAR on CRC metastasis, which was moderate and comparable to those of common cancer biomarkers: CRC patients, with higher serum concentrations of CEA, CA199, CA724, and CA50, and lower plasma TIGAR concentration, are at a high risk of metastasis. Therefore, our findings underscore the roles of TIGAR, contributing to the pathogenesis and diagnostic values in CRC metastasis.
A few limitations in the present study should be recognized. The first was that study patients were selected from one hospital only and were not randomly sampled; therefore, we may not truly estimate the association between plasma TIGAR concentration and CRC metastasis and should be cautious when generalizing our findings to other CRC patients. Second, the sample size in the present study was quite small. Third, because our study was designed as a cross-sectional study, we cannot determine the temporal sequence of plasma TIGAR and CRC metastasis and thus cannot preclude the possibility of reverse causality between plasma TIGAR and CRC metastasis. Therefore, an independent cohort with larger sample size, especially from a prospective cohort study design, should be conducted to validate our findings in future.
Acknowledgment
This work was supported by grants from National Natural Science Foundation of China (81270901), Key project of Fujian Provincial Science and Technology Planning programs (2012D60), Xiamen Innovation Program for Outstanding Youth Scientist (2011S0446) to SL, and Fujian Natural Science Foundation (2018J01379) to XL.
Availability of data and materials
Data will be made available to other researchers upon request on a case-by-case basis assessment. Users will be required to complete a data sharing agreement.
Disclosure
The authors report no conflicts of interest in this work.
References
Tinmouth J, Vella ET, Baxter NN, et al. Colorectal cancer screening in average risk populations: evidence summary. Can J Gastroenterol Hepatol. 2016;2016:1–18. | ||
Pellino G, Gallo G, Pallante P, et al. Noninvasive biomarkers of colorectal cancer: role in diagnosis and personalised treatment perspectives. Gastroenterol Res Pract. 2018;2018:2397863–21. | ||
Gao Y, Wang J, Zhou Y, Sheng S, Qian SY, Huo X. Evaluation of serum CEA, CA19-9, CA72-4, CA125 and ferritin as diagnostic markers and factors of clinical parameters for colorectal cancer. Sci Rep. 2018;8(1):2732. | ||
Lei XF, Jia SZ, Ye J, et al. Application values of detection of serum CA199, CA242 and CA50 in the diagnosis of pancreatic cancer. J Biol Regul Homeost Agents. 2017;31(2):383–388. | ||
Feng F, Tian Y, Xu G, et al. Diagnostic and prognostic value of CEA, CA19-9, AFP and CA125 for early gastric cancer. BMC Cancer. 2017;17(1):737. | ||
Wang M, Wang W, Kang TS, Leung CH, Ma DL. Development of an Iridium(III) complex as a G-quadruplex probe and its application for the G-quadruplex-based luminescent detection of picomolar insulin. Anal Chem. 2016;88(1):981–987. | ||
Ferracin M, Lupini L, Mangolini A, Negrini M. Circulating non-coding RNA as biomarkers in colorectal cancer. Adv Exp Med Biol. 2016;937:171–181. | ||
Bensaad K, Tsuruta A, Selak MA, et al. TIGAR, a p53-inducible regulator of glycolysis and apoptosis. Cell. 2006;126(1):107–120. | ||
Li B, Wang Z, Xie JM, et al. TIGAR knockdown enhanced the anticancer effect of aescin via regulating autophagy and apoptosis in colorectal cancer cells. Acta Pharmacol Sin. 2018;0:1–11. | ||
Shen M, Zhao X, Zhao L, et al. Met is involved in TIGAR-regulated metastasis of non-small-cell lung cancer. Mol Cancer. 2018;17(1):88. | ||
Ko YH, Domingo-Vidal M, Roche M, et al. TP53-Inducible Glycolysis and Apoptosis Regulator (TIGAR) metabolically reprograms carcinoma and stromal cells in breast cancer. J Biol Chem. 2016;291(51):26291–26303. | ||
Al-Khayal K, Abdulla M, Al-Obeed O, et al. Identification of the TP53-induced glycolysis and apoptosis regulator in various stages of colorectal cancer patients. Oncol Rep. 2016;35(3):1281–1286. | ||
Hong M, Xia Y, Zhu Y, et al. TP53-induced glycolysis and apoptosis regulator protects from spontaneous apoptosis and predicts poor prognosis in chronic lymphocytic leukemia. Leuk Res. 2016;50:72–77. | ||
Fidler IJ. The pathogenesis of cancer metastasis: the ‘seed and soil’ hypothesis revisited. Nat Rev Cancer. 2003;3(6):453–458. | ||
Yang W, Luo Y, Hu S, Li Y, Liu Q. Value of combined detection of serum carcino-embryonic antigen, carbohydrate antigen 19-9 and cyclooxygenase-2 in the diagnosis of colorectal cancer. Oncol Lett. 2018;16(2):1551–1556. | ||
Li Q, Dai W, Li Y, Xu Y, Li X, Cai S. Nomograms for predicting the prognostic value of serological tumor biomarkers in colorectal cancer patients after radical resection. Sci Rep. 2017;7:46345. | ||
Zhai H, Huang J, Yang C, Fu Y, Yang B. Serum CEA and CA19-9 levels are associated with the presence and severity of colorectal neoplasia. Clin Lab. 2018;64(3):351–356. | ||
Zhong W, Yu Z, Zhan J, et al. Association of serum levels of CEA, CA199, CA125, CYFRA21-1 and CA72-4 and disease characteristics in colorectal cancer. Pathol Oncol Res. 2015;21(1):83–95. | ||
Vander Heiden MG, Cantley LC, Thompson CB. Understanding the warburg effect: the metabolic requirements of cell proliferation. Science. 2009;324(5930):1029–1033. | ||
Zhao M, Fan J, Liu Y, et al. Oncogenic role of the TP53-induced glycolysis and apoptosis regulator in nasopharyngeal carcinoma through NF-κB pathway modulation. Int J Oncol. 2016;48(2):756–764. | ||
Peña-Rico MA, Calvo-Vidal MN, Villalonga-Planells R, et al. TP53 induced glycolysis and apoptosis regulator (TIGAR) knockdown results in radiosensitization of glioma cells. Radiother Oncol. 2011;101(1):132–139. | ||
Yu HP, Xie JM, Li B, et al. TIGAR regulates DNA damage and repair through pentosephosphate pathway and Cdk5-ATM pathway. Sci Rep. 2015;5:9853. | ||
Zhou X, Xie W, Li Q, et al. TIGAR is correlated with maximal standardized uptake value on FDG-PET and survival in non-small cell lung cancer. PLoS One. 2013;8(12):e80576. | ||
Atsumi T, Chesney J, Metz C, et al. High expression of inducible 6-phosphofructo-2-kinase/fructose-2,6-bisphosphatase (iPFK-2; PFKFB3) in human cancers. Cancer Res. 2002;62(20):5881–5887. | ||
Han J, Meng Q, Xi Q, Wang H, Wu G. PFKFB3 was overexpressed in gastric cancer patients and promoted the proliferation and migration of gastric cancer cells. Cancer Biomark. 2017;18(3):249–256. | ||
Li HM, Yang JG, Liu ZJ, et al. Blockage of glycolysis by targeting PFKFB3 suppresses tumor growth and metastasis in head and neck squamous cell carcinoma. J Exp Clin Cancer Res. 2017; 36(1):7. | ||
Cantelmo AR, Conradi LC, Brajic A, et al. Inhibition of the Glycolytic Activator PFKFB3 in Endothelium Induces Tumor Vessel Normalization, Impairs Metastasis, and Improves Chemotherapy. Cancer Cell. 2016;30(6):968–985. | ||
Simon-Molas H, Calvo-Vidal MN, Castaño E, et al. Akt mediates TIGAR induction in HeLa cells following PFKFB3 inhibition. FEBS Lett. 2016;590(17):2915–2926. | ||
Qian S, Li J, Hong M, et al. TIGAR cooperated with glycolysis to inhibit the apoptosis of leukemia cells and associated with poor prognosis in patients with cytogenetically normal acute myeloid leukemia. J Hematol Oncol. 2016;9(1):128. | ||
Fidler IJ. Seed and soil revisited: contribution of the organ microenvironment to cancer metastasis. Surg Oncol Clin N Am. 2001;10(2):257vii–2690. | ||
Cheung EC, Ludwig RL, Vousden KH. Mitochondrial localization of TIGAR under hypoxia stimulates HK2 and lowers ROS and cell death. Proc Natl Acad Sci U S A. 2012;109(50):20491–20496. |
 © 2018 The Author(s). This work is published and licensed by Dove Medical Press Limited. The full terms of this license are available at https://www.dovepress.com/terms.php and incorporate the Creative Commons Attribution - Non Commercial (unported, v3.0) License.
By accessing the work you hereby accept the Terms. Non-commercial uses of the work are permitted without any further permission from Dove Medical Press Limited, provided the work is properly attributed. For permission for commercial use of this work, please see paragraphs 4.2 and 5 of our Terms.
© 2018 The Author(s). This work is published and licensed by Dove Medical Press Limited. The full terms of this license are available at https://www.dovepress.com/terms.php and incorporate the Creative Commons Attribution - Non Commercial (unported, v3.0) License.
By accessing the work you hereby accept the Terms. Non-commercial uses of the work are permitted without any further permission from Dove Medical Press Limited, provided the work is properly attributed. For permission for commercial use of this work, please see paragraphs 4.2 and 5 of our Terms.