")
Back to Journals » OncoTargets and Therapy » Volume 9
Higher expression levels of the HOXA9 gene, closely associated with MLL-PTD and EZH2 mutations, predict inferior outcome in acute myeloid leukemia
Authors Gao L, Sun J, Liu F, Zhang H , Ma Y
Received 27 August 2015
Accepted for publication 31 December 2015
Published 9 February 2016 Volume 2016:9 Pages 711—722
DOI https://doi.org/10.2147/OTT.S95279
Checked for plagiarism Yes
Review by Single anonymous peer review
Peer reviewer comments 3
Editor who approved publication: Professor Daniele Santini
Li Gao,1,* Junzhong Sun,2,* Fang Liu,2,3,* Hui Zhang,1 Yigai Ma1
1Department of Hematology, China–Japan Friendship Hospital, 2Department of Hematology and Oncology, The First Affiliated Hospital of Chinese PLA General Hospital, 3Department of Oncology, Chinese PLA General Hospital, Beijing, People’s Republic of China
*These authors contributed equally to this work
Background: Although the biological insight of acute myeloid leukemia (AML) has increased in the past few years, the discovery of novel discriminative biomarkers remains of utmost value for improving outcome predictions. Systematical studies concerning the clinical implications and genetic correlations of HOXA9 aberrations in patients with AML are relatively promising.
Materials and methods: Here, we investigated mutational status and the mRNA levels of the HOXA9 gene in 258 patients with AML. Furthermore, hematological characteristics, chromosome abnormalities, and genetic mutations associated with AML were analyzed, followed by the assessment of clinical survival. Besides, the expression level and mutational status of MEIS1, a cofactor of HOXA9, were also detected in patients with AML with the aim of a deeper understanding about the homeodomain-containing transcription factors associated with hematological characteristics.
Results: HOXA9 and MEIS1 mutations were detected in 4.26% and 3.49% AML cases, respectively. No correlations were detected between mutation status and clinical characteristics, cytogenetic and genetic aberrations, and clinical survival. Higher HOXA9 expression levels were correlated with white blood cell count and closely associated with unfavorable karyotype as well as MLL-PTD and EZH2 mutations, whereas, there was an inverse correlation with the French–American–British M3 subtype. Compared with patients with lower HOXA9 expression levels, those with higher HOXA9 expression levels had a lower complete remission rate and inferior survivals in both AML and cytogenetically normal AML.
Conclusion: HOXA9 expression may serve as a promising biomarker to ameliorate a prognostic model for predicting clinical outcome and consummating individualized treatment in patients with AML.
Keywords: acute myeloid leukemia, HOXA9, expression, clinical survival
Introduction
Recent cytogenetic and genetic findings have described the molecular mechanisms underpinning hematological cell malignant transformation and progression.1 There are a number of well-established models for the cytogenetic and genetic classification of acute myeloid leukemia (AML) into different prognostic groups.2,3 Although the biological insight of AML has increased in the past decade, the discovery and assessment of novel discriminative biomarkers remain of utmost value for improving outcome predictions.4,5
A sizable amount of new data points to a vital role for the HOX family of homeobox genes in hematopoietic development.6,7 Increasing evidence and theoretical basis promulgated and attested that aberrant HOXA expression is functionally significant in myeloid transformation. One of them, HOXA9, part of the cluster on chromosome 7p15, is expressed under specific physiological and molecular environments in primitive hematopoietic cells of human origin and encodes a DNA-binding transcription factor that may participate in the regulation of gene expression, thus coordinate morphogenesis and differentiation.8,9 The expression pattern of HOXA9 in hematopoietic cells is specific to both lineage and differentiation stage. This expression is downregulated as blood cells differentiate, indicating a distinctive function in early hematopoiesis.10,11 An increasing amount of evidence demonstrated that HOXA9 overexpression maintains the self-renewal capacity of leukemic stem cells and blocks their differentiation, thus contributing to leukemogenesis and frequently occurring in association with 11q23 translocations and 11p15 translocations.12–15
Considering various expressions of HOXA9 in leukemic and normal bone marrow cells and its crucial role in the regulation of hematopoietic development and differentiation, clinical impacts of the HOXA9 transcript level and mutational status in adult AML, as well as the correlations with genetic aberrations, are not yet fully and systematically understood. In this study, we sought to characterize the clinical relevance of the HOXA9 transcript level and mutational status, followed by the correlation between HOXA9 aberrations with cytogenetic data, mutation status, and clinical prognosis. Besides, various AML studies have elaborated dysregulation of HOXA9, almost always in association with abnormal expression of its cofactor Meis homeobox 1 (MEIS1).16,17 In addition, a wide range of data suggests that HOXA9 and MEIS1 play a synergistic causative role in AML, although the molecular mechanisms leading to transformation by HOXA9 and MEIS1 remain elusive.18–20 Hence, in this study, the expression level and mutational status of MEIS1 were also detected in patients with AML with the aim of a deeper understanding about the homeodomain-containing transcription factors contributing to leukemogenesis.
Materials and methods
Patient samples
A total of 258 patients with newly diagnosed AML and 25 healthy donors attending China-Japan Friendship Hospital, Chinese PLA General Hospital, and the First Affiliated Hospital of Chinese PLA General Hospital between July 2006 and March 2015 were enrolled in this study. The study was approved by the ethics committees of the China-Japan Friendship Hospital, Chinese PLA General Hospital, and the First Affiliated Hospital of Chinese PLA General Hospital. Written informed consent was obtained from each patient for sample preservations and aenetics analyses. Diagnosis and classification of AML were made according to French–American–British (FAB) cooperative group’s criteria. Available clinical characteristics were age, sex, FAB subtype, white blood cell and platelet counts, amount of bone marrow blasts, and hemoglobin levels. All patients with non-M3 AML received intensive induction therapy with daunorubicin and cytarabine or mitoxantrone and cytarabine or decitabine (demethylating treatment) followed by consolidation therapy with cytarabine-based therapy. For M3 patients with t(15;17), all-trans retinoic acid and arsenic trioxide-based treatment was given for induction and consolidation therapy, of which five patients were treated with cytarabine-based therapy as a part of consolidation for high-risk diagnosis. Twenty-nine patients underwent allogeneic hematopoietic stem cell transplantation and 26 patients received autologous hematopoietic stem cell transplantation. The clinical characteristics of the patients are described in Table 1.
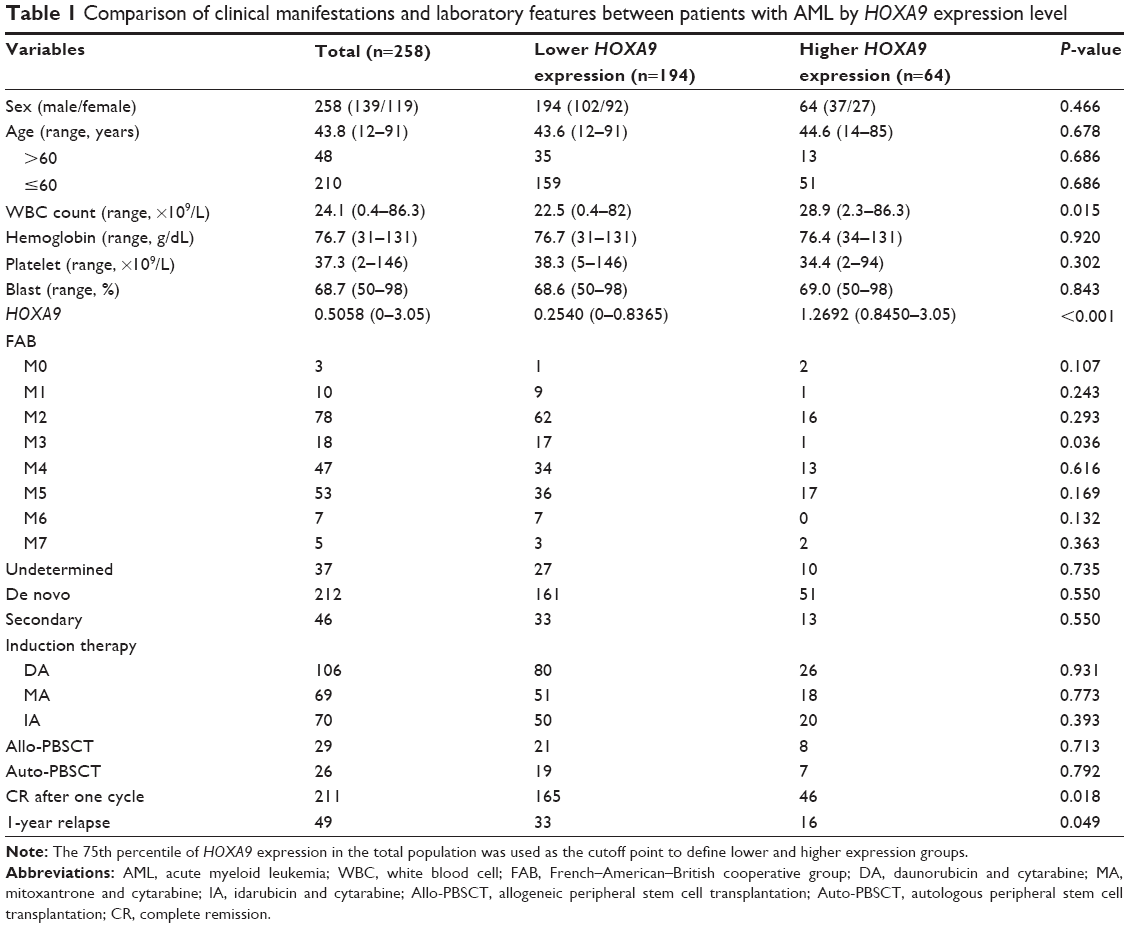 | Table 1 Comparison of clinical manifestations and laboratory features between patients with AML by HOXA9 expression level |
Clinical end points
Complete remission (CR) was defined as recovery of morphologically normal bone marrow and blood counts and no circulating leukemic blasts or evidence of extramedullary leukemia. Relapse was defined as ≥5% bone marrow blasts, circulating leukemic blasts, or the development of extramedullary leukemia. Overall survival (OS) was calculated from the date of diagnosis until the date of death and was censored for patients who were alive at the last follow-up. Relapse-free survival (RFS) was defined as the time from the date of CR until the date of relapse or death regardless of cause and was censored for patients who were alive at the last follow-up.
Karyotype analysis
Cytogenetic analysis was performed in bone marrow samples that were obtained during diagnosis using a direct method or short-term culture. Cytogenetic reports were independently reviewed by two expert cytogeneticists who were blinded to the patients’ clinicopathological information. Metaphase chromosomes were banded by G-banding techniques, while chromosomal abnormalities were described according to the International System for Human Cytogenetic Nomenclature.21 The diagnosis of normal cytogenetics or cytogenetic aberrations was based on the analysis of ≥20 metaphases in specimens. Complex cytogenetic abnormalities were defined as the presence of at least three unrelated cytogenetic abnormalities in one clone. According to the published criteria adopted by Southwest Oncology Group, cytogenetic abnormalities were grouped as favorable, intermediate, and unfavorable.22 Patients with chromosome 5 or 7 abnormalities and inv(16)/t(16;16) and 11q23 abnormalities were confirmed by fluorescence in situ hybridization (FISH).
Reverse transcription and real-time quantitative polymerase chain reaction
Bone marrow mononuclear cells were purified by density centrifugation using the standard Ficoll-Hypaque method. Total RNA was isolated from bone marrow mononuclear cells using Qiazol isolation reagent (Qiagen NV, Venlo, the Netherlands) and subsequently reverse transcribed to cDNA using a reverse transcription kit (Promega Corporation, Fitchburg, WI, USA).
We performed real-time quantitative polymerase chain reaction (qPCR) to quantify HOXA9 and MEIS1 transcripts in samples from all patients using the HOXA9, MEIS1, and ABL1 primers and probes shown in Table S1. The qPCR protocol was performed in a 40 μL volume with TaqMan Universal Master Mix (Thermo Fisher Scientific, Waltham, MA, USA), 0.25 μM appropriate primers and probes, and 20 ng of cDNA. The qPCR protocol included 40 cycles of denaturation for 15 seconds at 95°C and annealing for 60 seconds at 60°C. A standard curve was produced for the HOXA9 and MEIS1 gene by tenfold serial dilutions of five different plasmid concentrations. Relative HOXA9 and MEIS1 expression levels were calculated as the ratio of copies of HOXA9 or MEIS1 and ABL1. For all qPCR assays, a reference dilution was analyzed, and the standard curve was loaded over this reference dilution range.
Detection of gene mutations
All coding exons of the longest known HOXA9 and MEIS1 genes were amplified from genomic DNA by PCR and were analyzed by direct sequencing. Other mutation analyses were performed for hyperfrequency mutational sites of ASXL1, CEBPA, FLT3, IDH1, NRAS, RUNX1, TET2, DNMT3A, SF3B1, U2AF1, SRSF2, SETBP1, TP53, NPM1, EZH2, MLL, UTX, and KIT, with the exons studied being as follows: ASXL1 exon 12, CEBPA exon 1, FLT3 exons 14, 15, and 20, IDH1 exon 4, NRAS exons 1 and 2, RUNX1 exons 1–8, TET2 exons 3–11, DNMT3A exons 22 and 23, SF3B1 exons 3–16, SRSF2 exons 1–2, SETBP1 exon 4, TP53 exons 2–8, NPM1 exons 3–10, EZH2 exon 14–19, MLL exons 2–6, UTX exons 2–12, and KIT exons 8–17.23–30 The primers for sequencing are listed in Table S2. PCR fragments were sequenced directly and analyzed using Sequencing Analysis Software Version 5.3.1 (Thermo Fisher Scientific). Abnormal sequencing results were confirmed by at least two repeated analyses.
Statistical analysis
The statistical analysis was performed using SPSS 20.0 software (IBM Corporation, Armonk, NY, USA). Chi-squared analysis and Fisher’s exact test (for categorical variables) were used to compare patient groups. The correlation between the frequency of HOXA9 expression levels and clinical parameters was analyzed with Pearson’s and Spearman’s rank correlations. OS curves were plotted using the Kaplan–Meier method and compared using the log-rank test. The median time between visits was 42 months (range, 8–89 months). Hazard ratios and 95% confidence intervals were estimated by Cox proportional hazards regression models to determine the independent risk factors associated with survival in multivariate analyses. For all analyses, P-values were two-tailed, and P<0.05 value was considered statistically significant.
Results
Associations of HOXA9 and MEIS1 expression with hematological parameters
We measured the expression of HOXA9 and MEIS1 transcripts in a total of 258 patients with AML using qPCR. Occasionally, 25 healthy donors were also detected for expression of HOXA9 and MELSI. The mean expression levels of HOXA9 and MEIS1 in the AML samples were 50.58% and 60.34%, respectively, while those in the healthy bone marrow samples were only 3.74% and 2.23%, respectively. HOXA9 and MEIS1 expressions were significantly higher in patients with AML than in healthy bone marrow donors (Figure S1A and B; both P<0.001). In addition, HOXA9 expression levels were lower in de novo AML compared with those in secondary AML (Figure 1A; P=0.041), whereas this difference did not occur concerning MEIS1 expression levels in de novo AML compared with secondary AML (Figure 1B). Moreover, as shown in Figure 1C, HOXA9 expression levels were not equally distributed among the FAB subtypes. The patients with M3 had lower transcript levels than the individuals with the other FAB subtypes (P=0.043). However, MEIS1 expression levels did not demonstrate equivalent significant difference between FAB subtypes (Figure 1D). Among the whole group, Spearman’s rank correlation showed that white blood cell count was significantly correlated with HOXA9 expression (Figure 1E; P=0.001 and R=0.199). Nevertheless, no significant correlation was discovered of MEIS1 expression with white blood cell count (Figure 1F; P=0.086 and R=0.116).
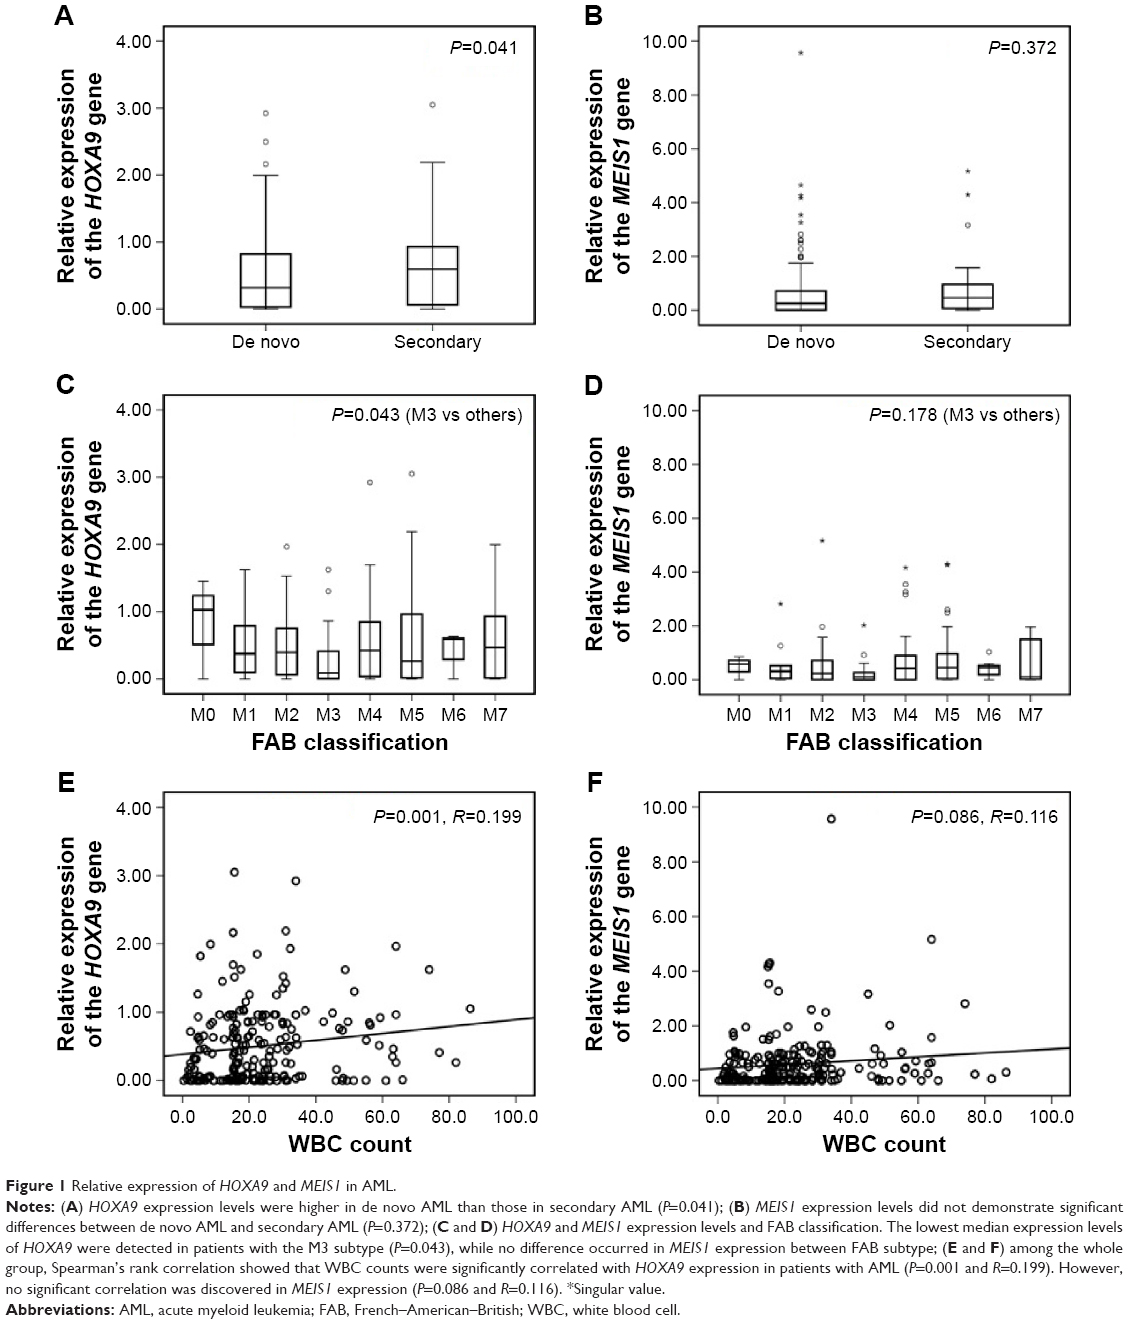 | Figure 1 Relative expression of HOXA9 and MEIS1 in AML. |
Prevalence and clinical associations of HOXA9 and MEIS1 mutations
Of 258 patients, variations in the HOXA9 and MEIS1 coding sequence in eleven and nine patients, respectively, were identified. Mutations predicted to result in missense changes occurred most frequently and were distributed throughout all coding exons. Analyses of remission bone marrow samples showed that all evaluable mutations were conquered. Thus, the frequencies of HOXA9 and MEIS1 mutations in our cohort were 4.26% and 3.49%, respectively. The details of HOXA9 and MEIS1 mutations are shown in Tables S3 and S4. Furthermore, associations of HOXA9 and MEIS1 mutations with pretreatment demographic, clinical, and molecular characteristics were analyzed, and no significant differences were exhibited (data are not shown). Moreover, Kaplan–Meier analysis indicated that impacts of HOXA9 and MEIS1 mutations on clinical outcome with non-M3 patients did not denote significant differences (RFS: P=0.119 and P=0.263, respectively; OS: P=0.113 and P=0.141, respectively). The data are shown in Figure 2.
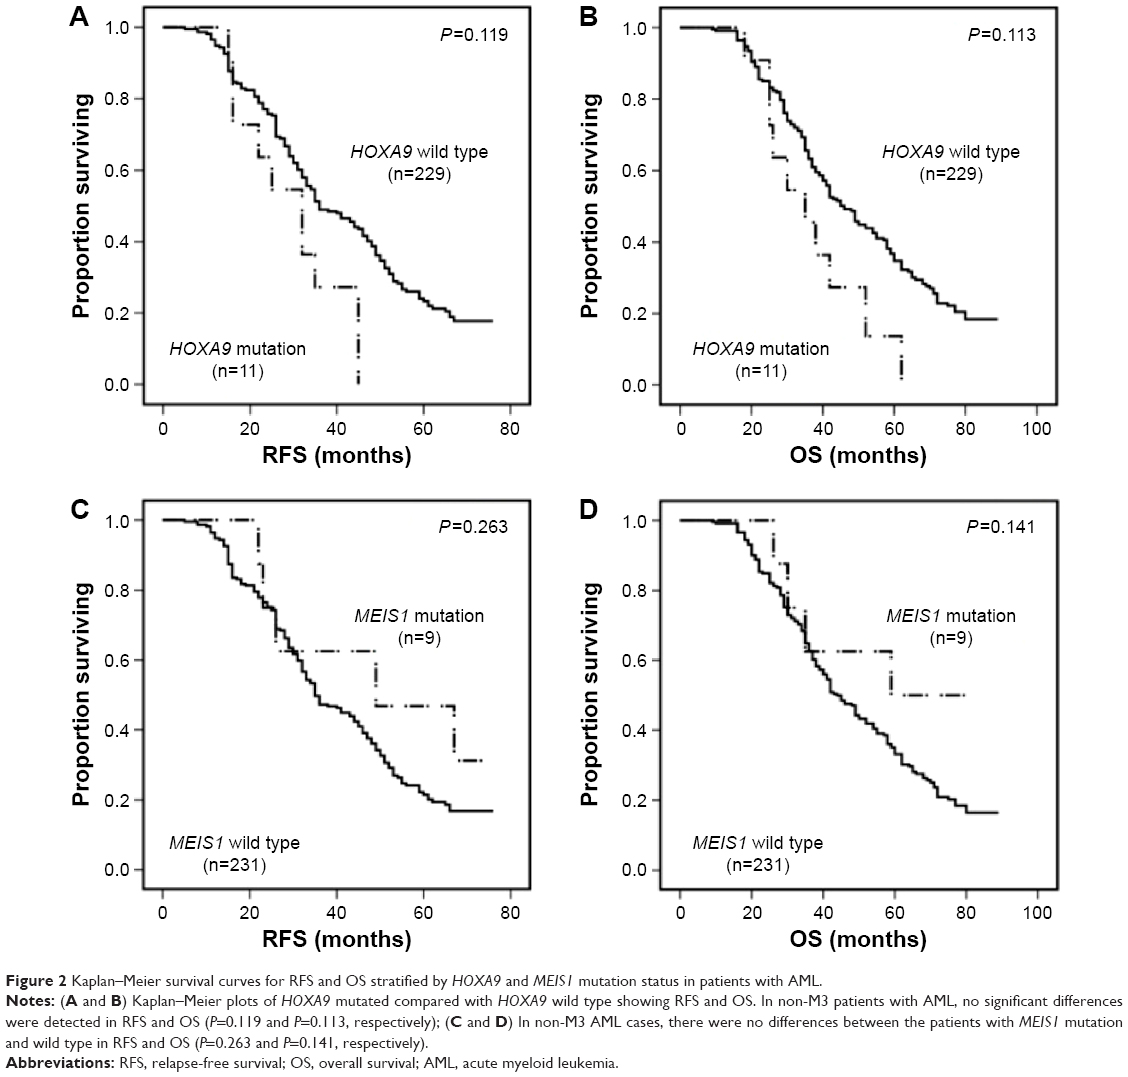 | Figure 2 Kaplan–Meier survival curves for RFS and OS stratified by HOXA9 and MEIS1 mutation status in patients with AML. |
Patients with higher HOXA9 transcript levels had specific clinical features
To further appraise the clinical impact of HOXA9 expression levels, the patients were divided into two groups according to the 75th percentile of the initial transcript levels. Clinical information such as age, platelet count, bone marrow blast count, and FAB classification was completely available for 258 patients (Table 1). Higher HOXA9 expression levels were underrepresented in FAB-M3 and closely associated with high white blood cell count, while there were no significant differences in age, sex, hemoglobin, platelet, or marrow blast levels between these two groups. The CR rate after one-cycle chemotherapy and 1-year relapse rate also exhibited remarkable differences between patients with higher HOXA9 expression levels and those with lower expression levels (85.1% vs 71.9% and 17.5% vs 29.6%, respectively).
Higher HOXA9 expression levels were highly associated with unfavorable chromosome aberrations, MLL-PTD and EZH2 mutations
Chromosomal data were available in all 258 patients at diagnosis, and clonal chromosomal abnormalities were detected in 116 patients (45%). The karyotype comparison of patients with lower and higher HOXA9 expression is shown in Table 2. Patients harboring higher HOXA9 expression levels had higher frequencies of unfavorable chromosome aberrations, while the levels were underrepresented in the cytogenetic favorable group. In addition, higher HOXA9 transcript levels were associated with specific 11q23 abnormalities. In particular, of the nine cases with 11q23 translocations, eight cases were among the patients with higher expression levels.
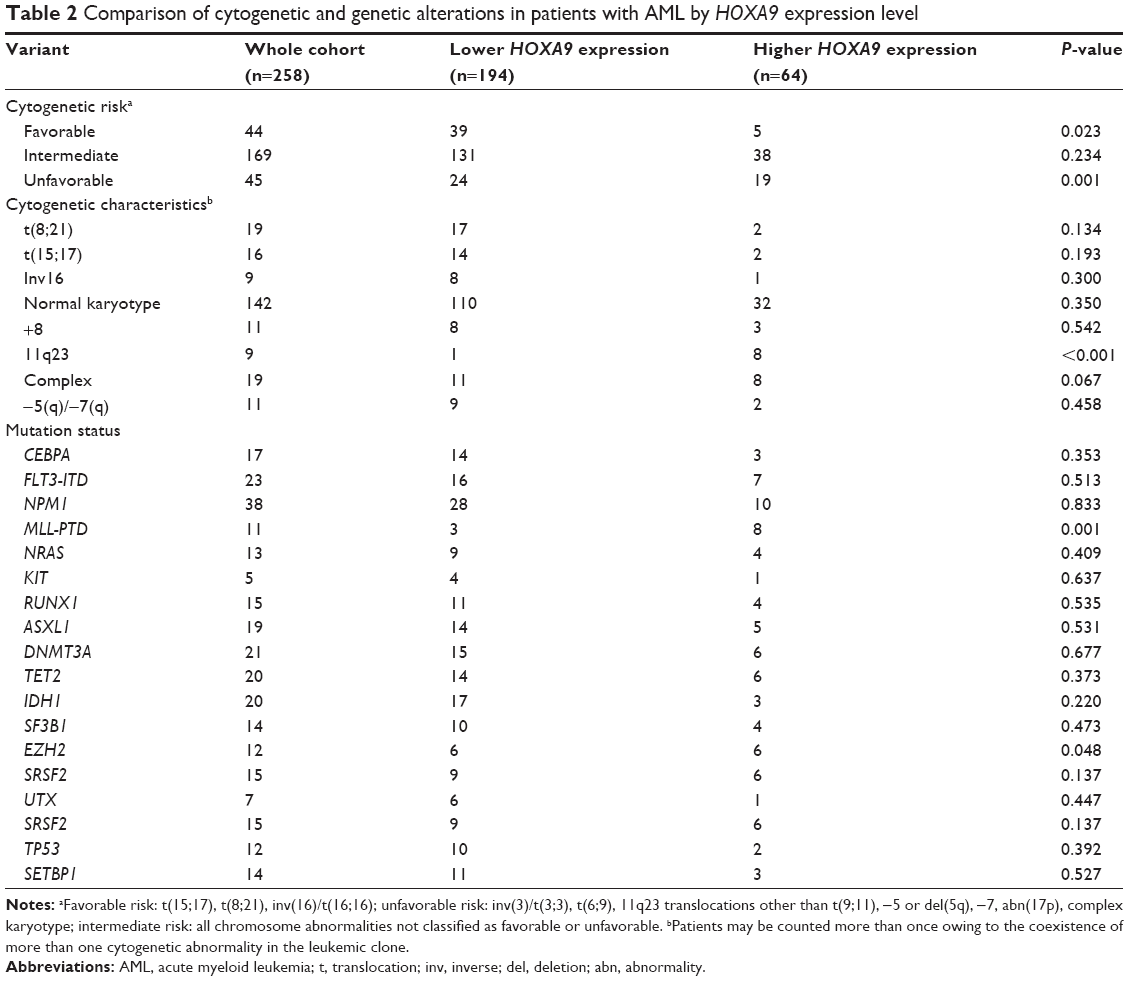 | Table 2 Comparison of cytogenetic and genetic alterations in patients with AML by HOXA9 expression level |
Next, to investigate the relationship of HOXA9 expression and gene aberrations associated with leukemogenesis, ASXL1, CBL, FLT3, IDH1, NRAS, RUNX1, TET2, DNMT3A, SF3B1, U2AF1, SRSF2, SETBP1, TP53, NPM1, EZH2, and KIT were detected. The spectrum of gene mutations in two groups is shown in Figure 3. Significantly, patients with higher HOXA9 transcript levels had higher frequencies of MLL-PTD and EZH2 mutations than those with lower transcript levels (P=0.001 and P=0.048, respectively; Table 2). Eleven patients harbored MLL-PTD, including eight patients in the higher-level group and three patients in the lower-level group. Furthermore, 12 patients had an EZH2 mutation, six patients in the group with higher HOXA9 expression levels.
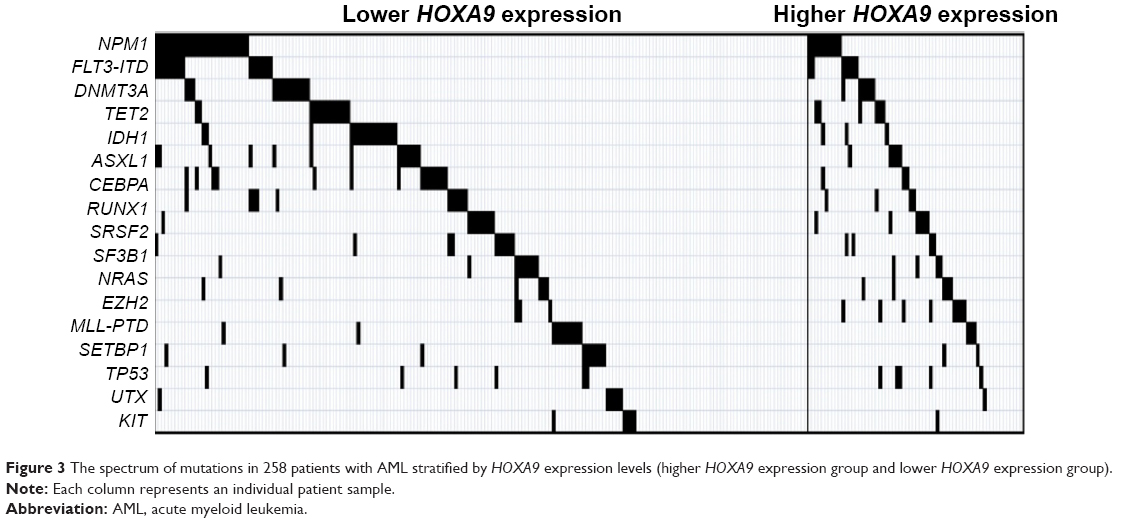 | Figure 3 The spectrum of mutations in 258 patients with AML stratified by HOXA9 expression levels (higher HOXA9 expression group and lower HOXA9 expression group). |
Prognostic value of HOXA9 expression in the context of other predictive molecular markers
We analyzed RFS and OS in patients with higher HOXA9 transcript levels versus those with lower HOXA9 transcript levels. Kaplan–Meier analyses and log-rank test showed that higher HOXA9 transcript levels in AML indicated shorter RFS and OS compared with lower transcript levels (P=0.014 and P=0.022, respectively; Figure 4A and B). Similarly, in non-M3 AML, patients with higher HOXA9 transcript levels had inferior RFS and OS than those with lower transcript levels (P=0.015 and P=0.013, respectively; Figure 4C and D).
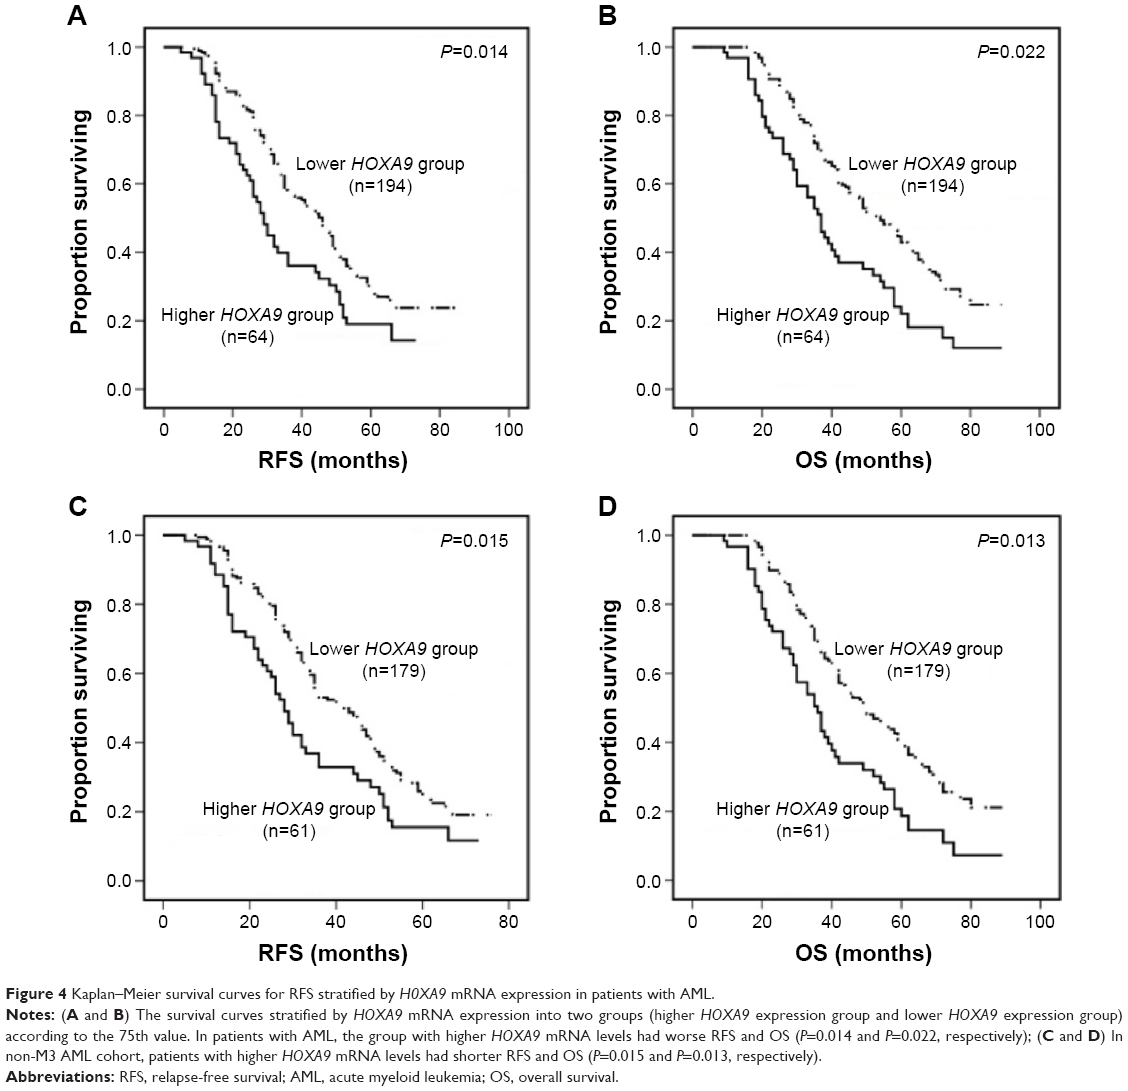 | Figure 4 Kaplan–Meier survival curves for RFS stratified by H0XA9 mRNA expression in patients with AML. |
In multivariate analysis (Table 3), including variables significantly associated with clinical outcome, the independent poor risk factors for RFS and OS were age >60 years, secondary AML, unfavorable karyotype, higher HOXA9 expression, CEBPA mutation, RUNX1 mutation, EZH2 mutation, SRSF2 mutation, FLT3-ITD, and MLL-PTD. Among the patients with AML, higher HOXA9 expression level was still an independent poor prognostic factor for OS but not for RFS. The other independent markers included secondary AML, FLT3-ITD, MLL-PTD, EZH2 mutation, and RUNX1 mutation.
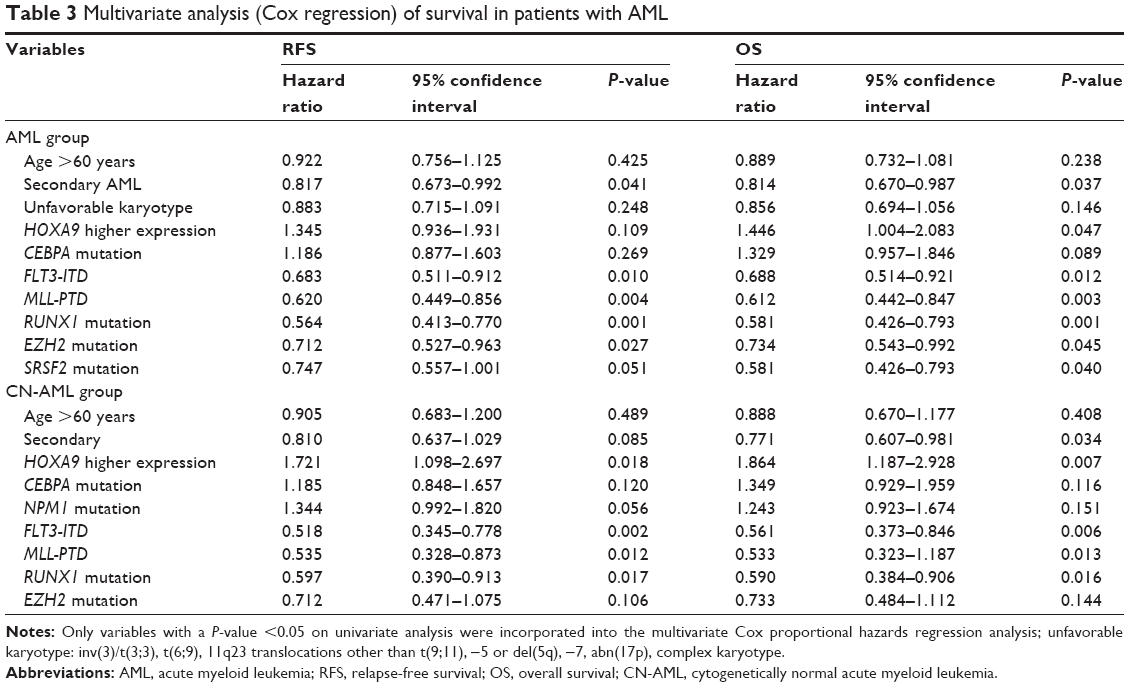 | Table 3 Multivariate analysis (Cox regression) of survival in patients with AML |
Furthermore, we analyzed survival in 142 patients with cytogenetically normal AML (CN-AML); RFS and OS differed significantly between patients with higher levels (n=32) and those with lower levels (n=110; P=0.024 and P=0.018, respectively; Figure 5A and B). According to the prognostic value of HOXA9 expression in 142 patients with a normal karyotype, higher HOXA9 expression level was entered into a multivariate model in addition to factors significantly associated with prognosis on univariate analysis for this population. HOXA9 higher expression levels and FLT3-ITD, MLL-PTD, and RUNX1 mutations were the independent prognostic parameters for RFS and OS.
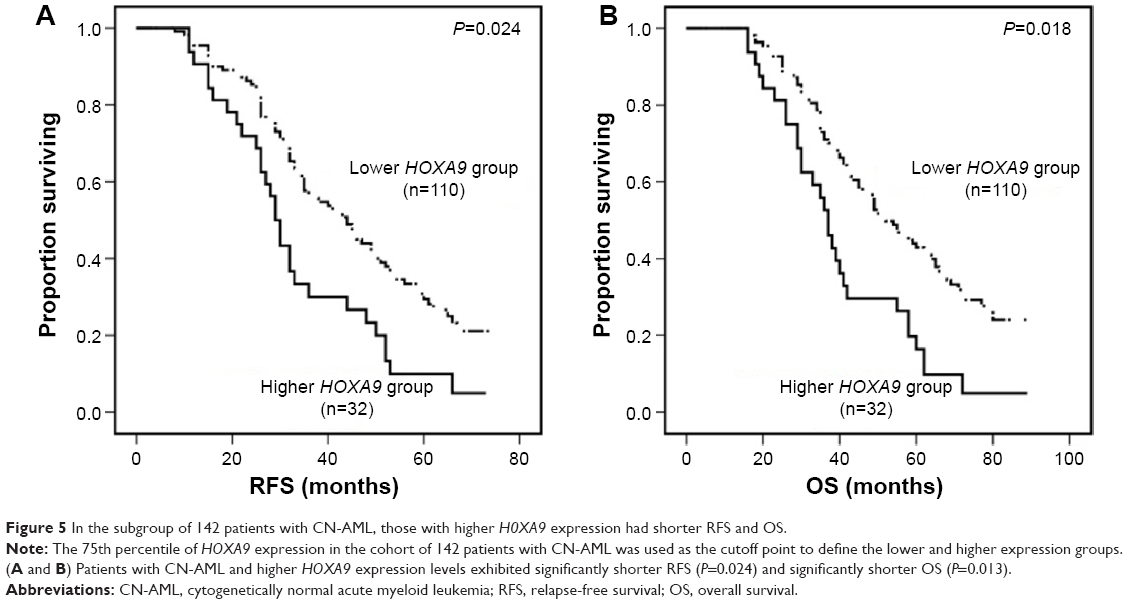 | Figure 5 In the subgroup of 142 patients with CN-AML, those with higher H0XA9 expression had shorter RFS and OS. |
Discussion
Genetics play an increasingly important role in the risk stratification and individualized therapy of AML patients.31,32 During the past few years, HOXA9 aberrations, as well as its cofactors MEIS1 dysregulation, have been gradually investigated in AML, including their clinical intimation.33–37 However, very few studies have systematically reported on the role of HOXA9 mutational status and mRNA expression levels in adult AML, especially the correlation with the other mutation status.38 In this study, we sequenced the coding region of HOXA9 and MEIS1 genes from 258 AML cases, and only eleven cases were detected with HOXA9 mutations and nine cases with MEIS1 mutations. Although no significant associations were unearthed with clinical characteristics and survivals, it at least gave another new light for the roles of HOXA9 and MEIS1 in AML. The relative low frequencies of HOXA9 and MEIS1 mutations provided the clue that they may be a rare molecular mechanism for the development of AML. Studies comprising a large number of cases for the roles of HOXA9 and MEIS1 mutations in AML would give a new interesting perspective.
Meanwhile, we analyzed HOXA9 and MEIS1 expression levels by qPCR in patients with AML as well as healthy donors. We investigated the disaccord of clinical correlations of these two gene expression levels with clinical parameters. This provided gradually verified knowledge that aberrant expression of MEIS1, as a cofactor of HOXA9, is involved in leukemia transformation. Because this study focused on the clinical impact and mutational associations of HOXA9 expression, we have only a brief analysis concerning the correlations of the MEIS1 gene with clinical characteristics. It is worth noting that HOXA9 expression differed according to cytomorphological AML type, with the lowest expression occurring in M3. The low HOXA9 expression in AML M3 remains unexplained. HOXA9 is expressed in the hematologic stem cell and immature progenitor compartment but is transcriptionally downregulated upon the induction of terminal differentiation.10,11 Thus, a possible explanation could be that AML M3 is characterized by a more differentiated blast population.
Similar to a previously mentioned study,39 higher HOXA9 transcription level was closely correlated with 11q23 translocation and MLL-PTD in our study. In this study, MLL-PTD was found in only 4.26% of the total AML cohort, which was consistent with a previous report.40 Comparative analysis of gene expression profiles in human acute leukemia implicated upregulation of a series of HOX genes, including HOXA9, which were fully accredited as direct binding targets for MLL or MLL fusion protein as a pivotal mechanism of leukemic transformation.41 Gene expression studies in murine models also demonstrated that HOX overexpression in the presence of MLL fusion initiated the occurrence of leukemia.42 This gave a very important explanation regarding the HOXA9 high expression being highly associated with 11q23 abnormalities and MLL mutations.
The finding that high HOXA9 expression was closely associated with EZH2 mutation in this study was interesting and suggestive. Within the AML cohort with higher HOXA9 transcription levels, overrepresentation of the EZH2 mutation was ascertained, which may indicate that HOXA9 dysregulation coworked with EZH2 mutation contributes to the pathogenesis of leukemia. Khan et al reported that EZH2 mutations were characterized by decreased H3K27 trimethylation and increased chromatin relaxation at specific gene loci accompanied by higher transcriptional activity. One of the major downstream targets is HOXA9, which is being found to be overexpressed in cases with EZH2 mutations.43 Further in-depth study of the molecular association between HOXA9 and EZH2 is required to confirm its expected molecular basis for targeted therapy.
To correlate HOXA9 expression levels with clinical outcome, we analyzed CR rate, relapse rate, RFS, and OS in the two groups with higher and lower HOXA9 expression levels. Notably, higher HOXA9 expression levels predicted a reduced one-cycle CR rate and an increased 1-year relapse rate. Mohamad Ismail et al found that HOXA9 expression was a poor molecular indicator in chronic myelogenous leukemia, and a few other studies demonstrated that HOXA9 overexpression was a poor indicator.11,44,45 It is inspiring that by multivariate analyses, higher HOXA9 expression level indicated shorter OS but not RFS in the entire AML cohort. Moreover, it is worth noting that high HOXA9 expression independently predicted inferior RFS and OS in patients with CN-AML. This is the first study for analyzing HOXA9 expression levels coordinated with gene mutations associated with AML. A growing number of reports ascertained that RUNX1 mutations and FLT3-ITD are frequently mutated in de novo AML and had strong adverse prognostic effects in AML.46–49 In this study, RUNX1 mutation and FLT3-ITD were still the independent poor prognostic factors for survival in AML and CN-AML. With continued advances in understanding clinical associations of the HOXA9 gene, there is a wealth of opportunity for developing individualized therapy.
An increasing body of evidence supports the notion that HOXA9 aberrations are frequent and critical, which is crucial to the induction and maintenance of the malignant phenotype. Although no significant correlations of HOXA9 mutations with clinical characteristics and survivals were found in this study, this provided a little more perspective about HOXA9 in leukemogenesis. Furthermore, this study gave logical evidence that higher HOXA9 expression level correlated with specific clinical characteristics and gene mutation status and functioned as a strong prognostic marker for therapy response as well as survival in patients with AML. Therefore, pretreatment screening for HOXA9 transcript level should be considered in patients with newly diagnosed AML to better guide risk assessments and therapeutic approaches.
Acknowledgment
This study was supported by the National Natural Science Foundation of China (Nos 81300425 and 81300450), Major State Basic Research Development Program of China (No 2005CB522400), Key Research Program for Clinical High-Tech Research of People’s Liberation Army (No 2010gxjs091), and Key Program of Capital Development Foundation (No 2007-2040).
Disclosure
The authors report no conflicts of interest in this work.
References
Grove CS, Vassiliou GS. Acute myeloid leukaemia: a paradigm for the clonal evolution of cancer? Dis Model Mech. 2014;7(8):941–951. | ||
Khasawneh MK, Abdel-Wahab O. Recent discoveries in molecular characterization of acute myeloid leukemia. Curr Hematol Malig Rep. 2014;9(2):93–99. | ||
Bhatnagar B, Garzon R. The use of molecular genetics to refine prognosis in acute myeloid leukemia. Curr Hematol Malig Rep. 2014;9(2):148–157. | ||
Sweet K, Lancet JE. Novel therapeutics in acute myeloid leukemia. Curr Hematol Malig Rep. 2014;9(2):109–117. | ||
Konig H, Levis M. Is targeted therapy feasible in acute myelogenous leukemia? Curr Hematol Malig Rep. 2014;9(2):118–127. | ||
De Braekeleer E, Douet-Guilbert N, Basinko A, Le Bris MJ, Morel F, De Braekeleer M. Hox gene dysregulation in acute myeloid leukemia. Future Oncol. 2014;10(3):475–495. | ||
Taniguchi Y. HOX transcription factors: modulators of cell-cell and cell-extracellular matrix adhesion. Biomed Res Int. 2014;2014:591374. | ||
Nunes FD, de Almeida FC, Tucci R, de Sousa SC. Homeobox genes: a molecular link between development and cancer. Pesqui Odontol Bras. 2003;17(1):94–98. | ||
Cantile M, Franco R, Schiavo G, et al. The HOX genes network in uro-genital cancers: mechanisms and potential therapeutic implications. Curr Med Chem. 2011;18(32):4872–4884. | ||
Dorsam ST, Ferrell CM, Dorsam GP, et al. The transcriptome of the leukemogenic homeoprotein HOXA9 in human hematopoietic cells. Blood. 2004;103(5):1676–1684. | ||
Lawrence HJ, Rozenfeld S, Cruz C, et al. Frequent co-expression of the HOXA9 and MEIS1 homeobox genes in human myeloid leukemias. Leukemia. 1999;13(12):1993–1999. | ||
Thorsteinsdottir U, Mamo A, Kroon E, et al. Overexpression of the myeloid leukemia-associated Hoxa9 gene in bone marrow cells induces stem cell expansion. Blood. 2002;99(1):121–129. | ||
Faber J, Krivtsov AV, Stubbs MC, et al. HOXA9 is required for survival in human MLL-rearranged acute leukemias. Blood. 2009;113(11):2375–2385. | ||
Zhao P, Tan L, Ruan J, et al. Aberrant expression of HOXA5 and HOXA9 in AML. Asian Pac J Cancer Prev. 2015;16(9):3941–3944. | ||
Gough SM, Slape CI, Aplan PD. NUP98 gene fusions and hematopoietic malignancies: common themes and new biologic insights. Blood. 2011;118(24):6247–6257. | ||
Eklund E. The role of Hox proteins in leukemogenesis: insights into key regulatory events in hematopoiesis. Crit Rev Oncog. 2011;16(1–2):65–76. | ||
Abramovich C, Pineault N, Ohta H, Humphries RK. Hox genes: from leukemia to hematopoietic stem cell expansion. Ann N Y Acad Sci. 2005;1044:109–116. | ||
Argiropoulos B, Yung E, Humphries RK. Unraveling the crucial roles of Meis1 in leukemogenesis and normal hematopoiesis. Genes Dev. 2007;21(22):2845–2849. | ||
Golub TR, Slonim DK, Tamayo P, et al. Molecular classification of cancer: class discovery and class prediction by gene expression monitoring. Science. 1999;286(5439):531–537. | ||
Tholouli E, MacDermott S, Hoyland J, Yin JL, Byers R. Quantitative multiplex quantum dot in-situ hybridisation based gene expression profiling in tissue microarrays identifies prognostic genes in acute myeloid leukaemia. Biochem Biophys Res Commun. 2012;425(2):333–339. | ||
Simons A, Shaffer LG, Hastings RJ. Cytogenetic nomenclature: changes in the ISCN 2013 compared to the 2009 edition. Cytogenet Genome Res. 2013;141(1):1–6. | ||
Slovak ML, Kopecky KJ, Cassileth PA, et al. Karyotypic analysis predicts outcome of preremission and postremission therapy in adult acute myeloid leukemia: a Southwest Oncology Group/Eastern Cooperative Oncology Group Study. Blood. 2000;96:4075–4083. | ||
Shen Y, Zhu YM, Fan X, et al. Gene mutation patterns and their prognostic impact in a cohort of 1185 patients with acute myeloid leukemia. Blood. 2011;118(20):5593–5603. | ||
Guo S, Chan JK, Iqbal J, et al. EZH2 mutations in follicular lymphoma from different ethnic groups and associated gene expression alterations. Clin Cancer Res. 2014;20(12):3078–3086. | ||
Jankowska AM, Makishima H, Tiu RV, et al. Mutational spectrum analysis of chronic myelomonocytic leukemia includes genes associated with epigenetic regulation: UTX, EZH2, and DNMT3A. Blood. 2011;118(14):3932–3941. | ||
Wang X, Dai H, Wang Q, et al. EZH2 mutations are related to low blast percentage in bone marrow and -7/del(7q) in de novo acute myeloid leukemia. PLoS One. 2013;8(4):e61341. | ||
Mendler JH, Maharry K, Radmacher MD, et al. RUNX1 mutations are associated with poor outcome in younger and older patients with cytogenetically normal acute myeloid leukemia and with distinct gene and MicroRNA expression signatures. J Clin Oncol. 2012;30(25):3109–3118. | ||
Je EM, Yoo NJ, Kim YJ, Kim MS, Lee SH. Mutational analysis of splicing machinery genes SF3B1, U2AF1 and SRSF2 in myelodysplasia and other common tumors. Int J Cancer. 2013;133(1):260–265. | ||
Ok CY, Patel KP, Garcia-Manero G, et al. TP53 mutation characteristics in therapy-related myelodysplastic syndromes and acute myeloid leukemia is similar to de novo diseases. J Hematol Oncol. 2015;8:45. | ||
Fabiani E, Falconi G, Fianchi L, Criscuolo M, Leone G, Voso MT. SETBP1 mutations in 106 patients with therapy-related myeloid neoplasms. Haematologica. 2014;99(9):e152–e153. | ||
Levine RL. Molecular pathogenesis of AML: translating insights to the clinic. Best Pract Res Clin Haematol. 2013;26(3):245–248. | ||
Jabbour E, Cortes J, Ravandi F, O’Brien S, Kantarjian H. Targeted therapies in hematology and their impact on patient care: chronic and acute myeloid leukemia. Semin Hematol. 2013;50(4):271–283. | ||
Brumatti G, Salmanidis M, Kok CH, et al. HoxA9 regulated Bcl-2 expression mediates survival of myeloid progenitors and the severity of HoxA9-dependent leukemia. Oncotarget. 2013;4(11):1933–1947. | ||
Ohno Y, Yasunaga S, Janmohamed S, et al. Hoxa9 transduction induces hematopoietic stem and progenitor cell activity through direct down-regulation of geminin protein. PLoS One. 2013;8(1):e53161. | ||
Ramos-Mejía V, Navarro-Montero O, Ayllón V, et al. HOXA9 promotes hematopoietic commitment of human embryonic stem cells. Blood. 2014;124(20):3065–3075. | ||
Hassawi M, Shestakova EA, Fournier M, et al. Hoxa9 collaborates with E2A-PBX1 in mouse B cell leukemia in association with Flt3 activation and decrease of B cell gene expression. Dev Dyn. 2014;243(1):145–158. | ||
Thorne RM, Milne TA. Dangerous liaisons: cooperation between Pbx3, Meis1 and Hoxa9 in leukemia. Haematologica. 2015;100(7):850–853. | ||
Li DP, Li ZY, Sang W, Cheng H, Pan XY, Xu KL. HOXA9 gene expression in acute myeloid leukemia. Cell Biochem Biophys. 2013;67(3):935–938. | ||
Wang QF, Wu G, Mi S, et al. MLL fusion proteins preferentially regulate a subset of wild-type MLL target genes in the leukemic genome. Blood. 2011;117(25):6895–6905. | ||
Whitman SP, Liu S, Vukosavljevic T, et al. The MLL partial tandem duplication: evidence for recessive gain-of-function in acute myeloid leukemia identifies a novel patient subgroup for molecular-targeted therapy. Blood. 2005;106(1):345–352. | ||
Drabkin HA, Parsy C, Ferquson K, et al. Quantitative HOX expression in chromosomally defined subsets of acute myelogenous leukemia. Leukemia. 2002;16(2):186–195. | ||
Kawagoe H, Humphries RK, Blair A, Sutherland HJ, Hogge DE. Expression of Hox gens, HOX cofactors, and MLL in phenotypically and functionally defined subpopulations of leukemic and normal human hematopoietic cells. Leukemia. 1999;13(5):687–698. | ||
Khan SN, Jankowska AM, Mahfouz R, et al. Multiple mechanisms deregulate EZH2 and histone H3 lysine 27 epigenetic changes in myeloid malignancies. Leukemia. 2013;27(6):1301–1309. | ||
Mohamad Ismail MM, Manar MM. Does HOXA9 gene expression in Egyptian chronic myelogenous leukemia patients affect disease progression? A retrospective cohort study. Turk J Haematol. 2013;30(4):359–365. | ||
Drabkin HA, Parsy C, Ferguson K, et al. Quantitative HOX expression in chromosomally defined subsets of acute myelogenous leukemia. Leukemia. 2002;16(2):186–195. | ||
Yohe S. Molecular genetic markers in acute myeloid leukemia. J Clin Med. 2015;4(3):460–478. | ||
Linch DC, Hills RK, Burnett AK, Khwaja A, Gale RE. Impact of FLT3(ITD) mutant allele level on relapse risk in intermediate-risk acute myeloid leukemia. Blood. 2014;124(2):273–276. | ||
Schnittger S, Dicker F, Kern W, et al. RUNX1 mutations are frequent in de novo AML with noncomplex karyotype and confer an unfavorable prognosis. Blood. 2011;117(8):2348–2357. | ||
Tang JL, Hou HA, Chen CY, et al. AML1/RUNX1 mutations in 470 adult patients with de novo acute myeloid leukemia: prognostic implication and interaction with other gene alterations. Blood. 2009;114(26):5352–5361. |
 © 2016 The Author(s). This work is published and licensed by Dove Medical Press Limited. The full terms of this license are available at https://www.dovepress.com/terms.php and incorporate the Creative Commons Attribution - Non Commercial (unported, v3.0) License.
By accessing the work you hereby accept the Terms. Non-commercial uses of the work are permitted without any further permission from Dove Medical Press Limited, provided the work is properly attributed. For permission for commercial use of this work, please see paragraphs 4.2 and 5 of our Terms.
© 2016 The Author(s). This work is published and licensed by Dove Medical Press Limited. The full terms of this license are available at https://www.dovepress.com/terms.php and incorporate the Creative Commons Attribution - Non Commercial (unported, v3.0) License.
By accessing the work you hereby accept the Terms. Non-commercial uses of the work are permitted without any further permission from Dove Medical Press Limited, provided the work is properly attributed. For permission for commercial use of this work, please see paragraphs 4.2 and 5 of our Terms.