Back to Journals » OncoTargets and Therapy » Volume 12
High LAMC1 expression in glioma is associated with poor prognosis
Authors Liu J, Liu D, Yang Z, Yang Z ![]()
Received 14 February 2019
Accepted for publication 9 April 2019
Published 29 May 2019 Volume 2019:12 Pages 4253—4260
DOI https://doi.org/10.2147/OTT.S205333
Checked for plagiarism Yes
Review by Single anonymous peer review
Peer reviewer comments 2
Editor who approved publication: Dr Federico Perche
Jian Liu, Dingyang Liu, Zhuanyi Yang, Zhiquan Yang
Department of Neurosurgery, Xiangya Hospital, Central South University, Changsha 410008, People’s Republic of China
Purpose: Glioma is the most common malignant brain tumor. The molecular mechanisms underlying its malignancy are not fully understood. LAMC1, which encodes extracellular matrix protein laminin γ1, has been implicated in some malignant tumors but has not been systematically evaluated in glioma. The aim of this study was to evaluate the expression of LAMC1 and its clinical significance.
Patients and methods: LAMC1 protein expression in 52 fresh-frozen specimens of different pathological grade gliomas and 5 normal brain tissues was detected by Western blotting. Immunohistochemistry was used to detect LAMC1 protein expression in another set of 76 glioma tissues and 8 normal brain tissues. The associations between clinicopathological factors and LAMC1 expression were analyzed. A log-rank test and a multivariate Cox proportional hazards model were used to determine the relationship between LAMC1 expression and patient prognosis. The expression of LAMC1 at the mRNA level was analyzed in the TCGA database.
Results: LAMC1 was highly expressed in high-grade glioma tissues, with moderate expression in low-grade gliomas, and weak or no expression in normal brain tissues, as detected by Western blotting and immunohistochemistry. A chi-square test indicated that LAMC1 expression was associated with pathological grade but not with other clinicopathological factors, such as age, sex, and tumor size. LAMC1 expression at the mRNA level was upregulated in high-grade gliomas compared with low-grade gliomas and normal brain tissue in the TCGA database. The Kaplan–Meier plot and log-rank test in our patient series showed that high LAMC1 expression was significantly associated with shorter survival, which was consistent with the TCGA database analysis. A multivariate Cox proportional hazards model revealed that LAMC1 expression, WHO grade, and surgery procedure were significantly correlated with overall survival and progression-free survival.
Conclusion: These results demonstrated that LAMC1 may play an important role in glioma progression and may be used in the diagnosis, prognosis, and targeted therapy of glioma patients.
Keywords: glioblastoma, LAMC1, laminins, basement membranes, prognosis
Introduction
Gliomas are the most common brain neoplasms, accounting for approximately 80% of the primary malignant brain tumors. According to the classification of the World Health Organization (WHO), gliomas can be classified into low-grade gliomas (grade I/II) and high-grade gliomas (grade III/IV). Grade I/II astrocytomas are slow-growing tumors without aggressive features, whereas grade III/IV gliomas exhibit a malignant phenotype associated with high proliferative activity, potent invasive ability, and neovascular formation.1,2 Although advances in glioma treatment, including surgery, chemotherapy, and radiotherapy, have been achieved in the past decades, the effects of treatment on high-grade glioma patients are still unsatisfactory.3,4 For example, the median survival of glioblastoma (GBM, grade IV) remains less than 15 months after diagnosis.5,6 Despite investigations on the alterations of oncogenes and tumor suppressors in glioma in recent years, the molecular mechanisms of glioma occurrence and progression remain largely unknown.
Basement membranes (BMs) are cell-adherent extracellular matrices that separate neurons, glia, epithelial cells, endothelial cells, and other cells from adjacent connective tissues. BMs provide a physical barrier for cells and contribute to cell adhesion, proliferation, migration, and survival. The major structural components of BMs include laminins, collagen IV, nidogens, and the heparan sulfate proteoglycans perlecan and agrin. After being secreted in a soluble state, these glycoproteins and proteoglycans become structurally insoluble cellular scaffolds and then turn into complex meshwork proteins in multicellular organisms. Proteinases and their inhibitors, regulatory macromolecules, and serum factors are closely associated with BMs. BMs provide collective physical support and act as complex signaling pathway platforms for cells and tissues.7
Laminins, a family of heterotrimers, each being composed of α, aβ, and aγ subunits, are important components of BMs. Five α, four β, and three γ subunit chains have been identified. Different combinations of these subunits assemble 16 different mammalian laminin isoforms. Most laminins contain the γ1 subunit encoded by the LAMC1 gene, which plays an essential role in both early and late morphogenesis. The C-terminal laminin-type globular domains are the major receptor-binding domains located at the C-terminal moiety of the α-subunit, which interact with integrins (α3β1, α6β1, α7β1, and α6β4), α-dystroglycan, heparin, sulfated glycolipids, and the Lutheran receptor. Polymerization is carried out through the interaction of N-terminal LN domains.7
The laminin γ1 chain, which is encoded by the LAMC1 gene, is widely expressed in the laminin subunit, found predominantly in BMs. Upregulated LAMC1 expression in meningiomas is positively related to tumor recurrence. B16 melanoma cells may exert a stronger ability of pulmonary metastasis by inducing the production of metalloproteinase-9 (MMP-9) when treated with specific LAMC1 peptides. Some reports demonstrated that upregulated LAMC1 may promote metastasis and might be a novel therapeutic target in the treatment of human cancer.8–10 The present study aimed to systematically evaluate LAMC1 expression and significance in glioma. The results indicated that LAMC1 expression was significantly upregulated in high-grade glioma tissues compared with low-grade glioma tissues and normal brain tissues and that high LAMC1 expression correlated with shorter overall survival (OS) time and progression-free survival (PFS), which shed light on the molecular mechanism underlying the initiation and progression of glioma.
Material and methods
Patient tissue samples
A set of 52 confirmed different pathological grade glioma samples were retrieved from the Human Glioma Bank of the Xiangya Hospital (Central South University, China) as fresh-frozen specimens. Patient clinical characteristics are shown in Table 1. Another 76 confirmed glioma samples of different pathological grades were retrieved from the same Human Glioma Bank as paraffin-embedded sections. Patient clinical characteristics for these samples are shown in Table 2. All patients provided written informed consent, and the study conducted in accordance with the Declaration of Helsinki. Both clinical data and detailed follow-up data were obtained for all patients. MRI evaluation and neurological tests were performed to confirm tumor recurrence. PFS was calculated from the time of tumor diagnosis to the documented tumor recurrence or the progression of residual tumor. OS was calculated from the time of tumor diagnosis to the patient’s death or last follow-up. Normal brain tissue specimens were obtained from patients suffering traumatic cerebral injury who were treated with internal decompression surgery. All the specimens collected were handled based on the protocols approved by the Ethics Committee of Central South University.
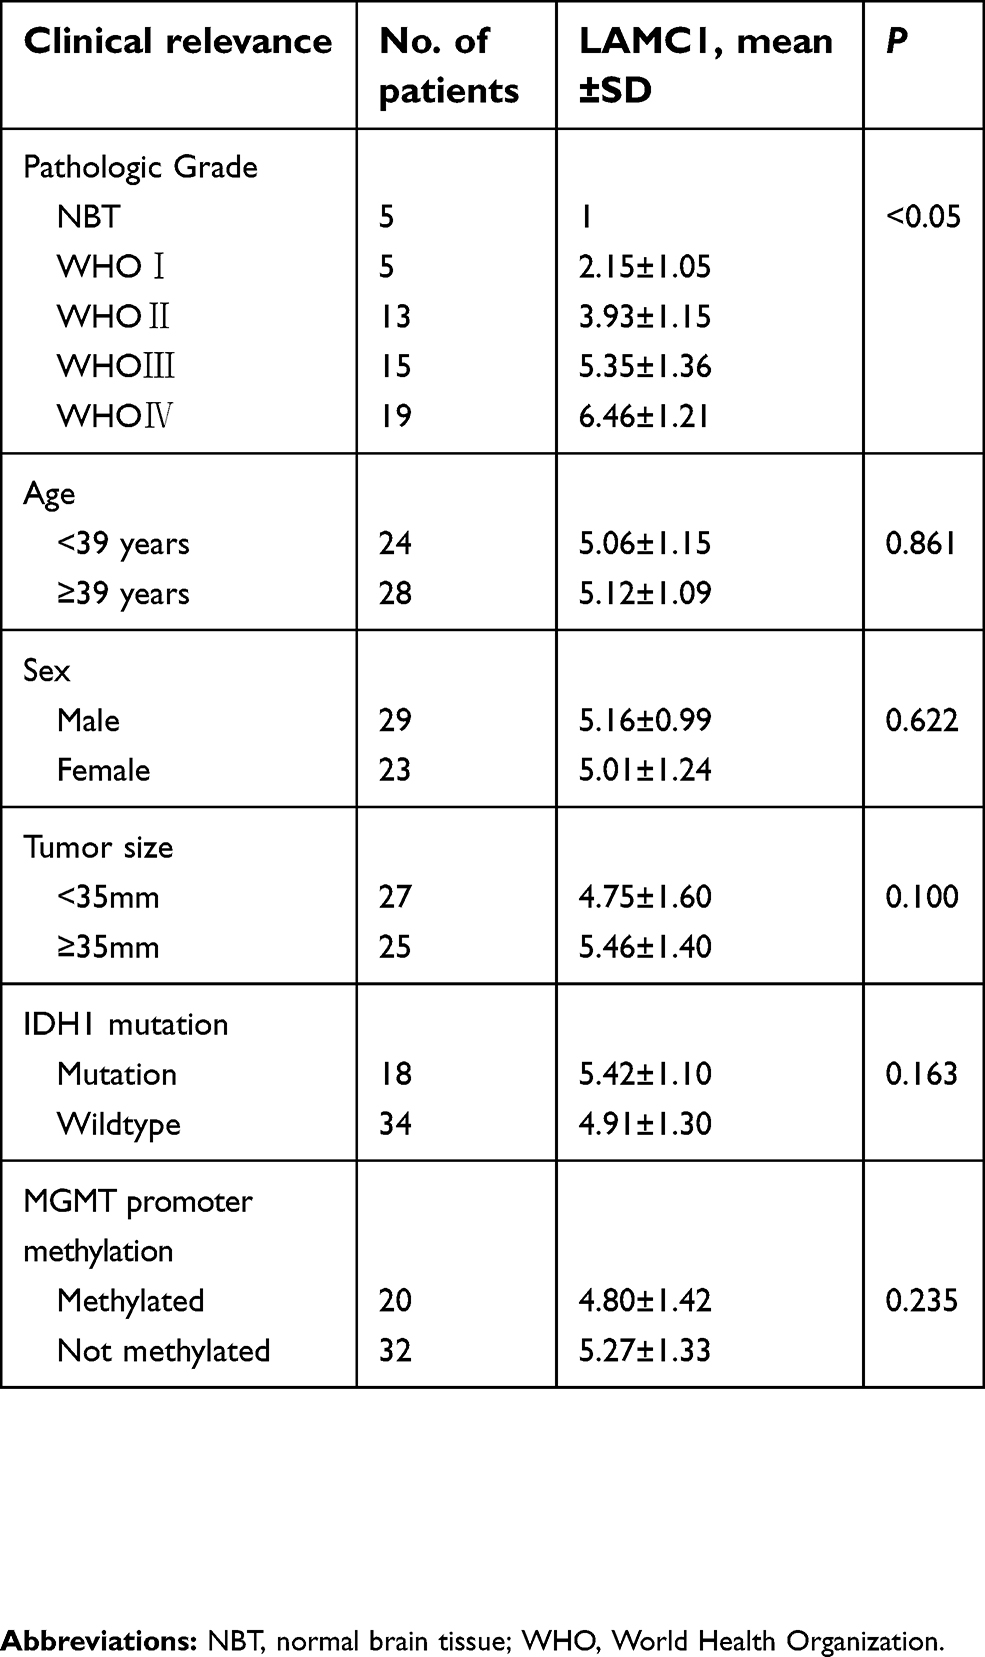 | Table 1 The expression of LAMC1/β-actin protein detected by Western blot in 5 normal brain tissue and 52 astrocytoma |
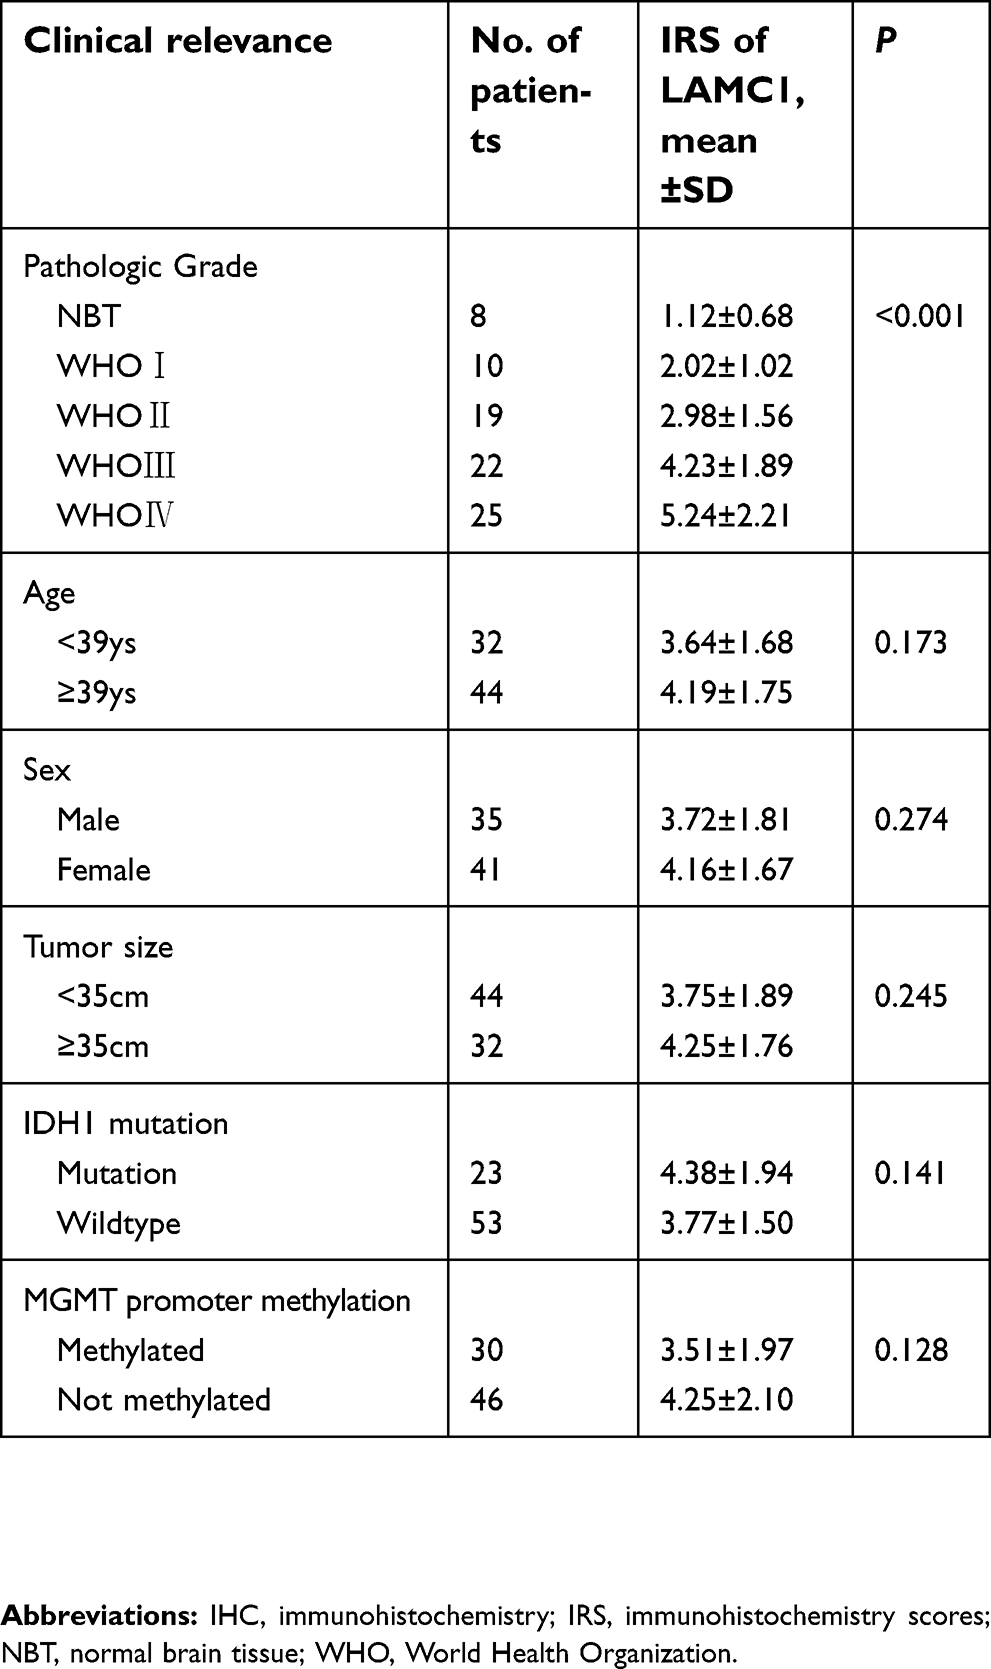 | Table 2 The expression of LAMC1 tested by IHC in 8 normal brain tissue and 76 astrocytoma |
Immunohistochemistry
Five-micron sections were cut from embedded paraffin block tissues that were fixed with formalin. After dewaxing in xylene and rehydration, the sections were peroxidase blocked with 3% H2O2 incubation. Microwave heating antigen retrieval was performed in 1 mM ethylenediaminetetraacetic acid. Five percent fetal bovine serum (FBS) was used to block the nonspecific binding sites. Then, the sections were incubated overnight at 4°C with the primary antibody, a mouse anti-LAMC1 polyclonal antibody (anti-LAMC1, Abcam, Cambridge, UK). A streptavidin-peroxidase system (Thermo Scientific, USA) was used to detect immunoreactive complexes, and peroxidase substrate was used for visualization. Sections not incubated with primary antibody were used as negative controls. Staining data were evaluated from more than two sections per tissue and examined by two pathologists who were blinded to the patients’ clinical data.
A semiquantitative approach was based on the intensity and percentage of positively stained malignant cells. The scoring standard was as follows: intensity was scored as 0 (negative), 1 (weak) or 2 (strong), and percentage of positive staining in malignant cells was scored as 0 (0–4%), 1 (5–24%), 2 (25–49%), 3 (50–74%), or 4 (75–100%). The final immunohistochemistry scores (IRS) were the multiplication of intensity scores and positive cell percentage scores.
Western blot analysis
Western blot analysis was performed according to our previous manual.11 Briefly, total proteins were obtained by lysing cells with RIPA buffer. After centrifugation, the proteins were denatured. Forty micrograms of protein were loaded and separated by sodium dodecyl sulfate polyacrylamide gel electrophoresis. The samples were transferred to polyvinylidene fluoride membranes (Millipore) followed by immunoblotting with anti-LAMC1 mouse polyclonal antibody (Abcam, Cambridge, UK) and anti-β-actin mouse monoclonal antibody (Abcam, Cambridge, UK). A Gel Imaging System (Bio-Rad) was used to visualize the protein bands after incubation with horseradish peroxidase-conjugated anti-IgG antibody.
Analysis of the TCGA dataset
Analysis of the TCGA dataset was performed as described previously.9 Briefly, level 3 TCGA data for gliomas were obtained from the Broad Institute GDAC Firehose (
Statistical analysis
The data were analyzed by SPSS software (version 18.0). Data are expressed as the mean±SD. To test for differences among the grades of gliomas and normal brain tissues, one-way ANOVA was used in all groups, and Tukey’s procedure for post hoc pairwise comparisons was used to obtain individual P values followed by ANOVA. The relationship between LAMC1 expression and the clinicopathological parameters was analyzed by the chi-square test. Survival analysis was performed by the Kaplan–Meier method and compared by the log-rank test. To analyze the significance of survival variables, multivariate Cox proportional hazards regression was performed. P<0.05 was considered statistically significant.
Results
We retrieved 52 glioma samples of different pathological grades. As shown in Table 1, these glioma patients included 29 men (55.8%) and 23 women (44.2%). The age ranged from 21 to 65 years old. Most of the patients presented tumors with a size of less than 5 cm. For the pathological grade, 18 patients suffered from WHO I/II glioma, 15 patients suffered from WHO grade III, and 19 patients suffered from WHO grade IV (GBM).
We detected LAMC1 proteins in the above glioma tissues and in another 5 normal brain tissues. Western blot analysis indicated that the LAMC1 protein level was upregulated in gliomas compared to that in normal brain tissues (P<0.05), with markedly higher expression in higher grade gliomas (Table 1). The differences in LAMC1 expression between WHO grade III and grade II and between grade II and grade I were all significant (P<0.05) (Figure 1) but not with patient sex, age, or tumor size and IDH1 mutation or MGMT promoter methylation. We compared the LAMC1 mRNA expression levels of different GBMs by analyzing the high-throughput data in TCGA (Figure 2). The highest LAMC1 expression was found in GBM. We also compared the LAMC1 mRNA expression levels of different gliomas by analyzing high-throughput data from the REpository for Molecular BRAin Neoplasia DaTa (REMBRANDT) database. Oligodendroglioma and astrocytoma exhibited low LAMC1 expression, and the difference in LAMC1 expression between these gliomas and normal brain tissues was significant (P<0.05). Among the different kinds of GBMs, classical and mesenchymal GBMs showed the highest expression of LAMC1. Relatively lower LAMC1 mRNA was expressed in neural and proneural GBMs, which was still apparently higher than that in normal brain tissues (P<0.05). Survival analysis was performed with a Kaplan–Meier plot and log-rank test. As shown in Figure 3, glioma patients with high LAMC1 expression had apparently shorter survival times.
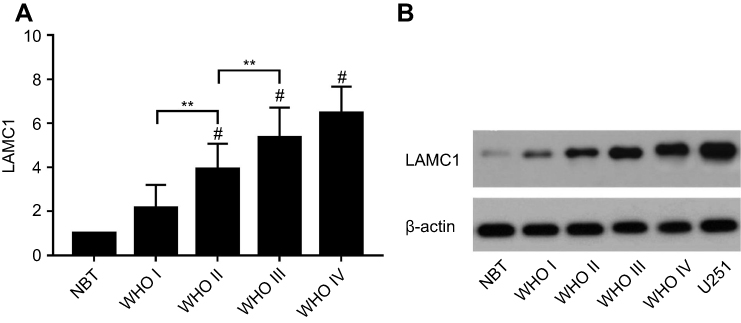 | Figure 1 The expression of LAMC1/β-actin protein detected by Western blot in 5 normal brain tissue and 52 astrocytoma samples. (A) The differences in LAMC1 expression between WHO grade III and grade II and between grade II and grade I were all significant (P<0.05). Each bar represents the mean value and SEM of at least 3 independent experiments (ANOVA and Tukey HSD post hoc test; *P<0.05; **P<0.01; #P<0.05, compare with the NBT group). (B) Western blot analysis of LAMC1/β-actin protein expression in different groups. Abbreviations: NBT, normal brain tissue; WHO, World Health Organization. |
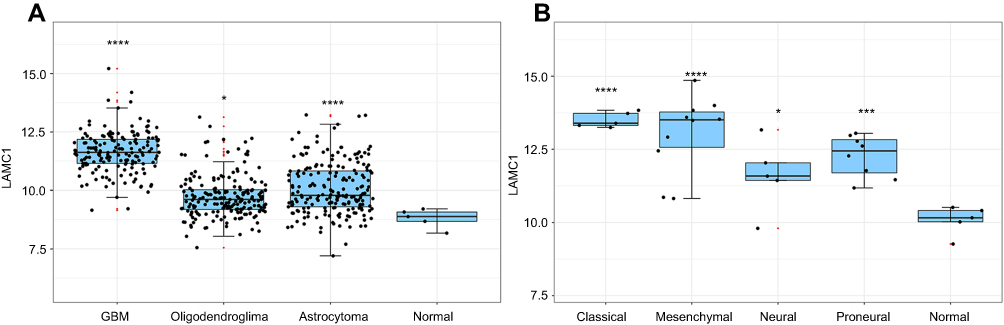 | Figure 2 The LAMC1 mRNA expression level of different GBMs by analyzing high-throughput data from TCGA. (A) The highest LAMC1 expression was found in GBM. We also compared the LAMC1 mRNA expression levels of different gliomas by analyzing high-throughput data from REMBRANDT. Oligodendroglioma and astrocytoma exhibited low LAMC1 expression, and the difference in LAMC1 expression between these gliomas and normal brain tissues was significant (*P<0.05, ****P<0.001, compare with the Normal group). (B) Among different kinds of GBMs, classical and mesenchymal GBMs showed the highest expression of LAMC1. Relatively lower LAMC1 mRNA was expressed in neural and proneural GBMs, which was still apparently higher than that in normal brain tissues (*P<0.05, ***P<0.005, ****P<0.001, compare with the Normal group). |
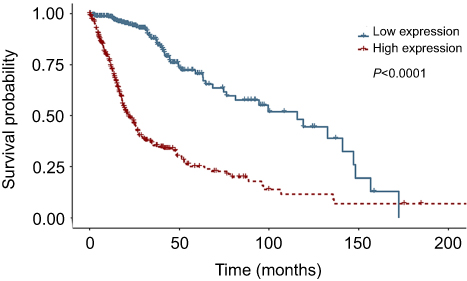 | Figure 3 Survival analysis was performed for glioblastoma patients with low or high LAMC1 expression. Kaplan–Meier curves of overall survival for glioblastoma patients with low LAMC1 expression (blue, n=337) or high LAMC1 expression (red, n=337), determined with the TCGA database. Log-rank P-value (downregulated versus upregulated) <0.0001. |
To define the significance of LAMC1 expression in glioma, we investigated another 76 glioma tissue samples of different grades and 8 normal brain tissues from paraffin-embedded sections. The representative results of immunohistochemistry (IHC) detection are shown in Figure 4. LAMC1 was highly expressed in tumor cells of high-grade glioma tissues, with lower expression levels in low-grade glioma tissues and weak or no expression in the nervous cells of normal brain tissues. Eighty-five percent of high-grade glioma tissues robustly expressed LAMC1 (IRS ≥4), while only 10% of the low-grade glioma tissues expressed LAMC1 with IRS ≥4. Chi-square test analysis indicated that high LAMC1 expression was significantly associated with glioma WHO grade (P<0.05) but not with patient sex, age, or tumor size and IDH1 mutation or MGMT promoter methylation (Table 2). These results suggest that LAMC1 may play a role in the recurrence and progression of glioma. These data were largely consistent with the above results, the results of Western blot detection and the TCGA database analysis.
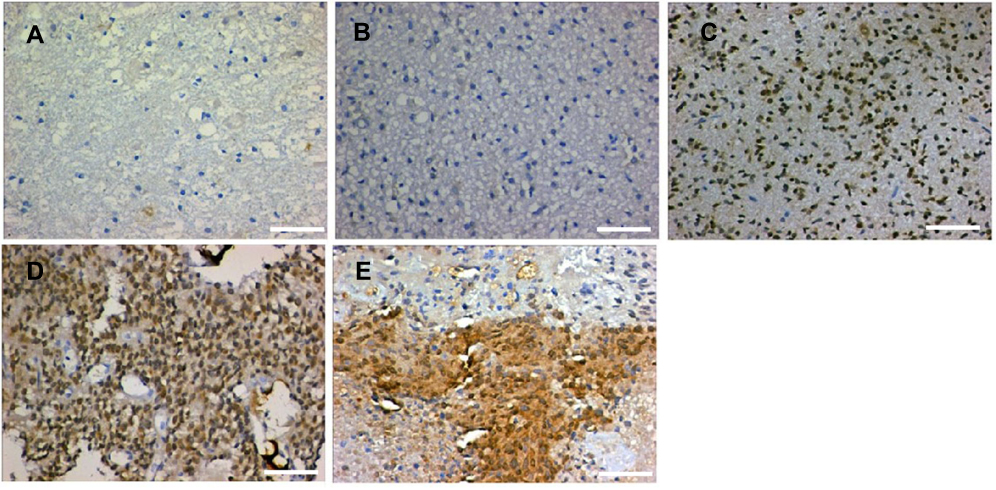 | Figure 4 Representative results of IHC detection. (A) Normal brain tissue; (B) WHO grade I glioma tissue; (C) WHO grade II glioma tissue; (D) WHO grade III glioma tissue; and (E) WHO grade IV glioma tissue. The scale length is 50 µm. |
Finally, survival analyses were carried out with a Kaplan–Meier plot and log-rank test. As shown in Figure 5, glioma patients with high LAMC1 expression (IRS ≥4) had apparently shorter recurrence-free survival (RFS) and OS times. The differences in RFS and OS times between glioma patients with high LAMC1 expression (IRS ≥4) and those with low LAMC1 expression (IRS<4) were significant (P<0.05). Cox proportional hazards regression analysis showed that both LAMC1 expression and WHO grade were associated with PFS and OS (P<0.05 and P<0.000, respectively) (Tables 3 and 4). These results indicated that LAMC1 may be an effective prognostic marker.
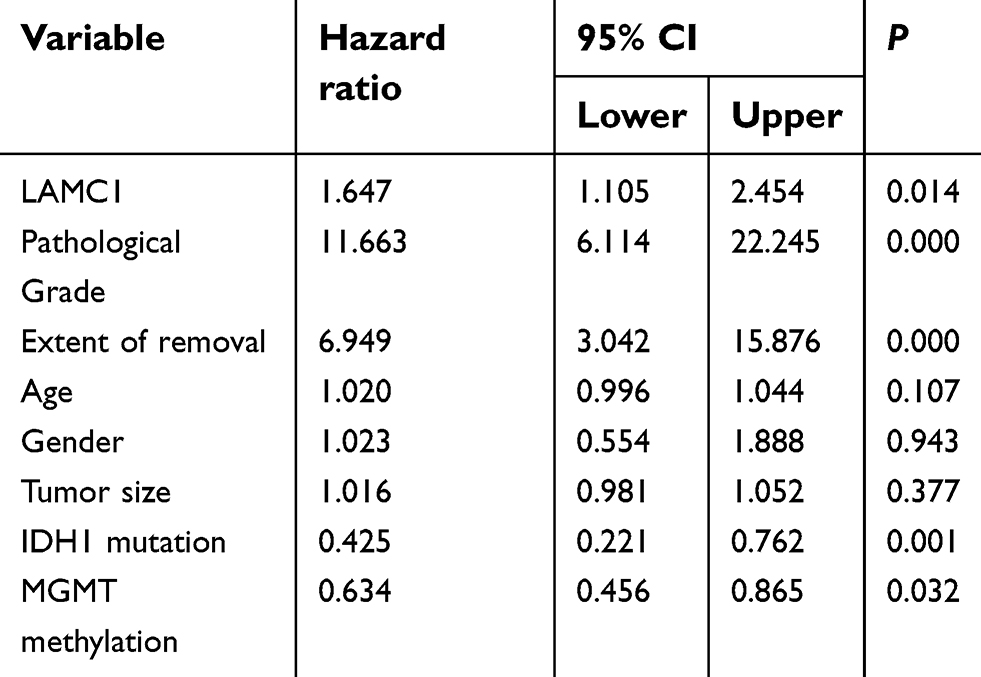 | Table 3 Univariate analysis of the variables in recurrence-free survival (n=76) |
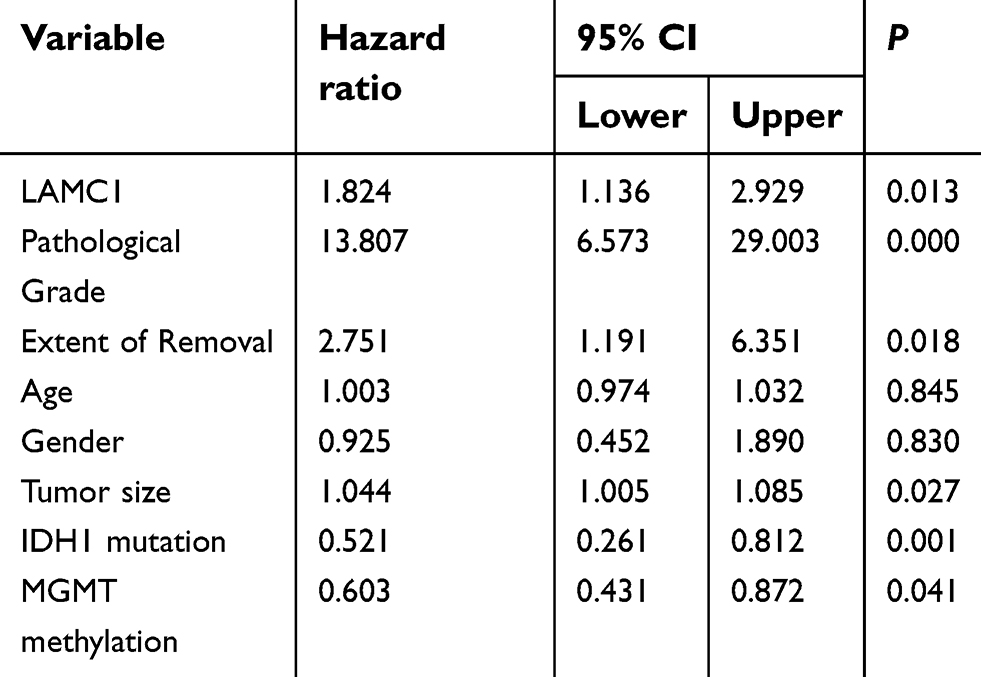 | Table 4 Univariate analysis of the variables in overall survival (n=76) |
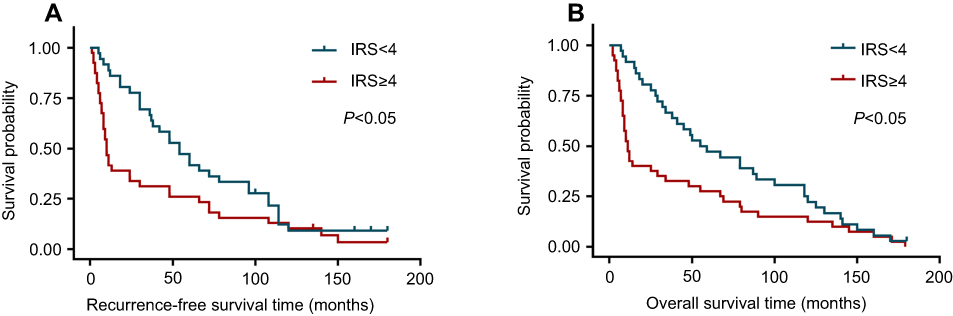 | Figure 5 The differences in recurrence-free survival time and overall survival time between glioma patients with high LAMC1 expression (IRS ≥4) and those with low LAMC1 expression (IRS<4) were significant (P<0.05). (A) Recurrence-free survival analysis for glioblastoma patients with low LAMC1 expression (blue, IRS<4) or high expression (red, IRS ≥4), performed with Kaplan–Meier plot and log-rank test. Log-rank P-value<0.05. (B) Overall survival analysis for glioblastoma patients with low LAMC1 expression (blue, IRS<4) or high expression (red, IRS ≥4), performed with Kaplan–Meier plot and log-rank test. Log-rank P-value<0.05. Abbreviation: IRS, immunohistochemistry scores. |
Discussion
In the present study, we systematically evaluated the expression and clinical significance of LAMC1 in glioma tissues. Our results demonstrated that in glioma tissues, LAMC1 expression was upregulated at both the mRNA and protein levels. The relationship between the LAMC1 expression level and the clinicopathological parameters was examined by a Chi-square test. OS and RFS analyses were carried out using the Kaplan–Meier method and log-rank test. Cox proportional hazards regression was performed to analyze the significance of survival variables. These analyses revealed that LAMC1 expression was positively related to the WHO grade of glioma and that increased LAMC1 expression correlated with poor prognosis.
Gliomas, which arise from glial cells that provide protection and support for neurons, are the most universal malignant tumors in the central nervous system. Despite the development of therapies combining surgery resection, radiotherapy, and chemotherapy, GBMs are one of the most lethal human cancers, and less than 5% of the patients survive more than 5 years. Ninety percent of GBMs developed de novo (primary GBM), which is typically characterized by rapid progression. The others (10%) arise from low-grade gliomas and progress more slowly. The most common molecular changes in primary GBMs include p53 and pRB pathway deactivation, telomerase reactivation, EGFR amplification, and PTEN loss.12 To date, the intimate molecular mechanisms of gliomas and useful molecular targets remain to be defined.
LAMC1 encodes the laminin γ1 chain, which is the most common γ subunit of laminins, and has been implicated in various malignant tumors. An unbiased random survival forest analysis on a transcriptomic dataset of 247 patients with hepatocellular carcinoma revealed that upregulated LAMC1 expression was positively related to advanced tumor staging and short overall and tumor-free survival.9 In a study on multiple myeloma by microarray analysis, different types of ECM content were found to be altered in different RPMI-8226 sublines of drug resistance. The LAMC1 gene was drastically overexpressed in a prednisone-resistant subline, whereas it was downregulated in its melphalan-resistant variant.13 Nicola Whiffin et al performed a meta-analysis of five genome-wide association studies including 5,626 cases and 7,817 controls to identify common characteristics influencing colorectal cancer (CRC) risk. They found that SNP rs10911251 near LAMC1 (1q25.3) was associated with CRC (OR 5 1.09, P 5 1.75 3 1028).14 Hiroyasu Kashima et al showed that laminin γ1 was related to different subtypes of uterine carcinoma and its clinical stages. Compared with normal proliferative and secretory endometrium, in which LAMC1 is almost undetectable, increasing LAMC1 expression was observed in epithelial cells from atypical hyperplasia to low-grade and high-grade endometrioid carcinoma. LAMC1 expression was significantly positively related to myometrial invasion, cervical/adnexal involvement and lymph node metastasis. Hiroyasu Kashima et al also found that silencing LAMC1 expression in high-grade endometrioid carcinoma cell lines in vitro did not affect cell proliferation but suppressed cell motility and invasion.10
Despite the clarified biological significance of LAMC1 in tumors, its regulatory mechanism underlying abnormal expression and the mechanism underlying its function remain to be investigated. Previous studies have provided clues for exploring these aspects. Pasqualini L et al identified that in prostate cancer, LAMC1 is a direct target of miR-22.15 In GBM, miR-124a directly regulates the expression of LAMC1.16,17 In human hepatocellular carcinoma (HCC), SP1 transactivates the LAMC1 promoter.18 Another study indicated that in HCC, LAMC1 expression is modulated by the Wnt signaling pathway.19 Ma NKL et al observed a collaboration between laminins and 3D contexts promoting astrocytoma stemness. Depending on the different laminin isoforms presented, the cells of GBM cell lines cultured on 3D ESPS scaffolds had increased stemness marker expression compared to those cultured on 2D culture polystyrene. The cells exhibited enhanced clonogenicity when cultured on 3D ESPS scaffolds with laminin isoforms of 411, 421, 511, and 521.20 The study of Sun S et al showed that COL1A1 and LAMC1 are the major genes for malignant astrocytoma invasiveness. In addition, the PI3K/AKT, NF-κB, and JAK/STAT3 signaling pathways may be closely related to COL1A1-mediated invasion. These studies provide new research directions for the regulatory mechanism of LAMC1 in glioma cells.21
Conclusion
In conclusion, the results of this research indicate that LAMC1 may play an important role in the progression of gliomas and may be used in the diagnosis, prognosis and targeted therapy of glioma patients; however, its regulatory mechanism underlying abnormal expression and the mechanism underlying its function remain to be investigated. Further investigation of the expression regulation, function, and underlying mechanism of LAMC1 will strengthen our understanding of its role in tumors.
Disclosure
The authors report no conflicts of interest in this work.
References
1. Claus EB, Walsh KM, Wiencke JK, et al. Survival and low-grade glioma: the emergence of genetic information. Neurosurg Focus. 2015;38(1):E6. doi:10.3171/2014.10.FOCUS12367
2. Paradowski M, Bilinska M, Bar J. Characteristics of the expression of KAI1/CD82 and PDGFRbeta and their impact on glioma progression. Folia Neuropathol. 2016;54(3):241–248.
3. Taylor LP. Diagnosis, treatment, and prognosis of glioma: five new things. Neurology. 2010;75(18 Suppl 1):S28–S32. doi:10.1212/WNL.0b013e3181fb3661
4. Omuro A, DeAngelis LM. Glioblastoma and other malignant gliomas: a clinical review. Jama. 2013;310(17):1842–1850. doi:10.1001/jama.2013.280319
5. Woodworth GF, Dunn GP, Nance EA, Hanes J, Brem H. Emerging insights into barriers to effective brain tumor therapeutics. Front Oncol. 2014;4:126. doi:10.3389/fonc.2014.00126
6. Stupp R, Mason WP, van den Bent MJ, et al. Radiotherapy plus concomitant and adjuvant temozolomide for glioblastoma. N Engl J Med. 2005;352(10):987–996. doi:10.1056/NEJMoa043330
7. Pozzi A, Yurchenco PD, Iozzo RV. The nature and biology of basement membranes. Matrix Biol. 2017;57–58:1–11. doi:10.1016/j.matbio.2016.12.009
8. Nishikawa R, Goto Y, Kojima S, et al. Tumor-suppressive microRNA-29s inhibit cancer cell migration and invasion via targeting LAMC1 in prostate cancer. Int J Oncol. 2014;45(1):401–410. doi:10.3892/ijo.2014.2437
9. Desert R, Mebarki S, Desille M, et al. “Fibrous nests” in human hepatocellular carcinoma express a Wnt-induced gene signature associated with poor clinical outcome. Int J Biochem Cell Biol. 2016;81(Pt A):195–207. doi:10.1016/j.biocel.2016.08.017
10. Kashima H, Wu RC, Wang Y, et al. Laminin C1 expression by uterine carcinoma cells is associated with tumor progression. Gynecol Oncol. 2015;139(2):338–344. doi:10.1016/j.ygyno.2015.08.025
11. Jia W, Ren C, Wang L, et al. CD109 is identified as a potential nasopharyngeal carcinoma biomarker using aptamer selected by cell-SELEX. Oncotarget. 2016;7(34):55328–55342. doi:10.18632/oncotarget.10530
12. Doll S, Urisman A, Oses-Prieto JA, Arnott D, Burlingame AL. Quantitative proteomics reveals fundamental regulatory differences in oncogenic HRAS and Isocitrate Dehydrogenase (IDH1) driven astrocytoma. Mol Cell Proteomics. 2017;16(1):39–56. doi:10.1074/mcp.M116.063883
13. Mutlu P, Ural AU, Gunduz U. Differential gene expression analysis related to extracellular matrix components in drug-resistant RPMI-8226 cell line. Biomed Pharmacother. 2012;66(3):228–231. doi:10.1016/j.biopha.2011.11.023
14. Whiffin N, Hosking FJ, Farrington SM, et al. Identification of susceptibility loci for colorectal cancer in a genome-wide meta-analysis. Hum Mol Genet. 2014;23(17):4729–4737. doi:10.1093/hmg/ddu177
15. Pasqualini L, Bu H, Puhr M, et al. miR-22 and miR-29a are members of the androgen receptor cistrome modulating LAMC1 and Mcl-1 in prostate cancer. Mol Endocrinol. 2015;29(7):1037–1054. doi:10.1210/me.2014-1358
16. Fowler A, Thomson D, Giles K, et al. miR-124a is frequently down-regulated in glioblastoma and is involved in migration and invasion. Eur J Cancer. 2011;47(6):953–963. doi:10.1016/j.ejca.2010.11.026
17. Chi SW, Zang JB, Mele A, Darnell RB. Argonaute HITS-CLIP decodes microRNA-mRNA interaction maps. Nature. 2009;460(7254):479–486. doi:10.1038/nature08170
18. Lietard J, Musso O, Theret N, et al. Sp1-mediated transactivation of LamC1 promoter and coordinated expression of laminin-gamma1 and Sp1 in human hepatocellular carcinomas. Am J Pathol. 1997;151(6):1663–1672.
19. Nagendran M, Arora P, Gori P, et al. Canonical Wnt signalling regulates epithelial patterning by modulating levels of laminins in zebrafish appendages. Development. 2015;142(2):320–330. doi:10.1242/dev.118703
20. Ma NK, Lim JK, Leong MF, et al. Collaboration of 3D context and extracellular matrix in the development of glioma stemness in a 3D model. Biomaterials. 2016;78:62–73. doi:10.1016/j.biomaterials.2015.11.031
21. Sun S, Wang Y, Wu Y, et al. Identification of COL1A1 as an invasionrelated gene in malignant astrocytoma. Int J Oncol. 2018;53(6):2542–2554. doi:10.3892/ijo.2018.4568
 © 2019 The Author(s). This work is published and licensed by Dove Medical Press Limited. The
full terms of this license are available at https://www.dovepress.com/terms
and incorporate the Creative Commons Attribution
- Non Commercial (unported, 3.0) License.
By accessing the work you hereby accept the Terms. Non-commercial uses of the work are permitted
without any further permission from Dove Medical Press Limited, provided the work is properly
attributed. For permission for commercial use of this work, please see paragraphs 4.2 and 5 of our Terms.
© 2019 The Author(s). This work is published and licensed by Dove Medical Press Limited. The
full terms of this license are available at https://www.dovepress.com/terms
and incorporate the Creative Commons Attribution
- Non Commercial (unported, 3.0) License.
By accessing the work you hereby accept the Terms. Non-commercial uses of the work are permitted
without any further permission from Dove Medical Press Limited, provided the work is properly
attributed. For permission for commercial use of this work, please see paragraphs 4.2 and 5 of our Terms.