")
Back to Journals » International Journal of General Medicine » Volume 16
High Fever, Wide Distribution of Viral Pneumonia, and Pleural Effusion are More Critical Findings at the First Visit in Predicting the Prognosis of COVID-19: A Single Center, retrospective, Propensity Score-Matched Case–Control Study
Authors Shinoda M , Ota S, Yoshida Y, Hirouchi T, Shinada K , Sato T , Morikawa M, Ishii N, Shinkai M
Received 16 February 2023
Accepted for publication 18 May 2023
Published 8 June 2023 Volume 2023:16 Pages 2337—2348
DOI https://doi.org/10.2147/IJGM.S408907
Checked for plagiarism Yes
Review by Single anonymous peer review
Peer reviewer comments 2
Editor who approved publication: Dr Scott Fraser
Masahiro Shinoda,1 Shinichiro Ota,1 Yuto Yoshida,1,2 Takatomo Hirouchi,1,2 Kanako Shinada,1 Takashi Sato,1 Miwa Morikawa,1 Naoki Ishii,3 Masaharu Shinkai1
1Department of Respiratory Medicine, Tokyo Shinagawa Hospital, Tokyo, Japan; 2Department of Respiratory Medicine, Toho University Ohashi Medical Center, Tokyo, Japan; 3Department of Gastroenterology, Tokyo Shinagawa Hospital, Tokyo, Japan
Correspondence: Masahiro Shinoda, Department of Respiratory Medicine, Tokyo Shinagawa Hospital, 6-3-22 Higashi-Oi, Shinagawa, Tokyo, 140-8522, Japan, Tel +81-3-3764-0511, Fax +81-3-3764-3415, Email [email protected]
Introduction: Currently, infection control measures for SARS-COV2 are being relaxed, and it is important in daily clinical practice to decide which findings to focus on when managing patients with similar background factors.
Methods: We retrospectively evaluated 66 patients who underwent blood tests (complete blood count, blood chemistry tests, and coagulation tests) and thin slice CT between January 1 and May 31, 2020, and performed a propensity score-matched case–control study. Cases and controls were a severe respiratory failure group (non-rebreather mask, nasal high-flow, and positive-pressure ventilation) and a non-severe respiratory failure group, matched at a ratio of 1:3 by propensity scores constructed by age, sex, and medical history. We compared groups for maximum body temperature up to diagnosis, blood test findings, and CT findings in the matched cohort. Two-tailed P-values < 0.05 were considered statistically significant.
Results: Nine cases and 27 controls were included in the matched cohort. Significant differences were seen in maximum body temperature up to diagnosis (p=0.0043), the number of shaded lobes (p=0.0434), amount of ground-glass opacity (GGO) in the total lung field (p=0.0071), amounts of GGO (p=0.0001), and consolidation (p=0.0036) in the upper lung field, and pleural effusion (p=0.0117).
Conclusion: High fever, the wide distribution of viral pneumonia, and pleural effusion may be prognostic indicators that can be easily measured at diagnosis in COVID-19 patients with similar backgrounds.
Keywords: COVID-19, prognosis, fever, ground-glass opacity, consolidation, pleural effusion
Introduction
Since the first death from coronavirus disease 2019 (COVID-19) pneumonia was reported in Wuhan, China, in December 2019, and since then spread rapidly to Thailand, Japan, South Korea, Singapore and Iran in the initial months. This was followed by wide viral dissemination around the world including Spain, Italy, USA, UAE and the UK. The WHO declared the COVID-19 outbreak as a pandemic.1 Although it has not yet subsided, it seems that the exit is gradually becoming visible.
Pneumonia has been a common complication in COVID-19.2 Although many patients show mild disease, some patients develop acute respiratory distress syndrome (ARDS) and progress to a severe within 8–14 days after onset.3 Various radiological patterns of COVID-19 pneumonia have been reported at different times throughout the disease course,4–6 which may make the progression of the disease difficult to predict.
Aggravating factors reported to date include age,7 obesity,8 type 2 diabetes,9 hypertension,10,11 chronic kidney disease,12 and dyslipidemia,13 but among patients of the same age, physique, and underlying illness, illness can still range from mild to severe.
The mortality rate was around 2% in the first half of 2021. Although regional differences are recognized (A study in the Caribbean region found a difference in mortality rates between about 0.7 and 2.6.14), it dropped to about 1% at the end of 2021, dropping to 0.8% as of January.15 It approaches the mortality rate of influenza (estimated at 0.05–0.5%).16 It is speculated that the cause of the drop in mortality rate is the combined effect of the spread of vaccination, the effectiveness of treatment, the acquisition of immunity through infection, and the attenuation of the virus itself.16
It is known that vaccination is an essential factor in preventing the onset and severity of COVID-19.17 But some studies reported that the factors such as social demographics, occupation, religious beliefs, and social and environmental trust cause vaccine hesitancy.18 In a study of predictors of vaccine hesitation in Germany,19 older age, higher education level, adherence to prevention measures, and being a man were reported to increase the odds of willingness to vaccinate. Also, it was reported that trust in the environment influences the link between people’s information reception and vaccination intentions.20 As mentioned above, because vaccination is hesitant not only by factors of the individual itself but also by the environmental factors surrounding the individual, there are still a certain number of severe COVID-19 patients with the widespread use of vaccines.
Currently, infection control measures for SARS-COV2 are being relaxed, and it is important in daily clinical practice to decide which findings to focus on when managing patients with similar background factors.
We, therefore, performed a matched case-control study using propensity scores to analyze prognostic factors from among the results of vital signs, blood tests, and CT at diagnosis in daily clinical practice.
Materials and Methods
This study was approved by the ethics committee of Tokyo Shinagawa Hospital (approval number 20-A-06) and was performed in accordance with the 1964 Declaration of Helsinki and its later amendments or comparable ethical standards. The requirement to obtain informed consent for participation was waived since the following conditions in Ethical Guidelines for Medical and Health Research Involving Human Subjects applied to this study; When it is particularly necessary for the improvement of public health, and it is difficult to obtain informed consent and appropriate consent from research subjects; Use existing specimens and information for research of high social importance; There is no risk of unfair infringement of the rights and interests of study subjects. We published information about this study on our website and allowed study subjects to refuse to participate in this study. Samples and information handled in this study were used for research and analysis after anonymization that the principal investigator can link. As for the method of anonymization, information that can identify an individual (name, address, date of birth, telephone number, etc.) was deleted from samples and information, and a unique code was added. The principal investigator shall keep a correspondence table between individuals and codes. We retrospectively enrolled 66 patients with a final diagnosis of COVID-19 pneumonia who had undergone blood testing and chest CT from the early to middle phase (from onset to 10 days; if CT was performed multiple times during this period, only the CT performed earliest within the target period was analyzed) in our hospital between January 1 and May 31, 2020. Patients without thin-slice CT, blood tests, or unknown outcomes were excluded due to the inability to perform analyses. COVID-19 was confirmed by reverse transcription-polymerase chain reaction (RT-PCR) or loop-mediated isothermal amplification. Based on the previous reports,4,5 we quantified ground-glass opacity (GGO) and consolidation, as the main components of COVID-19 pneumonia, and analyzed shadow spread (uni- or bilateral, how many lobes showing shadows), mediastinal lymphadenopathy, traction bronchiectasis, stripe shadows/subpleural curvilinear lines, pleural thickening, vascular enlargement, pleural effusion, and pericardial effusion. In terms of laboratory findings, we analyzed white blood cell counts, lymphocyte counts, platelet counts, lactate dehydrogenase (LDH) isozymes, uric acid, C-reactive protein (CRP), fibrinogen, and D-dimer measured at diagnosis. Fever that could be investigated from past medical records was analyzed.
Protocols for Chest CT
All images were obtained on one of two CT systems (Revolution Maxima; GE Healthcare, Chicago, IL, USA or Aquilion ONE; Canon, Tokyo, Japan) with the patient supine. The main scanning parameters were as follows: tube voltage, 120 kVp; automatic tube current modulation, 40–140 mAs; pitch, 0.828–1.375 mm; matrix, 512 × 512; slice thickness, 2.5–3.0 mm; and field of view, 400×400 mm. All images were then reconstructed with a slice thickness of 0.5–1.25 mm and 1-mm increments.
Image Interpretation
Images were analyzed by three senior fellows of the Japanese Respiratory Society. Evaluators independently and freely assessed CT features using axial CT, multiplanar reconstruction images, and high-resolution CT. After separate evaluations, any disagreements were resolved by discussion as a consensus decision of all three senior fellows of the Japanese Respiratory Society.
Calculation of Volumes of GGOs and Consolidation
We used a tool newly developed by Fujitsu Limited (Tokyo, Japan) to annotate shadows manually and automatically calculated the volume based on annotation results (Figure 1). Specifically, we selected 30 images including lung fields from one series of CT images for each case at as close to equal intervals as possible to calculate volumes of GGO and consolidation. All CT images were monochrome, 512 pixels × 512 pixels on the axial view and including both lungs. The following processing was performed on each selected image:
- Division of image into 1024 (32 × 32) patches, each as a 16 pixel ×16 pixel square.
- Confirmation of CT images by senior fellows of the Japanese Respiratory Society and identification of each patch as “Consolidation due to COVID-19 pneumonia”, “GGO due to COVID-19 pneumonia”, “Other lung”, or “Extrapulmonary field”. CT images are rendered into 3 dimensions by linear interpolation between the selected 30 images, and patches were also rendered into 3 dimensions. Volumes of patches classified as “Consolidation due to COVID-19 pneumonia”, “GGO due to COVID-19 pneumonia” or “Other lung” were obtained.
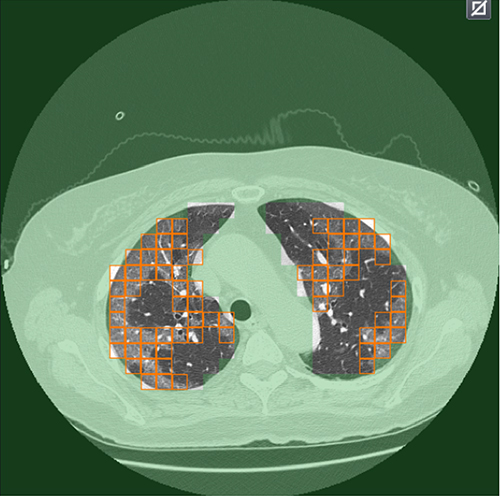 |
Figure 1 The annotation tool developed by Fujitsu Limited to annotate shadows manually for automatic calculation of volume. |
Statistical Analysis
We selected a propensity score-matched case-control study design to evaluate prognostic predictors in radiographic and blood test findings at diagnosis in COVID-19. We defined a severe respiratory failure group (severe respiratory failure group: non-rebreather mask, nasal high-flow, noninvasive positive-pressure ventilation (NIPPV) or invasive positive-pressure ventilation) as cases and a non-severe respiratory failure group (non-severe respiratory failure group: nasal cannula or mask or no oxygen administration) as controls. These groups were used as the dependent variable. A multivariable logistic regression model was used to construct case propensity scores, and confounding factors of patient characteristics that impacted on patient prognosis and were examined based on findings from the previous studies7–13 were included for the construction of propensity scores: 1) sex; 2) age; 3) body mass index (BMI); 4) presence of hypertension; 5) presence of diabetes; 6) presence of dyslipidemia, and 7) presence of chronic renal failure. Age and BMI were used as the binary data (age over 60 or not; BMI over 25 or not) for the construction of propensity scores.
Propensity score-matched groups were created at a ratio of 1:3 based on the nearest neighbor matching algorithm with a 0.2-caliper distance of the standard deviation of the logit of the propensity score with replacements. Discrimination (ie, the capability to classify individuals with and without events) was evaluated by the C-statistic or the area under the receiving operating characteristic curve. We compared the severe and non-severe respiratory failure groups for the following independent variables; maximum body temperature up to diagnosis, blood test findings, CT findings (uni- or bilateral, number of lobes with shadows, the volume ratio of GGO to whole lung field, the volume ratio of consolidation to whole lung field, volume ratios of GGO to each of the upper, middle and lower lung fields, volume ratios of consolidation to teach of the upper, middle and lower lung fields, mediastinal lymphadenopathy (including those with short-axis diameter <1 cm), traction bronchiectasis, fibrous stripes/subpleural curvilinear lines, pleural thickening, vascular enlargement, pleural effusion, and pericardial effusion.
Continuous and categorical variables of patient characteristics were compared using Student’s t-test and the χ2 test within each set. Ratios of GGO consolidation to total/upper/middle/lower lung field were compared using the Mann–Whitney U-test. Multivariate linear regression was also used to evaluate whether significantly different factors were associated with severe/non-severe respiratory failure due to insufficient absolute standardized differences in the patient characteristics used for constructing propensity scores between propensity score-matched cases and controls and to confirm double robustness by the propensity-score matched study and multivariate linear regression analyses.
Moreover, we used likelihoods to plot the receiver operating characteristic (ROC) curve and identified optimal cut-offs for predicted probability by maximizing the Youden index. Two-tailed P-values <0.05 were considered significant. Data were analyzed using STATA® version 16 (StataCorp, College Station, TX, USA). All files of extracted data were encoded to anonymize patient data and prevent personal identification.
Results
Regarding the background characteristics of the 66 patients (38 men, 28 women), the mean age was 51.5 years (standard deviation, 17.2 years). Mean BMI was 24.7 kg/m2 (standard deviation, 4.34 kg/m2). Hypertension was the most common comorbidity (n=14, 21.2%), followed by diabetes (n=10, 15.2%), and dyslipidemia (n=2, 3%). Fifty-nine patients were hospitalized, and the mean duration of hospitalization was 18.7 days (standard deviation 14.5 days). Fifty-five patients were confirmed negative by RT-PCR after an average of 20.7 days from diagnosis (standard deviation, 9.19 days).
Twenty-seven patients had received oxygen therapy or ventilation management. Two patients received nasal high-flow therapy, three had NIPPV, seven had mechanical ventilation, and two had mechanical ventilation and extracorporeal membrane oxygenation. Thirty-six patients received antiviral treatments such as favipiravir and/or remdesivir and 50 patients were treated with corticosteroids. Four patients (6.1%) died.
Distributions of baseline characteristics in patients from the severe and non-severe respiratory groups are shown in Table 1 in both unmatched and matched samples. The area under the ROC of propensity scores for severe respiratory failure was 0.83 (95% confidence interval, 0.72–0.94).
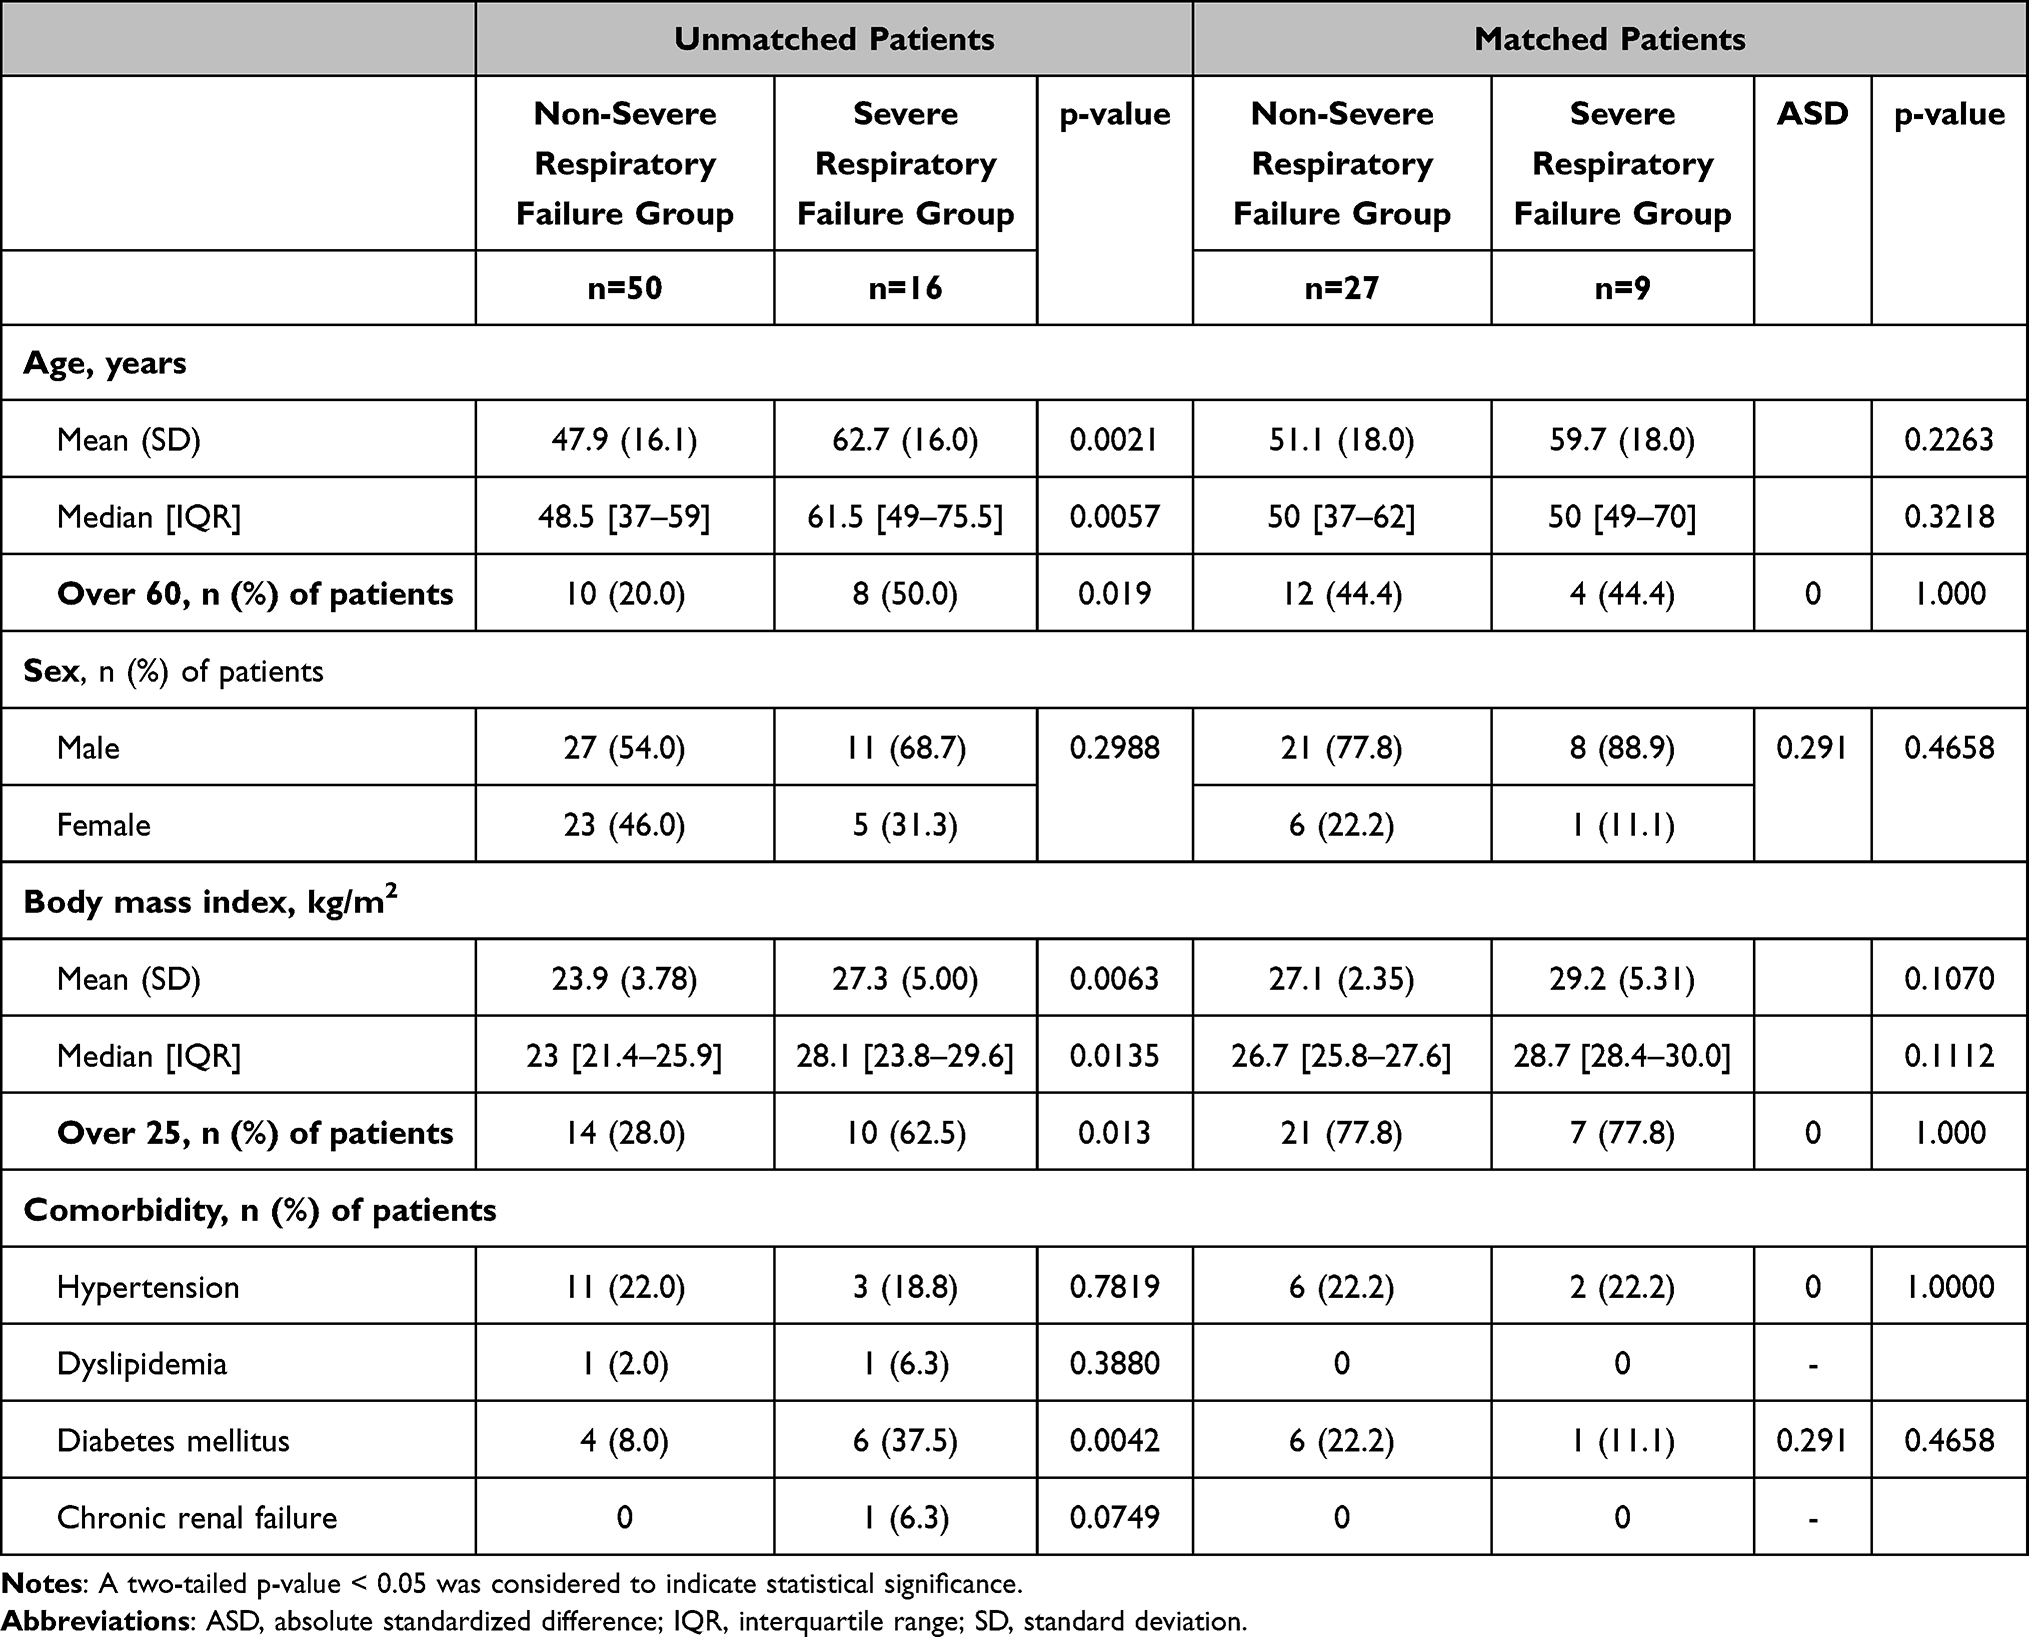 |
Table 1 Baseline Characteristics in Unmatched and Matched Patients |
In the unmatched sample, the severe respiratory failure group was older, with higher BMI and a higher prevalence of diabetes. There was no significant difference in the period from onset to diagnosis (median [IQR] 4.00 [3.00–6.75] days in non-severe respiratory failure group vs 5.00 [4.00–7.00] days in severe respiratory failure group, p=0.448).
Although baseline characteristics seemed well balanced between severe and non-severe respiratory failure groups after propensity score matching, absolute standardized differences were not less than 0.1 in sex and history of diabetes mellitus (Table 1).
Table 2 shows the results of maximum fever up to diagnosis, blood findings, and CT findings at the first visit. CRP, LDH, uric acid, and fibrinogen were more elevated in the severe respiratory failure group. There was no significant difference in the period from the onset to the day CT was performed (median [IQR] 4.50 [3.00–6.75] days in non-severe respiratory failure group vs 5.00 [4.00–6.25] days in severe respiratory failure group, p=0.671). GGO was more extensive than consolidation in both non-severe and severe respiratory failure groups. Distributions of both GGO and consolidation were increased toward the bottom of the lungs. Opacities were almost always evident bilaterally. In the severe respiratory failure group, shadows were more frequently multilobed. Mediastinal lymphadenopathy was observed in 34 cases (51.5%) and tended to be more common in the severe respiratory failure group. Two patients classed as serious cases showed pleural effusion. Pleural thickening was observed in 11 cases (16.7%) and tended to be more common in the non-severe respiratory failure group. Twenty-one cases (31.8%) showed subpleural curvilinear lines/stripe shadows. Vascular enlargement was observed in two cases (3.0%). Traction bronchiectasis was observed in one severe case.
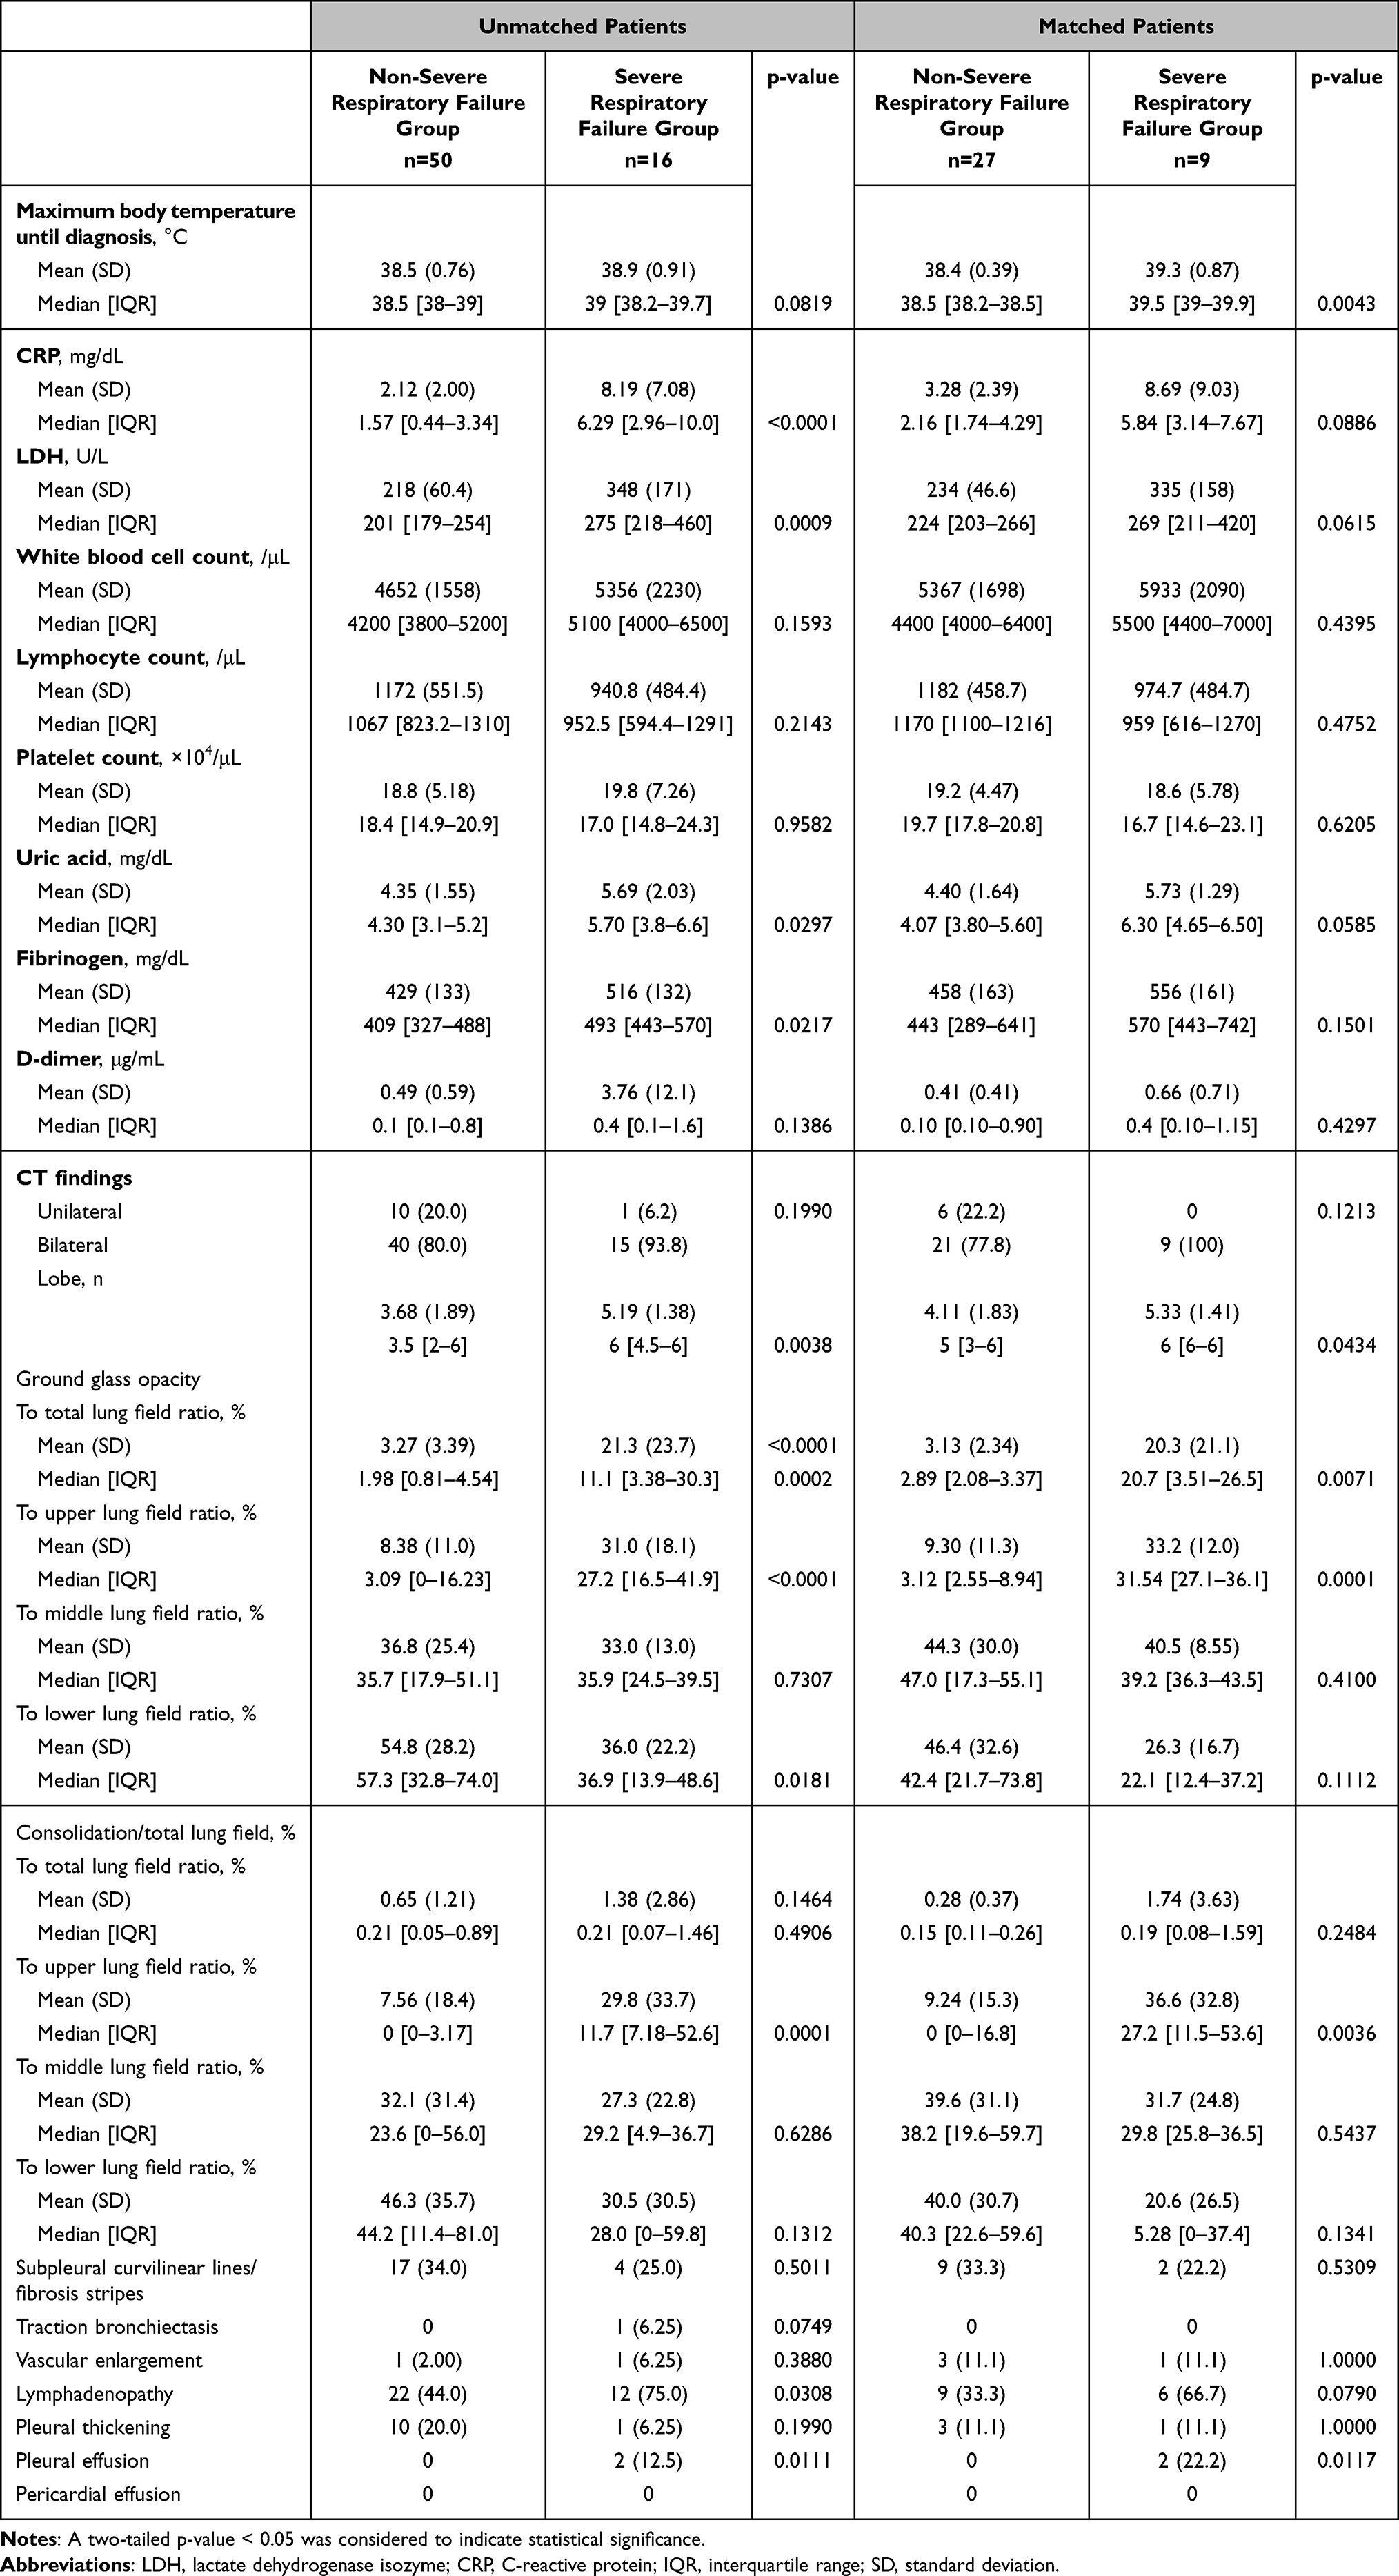 |
Table 2 Outcomes of Comparison Between Non-Severe and Severe Respiratory Failure Groups in Unmatched and Matched Patients |
Among matched patients, significant differences in maximum body temperature up to diagnosis, number of shaded lung lobes, amount of GGO in the total lung field, amount of GGO in the upper lung field, amount of consolidation in the upper lung field, and presence of pleural effusion differed significantly. The property of severe respiratory failure was significantly associated with increases in these factors except pleural effusion on multivariate linear regression after adjusting the factors used for the construction of propensity scores in the matched cohort (Table 3). The optimal cutoff for GGO in the total lung field on logistic regression probabilities was 14.6% (Figure 2).
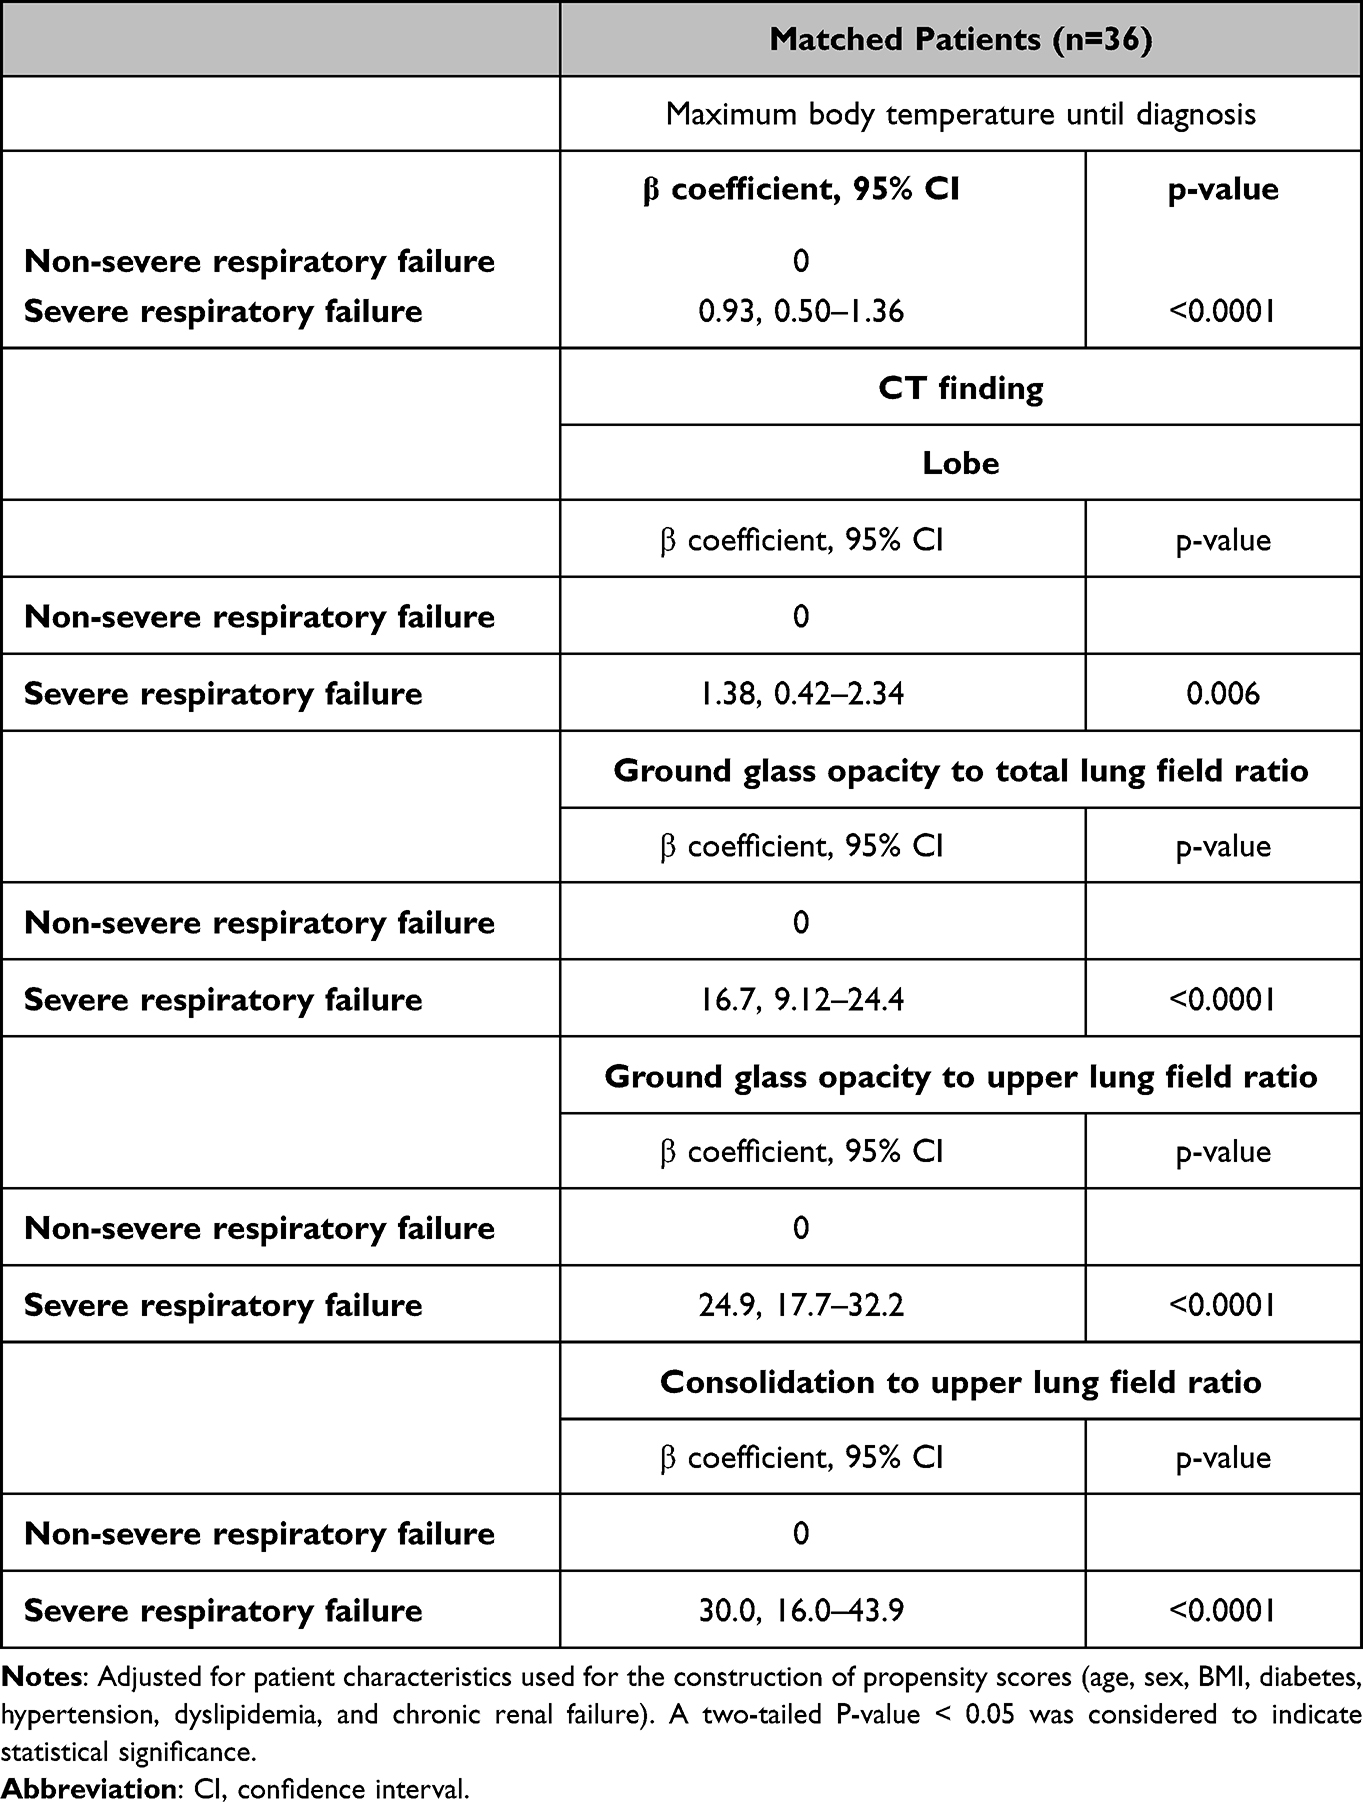 |
Table 3 Association with Maximum Body Temperature Until Diagnosis, CT Findings (Lobe, Ground Glass Opacity-to-Total Lung Field Ratio, Ground Glass Opacity-to-Upper Lung Field Ratio, and Consolidation-to-Upper Lung Field Ratio) on Multivariate Linear Regressions in the Matched Cohort |
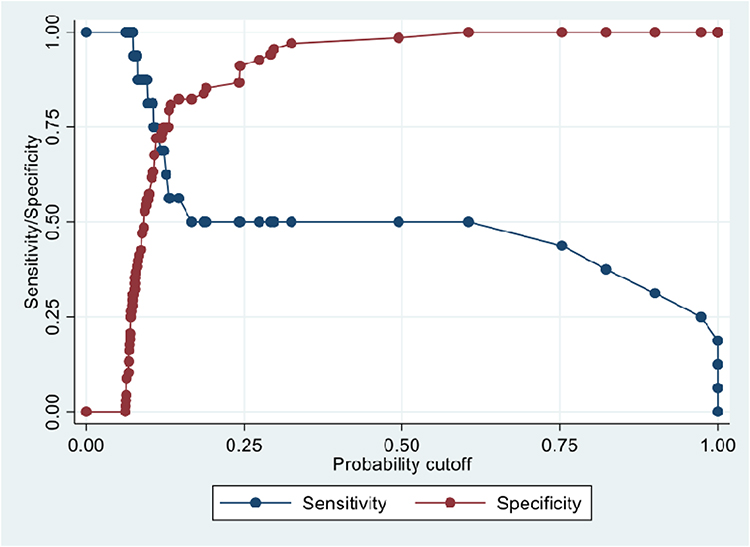 |
Figure 2 ROC curve for GGO/total lung field and sensitivity/specificity as a function of probability cut-off. The optimal cutoff on logistic regression probabilities was the intersection point reflecting the optimal balance between sensitivity and specificity (GGOs/total lung field 14.6%). |
Discussion
In our study using propensity score matching to reduce bias due to confounding factors by matching patients for baseline variables using multivariable logistic regression modeling, significant differences in maximum body temperature were seen up to diagnosis, the number of shaded lung lobes, amount of GGO in the total lung field, amount of GGO in the upper lung field, amount of consolidation in the upper lung field, and presence of pleural effusion. Blood findings did not differ significantly, and fever and radiological findings were more prognostic at diagnosis. COVID-19 is considered a disease for which the prognosis changes significantly depending on age and underlying disease. It is very important to match patient background characteristics as confounding factors and extracting prognosis-related factors from physical, laboratory and imaging findings. The subjects in this study were infected by the original strain, unvaccinated, and not reinfected, thus demonstrating which findings are purely prognostic.
In this study, maximum body temperature up to diagnosis was a predictor of prognosis. Fever was considered a predictor of mortality by Iftime et al21 and one of the items in the prognostic score generated from the COVID-19 hospitalized case registry,22 and the same result was obtained in this study.
In terms of radiographic findings, the number of shaded lung lobes, amount of GGO in the total lung field, amount of GGO in the upper lung field, amount of consolidation in the upper lung field, and presence of pleural effusion differed significantly after propensity score matching. In the early stages of COVID‐19, lesions usually manifest as localized GGO, subpleural bands, vascular enlargement, and peripheral distribution on CT. This is because the virus invades and replicates in the alveolar epithelium and exudates leak mainly into the alveolar space with distributions mainly under the pleura or around the peribronchovascular regions.23,24 With disease progresses, the range of involved alveoli and mucosa increases, and bronchial walls swell, contributing to patterns of air bronchograms with consolidation and bronchial wall thickening. Patterns of crazy‐paving, interlobular septal thickening, and reticulation basically reflect the involvement of pulmonary interstitium, such as interlobular interstitial edema.25 In most patients, the lower lobes are involved more frequently than the upper and middle lobes. A peripheral distribution, multilobar involvement, and posterior involvement are other important characteristics of lesions distribution.26 According to a report by Ye et al,4 pleural effusion was observed in about 5% and pleural thickening in about 30%, subpleural curvilinear lines in about 20% and lymphadenopathy in 4–8%. Subpleural curvilinear lines are reportedly related to pulmonary edema or fibrosis.4 Stripe shadows were thought to be related to the healing of pulmonary chronic inflammation or proliferative disease,4 with gradual replacement of cellular components by scar tissue. Vascular enlargement is described as the dilation of pulmonary vessels around and within the lesions, which might be attributed to damage to and swelling of the capillary wall caused by pro-inflammatory factors.4 Song et al27 found more consolidative lesions in patients with a longer interval between symptom onset or with age over 50 years and suggested that this manifestation may warrant greater attention in the management of patients. In a meta-analysis of chest features on CT by Zheng et al,26 compared to findings in common patients, some CT manifestations were more frequent in severe patients, such as traction bronchiectasis, interlobular septal thickening, consolidation, crazy‐paving pattern, reticulation, pleural effusion, and lymphadenopathy. However, these findings are not seen in the early stages of the disease and are not considered predictors of prognosis in the early stage. In our study, although significant differences were observed in the amount of GGO or consolidation and the presence of pleural effusion, traction bronchiectasis was rarely observed, and no significant differences in lymphadenopathy were identified. These may be because traction bronchiectasis is a finding in the advanced phase, and lymphadenopathy cases with a short axis diameter of 1 cm or more in this study were rare. Based on the present results, early predicators of prognosis could be widespread GGO, widespread GGO extending to the upper lung field, early presence of consolidation in atypical sites that is more frequently seen in the late phase, and pleural effusion that is usually seen in the late phase.
Zhou et al28 reported that elevated white blood cell count, decreased lymphocyte count, thrombocytopenia, elevated lactate dehydrogenase, elevated creatinine, elevated D-dimer, elevated ferritin, elevated high-sensitivity cardiac troponin I, and elevated interleukin (IL)-6 were seen in patients who died from COVID-19. Ayanian et al29 reported that monitoring IL-6, D-dimer, CRP, LDH, and ferritin was clinically useful in this respect, particularly when these markers were above the mentioned cutoff values. d’Alessandro et al30 reported KL-6 measurement as potentially useful for evaluating the prognosis of COVID-19 patients. Sugiyama et al31 reported that elevated IFN-λ3, elevated IP-10, elevated C-X-C motif Chemokine ligand (CXCL9), and low Thymus and activation-regulated chemokine (TARC) could be promising prognostic markers to distinguish between mild/moderate and severe/critical patients. In this study, no significant difference in blood test findings were confirmed at the first visit in daily clinical practice, indicating the difficulty of predicting disease severity at the first visit and also revealing fever and radiological findings as more important factors than blood test.
Several prognostic scores have been developed for hospitalized patients, including the COVID-GRAM and the ISARIC WHO 4C Mortality Score. COVID-GRAM was developed in China and includes age, underlying disease, history of malignancy, chest X-ray, symptoms (dyspnea, bloody sputum, impaired consciousness), and blood findings (neutrophils/lymphocyte ratio, LDH, and direct bilirubin).32 The accuracy of the COVID risk score in the validation cohort was similar to that in the development cohort, with an AUC in the validation cohort of 0.88 (95% CI, 0.84–0.93). The 4C mortality score developed in the United Kingdom consists of age, sex, number of underlying illnesses, respiratory rate, saturation of percutaneous oxygen (SpO2), Glasgow Coma Scale, and blood tests (blood urea nitrogen (BUN), CRP).33 This score showed high discrimination for mortality (derivation cohort: area under the receiver operating characteristic curve, 0.79; 95% confidence interval, 0.78–0.79; validation cohort, 0.77, 0.76–0.77) with excellent calibration (validation: calibration-in-The-large=0, slope=1.0). In Japan, a score based on COVIREGI-JP analysis consisting of age, sex, BMI, congestive heart failure, cerebrovascular disease, diabetes, hypertension, malignant disease, and symptoms (fever, cough, dyspnea, wheezing, fatigue) was published.22 Many of these prognostic scores were developed before the widespread use of vaccines. It is necessary to pay attention to whether they can be applied during epidemics of Omicron strains with different clinical features that are attenuated. Furthermore, the underlying diseases listed in these scores have a high morbidity rate. During the epidemic, when the number of infected people is high, COVID-19 with the same underlying disease increases, and the possibility of following various clinical courses increases. Under such circumstances, it is essential to predict aggravation based on examination findings at the early stage of diagnosis. Fan et al34 compared the accuracy of several severity scores for community-acquired pneumonia including Pneumonia Severity Index (PSI), CURB-65 and CRB-65, A-DROP, SMART-COP. NEWS2 and qSOFA were also compared. Among all seven scores determined using patient information on admission, A-DROP presented the highest discrimination (AUC 0.87; 95% CI 0.84–0.90), following by CURB-65 (AUC 0.85; 95% CI 0.81–0.89), PSI (AUC 0.85; 95% CI 0.81–0.88), SMART-COP (AUC 0.84; 95% CI 0.80–0.88), NEWS2 (AUC 0.81; 95% CI 0.77–0.85), CRB-65 (AUC 0.80; 95% CI 0.76–0.84), and qSOFA (AUC 0.73; 95% CI 0.69–0.78) for predicting in-hospital death. The prognosis prediction score for COVID-19, which shows few subjective symptoms in the early stage and potentially progresses, seems to depend on severe symptoms and hypoxemia, and may be unsuitable for predicting prognosis at an earlier stage. In addition, that score does not include CT findings, and addition of factors for the distribution of GGO and consolidation at an early stage would be better, based on the results of this study. The quantification of GGO and consolidation can generally be measured by installing the software. In addition, referring to the fact that the cutoff for the ratio of GGO to the entire lung field in all cases for severe and non-severe cases was 14.6%, for convenience, GGO that occupies one-sixth of the total lung field on chest X-ray, the presence of GGO in the upper lung field and the presence of consolidation in the upper lung field may be used as indexes.
As limitations to this study, first, the present study was a single-center experience. Our hospital mainly treated patients with mild to moderate illness at first, and selection biases may thus have impact the enrollment of patients. This was also related to the slightly lower frequency of comorbidities. However, our hospital is a core hospital in an area with a population of about 1 million. As the pandemic spread, we accepted a wide range of patients from mild to severe cases early; the subjects of this study are considered to be a population commonly seen in daily clinical practice. So we do not think there is a significant bias in this study. But, the generalizability of the results obtained in the study was insufficient, and a multicenter study is required to confirm these results. Second, although we matched patient characteristics using propensity scores and by balancing variables, unmeasured confounders were not balanced between cases and controls in the present study.
Conclusion
Although further research is needed to confirm the generalizability of the findings, the results of this study demonstrate that the presence of high fever, the wide distribution of viral pneumonia leading to ARDS in response to viral proliferation, and pleural effusion are significant predictors of prognosis when age and underlying disease are similar. These indicators can be examined in daily clinical practice and are very helpful in determining whether a patient should be hospitalized. This finding suggests that these are universal indicators not affected by virus mutation or vaccine immunity. This is an essential message for COVID-19 to be addressed like any other viral disease.
Data Sharing Statement
The data presented in this study are available on request from the corresponding author. The data are not publicly available due to privacy or ethical restrictions.
Institutional Review Board Statement
This study was approved by the ethics committee of Tokyo Shinagawa Hospital (approval number 20-A-06) and was performed in accordance with the 1964 Declaration of Helsinki and its later amendments or comparable ethical standards.
Informed Consent Statement
The requirement to obtain informed consent for participation was waived due to the retrospective nature of this study.
Acknowledgments
We are grateful to all patients who participated in this study and their families.
Funding
This research did not receive any specific grants from funding agencies in the public, commercial, or not-for-profit sectors.
Disclosure
The authors have stated that they have no conflicts of interest.
References
1. Umakanthan S, Sahu P, Ranade AV, et al. Origin, transmission, diagnosis and management of coronavirus disease 2019 (COVID-19). Postgrad Med J. 2020;96(1142):753–758. doi:10.1136/postgradmedj-2020-138234
2. Wiersinga WJ, Rhodes A, Cheng AC, Peacock SJ, Prescott HC. Pathophysiology, transmission, diagnosis, and treatment of coronavirus disease 2019 (COVID-19): a review. JAMA. 2020;324(8):782–793. doi:10.1001/jama.2020.12839
3. Zhou M, Zhang X, Qu J. Coronavirus disease 2019 (COVID-19): a clinical update. Front Med. 2020;14(2):126–135. doi:10.1007/s11684-020-0767-8
4. Ye Z, Zhang Y, Wang Y, Huang Z, Song B. Chest CT manifestations of new coronavirus disease 2019 (COVID-19): a pictorial review. Eur Radiol. 2020;30(8):4381–4389. doi:10.1007/s00330-020-06801-0
5. Li M, Lei P, Zeng B, et al. Coronavirus disease (COVID-19): spectrum of CT findings and temporal progression of the disease. Acad Radiol. 2020;27(5):603–608. doi:10.1016/j.acra.2020.03.003
6. Pan F, Ye T, Sun P, et al. Time course of lung changes at chest CT during recovery from coronavirus disease 2019 (COVID-19). Radiology. 2020;295(3):715–721. doi:10.1148/radiol.2020200370
7. Wu C, Chen X, Cai Y, et al. Risk factors associated with acute respiratory distress syndrome and death in patients with coronavirus disease 2019 pneumonia in Wuhan, China. JAMA Intern Med. 2020;180(7):934–943. doi:10.1001/jamainternmed.2020.0994
8. Pranata R, Lim M, Yonas E, et al. Body mass index and outcome in patients with COVID-19: a dose-response meta-analysis. Diabetes Metab. 2021;47(2):101178. doi:10.1016/j.diabet.2020.07.005
9. Zhou Y, Chi J, Lv W, Wang Y. Obesity and diabetes as high-risk factors for severe coronavirus disease 2019 (Covid-19). Diabetes Metab Res Rev. 2021;37(2):e3377. doi:10.1002/dmrr.3377
10. Zheng Z, Peng F, Xu B, et al. Risk factors of critical & mortal COVID-19 cases: a systematic literature review and meta-analysis. J Infect. 2020;81(2):e16–e25. doi:10.1016/j.jinf.2020.04.021
11. Yang J, Zheng Y, Gou X, et al. Prevalence of comorbidities and its effects in patients infected with SARS-CoV-2: a systematic review and meta-analysis. Int J Infect Dis. 2020;94:91–95. doi:10.1016/j.ijid.2020.03.017
12. Cheng Y, Luo R, Wang K, et al. Kidney disease is associated with in-hospital death of patients with COVID-19. Kidney Int. 2020;97(5):829–838. doi:10.1016/j.kint.2020.03.005
13. Hariyanto TI, Kurniawan A. Dyslipidemia is associated with severe coronavirus disease 2019 (COVID-19) infection. Diabetes Metab Syndr. 2020;14(5):1463–1465. doi:10.1016/j.dsx.2020.07.054
14. Umakanthan S, Bukelo MM, Gajula SS. The Commonwealth Caribbean COVID-19: regions resilient pathway during pandemic. Front Public Health. 2022;10:844333. doi:10.3389/fpubh.2022.844333
15. COVID-19 data repository by the center for systems science and engineering (CSSE) at Johns Hopkins University. Available from: https://github.com/CSSEGISandData/COVID-19.
16. Horita N, Fukumoto T. Global case fatality rate from COVID-19 has decreased by 96.8% during 2.5 years of the pandemic. J Med Virol. 2023;95(1):e28231. doi:10.1002/jmv.28231
17. Graña C, Ghosn L, Evrenoglou T, et al. Efficacy and safety of COVID-19 vaccines. Cochrane Database Syst Rev. 2022;12(12):CD015477. doi:10.1002/14651858.CD015477
18. Umakanthan S, Patil S, Subramaniam N, Sharma R. COVID-19 vaccine hesitancy and resistance in India explored through a population-based longitudinal survey. Vaccines(Basel). 2021;9(10):1064. doi:10.3390/vaccines9101064
19. Umakanthan S, Lawrence S. Predictors of COVID-19 vaccine hesitancy in Germany: a cross-sectional, population-based study. Postgrad Med J. 2022;98(1164):756–764. doi:10.1136/postgradmedj-2021-141365
20. Umakanthan S, Bukelo MM, Bukelo MJ, Patil S, Subramaniam N, Sharma R. Social environmental predictors of COVID-19 vaccine hesitancy in India: a population-based survey. Vaccines(Basel). 2022;10(10):1749. doi:10.3390/vaccines10101749
21. Iftimie S, López-Azcona AF, Vicente-Miralles M, et al. Risk factors associated with mortality in hospitalized patients with SARS-CoV-2 infection. A prospective, longitudinal, unicenter study in Reus, Spain. PLoS One. 2020;15(9):e0234452. doi:10.1371/journal.pone.0234452
22. Yamada G, Hayakawa K, Matsunaga N, et al. Predicting respiratory failure for COVID-19 patients in Japan: a simple clinical score for evaluating the need for hospitalization. Epidemiol Infect. 2021;149:e175. doi:10.1017/S0950268821001837
23. Dai WC, Zhang HW, Yu J, et al. CT imaging and differential diagnosis of COVID‐19. Can Assoc Radiol J. 2020;71(2):
24. Chen H, Ai L, Lu H, Li H. Clinical and imaging features of COVID‐19. Radiol Infect Dis. 2020;7(2):43–50. doi:10.1016/j.jrid.2020.04.003
25. Yang W, Sirajuddin A, Zhang X, et al. The role of imaging in 2019 novel coronavirus pneumonia (COVID‐19). Eur Radiol. 2020;30(9):4874–4882. doi:10.1007/s00330-020-06827-4
26. Zheng Y, Wang L, Ben S. Meta-analysis of chest CT features of patients with COVID-19 pneumonia. J Med Virol. 2021;93(1):241–249. doi:10.1002/jmv.26218
27. Song F, Shi N, Shan F, et al. Emerging 2019 novel coronavirus (2019-nCoV) pneumonia. Radiology. 2020;295(1):210–217. doi:10.1148/radiol.2020200274
28. Zhou F, Yu T, Du R, et al. Clinical course and risk factors for mortality of adult inpatients with COVID-19 in Wuhan, China: a retrospective cohort study. Lancet. 2020;395(10229):1054–1062. doi:10.1016/S0140-6736(20)30566-3
29. Ayanian S, Reyes J, Lynn L, Teufel K. The association between biomarkers and clinical outcomes in novel coronavirus pneumonia in a US cohort. Biomark Med. 2020;14(12):1091–1097. doi:10.2217/bmm-2020-0309
30. d’Alessandro M, Cameli P, Refini RM, et al. Serum KL‐6 concentrations as a novel biomarker of severe COVID‐19. J Med Virol. 2020;92(10):2216–2220. doi:10.1002/jmv.26087
31. Sugiyama M, Kinoshita N, Ide S, et al. Serum CCL17 level becomes a predictive marker to distinguish between mild/moderate and severe/critical disease in patients with COVID-19. Gene. 2021;766:145145. doi:10.1016/j.gene.2020.145145
32. Liang W, Liang H, Ou L, et al. Development and validation of a clinical risk score to predict the occurrence of critical Illness in hospitalized patients with COVID-19. JAMA Intern Med. 2020;180(8):1081–1089. doi:10.1001/jamainternmed.2020.2033
33. Knight SR, Ho A, Pius R, et al. Risk stratification of patients admitted to hospital with covid-19 using the ISARIC WHO clinical characterisation protocol: development and validation of the 4C Mortality Score. BMJ. 2020;370:m3339. doi:10.1136/bmj.m3339
34. Fan G, Tu C, Zhou F, et al. Comparison of severity scores for COVID-19 patients with pneumonia: a retrospective study. Eur Respir J. 2020;56(3):2002113. doi:10.1183/13993003.02113-2020
 © 2023 The Author(s). This work is published and licensed by Dove Medical Press Limited. The full terms of this license are available at https://www.dovepress.com/terms.php and incorporate the Creative Commons Attribution - Non Commercial (unported, v3.0) License.
By accessing the work you hereby accept the Terms. Non-commercial uses of the work are permitted without any further permission from Dove Medical Press Limited, provided the work is properly attributed. For permission for commercial use of this work, please see paragraphs 4.2 and 5 of our Terms.
© 2023 The Author(s). This work is published and licensed by Dove Medical Press Limited. The full terms of this license are available at https://www.dovepress.com/terms.php and incorporate the Creative Commons Attribution - Non Commercial (unported, v3.0) License.
By accessing the work you hereby accept the Terms. Non-commercial uses of the work are permitted without any further permission from Dove Medical Press Limited, provided the work is properly attributed. For permission for commercial use of this work, please see paragraphs 4.2 and 5 of our Terms.