Back to Journals » OncoTargets and Therapy » Volume 16
High Expression of Triggering Receptor Expressed on Myeloid Cells 1 Predicts Poor Prognosis in Glioblastoma
Authors Ma K ![]() , Guo Q, Zhang X, Li Y
, Guo Q, Zhang X, Li Y
Received 9 February 2023
Accepted for publication 23 May 2023
Published 29 May 2023 Volume 2023:16 Pages 331—345
DOI https://doi.org/10.2147/OTT.S407892
Checked for plagiarism Yes
Review by Single anonymous peer review
Peer reviewer comments 2
Editor who approved publication: Dr Arseniy Yuzhalin
Ke Ma,1 Qianqian Guo,1 Xianwei Zhang,2 Yanxin Li3
1Department of Medical Oncology, the First Affiliated Hospital of Zhengzhou University, Zhengzhou, Henan, 450052, People’s Republic of China; 2Department of Pathology, Henan Provincial People’s Hospital; People’s Hospital of Zhengzhou University; People’s Hospital of Henan University, Zhengzhou, Henan, 450003, People’s Republic of China; 3Department of Neurosurgery, Henan Provincial People’s Hospital; People’s Hospital of Zhengzhou University; People’s Hospital of Henan University, Zhengzhou, Henan, 450003, People’s Republic of China
Correspondence: Yanxin Li, Department of Neurosurgery, Henan Provincial People’s Hospital, People’s Hospital of Zhengzhou University, People’s Hospital of Henan University, No. 7, Wei Wu Road, Zhengzhou, Henan, 450003, People’s Republic of China, Email [email protected]
Background: Glioblastoma (GBM) is a highly malignant tumor with poor prognosis, and new treatment strategies are urgently needed. Currently, the role of triggering receptor expressed on myeloid cells 1 (TREM-1) in tumors has been studied, but the role of TREM-1 in GBM remains unclear.
Methods: Immunohistochemical staining for TREM-1 was performed in 91 patients diagnosed with GBM. Clinicopathological characteristics and survival times were recorded. TREM-1 expression and its effect on prognosis were analyzed using online Gene Expression Profiling Interactive Analysis (GEPIA), The Cancer Genome Atlas (TCGA), and Chinese Glioma Genome Atlas (CGGA) databases. The expression profile of TCGA-GBM cohort was used to perform functional enrichment analysis. The CIBERSORT method and Tumor Immune Estimation Resource (TIMER) database were used to estimate the tumor-infiltrating immune cells (TIICs). The ESTIMATE algorithm was used to estimate the immune-stromal scores. Finally, the relationships of TREM-1 with TIICs, immune-stromal score, and immune checkpoint genes (ICGs) were analyzed.
Results: The expression of TREM-1 was upregulated in GBM, and high TREM-1 expression predicted a poor prognosis. TREM-1, surgical resection, postoperative radiotherapy, and temozolomide (TMZ) chemotherapy were associated with the survival time of patients with GBM, but only surgical resection and TREM-1 expression were independent prognostic factors. GBM with high TREM-1 expression exhibited increased neutrophil and macrophage infiltration. TREM-1 was positively associated with the immune-stromal score and multiple ICGs, and most of which were involved in immunosuppressive responses.
Conclusion: The present study revealed that high expression of TREM-1 in GBM is an independent poor prognosis factor and that TREM-1 is associated with the immunosuppressive microenvironment. Thus, blocking TREM-1 may be a strategy for enhancing the GBM immune response.
Keywords: TREM-1, tumor-infiltrating immune cells, immune checkpoint genes, prognosis, glioblastoma
Introduction
Glioblastoma (GBM) is a malignant glioma that is classified as grade IV according to the World Health Organization (WHO) classification criteria. As GBM is invasive and has no obvious boundary with normal tissue, it cannot be treated by surgery alone.1 Postoperative radiotherapy and chemotherapy are generally administered, but their overall clinical efficacy and prognosis are still unsatisfactory. The median overall survival (mOS) time of GBM after standardized treatment is only 14.2 months.2 Thus, it is urgent to seek new treatment methods to improve the prognosis of GBM.
Tumor occurrence and development are determined by the tumor cells themselves as well as the inflammatory and immune components in the tumor microenvironment.3 The major features of cancer-related inflammation include the infiltration of white blood cells, infiltration of prominent tumor-associated macrophages (TAMs), and the presence of polypeptide messengers of inflammation.4 Inflammation favors carcinogenesis, malignant transformation, tumor growth, invasion, and metastatic spread, but it also stimulates immune effector mechanisms that may limit tumor growth.5
Triggering receptor expressed on myeloid cells 1 (TREM-1) plays an important role in the occurrence and amplification of inflammatory reactions and innate immune responses.6,7 Many studies have explored the significance of TREM-1 in infection and aseptic inflammation.8–10 Recently, the role of TREM-1 in tumors has gained increasing attention, and the prognostic significance of TREM-1 has been explored in various tumors.11
In hepatocellular carcinoma (HCC), TREM-1 is associated with the aggressive migratory ability of HCC cells, and the high density of peritumoral TREM-1 is associated with poor OS and elevated risks of recurrence.12 The high expression of TREM-1 in renal cell carcinoma (RCC) is associated with poor outcomes compared to patients with low or negligible TREM-1 expression.13 Studies on breast cancer have indicated that increased TREM-1 expression is a prognostic factor for inferior breast cancer outcomes and may contribute to myeloid-mediated breast cancer progression and immune suppression.14 TREM-1 expression in papillary thyroid cancer (PTC) tissues is also significantly higher than that in normal tissues, and it is associated with BRAFV600E profiles and advanced tumor stage. Overexpression of TREM-1 in PTC cells promotes an immunosuppressive microenvironment by enhancing regulatory T cell (Treg) infiltration.15 In non-small-cell lung cancer (NSCLC), TREM-1 expression in TAMs is associated with cancer recurrence and poor survival.16 Wu et al demonstrated that hypoxia-inducible factor 1α induces increased expression of TREM-1 in TAMs, resulting in immunosuppression in HCC.17 TREM-1 also mediates macrophage polarization by regulating the phosphoinositide 3-kinase (PI3K)/AKT signaling pathway in HCC.18 TAMs (mainly M2 macrophages) are predominant inflammatory cells that are closely related to the immune response in the tumor microenvironment, and they are recognized as antitumor suppressors.19 Thus, TREM-1 may promote tumor development and metastasis by promoting the tumor immune microenvironment.
With the great success of immunotherapy in a variety of tumors, especially immune checkpoint inhibitors (ICIs),20 many studies have explored the application prospect of immunotherapy in GBM.21 However, owing to the high secretion of transforming growth factor-β (TGF-β) and indoleamine 2,3-dioxygenase 1 (IDO), GBM has a significant immunosuppressive microenvironment,22,23 which may affect the efficacy of immunotherapy.24 Given the immunosuppressive microenvironment of GBM and the carcinogenic role of TREM-1 in mediating inflammatory immune responses, we investigated the prognostic impact and immunological relevance of TREM-1 expression in GBM to identify a new strategy to improve the efficacy of immunotherapy in GBM.
Materials and Methods
Database
mRNA sequencing data (in count format) of The Cancer Genome Atlas (TCGA)-GBM cohort were obtained from TCGA database (https://portal.gdc.cancer.gov/). The mRNA microarray data of 301 glioma patients as well as mRNA sequencing data of 693 glioma and 325 glioma patients were obtained from the Chinese Glioma Genome Atlas (CGGA) data portal (http://www.cgga.org.cn/). Patients histologically classified as GBM were screened for subsequent analysis. The online Gene Expression Profiling Interactive Analysis (GEPIA; http://gepia.cancer-pku.cn/) database was used to compare the mRNA expression of TREM-1 in GBM and normal tissues.
Patients and Samples
Clinical and pathological data were retrospectively collected from 91 operative patients diagnosed with GBM at the Henan Provincial People’s Hospital from January 2016 to December 2019. The patients included 53 males and 38 females aged 10–81 years old. All patients were classified according to the 2021 WHO classification system. The overall survival (OS) was calculated from the date of diagnosis until death or the end of the study. Progression-free survival (PFS) was calculated from the time of operation to the time of the first progression. Patients were followed up until death or the end of the study (December 2021). At the end of the data analysis, the follow-up time was from 1 to 68.9 months, and the median follow-up time was 12 months.
Immunohistochemical Staining and Scoring
All specimen tissues were sectioned into 4-µm serial sections. After dewaxing, hydration, antigen repair, and blocking of endogenous peroxidase, the sections were incubated with primary TREM-1 rabbit monoclonal antibody (ab225861; Abcam, Cambridge, UK) at 4°C overnight. The sections were then washed with sterile phosphate-buffered saline (PBS) and incubated with secondary antibodies for 1 h at room temperature. After adding substrate and hematoxylin staining, the slides were observed using a microscope and interpreted by qualified pathologists. Previously reported staining scoring criteria were used,25 and tissue sections with final staining scores ≥3 were considered positive.
Identification of Differentially Expressed Genes (DEGs) and Functional Enrichment Analysis
The transcription data of 153 samples from TCGA were divided into low- and high-TREM-1 groups according to the TREM-1 level. The analyses of DEGs, Gene Ontology (GO), and Encyclopedia of Genes and Genomes (KEGG) were performed according to previously reported methods.25,26 A volcano plot of DEGs was generated using the ggplot2 package in R. Gene set enrichment analysis (GSEA) was performed based on the JAVA platform using TREM-1 level as the phenotype and “hallmark gene sets” as the reference gene set, which was obtained from the MSigDB database (http://software.broadinstitute.org/gsea/msigdb/). The P values were adjusted by the false discovery rate (FDR) method, and FDR <0.25 was considered a significantly enriched pathway.
CIBERSORT Algorithm
To understand the differential profiles of tumor-infiltrating immune cells (TIICs) between the low- and high-TREM-1 groups, we downloaded the CIBERSORT script (https://cibersort.stanford.edu/) and ran the CIBERSORT package with 1000 permutations.26 After the samples were filtrated according to p>0.05, a total of 57 samples were selected to analyze the immune cells, including 29 low-TREM-1 samples and 28 high-TREM-1 samples. Box plots were utilized to visualize the specific fractions of 22 immune cells in each GBM sample. The differential infiltrating density between the low- and high-TREM-1 groups was analyzed by the Wilcoxon rank-sum test, and a violin plot was generated using the ggplot2 package in R.
Tumor Immune Estimation Resource (TIMER) Database
TIMER is a comprehensive resource for systematic analysis of immune infiltrates across multiple malignancies (https://cistrome.shinyapps.io/timer/).27 Based on the publicly available resources, we analyzed the correlations between TREM-1 and the infiltrating level of different subsets of immune cells, and Pearson’s correlation coefficient and the estimated p-value were calculated.
ESTIMATE Score
Immune cells and stromal cells are the two main cell types in the tumor microenvironment, and they play important roles in the occurrence and development of tumors. The ESTIMATE algorithm has been used to calculate immune scores and stromal scores.28 We used R software to estimate the immune scores and stromal scores for each tumor sample, and we then evaluated the relationship between TREM-1 expression and immune score in GBM.
Correlation Analysis of Immune Checkpoint Genes (ICGs)
We further analyzed the relationship between TREM-1 and 46 common ICGs based on TCGA database by using the psych package in R. Pearson’s correlation coefficient and the estimated p-value were calculated.
Protein-Protein Interaction (PPI) Network Analysis
The STRING database is used to search for known and predicted interactions between proteins. In the present study, 26 ICGs associated with TREM-1 based on TCGA database were used to map the PPI network using the STRING online tool (https://www.string-db.org/). The PPI network was constructed by setting the medium confidence at 0.400. All mentioned active interaction sources were included.
Statistical Analysis
For the statistical analyses, the Student’s t-test was used for continuous variables, while categorical variables were compared by the χ2 test. Cox analysis and the Log rank test were performed using the survival package in R. The Wilcoxon rank-sum test was used to compare the two groups. All statistical analyses were performed in RStudio (version 3.6.3), and p<0.05 was considered statistically significant.
Results
TREM-1 is Upregulated in GBM
GEPIA revealed that the mRNA expression of TREM-1 in GBM was significantly higher than that in normal tissues (Figure 1A). We next performed immunohistochemistry staining for TREM-1 in GBM and normal brain tissues. Immunostaining of TREM-1 was observed in both the cytoplasmic and membranous regions (Figure 1B-D). The protein expression of TREM-1 was significantly higher in GBM samples than in normal brain tissue (χ2 = 4.193, P = 0.041). The TREM-1 positive staining rate in GBM was 61.5% (56/91), while the TREM-1 positive staining rate in normal brain tissues was 33.3% (5/15). Correlation analysis of TREM-1 expression with clinicopathological features of GBM patients showed that TREM-1 expression was significantly associated with the status of P53 (Table 1).
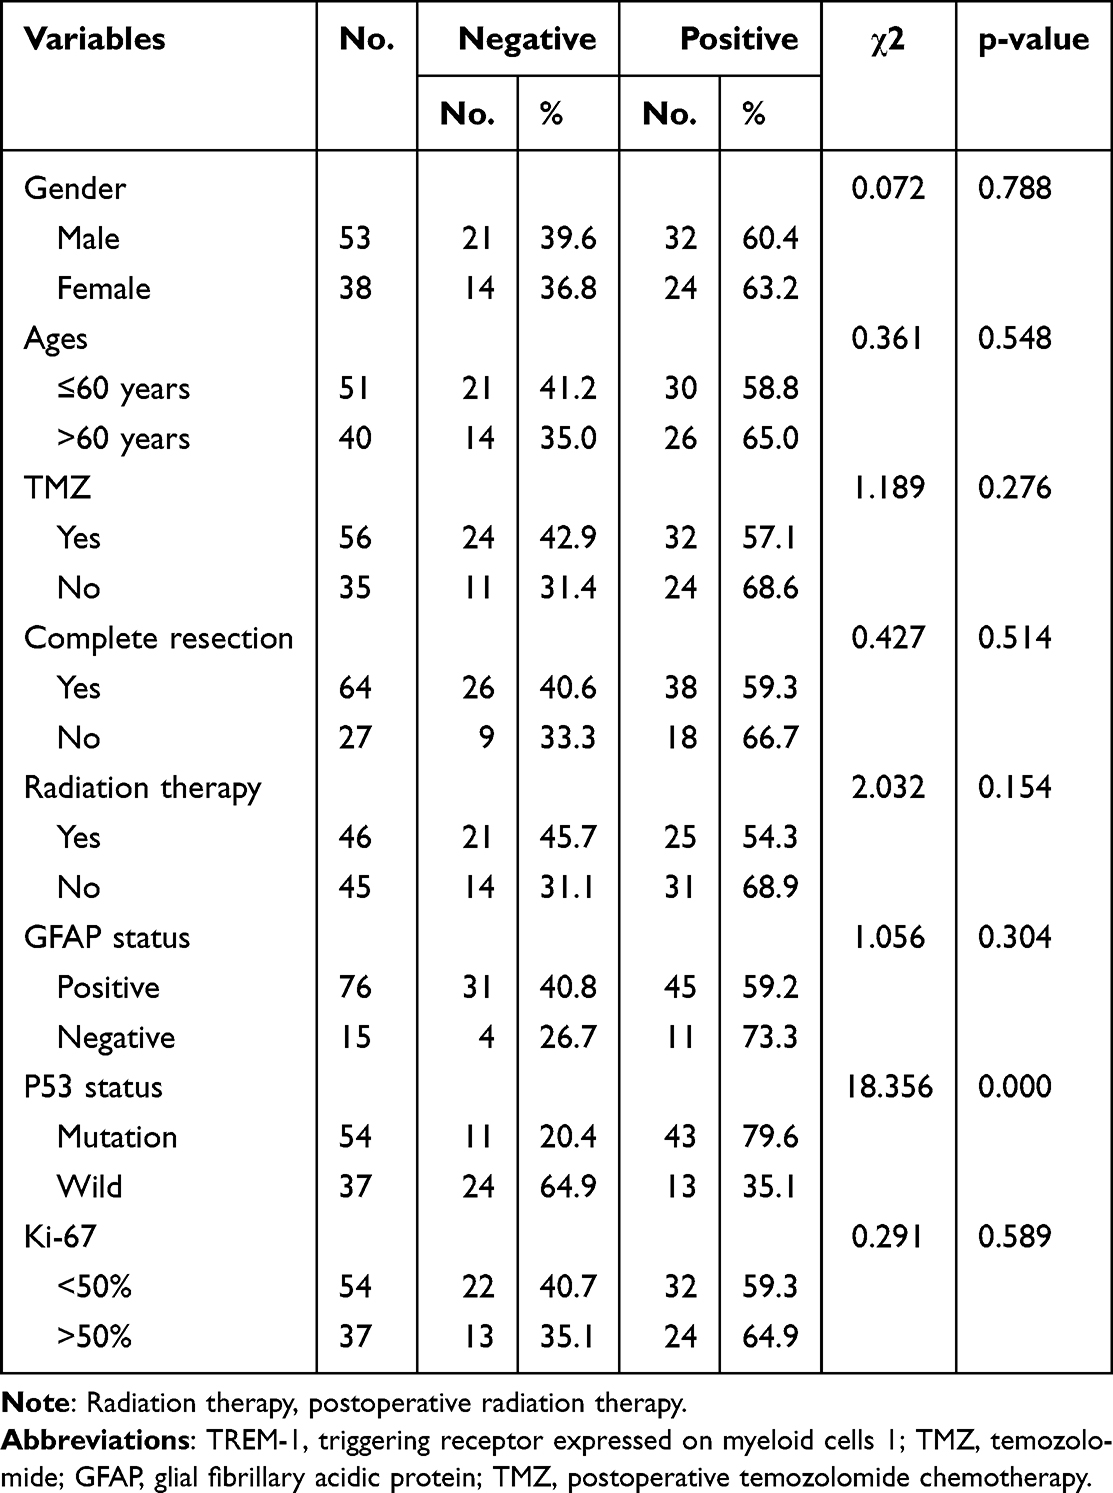 |
Table 1 Associations Between TREM-1 Expression and the Clinicopathological Characteristics of Glioblastoma Patients |
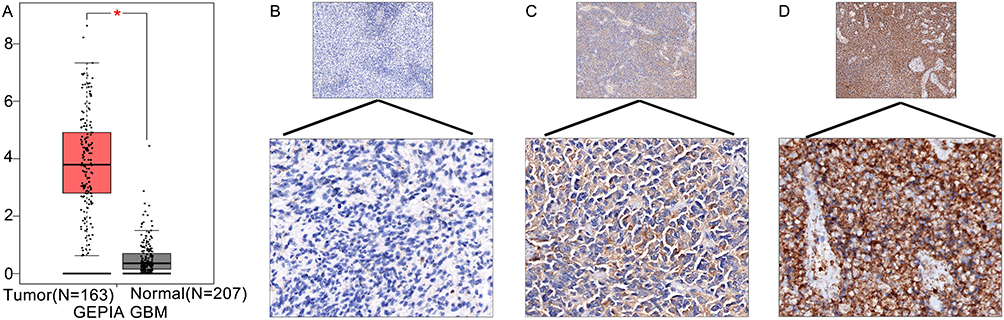 |
Figure 1 TREM-1 expression in GBM. (A) The mRNA expression of TREM-1 was significantly higher in GBM tissues compared to normal brain tissues. *p<0.05. (B-D) Representative immunohistochemical staining of TREM-1 in GBM tissues (upper panels, 100x magnification; lower panels, 400x magnification). (B) Weak, (C) moderate, and (D) intense immunostaining of TREM-1 in GBM tissues. Abbreviations: TREM-1, triggering receptor expressed on myeloid cells 1; GBM, glioblastoma. |
High Expression of TREM-1 Predicts Poor Prognosis
Data from both TCGA and CGGA showed that GBM patients with high TREM-1 expression exhibited significantly worse survival time compared to those with low TREM-1 expression (Figure 2A-D). The mOS in the high-TREM-1 expression group was 10.5 months, while the mOS in the low-TREM-1 expression group was 18.5 months. The median PFS (mPFS) in the high-TREM-1 expression group was 6.0 months, while the mPFS in the low-TREM-1 expression group was 13.5 months. GBM patients with high expression of TREM-1 had shorter mOS (Figure 2E) and mPFS (Figure 2F) than those with low TREM-1 expression.
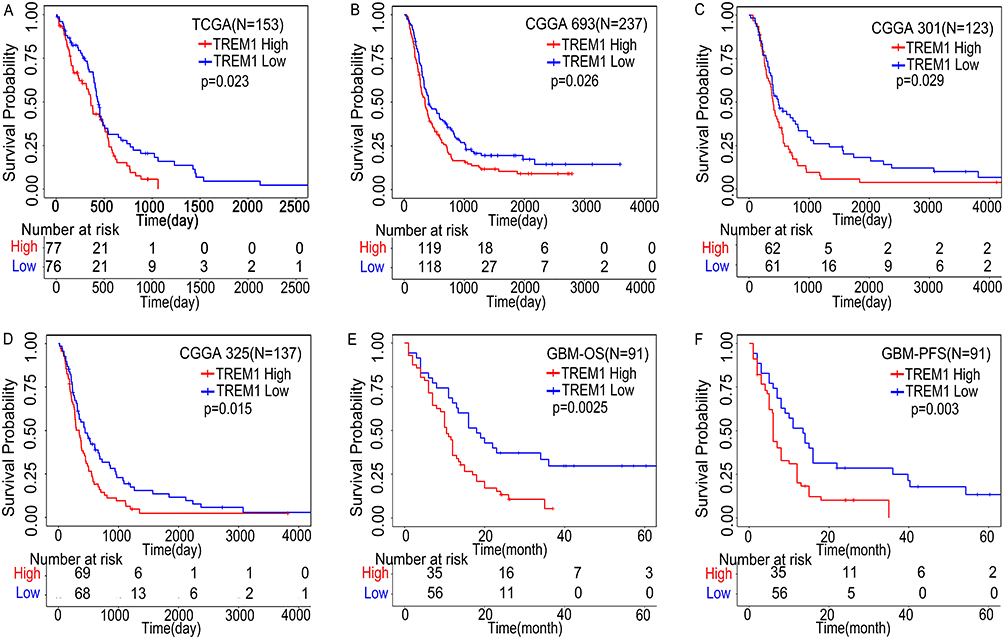 |
Figure 2 High expression of TREM-1 predicts poor prognosis. (A) Kaplan–Meier curve of TREM-1 based on TCGA database. (B-D) Kaplan–Meier curves of TREM-1 based on the CGGA database. (E and F) Kaplan–Meier curves of TREM-1 for 91 GBM patients. Abbreviations: TREM-1, triggering receptor expressed on myeloid cells 1; GBM, glioblastoma; TCGA, The Cancer Genome Atlas; CGGA, Chinese Glioma Genome Atlas (CGGA); OS, overall survival; PFS, progression free survival. |
Univariate and Multivariate Survival Analyses
Univariate analyses showed that complete surgical resection, postoperative radiation therapy, postoperative temozolomide (TMZ) chemotherapy, and low TREM-1 expression were beneficial prognostic factors (Figures 2E and 3A-C). Moreover, complete surgical resection, postoperative radiotherapy, low TREM-1 expression, negative glial fibrillary acidic protein (GFAP) expression, and wild-type P53 were associated with longer PFS (Figures 2F and 3D-G). Multivariate analysis revealed that both TREM-1 expression and complete surgical resection were independent predictors of OS and PFS (Table 2 and Table 3). These results demonstrated that complete surgical resection is an essential factor in prolonging the survival of GBM patients.
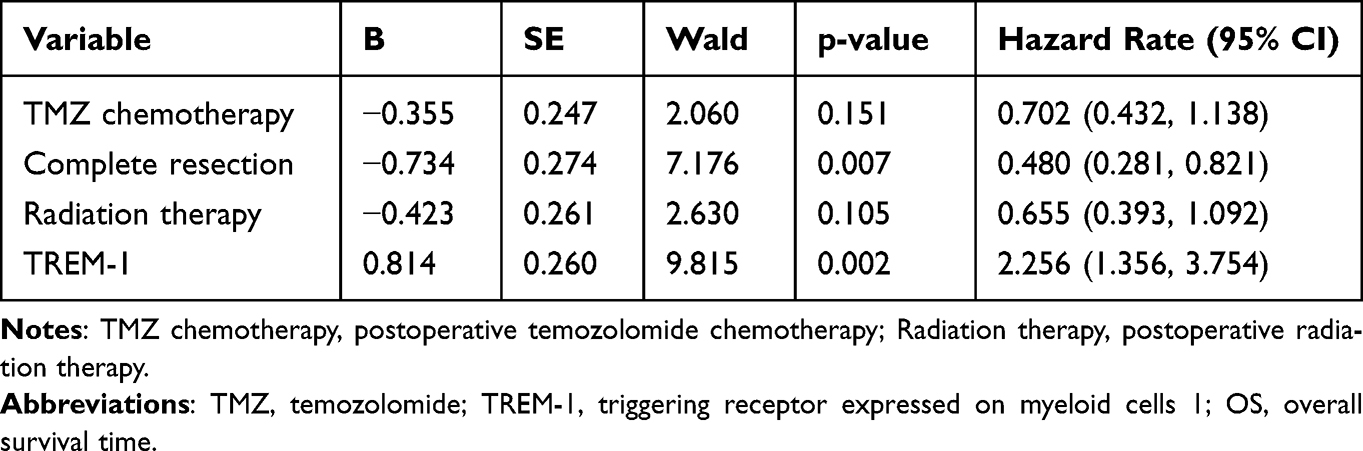 |
Table 2 Multivariate Analysis of OS for Glioblastoma (N=91) |
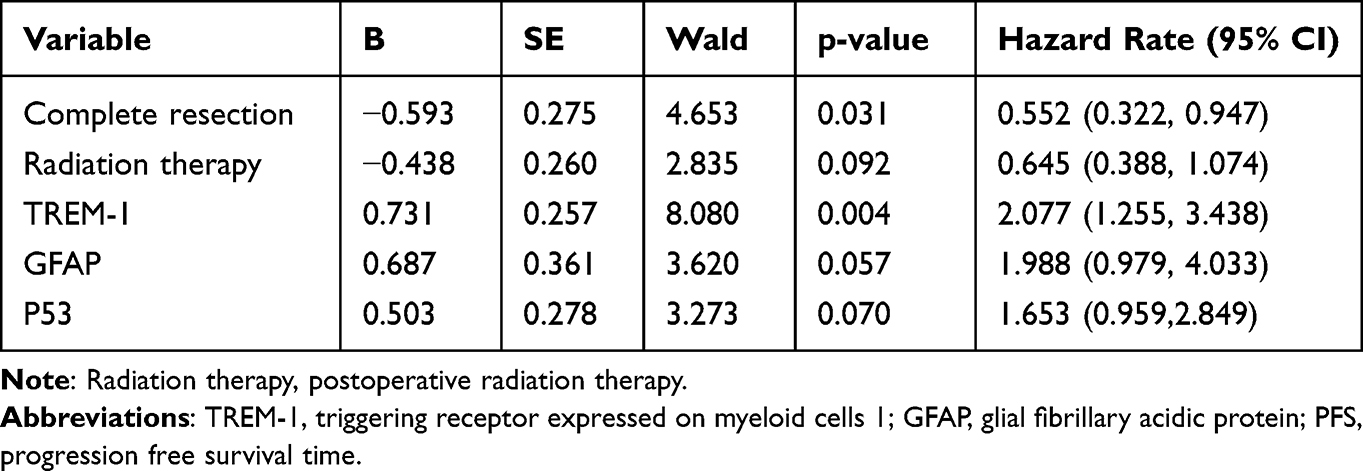 |
Table 3 Multivariate Analysis of PFS for Glioblastoma (N=91) |
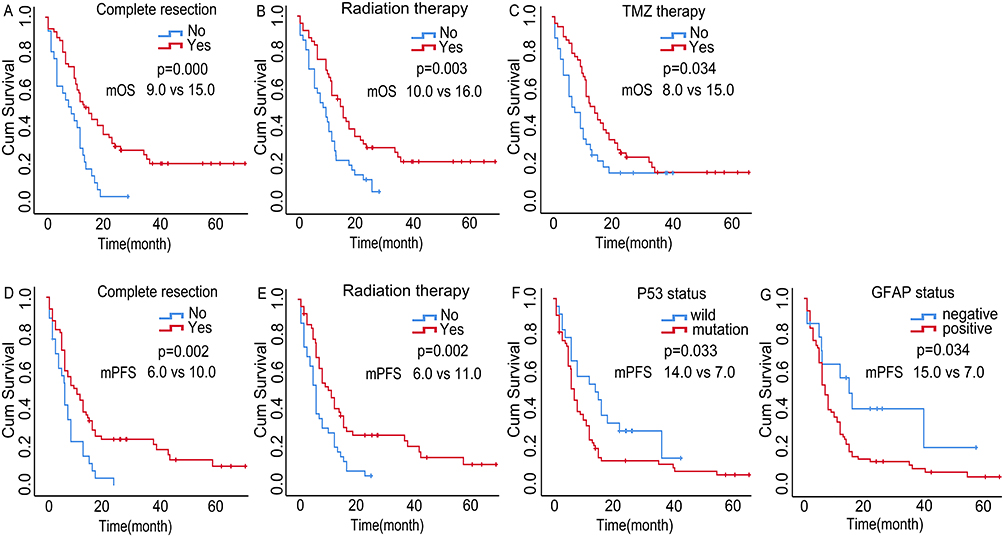 |
Figure 3 Univariate survival analyses of GBM. Univariate analyses showed that complete surgical resection (A), postoperative radiation therapy (B), and postoperative TMZ chemotherapy (C) exhibited longer OS. Complete surgical resection (E), postoperative radiation therapy (F), wild-type P53 (G), and negative GFAP expression (H) were less likely to develop disease progression. Abbreviations: GBM, glioblastoma; TMZ, temozolomide; GFAP, glial fibrillary acidic protein; mOS, median overall survival; mPFS, median progression free survival. |
Functional Enrichment Analysis
After dividing GBM patients from TCGA database into low- and high-TREM-1 expression groups according to the medium value, 614 DEGs were identified (Figure 4A). GO enrichment analysis revealed that the DEGs mainly play roles in receptor ligand and receptor regulator activity as well as participate in neutrophil activation and neutrophil mediated immunity (Figure 4B). KEGG enrichment analyses showed that the DEGs are mainly involved in cytokine−cytokine receptor interactions (Figure 4C). Using the TREM-1 level as the phenotype, GSEA was performed, and the major signaling pathways are shown in Figure 4D and E.
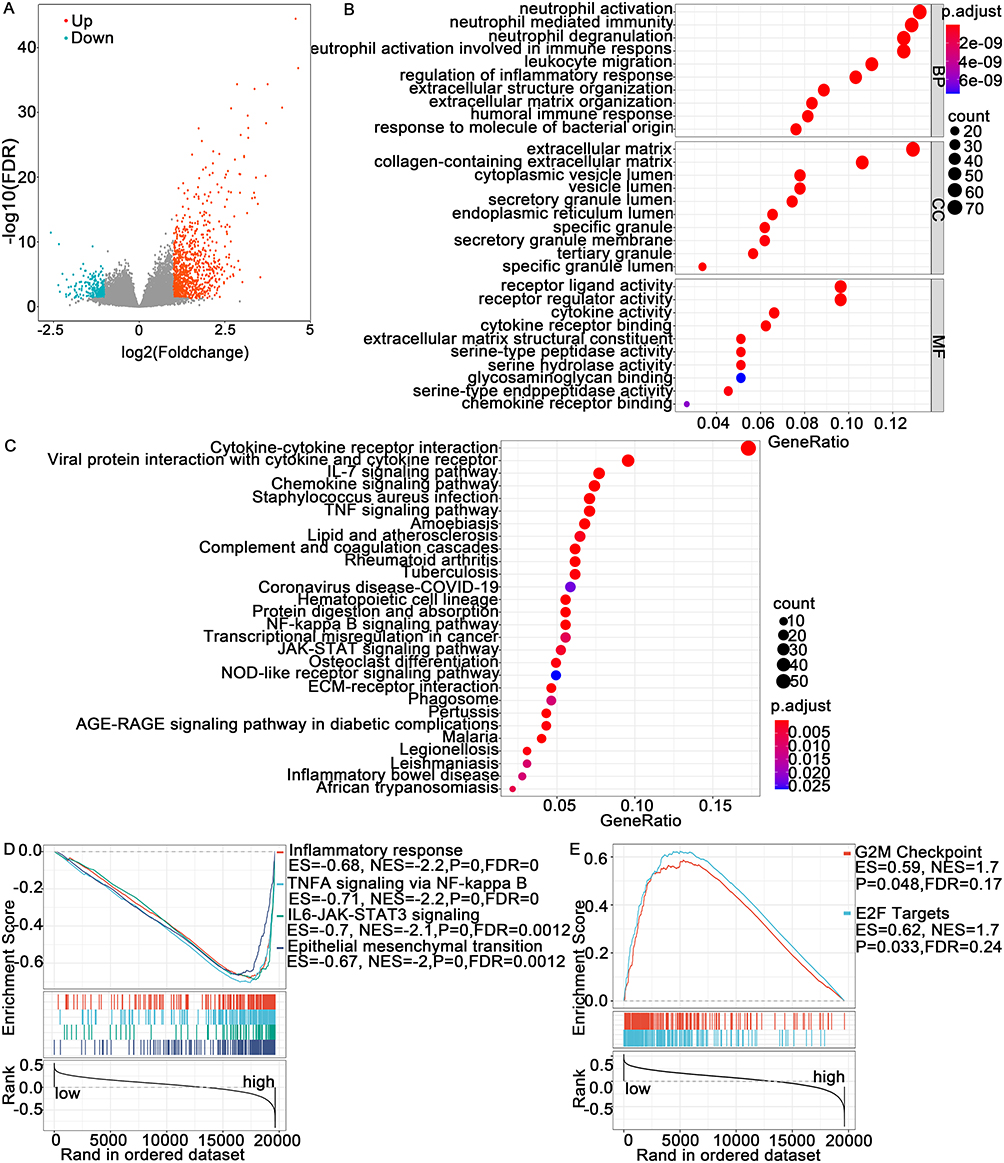 |
Figure 4 Differentially expressed genes (DEGs) and pathway enrichment analysis. (A) Volcano plot showing the DEGs. (B and C) Bubble chart of the results of the GO and KEGG enrichment analyses. (D and E) GSEA showed the representative signaling pathways in the high- and low-TREM-1 expression groups. Abbreviations: FDR, false discovery rate; BP, biological process; CC, cellular component; MF, molecular function; GO, Gene Ontology; KEGG, Encyclopedia of Genes and Genomes; GSEA, gene set enrichment analysis. |
Association of TREM-1 with TIICs
TREM-1 has been identified as an immune-related signature (8). We utilized the CIBERSORT algorithm to determine the estimated fractions of 22 immune cells in each sample (Figure 5A). M2 macrophages comprised the largest fraction of immune cells in GBM followed by M0 macrophages and monocytes. Compared to the low-TREM-1 group, the Wilcoxon rank-sum test revealed that the infiltrating levels of neutrophils (P<0.001) and activated mast cells (p=0.029) were significantly higher in the high-TREM-1 group, while the infiltrating levels of M1 macrophages (p=0.031) and resting mast cells (p=0.017) were significantly lower in the high-TREM-1 group (Figure 5B). According to the TIMER database, TREM-1 expression was significantly associated with infiltrating neutrophils (p=4.44e-14), macrophages (p=3.33e-02), plasma B cells (3.88e-02), and myeloid dendritic cells (6.91e-05) (Figure 6A-F). The ESTIMATE algorithm indicated that both the stromal score (Figure 6G) and immune score (Figure 6H) were positively associated with the expression of TREM-1. Furthermore, there was a positive association between the sum of immune scores and stromal score (Figure 6I).
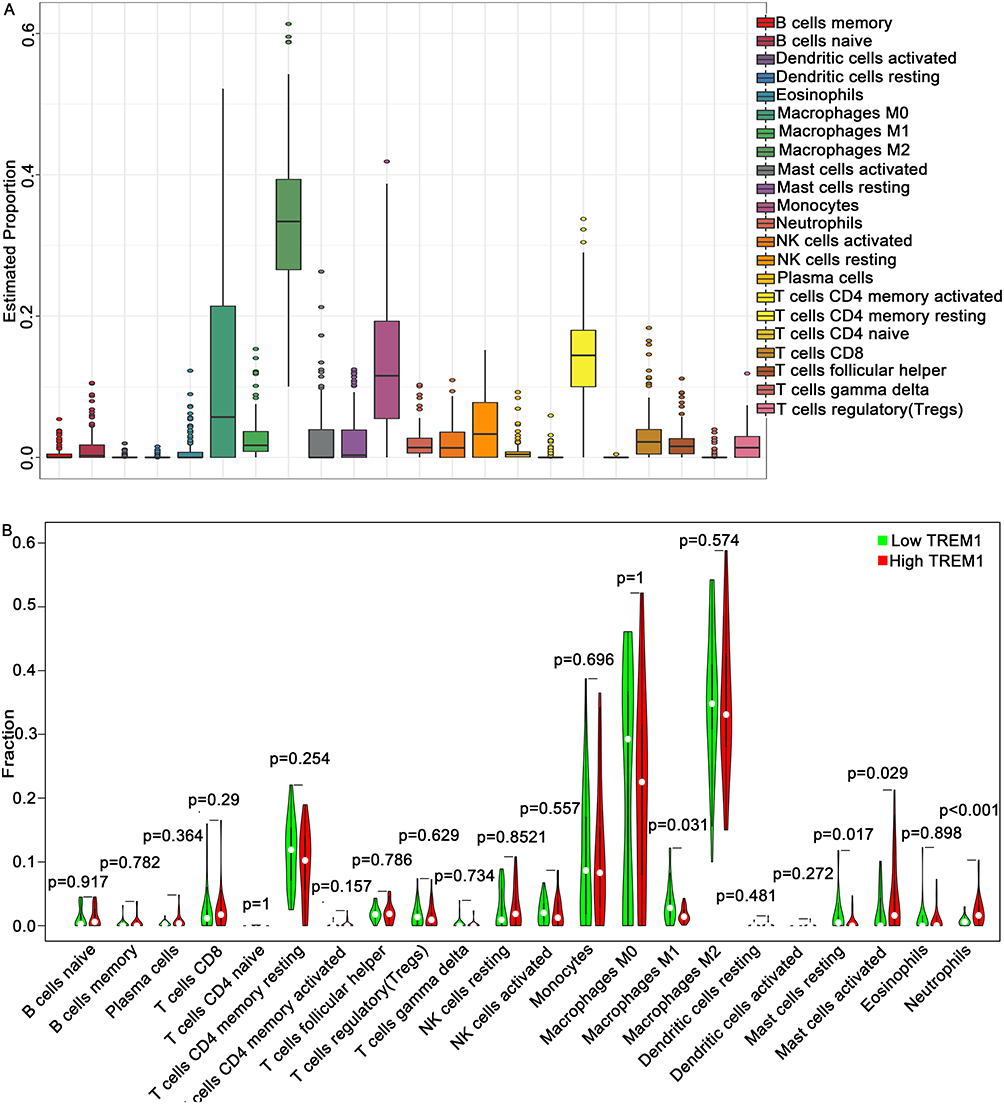 |
Figure 5 Evaluation of tumor-infiltrating immune cells using the CIBERSORT algorithm. (A) Summary of the estimated fractions of 22 immune cell subtypes in GBM. Each bar chart shows the cell proportions of each patient. (B) Wilcoxon rank-sum test revealed the infiltration levels of 22 immune cell subtypes in the low- and high- TREM-1 groups. Abbreviations: TREM-1, triggering receptor expressed on myeloid cells 1; GBM, glioblastoma. |
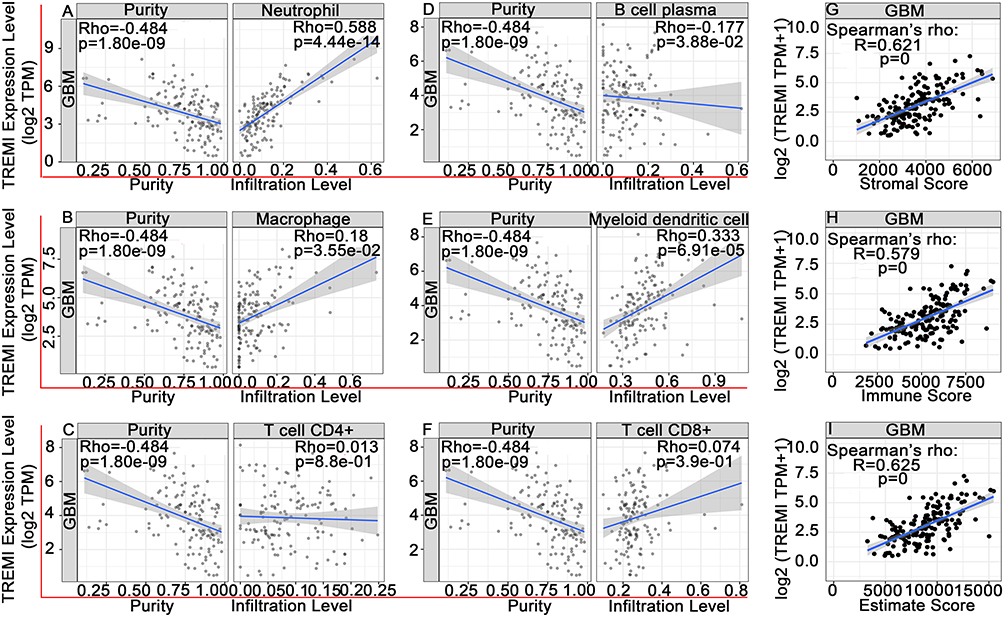 |
Figure 6 Associations of TREM-1 with tumor-infiltrating immune cells and immune scores. (A-F) TIMER was used to analyze the associations of TREM-1 with neutrophils (A), macrophages (B), CD4+ T cells (C), plasma B cells (D), myeloid dendritic cells (F), and CD8+ T cells (F). (G-I) TREM-1 was positively related with the stromal score (G), immune score (H) and ESTIMATE score (I). Abbreviations: TREM-1, triggering receptor expressed on myeloid cells 1; GBM, glioblastoma. |
Association of TREM-1 with Immune Checkpoint Genes (ICGs)
Immune checkpoints are co-stimulators or co-suppressors that are required to maintain self-tolerance and produce an immune response.29 Tumors may activate immune checkpoint pathways to prevent being recognized by the immune system and inhibit immune responses.30 ICIs, which block immune checkpoints, represent a breakthrough for the treatment of various malignant tumors.20 Figure 7 shows the relationship of TREM-1 with multiple ICGs based on the gene expression from TCGA database.
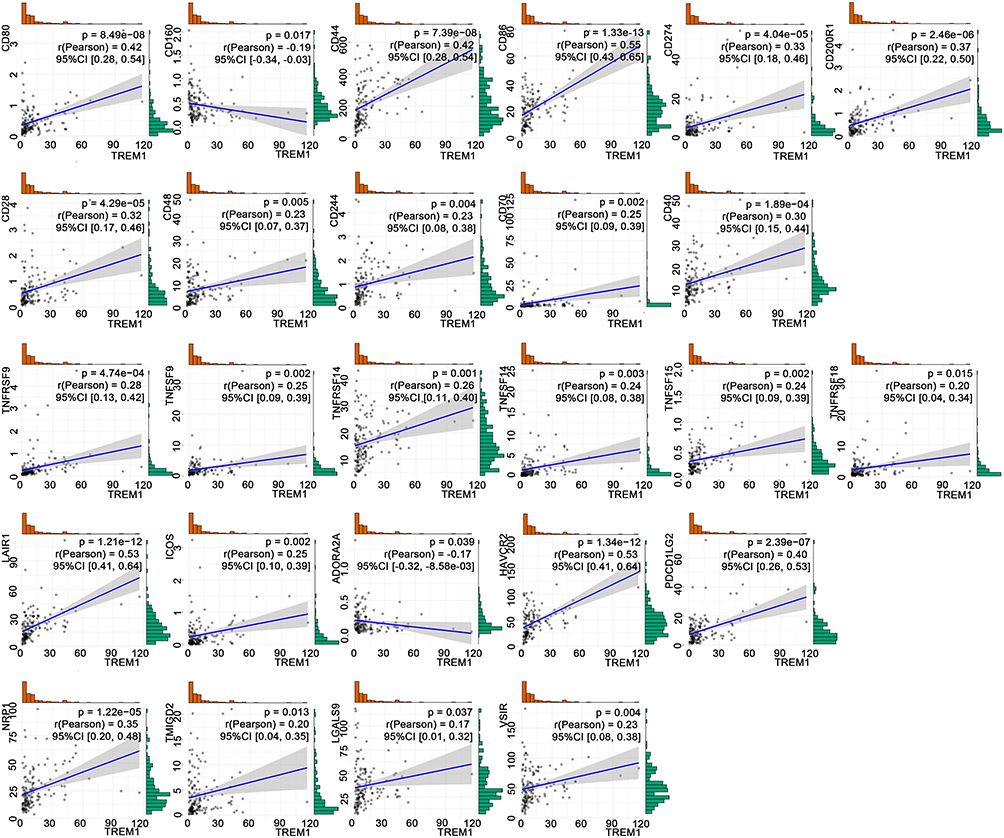 |
Figure 7 TREM-1 expression is significantly correlated with the expression of 26 common immune checkpoint genes based on TCGA database. Abbreviations: TREM-1, triggering receptor expressed on myeloid cells 1; CI, confidence interval; TCGA, The Cancer Genome Atlas. |
PPI Network
To construct the PPI network, we selected 26 ICGs that correlated with the expression of TREM-1, which resulted in 27 nodes and 153 edges (p<1.0e-16) (Figure 8). Among the ICGs, only CD86 directly interacted with TREM-1.
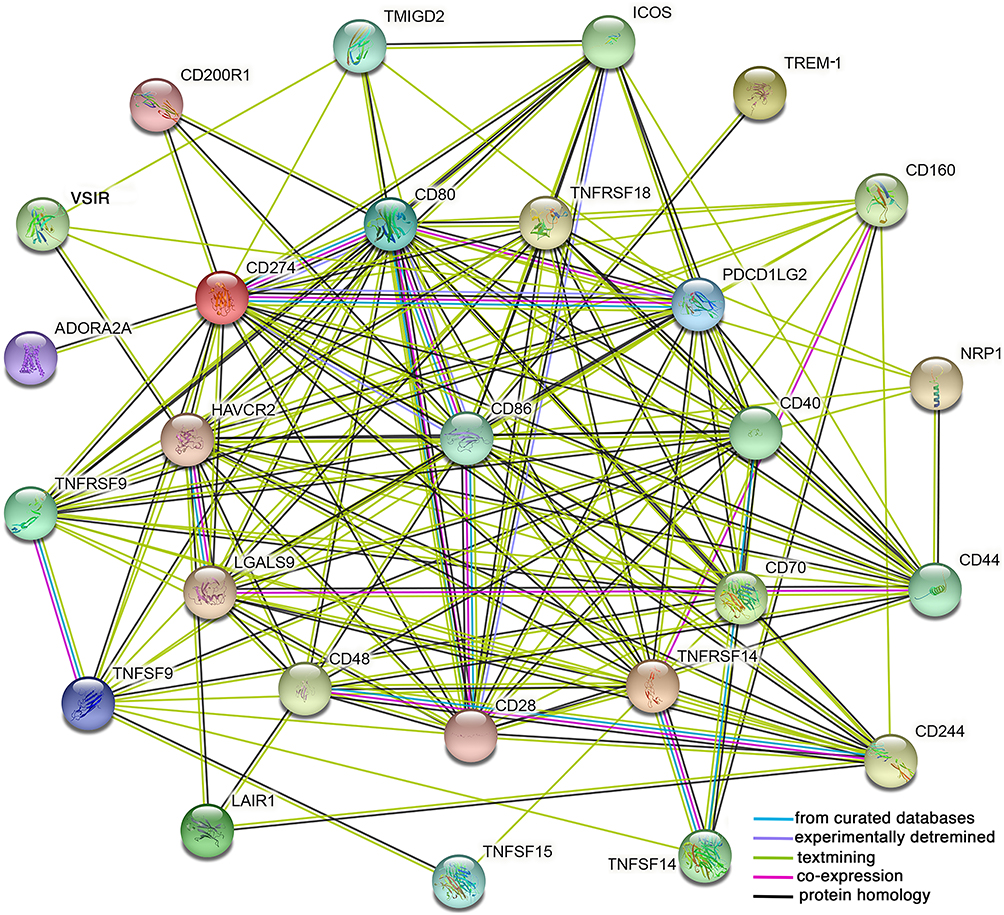 |
Figure 8 A protein–protein interaction (PPI) network was constructed using the selected 26 immune checkpoint genes and TREM-1 using the online STRING database. |
Discussion
TREM-1, a novel inflammatory receptor, plays an important role in inflammatory and immune responses in the tumor microenvironment.6,7 In the present study, we first demonstrated that the expression of TREM-1 in GBM was significantly higher than that in normal brain tissue, and high expression of TREM-1 in GBM predicted a poor prognosis. These results were consistent with those of previous studies on HCC,12 RCC,13 and breast cancer.14 In NSCLC, high TREM-1 expression in TAMs and high soluble TREM-1 levels are also poor prognostic factors.16,31 Both in human lung cancer xenografts and pancreatic cancer xenograft mouse models, TREM-1 inhibitors exhibit strong antitumor effects.32,33 In pancreatic cancer, the antitumor effect of TREM-1 inhibitors is significantly correlated with increased survival and suppressed TAM infiltration. TREM-1 blockade significantly reduces the serum levels of interleukin (IL)-1α, IL-6, and macrophage colony-stimulating factor (M-CSF).33
In the present study, functional enrichment analysis showed that TREM-1 was predominantly involved in the inflammatory response and tumor necrosis factor (TNF) signaling via nuclear factor kappa B (NF-κB) and Janus kinase (JAK)/signal transducers and activators of transcription (STAT) signaling pathways, which was consistent with previous reports on the function and mechanisms of TREM-1. TREM-1 stimulates neutrophil and monocyte-mediated inflammatory responses through the transmembrane adapter protein, DAP12. Phosphorylation of DAP12 induces the secretion of inflammatory chemokines and cytokines, such as TNF-α and IL-1β.34–36 NF-κB is a key orchestrator of innate immunity and inflammation. Aberrant NF-κB regulation has been observed in many cancers.37 In both tumor and inflammatory cells, NF-κB is activated downstream of the Toll-like receptor (TLR)/MyD88 pathway and the TNF-α and IL-1β inflammatory cytokines. TREM-1 possesses the ability to amplify signaling via TLR4 or TLR2.38 STAT3 is a point of convergence for numerous oncogenic signaling pathways.39 TREM-1 blockade prolongs the survival of rats with polymicrobial sepsis and attenuates systemic inflammatory responses through the JAK2/STAT3 signaling pathway.13 TNF, a major proinflammatory cytokine, promotes tumors via different pathways by enhancing tumor growth and invasion as well as recruiting leukocytes, promoting angiogenesis, and facilitating epithelial-to-mesenchymal transition.40,41 Caer et al showed that TNF correlates with TREM-1-expressing monocytes, and they suggested that the TREM-1 pathway may act in concert with other factors, such as TNF, in the intestine of Crohn’s disease patients to influence the inflammatory environment.42
Because inflammasome-dependent release of cytokines and antigens activates, shapes, or inhibits adaptive immune responses,43 we explored the relationship among TREM-1, TIICs, and ICGs. Macrophages, as important antigen-presenting cells, determine the T cell response, and the cytokine pattern secreted by activated T cells is determined by the cytokine pattern secreted by M1/M2 macrophages.19 TAMs are closely related to the immune response in the tumor microenvironment and are recognized as antitumor suppressors. In the present study, TIIC analysis showed that M2 macrophages comprised the largest proportion of immune cells in GBM. High macrophage infiltration mediates the tumor immunosuppressive microenvironment through various mechanisms to promote tumor genesis, development, and metastasis.19 Upregulation of TREM-1 has been frequently observed in dendritic cells and occasionally observed in TAMs.16,44 Additionally, TREM-1 is associated with markers of M2 macrophage polarization in GBM,45 and TREM-1 may mediate macrophage polarization by regulating the PI3K/AKT signaling pathway in HCC.18 In the present study, TREM-1 expression was positively associated with the infiltrating level of macrophages (TIMER) and negatively associated with M1 macrophages (CIBERSORT algorithm), but TREM-1 expression was not associated with M2 macrophages. Therefore, the relationship between TREM-1 and M1/M2 macrophages in GBM needs to be further verified in tissue specimens.
In addition to immune cells, the immune microenvironment also includes nonimmune stromal components, which are associated with oncogenesis and malignant behaviors of tumors.46 In the present study, TREM-I was positively associated with the stromal score and immune score. In TCGA-GBM cohort, the survival time of both the high stromal and immune score groups is shorter than that of the low stromal and immune score groups, but there is no statistical difference.47 Zeng et al showed that immune score is associated with favorable OS but that stromal score is associated with unfavorable OS, while patients with low immune scores and high stromal scores exhibit worse survival.48 Ren et al reported that the interaction between stromal cells and epithelial cancer cells affects pancreatic cancer progression.49
The present study demonstrated that TREM-1 was highly expressed in GBM. Immune therapies are less effective in GBM due to the immune suppression microenvironment.24 Previous studies have found that in HCC, blocking the TREM-1 pathway not only inhibits tumor development but also improves the efficacy of programmed cell death ligand 1 (PD-L1) by reducing the recruitment of C-C motif chemokine receptor 6 (CCR6)+forkhead box P3 (Foxp3)+ Tregs.17 TREM-1 inhibitors may be an effective adjuvant that enhances anti-PD-1-mediated immunogenic cell death in microsatellite stable (MSS) colorectal cancer (CRC).50 Although these studies have suggested that TREM-1 may be involved in the resistance of ICIs, it remains unclear whether there are relationships between TREM-1 expression and immune checkpoint genes or PD-L1. In the present study, analysis of TCGA-GBM cohort showed that TREM-1 significantly correlated with not only PD-L1 (CD274) but also multiple ICGs. ICIs targeting programmed cell death protein 1 (PD-1)/PD-L1 have been explored in GBM.21 The correlation between TREM-1 and multiple ICGs in the tumor microenvironment suggests the potential immunosuppressive effect of TREM-1 in GBM. In the present study, the correlation analysis and PPI network indicated that TREM-1 was significantly associated with the expression of CD86. Previous studies have shown that a TREM-1 inhibitory peptide attenuates the proinflammatory subtype transition of microglia as evidenced by decreased levels of markers, including CD68, CD16, and CD86.51
In conclusion, the present study revealed that GBM patients with high expression of TREM-1 exhibit a worse prognosis and that TREM-1 is associated with the immunosuppressive microenvironment of GBM. Thus, TREM-1 blockade or combining TREM-1 blockade and ICGs may be a strategy for enhancing GBM immune response.
Data Sharing Statement
All the datasets used and/or analyzed during the present study are available from the corresponding author upon reasonable request.
Ethics Approval and Informed Consent
The present study was conducted in accordance with the Declaration of Helsinki and approved by the Ethics Committee of the Henan Provincial People’s Hospital. Written informed consent was obtained from all patients or the patients’ parents.
Consent for Publication
All authors agreed to publish the paper in any form.
Acknowledgments
The results shown here are in part based upon data generated by the following publicly available databases: TCGA (https://www.cancer.gov/tcga), CGGA (https://www.cgga.org.cn/), GEPIA (https://gepia.cancer-pku.cn/), and TIMER (https://gepia.cancer-pku.cn/). We express our sincere thanks to the contributors of these databases. A preprint of the paper has previously been published by Ma K et al in 2022 (https://www.researchsquare.com/article/rs-1655537/v1).
Funding
This research was funded by the Natural Science Foundation of Henan Province (Grant No. 212300410251) and the Henan Medical Science and Technology Foundation (Grant No. 2018020022).
Disclosure
The authors declare no conflicts of interest in this work.
References
1. Cuddapah VA, Robel S, Watkins S, Sontheimer H. A neurocentric perspective on glioma invasion. Nat Rev Neurosci. 2014;15(7):455–465.
2. Stupp R, Mason WP, van den Bent MJ, et al. Radiotherapy plus concomitant and adjuvant temozolomide for glioblastoma. N Engl J Med. 2005;352(10):987–996.
3. Hanahan D, Weinberg RA. Hallmarks of cancer: the next generation. Cell. 2011;144(5):646–674.
4. Colotta F, Allavena P, Sica A, Garlanda C, Mantovani A. Cancer-related inflammation, the seventh hallmark of cancer: links to genetic instability. Carcinogenesis. 2009;30(7):1073–1081.
5. Multhoff G, Molls M, Radons J. Chronic inflammation in cancer development. Front Immunol. 2011;2:98.
6. Bouchon A, Dietrich J, Colonna M. Cutting edge: inflammatory responses can be triggered by TREM-1, a novel receptor expressed on neutrophils and monocytes. J Immunol. 2000;164(10):4991–4995.
7. Colonna M. TREMs in the immune system and beyond. Nat Rev Immunol. 2003;3(6):445–453.
8. Bouchon A, Facchetti F, Weigand MA, Colonna M. TREM-1 amplifies inflammation and is a crucial mediator of septic shock. Nature. 2001;410(6832):1103–1107.
9. Liu Q, Johnson EM, Lam RK, et al. Peripheral TREM1 responses to brain and intestinal immunogens amplify stroke severity. Nat Immunol. 2019;20(8):1023–1034.
10. Tammaro A, Derive M, Gibot S, Leemans JC, Florquin S, Dessing MC. TREM-1 and its potential ligands in non-infectious diseases: from biology to clinical perspectives. Pharmacol Ther. 2017;177:81–95.
11. Muller M, Haghnejad V, Lopez A, et al. Triggering Receptors Expressed on Myeloid Cells 1: our New Partner in Human Oncology? Front Oncol. 2022;12:927440.
12. Liao R, Sun TW, Yi Y, et al. Expression of TREM-1 in hepatic stellate cells and prognostic value in hepatitis B-related hepatocellular carcinoma. Cancer Sci. 2012;103(6):984–992.
13. Ford JW, Gonzalez-Cotto M, MacFarlane A, et al. Tumor-Infiltrating Myeloid Cells Co-Express TREM1 and TREM2 and Elevated TREM-1 Associates With Disease Progression in Renal Cell Carcinoma. Front Oncol. 2021;11:662723.
14. Pullikuth AK, Routh ED, Zimmerman KD, et al. Bulk and Single-Cell Profiling of Breast Tumors Identifies TREM-1 as a Dominant Immune Suppressive Marker Associated With Poor Outcomes. Front Oncol. 2021;11:734959.
15. Zhao Y, Zhang C, Zhu Y, et al. TREM1 fosters an immunosuppressive tumor microenvironment in papillary thyroid cancer. Endocr Relat Cancer. 2022;29(2):71–86.
16. Ho CC, Liao WY, Wang CY, et al. TREM-1 expression in tumor-associated macrophages and clinical outcome in lung cancer. Am J Respir Crit Care Med. 2008;177(7):763–770.
17. Wu Q, Zhou W, Yin S, et al. Blocking Triggering Receptor Expressed on Myeloid Cells-1-Positive Tumor-Associated Macrophages Induced by Hypoxia Reverses Immunosuppression and Anti-Programmed Cell Death Ligand 1 Resistance in Liver Cancer. Hepatology. 2019;70(1):198–214.
18. Chen M, Lai R, Lin X, Chen W, Wu H, Zheng Q. Downregulation of triggering receptor expressed on myeloid cells 1 inhibits invasion and migration of liver cancer cells by mediating macrophage polarization. Oncol Rep. 2021;45(4):37.
19. Aras S, Zaidi MR. TAMeless traitors: macrophages in cancer progression and metastasis. Br J Cancer. 2017;117(11):1583–1591.
20. de Miguel M, Calvo E. Clinical Challenges of Immune Checkpoint Inhibitors. Cancer Cell. 2020;38(3):326–333.
21. Huang J, Liu F, Liu Z, et al. Immune Checkpoint in Glioblastoma: promising and Challenging. Front Pharmacol. 2017;8:242.
22. Gong L, Ji L, Xu D, Wang J, Zou J. TGF-beta links glycolysis and immunosuppression in glioblastoma. Histol Histopathol. 2021;36(11):1111–1124.
23. Zhai L, Bell A, Ladomersky E, et al. Tumor Cell IDO Enhances Immune Suppression and Decreases Survival Independent of Tryptophan Metabolism in Glioblastoma. Clin Cancer Res. 2021;27(23):6514–6528.
24. Bagley SJ, Desai AS, Linette GP, June CH, O’Rourke DM. CAR T-cell therapy for glioblastoma: recent clinical advances and future challenges. Neuro Oncol. 2018;20(11):1429–1438.
25. Li Y, Ma K, Xie Q, et al. Identification of HOXD10 as a Marker of Poor Prognosis in Glioblastoma Multiforme. Onco Targets Ther. 2021;14:5183–5195.
26. Newman AM, Liu CL, Green MR, et al. Robust enumeration of cell subsets from tissue expression profiles. Nat Methods. 2015;12(5):453–457.
27. Li B, Severson E, Pignon JC, et al. Comprehensive analyses of tumor immunity: implications for cancer immunotherapy. Genome Biol. 2016;17(1):174.
28. Yoshihara K, Shahmoradgoli M, Martinez E, et al. Inferring tumour purity and stromal and immune cell admixture from expression data. Nat Commun. 2013;4:2612.
29. Pardoll DM. The blockade of immune checkpoints in cancer immunotherapy. Nat Rev Cancer. 2012;12(4):252–264.
30. Beatty GL, Gladney WL. Immune escape mechanisms as a guide for cancer immunotherapy. Clin Cancer Res. 2015;21(4):687–692.
31. Kuemmel A, Alflen A, Schmidt LH, et al. Soluble Triggering Receptor Expressed on Myeloid Cells 1 in lung cancer. Sci Rep. 2018;8(1):10766.
32. Sigalov AB. A novel ligand-independent peptide inhibitor of TREM-1 suppresses tumor growth in human lung cancer xenografts and prolongs survival of mice with lipopolysaccharide-induced septic shock. Int Immunopharmacol. 2014;21(1):208–219.
33. Shen ZT, Sigalov AB. Novel TREM-1 Inhibitors Attenuate Tumor Growth and Prolong Survival in Experimental Pancreatic Cancer. Mol Pharm. 2017;14(12):4572–4582.
34. Tessarz AS, Cerwenka A. The TREM-1/DAP12 pathway. Immunol Lett. 2008;116(2):111–116.
35. Carrasco K, Boufenzer A, Jolly L, et al. TREM-1 multimerization is essential for its activation on monocytes and neutrophils. Cell Mol Immunol. 2019;16(5):460–472.
36. Duan M, Wang ZC, Wang XY, et al. TREM-1, an inflammatory modulator, is expressed in hepatocellular carcinoma cells and significantly promotes tumor progression. Ann Surg Oncol. 2015;22(9):3121–3129.
37. Karin M. Nuclear factor-kappaB in cancer development and progression. Nature. 2006;441(7092):431–436.
38. Arts RJ, Joosten LA, Dinarello CA, Kullberg BJ, van der Meer JW, Netea MG. TREM-1 interaction with the LPS/TLR4 receptor complex. Eur Cytokine Netw. 2011;22(1):11–14.
39. Yu H, Kortylewski M, Pardoll D. Crosstalk between cancer and immune cells: role of STAT3 in the tumour microenvironment. Nat Rev Immunol. 2007;7(1):41–51.
40. Balkwill F. Tumour necrosis factor and cancer. Nat Rev Cancer. 2009;9(5):361–371.
41. Kulbe H, Thompson R, Wilson JL, et al. The inflammatory cytokine tumor necrosis factor-alpha generates an autocrine tumor-promoting network in epithelial ovarian cancer cells. Cancer Res. 2007;67(2):585–592.
42. Caer C, Gorreja F, Forsskahl SK, et al. TREM-1+ Macrophages Define a Pathogenic Cell Subset in the Intestine of Crohn’s Disease Patients. J Crohns Colitis. 2021;15(8):1346–1361.
43. Deets KA, Vance RE. Inflammasomes and adaptive immune responses. Nat Immunol. 2021;22(4):412–422.
44. Klesney-Tait J, Turnbull IR, Colonna M. The TREM receptor family and signal integration. Nat Immunol. 2006;7(12):1266–1273.
45. Kong Y, Feng ZC, Zhang YL, et al. Identification of Immune-Related Genes Contributing to the Development of Glioblastoma Using Weighted Gene Co-expression Network Analysis. Front Immunol. 2020;11:1281.
46. Bremnes RM, Donnem T, Al-Saad S, et al. The role of tumor stroma in cancer progression and prognosis: emphasis on carcinoma-associated fibroblasts and non-small cell lung cancer. J Thorac Oncol. 2011;6(1):209–217.
47. Jia D, Li S, Li D, Xue H, Yang D, Liu Y. Mining TCGA database for genes of prognostic value in glioblastoma microenvironment. Aging. 2018;10(4):592–605.
48. Zeng Z, Li J, Zhang J, et al. Immune and stromal scoring system associated with tumor microenvironment and prognosis: a gene-based multi-cancer analysis. J Transl Med. 2021;19(1):330.
49. Ren B, Cui M, Yang G, et al. Tumor microenvironment participates in metastasis of pancreatic cancer. Mol Cancer. 2018;17(1):108.
50. Roh SA, Kwon YH, Lee JL, Kim SK, Kim JC. SLAMF7 and TREM1 Mediate Immunogenic Cell Death in Colorectal Cancer Cells: focus on Microsatellite Stability. Anticancer Res. 2021;41(11):5431–5444.
51. Wu X, Zeng H, Xu C, et al. TREM1 Regulates Neuroinflammatory Injury by Modulate Proinflammatory Subtype Transition of Microglia and Formation of Neutrophil Extracellular Traps via Interaction With SYK in Experimental Subarachnoid Hemorrhage. Front Immunol. 2021;12:766178.
 © 2023 The Author(s). This work is published and licensed by Dove Medical Press Limited. The
full terms of this license are available at https://www.dovepress.com/terms
and incorporate the Creative Commons Attribution
- Non Commercial (unported, 3.0) License.
By accessing the work you hereby accept the Terms. Non-commercial uses of the work are permitted
without any further permission from Dove Medical Press Limited, provided the work is properly
attributed. For permission for commercial use of this work, please see paragraphs 4.2 and 5 of our Terms.
© 2023 The Author(s). This work is published and licensed by Dove Medical Press Limited. The
full terms of this license are available at https://www.dovepress.com/terms
and incorporate the Creative Commons Attribution
- Non Commercial (unported, 3.0) License.
By accessing the work you hereby accept the Terms. Non-commercial uses of the work are permitted
without any further permission from Dove Medical Press Limited, provided the work is properly
attributed. For permission for commercial use of this work, please see paragraphs 4.2 and 5 of our Terms.