")
Back to Journals » OncoTargets and Therapy » Volume 9
High expression of S100A8 gene is associated with drug resistance to etoposide and poor prognosis in acute myeloid leukemia through influencing the apoptosis pathway
Authors Yang X, Zhang M, Zhou Q, Wu S, Zhao Y, Gu W, Pan J, Cen J, Chen Z, Guo W, Chen C, Yan W, Hu S
Received 1 December 2015
Accepted for publication 27 May 2016
Published 8 August 2016 Volume 2016:9 Pages 4887—4899
DOI https://doi.org/10.2147/OTT.S101594
Checked for plagiarism Yes
Review by Single anonymous peer review
Peer reviewer comments 2
Editor who approved publication: Dr Faris Farassati
Xiao-yan Yang,1,* Ming-ying Zhang,1,* Qi Zhou,1 Shui-yan Wu,1 Ye Zhao,2 Wei-ying Gu,3 Jian Pan,1 Jian-nong Cen,2 Zi-xing Chen,2 Wen-ge Guo,4 Chien-shing Chen,5 Wen-hua Yan,6 Shao-yan Hu1
1Department of Haematology and Oncology, Children’s Hospital of Soochow University, 2Department of Haematology, The First Affiliated Hospital of Soochow University, Suzhou, 3Department of Haematology, The Third Affiliated Hospital of Soochow University, Changzhou, People’s Republic of China; 4Department of Mathematical Sciences, New Jersey Institute of Technology, Newark, NJ, 5Department of Internal Medicine, Division of Hematology and Medical Oncology and Biospecimen Laboratory, Loma Linda University, Loma Linda, CA, USA; 6Department of Cardiology, Children’s Hospital of Soochow University, Suzhou, People’s Republic of China
*These authors contributed equally to this work
Abstract: S100A8 has been increasingly recognized as a biomarker in multiple solid tumors and has played pivotal roles in hematological malignancies. S100A8 is potentially an indicator for poor survival in acute myeloid leukemia (AML) in retrospective studies. However, the mechanisms of S100A8 are diverse in cancers. In this study, we investigated the correlation of S100A8 at the transcription level with clinical parameters in 91 de novo AML patients and explored its mechanisms of chemoresistance to etoposide in vitro. The transcription level of S100A8 was significantly lower at initial and relapse stages of AML samples than at complete remission (P<0.001) and than in the control group (P=0.0078), while no significant difference could be found between initial and relapse stages (P=0.257). Patients with high transcription levels of S100A8 exhibited a shorter overall survival (P=0.0012). HL-60 cells transfected with S100A8 showed resistance to etoposide with a higher level IC50 value and lower apoptosis rate compared with HL-60 cells transfected with empty vector. Thirty-six genes were significantly downregulated and 12 genes were significantly upregulated in S100A8 overexpression group compared with control group in which 360 genes involved in apoptotic genes array were performed by real-time reverse transcriptase polymerase chain reaction. Among them, the caspase-3, Bcl-2, and Bax were verified by Western blot analysis which indicated that the role of S100A8 in resistance to chemotherapy was closely related with antiapoptosis. In conclusion, critical S100A8 provided useful clinical information in predicting the outcome of AML. The main mechanism of S100A8 which promoted chemoresistance was antiapoptosis.
Keywords: S100A8, HL-60 cell, drug resistance, acute myeloid leukemia, AML, prognostic factor, antiapoptosis, overall survival
Introduction
Acute myeloid leukemia (AML) is the most common acute leukemia in adults and accounts for ~80% of cases in this group.1 AML is characterized by a clonal proliferation of myeloid precursors with a reduced capacity to differentiate into more mature cellular elements. As a result, there is an accumulation of leukemic blasts, resulting in variable myelosuppression manifested as pancytopenia.2 Clinically, a combination of conventional karyotypic analysis plus reverse transcriptase polymerase chain reaction (RT-PCR) or fluorescent in situ hybridization for specific abnormalities can aid in the diagnosis, treatment, and posttreatment monitoring of patients with AML.3 However, despite continuous improvements and refinement in laboratory tests, ~50% of AML patients have a normal or noninformative karyotype and are considered to have an intermediate prognosis. Although some improvement during the last four decades has been made with current standard chemotherapy, the prognosis of AML is generally poor with ~35% cured of their disease among younger and fit patients on clinical trials.4 Therefore, novel biomarkers potentially have prognostic importance, and therapeutic implications will further our understanding of the biology of such heterogeneous malignancy.
S100A8 is a member of the S100 calcium-binding protein family belongs to the Ca2+ binding EF-hand motif superfamily with the ability to form homodimers, heterodimers, and oligomers. S100 proteins have a broad range of intracellular and extracellular functions including regulation of protein phosphorylation and enzyme activity, calcium homeostasis, regulation of cytoskeletal components, and regulation of transcriptional factors.5 S100A8 preferentially forms functional heterodimers with S100A9 which have been increasingly recognized as biomarkers in multiple solid tumors, including gastric, esophageal, colon, pancreatic, bladder, ovarian, thyroid, breast, and skin cancers,5–8 contributed both by tumor cells and by infiltrating immune cells in the tumor stroma. S100A8 (MRP8) has been described as a critical regulator of chemo-resistance in leukemia. RNA interference-mediated knockdown of S100A8 expression increased the sensitivity of leukemia cells to chemotherapy and apoptosis induction. Moreover, inhibition of S100A8 expression decreased autophagy as evaluated by autophagic markers, while a follow-up study found that S100A8 may enhance drug resistance by upregulating autophagy through promoting the formation of BECN1-PI3KC3 (PI3KC3, phosphatidylinositol 3-kinase class 3) complex.9,10
Recently, gene-expression profiling data reveal S100A8, and S100A8 played pivotal roles in hematological malignancies. Overexpression of S100A8 and S100A9 is associated with failure to induce free-cytosolic Ca2+ and glucocorticoid resistance in mixed-lineage leukemia-rearranged infant acute lymphoblastic leukemia.11 In a proteomic profiling study, high expression of S100A8 was identified and subsequently confirmed with Western blot analysis in leukemic cells to be highly correlative of poor survival in AML patients.12 Despite proteomic profiling and clinical correlation of S100A8 in a retrospective study,10 the role of S100A8 expression in AML requires confirmatory study. The best method of detecting S100A8 in clinical specimen remains to be determined. Prospective correlation of S100A8 expression at either genomic or proteomic level with clinical parameters are yet to be studied.
In this study, we investigated the correlations between S100A8 with clinical parameters in AML. We analyzed data from mRNA-based measurement to comprehensively study the expression pattern of S100A8 in a well-characterized cohort of AML patients who underwent intensive chemotherapy. We further investigate the drug resistance mechanisms of S100A8 on AML cell lines.
Materials and methods
Patient cohort and sample processing
In this retrospective study, 189 AML patient specimens at different treatment stages of induction chemotherapy between 2010 and 2014 were included. Among them, 91 were de novo AML patients (excluded secondary AML, therapy-related AML or AML evolved from antecedent hematological disorders), 64 patients in complete remission (CR) and 34 patients in relapse, in addition to 20 controls without leukemia. Acute promyelocytic leukemia patients were excluded from this study.
Induction chemotherapy for the patients <60 years old was started with mitoxantrone/idarubicin (10 mg/m2) as a 30-minute intravenous infusion at days 1–3, cytarabine (100 mg/m2) per day as continuous intravenous infusion from days 1 to 7.13 For older patient (≥60 years old), CAG regimen (low-dose cytosine arabinoside [10 mg/m2/12 h, days 1–14], low-dose aclarubicin [10–14 mg/m2/day, days 1–4], with concurrent G-CSF [200 μg/m2/day]) was given.14 Patients in all cytogenetic risk groups received at least one course of consolidation therapy with four high-dose cytarabine. Patients in the high-risk group, then were consented and assigned for allogeneic stem cell transplantation at earliest time point after consolidation.
This study was approved by the ethics committee of The First Affiliated Hospital of Soochow University. Each sample of bone marrow mononuclear cells (BMMCs) was collected and frozen after the participant provided written informed consent. BMMCs were isolated by Ficoll density gradient centrifugation. Cytogenetic karyotyping and multiplex RT-PCR for 29 genes15 were performed for all the patients. Some samples were subjected to DNA sequencing for detection of mutation in c-kit, FLT3-ITD, CEBPA, NPMA, and DNMT3A. All patients were classified for the cytogenetic risk status according to the current National Comprehensive Cancer Network AML guidelines:16 the favorable-risk patients were referred to those patients harboring karyotypic abnormalities with inv(16)/t(16;16) or t(8;21); intermediate-risk patients were comprised of those patients with normal cytogenetics, +8, t(9;11) or other nondefined karyotypes; and the unfavorable-risk patients were those with karyotypes including complex (three clonal chromosomal abnormalities), -5, 5q-, -7, 7q-, 11q23 – non t(9;11), inv(3), t(3;3), t(6;9), and t(9;22). The detailed information was illustrated in Table 1.
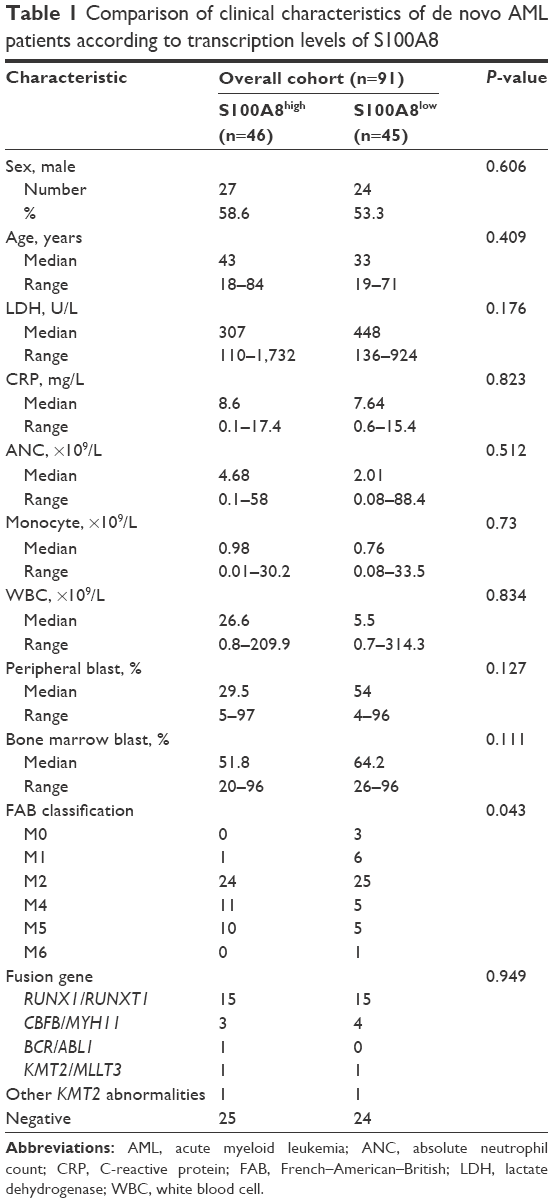 | Table 1 Comparison of clinical characteristics of de novo AML patients according to transcription levels of S100A8 |
RT-PCR detection for S100A8 gene expression
Total RNA was isolated from BMMCs using Trizol reagent (Invitrogen, Carlsbad, CA, USA) according to the manufacturer’s protocol. RNA concentrations and purities were measured with a spectrophotometer at A260 and A260/280, respectively. Two micrograms of total RNA were reversely transcribed into cDNA. The primers were designed according to the sequences of S100A8 mRNAs (GenBank No: NM_002964.4). The sense primer for S100A8 was 5′-CCGAGTGTCCTCAGTATATCAGGA-3′ and the antisense primer 5′-GCCCATCTTTATCACCAGAATGA-3′. The PCR amplification was carried out in 20 μL reaction mixture, containing 1 μL cDNA template, 1 μL of 20× EvaGreen Dye (Biotium, cat: 31000, Hayward, CA, USA), 10 μL of 2× Fast-Plus EvaGreen Mix (Biotium, cat: 31014), 5 μM forward and reverse primer, respectively, and 7 μL nuclease-free water. After a 10 minutes denaturation at 95°C, PCR was performed for 40 cycles. Each cycle was completed at 95°C for 15 seconds, 60°C for 1 minute, and followed by a 60°C elongation for 1 minute. β-Actin as a housekeeping gene, was at the same time amplified as control of the same templates. The upstream/downstream primers of β-actin was 5′-CCTGGCACCCAGCACAAT-3′ and 5′-GCCGATCCACACGGAGTACT-3′, respectively. In all samples, amplification of β-actin reached the threshold within 30 cycles. Positive and negative controls were included in all assays. S100A8 transcription level was normalized to β-actin transcription level. CT (S100A8) = CT (S100A8) - CT (β-actin). All the primers were Thermo Fisher Scientific products. The expected PCR products of S100A8 and β-actin were 119 and 70 bp, respectively. Quantitative RT-PCR detection was performed by using Invitrogen (7500 Real-Time PCR System).
Cell and culture conditions
Leukemia cell lines HL-60, NB4, K562, and SHI-1 cell lines were obtained from the American Type Culture Collection (ATCC, Manassas, VA, USA). All cell lines were maintained at 37°C in Roswell Park Memorial Institute 1640 (Invitrogen) supplemented with 10% fetal bovine serum (Invitrogen).
Transfection of HL-60 cells with engineered S100A8 gene cDNA
Based on our previous study,17 we amplified S100A8 gene from CD34 positive cells and sequenced for validation and cloned into the lentivirus vector, pLVX-IRES-puro (Clontech Laboratories, Inc, Mountain View, CA, USA). pLVX-S100A8-puro and pLVX-puro were transfected into HL-60 cells using lipofectamine 2000 transfection reagent (Invitrogen), according to manufacturer’s instructions and validated by real-time RT-PCR and Western blot.
Cell viability assay
Cells (1×10⁴/100 mL) were seeded in 96-well plates and treated on the following day (24, 48, or 72 hours) with VP-16 (etoposide), Ara-c (cytarabine), DNR (daunorubicin), and HHT (homoharringtonine/omacetaxine mepesuccinate). Cell viability was analyzed using CCK8 kit (Cat: GD721; DOJINDO Laboratories, Rockville, MD, USA) according to the manufacturer’s instructions, and optical density (OD) was read at 490 nm on a microplate reader (Bio-Rad Laboratories Inc., Hercules, CA, USA). The cell viability (%) was calculated as the following equation: cell viability = ODA/ODB (%) ×100% (ODA, experimental group; ODB, control group).
Cell cycle analysis
For cell cycle analysis, cells were harvested and washed in ice-cold phosphate-buffered saline, and then fixed in 70% cold ethanol. The cell pellets were suspended in a 1 mL solution containing 100 mg/mL Rnase (Sigma-Aldrich Co., St Louis, MO, USA) and 50 mg/mL propidium iodide (Sigma-Aldrich Co.), and incubated for 30 minutes at 37°C. Cell cycle analysis was performed on a flow cytometer (Beckman Coulter FC 500, Pasadena, CA, USA) and analyzed by Multicycle AV program (Beckman Coulter).
Apoptosis assay
Apoptosis assay was according to the manual operation of DOJINDO Annexin V Staining Kit (Cat:GD721; DOJINDO Laboratories). Briefly, cells were washed two times with cold phosphate-buffered saline and then cells were resuspended in 1× binding buffer at a concentration of ~1×10⁶ cells/mL. Then 100 μL of the solution (~1×10⁵ cells) was transferred to a 5 mL culture tube. Annexin V and propidium iodide (5 μL/test) were added. Cells were gently mixed and incubated for 15 minutes at room temperature in the dark. Four hundred microliters of 1× binding buffer was added to each tube and the cells were analyzed by flow cytometry within 1 hour.
Real-time PCR array analysis for apoptosis
Samples from each group were submerged in 1 mL Trizol (Invitrogen) for RNA extraction, and stored at −80°C until further processed. cDNA synthesis was performed on 4 μg of RNA in a 10 μL sample volume using SuperScript II reverse transcriptase (Invitrogen) as recommended by the manufacturer. Real-time PCR array (SABioscience Human Apoptosis PCR Array PAHS-3012, Frederick, MD, USA) analysis was performed in a total volume of 20 μL including 2 μL of cDNA, primers (0.2 mM each), and 10 μL of SYBR Green mix (Hoffman-La Roche Ltd., Basel, Switzerland). For gene expression quantification a comparative Ct method was used. Gene expression levels for each sample were normalized to the expression level of the housekeeping gene encoding glyceraldehyde 3-phosphate dehydrogenase within a given sample (−ΔCt); the relative expression of each gene was calculated with 106× Log 2(−ΔCt). Statistical significance of gene expression was calculated with the t-test using SPSS 17.0 version software (SPSS Inc., Chicago, IL, USA).
The patients with transcription values greater than or equal to the median of all samples was defined as S100A8high, and the patients with transcription values less than the median of all samples (median of S100A8=0.4009) was defined as: S100A8low.
Western blot analysis
Whole cell extracts were obtained according to the standard protocol using radioimmunoprecipitation assay buffer, followed by sonication for 5 minutes. Protein concentrations were measured using the Pierce BCA Protein Assay Kit (Invitrogen). Equal amounts of protein extracts (20 μg) were subjected to 10% or 12% sodium dodecylsulfate-polyacrylamide gel electrophoresis and blotted onto polyvinylidene fluoride membranes (Millipore, Belford, MA, USA), and then blocked for 1 hour in 5% nonfat powdered milk in Tris-buffered saline and Tween 20, the membrane was incubated with primary antibodies for S100A8, caspase-3, Bax, Bcl-2, and GAPDH. Blots were then incubated with a horseradish peroxidase-conjugated antimouse or antirabbit antibody. Signals were detected using ECL reagents (Invitrogen).
Statistical analyses
To compare S100A8 transcription levels in AML patients at different stages and in the control group, Mann–Whitney U-test (= Wilcoxon rank sum test) was used. To delineate distinct patient subgroups on the basis of S100A8 transcription level, patients with transcription values greater than or equal to the median of all samples were classified as having high level of S100A8 (median of S100A8=0.4009). These cut points were chosen after inspection of survival curves within quantiles of the gene transcription levels. Fisher’s exact test and the Mann–Whitney U-test were used appropriately to analyze the clinical characteristics of de novo AML patients included in this study. A P-value <0.05 was accepted as statistically significant.
Survival curves were generated by the Kaplan–Meier method, and P-values were calculated by the log-rank test. Multivariate Cox proportional hazard regression models were constructed for overall survival (OS). Confidence intervals (CI) throughout refer to 95% boundaries. All the above analyses were performed by using the statistic software SPSS 17.0 version (SPSS Inc.) and GraphPad Prism software version 5 (GraphPad Software, La Jolla, CA, USA).
Statistical comparisons of mean values in cell line study were performed using Student’s t-test. When P-values were <0.05 the effect size was calculated by using the software G*Power 3 (Faul F, Erdfelder E, Lang AG, Buchner A, Düsseldorf, Germany).18
Results
Correlation of S100A8 transcription level with clinical characteristics and treatment outcomes in de novo AML patients
We investigated the transcription levels of S100A8 in primary BMMCs obtained from 189 patients with AML (91 pretreated patients, 64 patients in CR, and 34 patients in relapse phase). The expression levels of S100A8 in AML patients had no significant difference between initial pretreated and relapse stages (P=0.257), but significant lower at initial, as compared to CR stages (P<0.001) and control group (P=0.0078) (Figure 1A). We further analyzed correlation of S100A8 expressions levels and clinical characteristics among 91 newly diagnosed AML, as shown in Table 1. The median age of patients was 40 years, range from 18 to 84 years. The differential expression of S100A8 in various stages of AML provides us the opportunity of evaluating expression of S100A8 at the transcription level through treatment course. The transcription level of S100A8 was closely related to FAB classification. S100A8 transcription levels were higher in FAB M4 and M5 than that in M0 and M1 subtypes (P=0.042) (Figure 1B). Patients with high and low S100A8 transcription levels had median OS times of 15 (CI: 12.8, 20) and 23 (CI: 18.5, 23.5) months, respectively (P=0.024). The estimated 3-year OS rates of high expression S100A8 group was 32% (CI: 16%, 52%) versus 59% (CI: 41%, 76%) for the low expression group (P=0.042) (Table 2). Survival analysis indicated that high S100A8 transcription predicted a shorter OS in the whole cohort of patients (P=0.001) (Figure 1C). To further divide the patients into four groups based on their transcription level of S100A8: 23 cases with S100A8 expression level <25%, 23 cases between 25% and 50%, 23 cases between 50% and 75%, and 23 cases >75%. As shown in Figure 1D, the patients with S100A8 level >75% had a statistical significant shorter OS than all other groups (P=0.03).
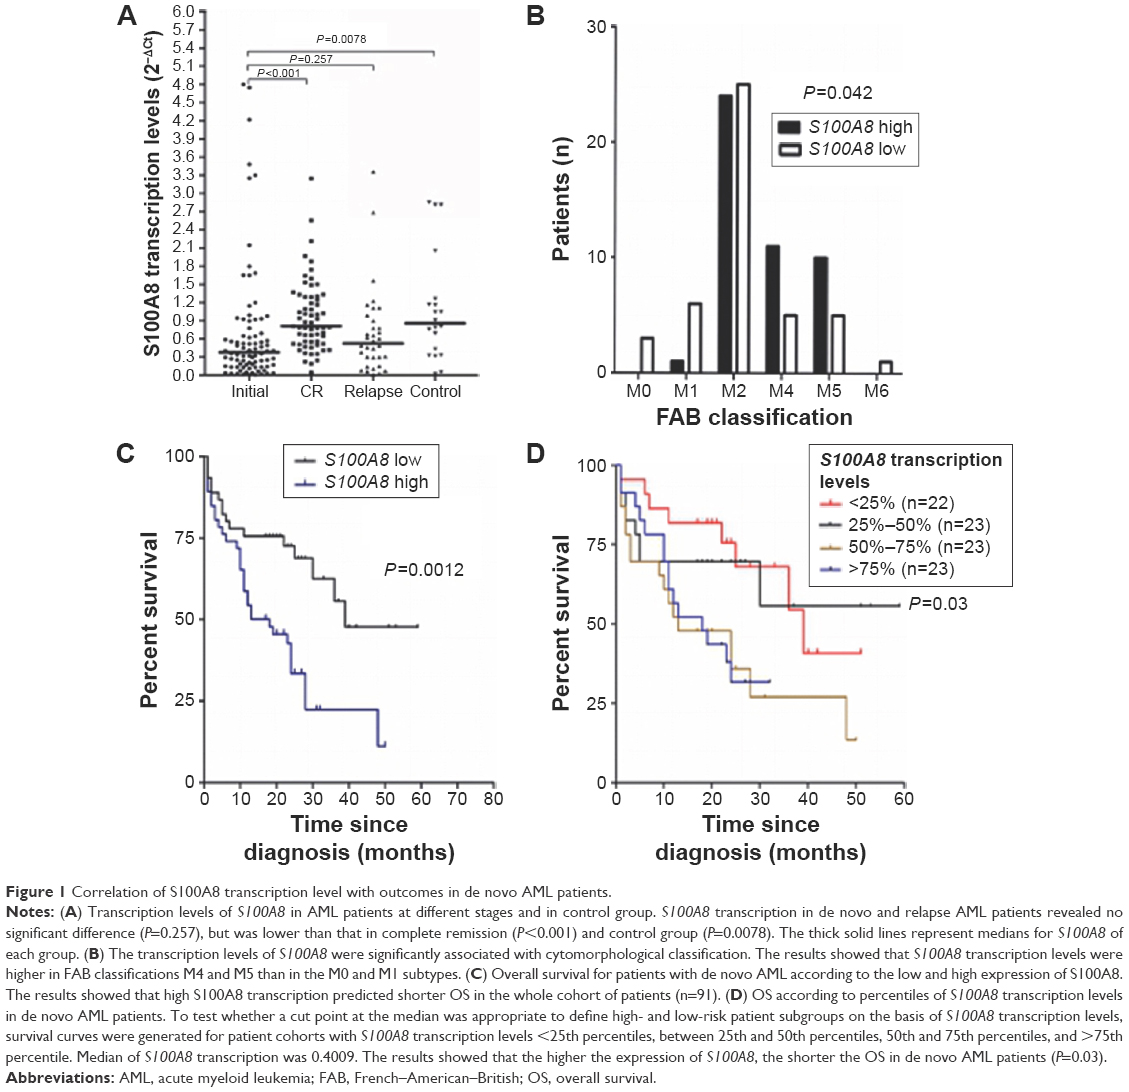 | Figure 1 Correlation of S100A8 transcription level with outcomes in de novo AML patients. |
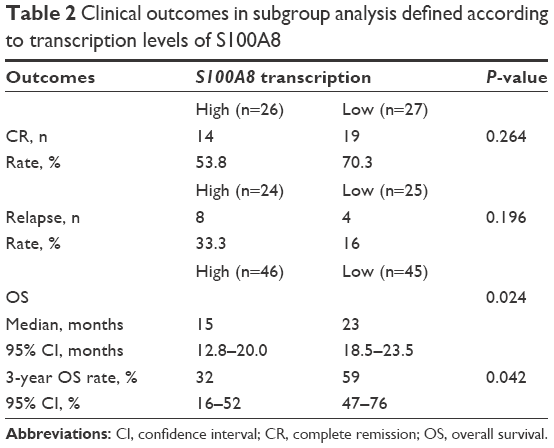 | Table 2 Clinical outcomes in subgroup analysis defined according to transcription levels of S100A8 |
Prognostic value of S100A8 transcription level in de novo AML patients in the context of other risk factors
Multivariate analyses were performed to identify the prognostic value of expression of S100A8, in addition to the well-established clinical prognostic parameters, including age, white blood cell count, bone marrow blast, cytogenetic classification, and fusion genes. Based on multivariate model for OS, high S100A8 transcription was a significant prognostic factor (P=0.003) after adjustment for age (P=0.025), bone marrow blast percentage (P=0.016), and cytogenetic classification (P=0.039) at diagnosis (Table 3). In the total cohort of de novo AML patients, the age over 60 years (P<0.001) and cytogenetic classification (P=0.016) were independently prognostic factors for OS (Figure S1A and B).
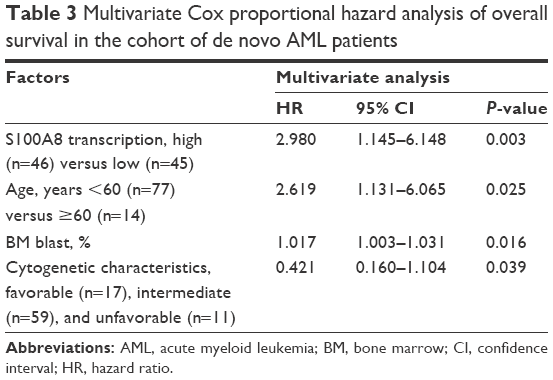 | Table 3 Multivariate Cox proportional hazard analysis of overall survival in the cohort of de novo AML patients |
Because patients <60 years represent the majority of the patient cohort (n=77), we divided this group of patients into two subgroups based on high versus low expression of S100A8. The survival rate of patients <60 years with high transcription S100A8 was better than patients group ≥60 years, but was poorer than the survival of patients <60 years with S100A8 low transcription (Figure 2A). Therefore, S100A8 transcription represents a prognostic factor and allows refined risk stratification in de novo AML patients. Next, S100A8 transcription level was analyzed against cytogenetic risk stratifications. To further explore the relationship between S100A8 transcription levels and cytogenetic risk classification, the patients were divided into six subgroups (Figure 2B). Then, survival analysis was performed based on the new stratification, giving a result that the new stratification was highly correlated with the OS (P<0.0001). With significantly different OS, patients from the intermediate-risk group were divided into two subgroups (IH, cytogenetically intermediate-risk with S100A8 high transcription and IL, cytogenetically intermediate-risk with S100A8 low transcription). Patients from group IL demonstrated a probability of OS similar to the cytogenetically favorable-risk group, whereas the survival curve of IH subgroup was close to the unfavorable-risk group (Figure 2C). All together, the transcription level of S100A8 further stratified the risk among cytogenetic subgroups.
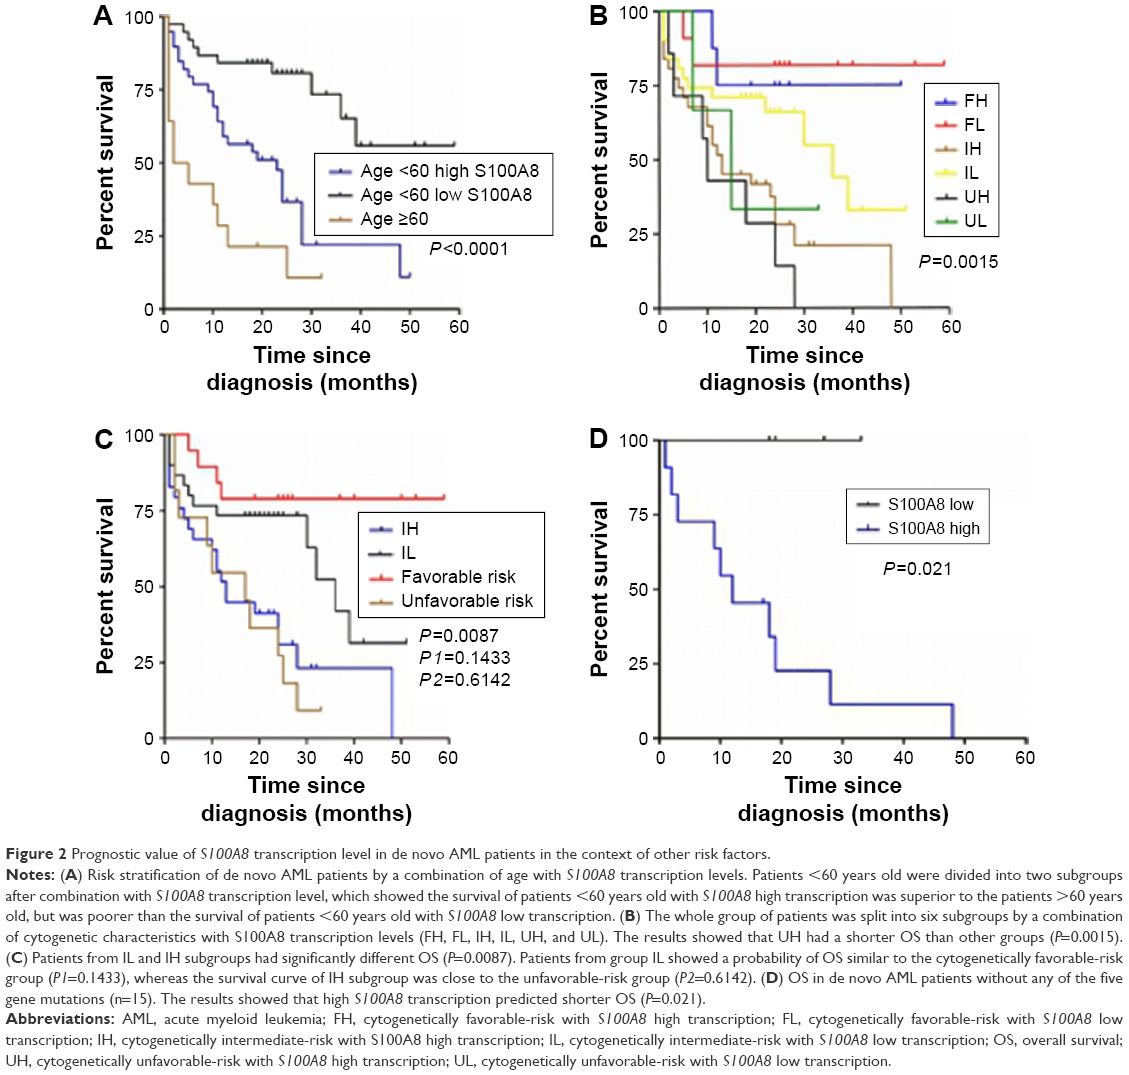 | Figure 2 Prognostic value of S100A8 transcription level in de novo AML patients in the context of other risk factors. |
Among these participants, only 24 patients were detected with gene mutations including FLT3-ITD, FLT3-TKD, NPM1, c-kit, and CEBPA. Among them, four had FLT3-ITD, four had NPM1 mutation, and two had c-kit mutations. These results were not included in the multivariate model due to the small group size. However, survival analysis for OS was performed in the small cohort of patients (n=15) with none of the five gene mutations, indicating that high S100A8 transcription predicted shorter OS (P=0.021) (Figure 2D). Therefore, S100A8 transcription level could be a prognostic factor for de novo AML patients without the above gene modifications albeit the small sample size.
Overexpression of S100A8 showed resistance to etoposide in HL-60 cells
S100A8 was differentially expressed in leukemia cell lines HL-60, NB4, K562, and SHI-1, with relatively low level of S100A8 in HL-60 cells (Figure 3A). Figure 3B indicated that HL60 cells were successfully transfected with pLVX-S100A8 and pLVX-control, respectively. The overexpression of S100A8 in HL-60 cells attenuated chemotherapy sensitivity to etoposide treatment over 72 hours compared with the control group (Figure 3C). However, pLVX-S100A8 transfected cells did not show significant difference compared with control cells when exposure to Ara-c, DNR, and HHT (data not shown). Further experiments showed that this chemoresistance to etoposide was in a time- and dose-dependent manner (Figure 3D), CCK-8 experiments demonstrated that HL-60 cells transfected with S100A8 treated with VP-16 for different hours (24, 48, and 72 hours) and different dose (150 and 300 ng/mL), showed a higher viability than HL-60 cells transfected with empty vector.
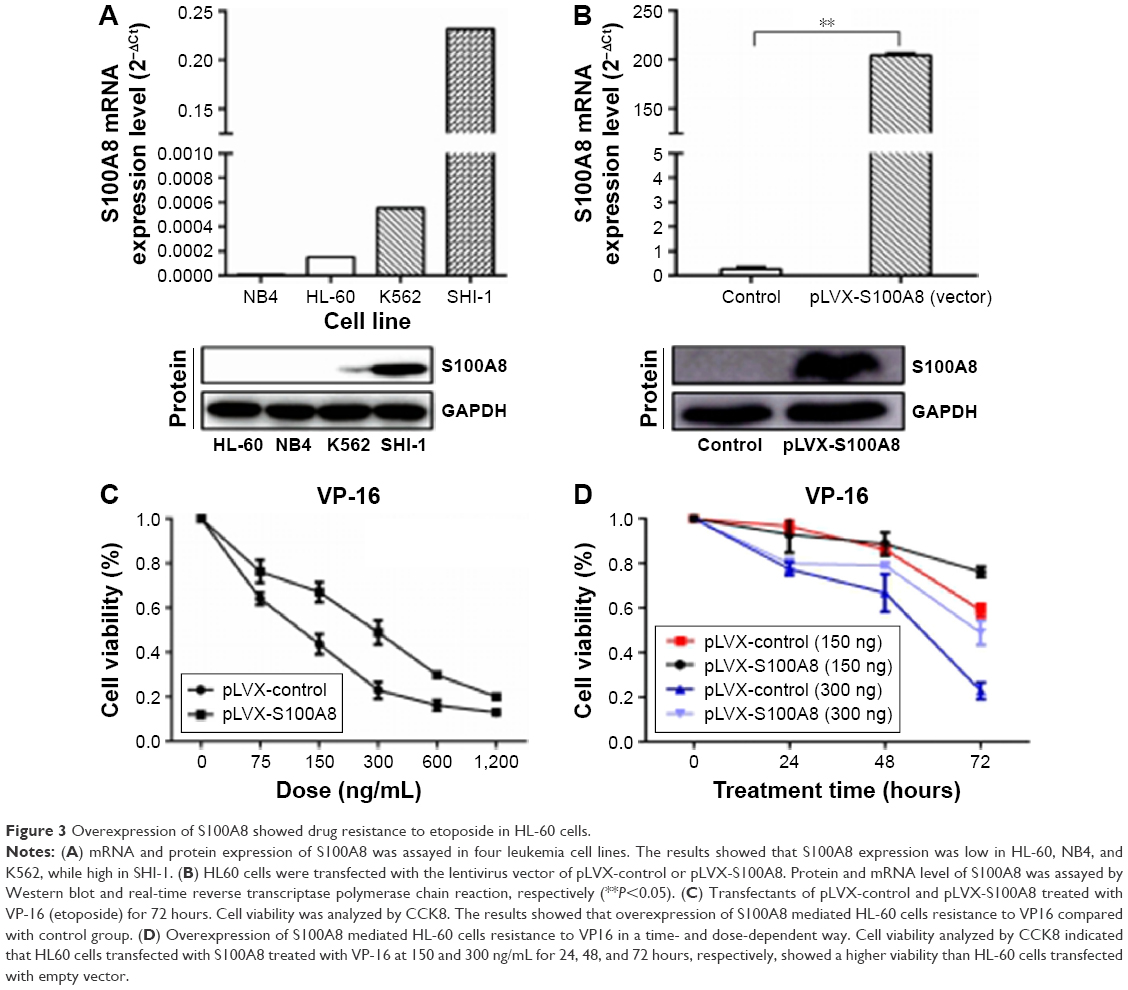 | Figure 3 Overexpression of S100A8 showed drug resistance to etoposide in HL-60 cells. |
S100A8 affects the expression of antiapoptotic or proapoptotic proteins during chemotherapy in leukemia cells
To further explore the mechanism of S100A8 drug resistance in leukemia cells, we treated the S100A8 overexpressed cells and the control cells with 300 ng/mL etoposide for 72 hours and detected cell apoptosis by flow cytometry. We found that overexpression of S100A8 in HL-60 cells promoted resistance to apoptosis compared with the control group (Figure 4). These data demonstrated apoptosis pathway mediated S100A8 resistance to etoposide.
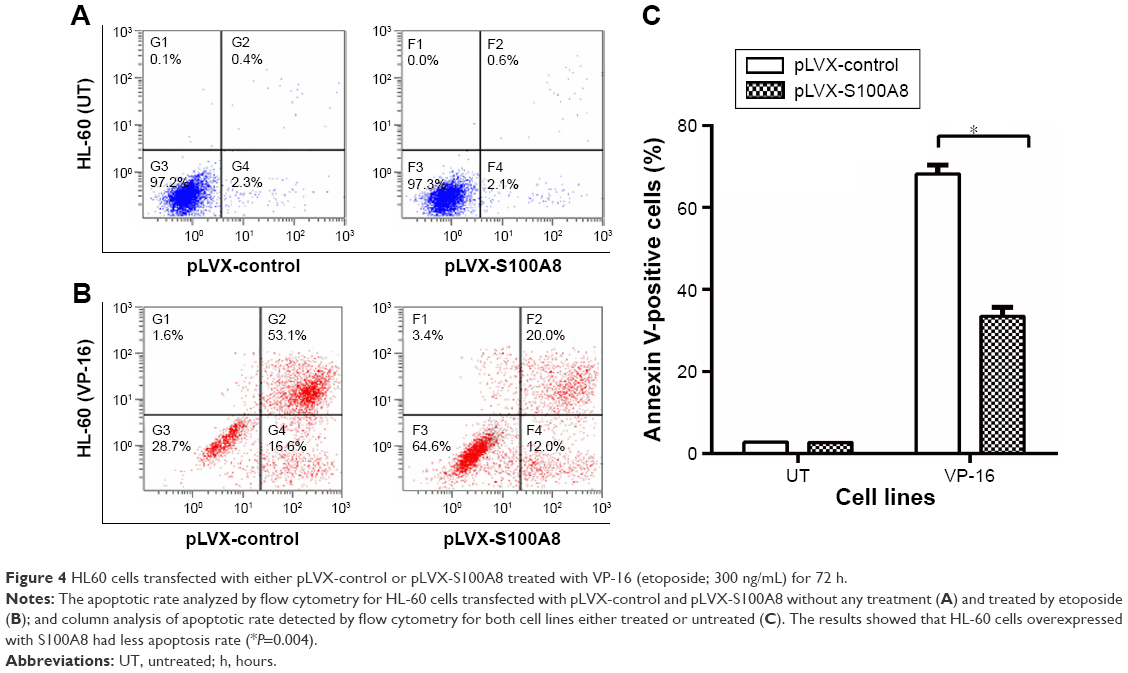 | Figure 4 HL60 cells transfected with either pLVX-control or pLVX-S100A8 treated with VP-16 (etoposide; 300 ng/mL) for 72 h. |
Using real-time apoptosis PCR arrays, we analyzed and clustered the expression of 370 genes associated with apoptosis pathway in control and S100A8 overexpression cells treated by etoposide at 300 ng/mL for 12 hours (Figure 5A). The genes most significantly upregulated or downregulated are shown in Figure 5B and C, respectively. Examination of the array data revealed that 36 genes were significantly downregulated and 12 genes were significantly upregulated in S100A8 overexpression group compared with control group (Tables 4 and 5, respectively). The expression patterns of caspase-3, Bcl-2, and Bax were validated by Western blot analysis (Figure 5D).
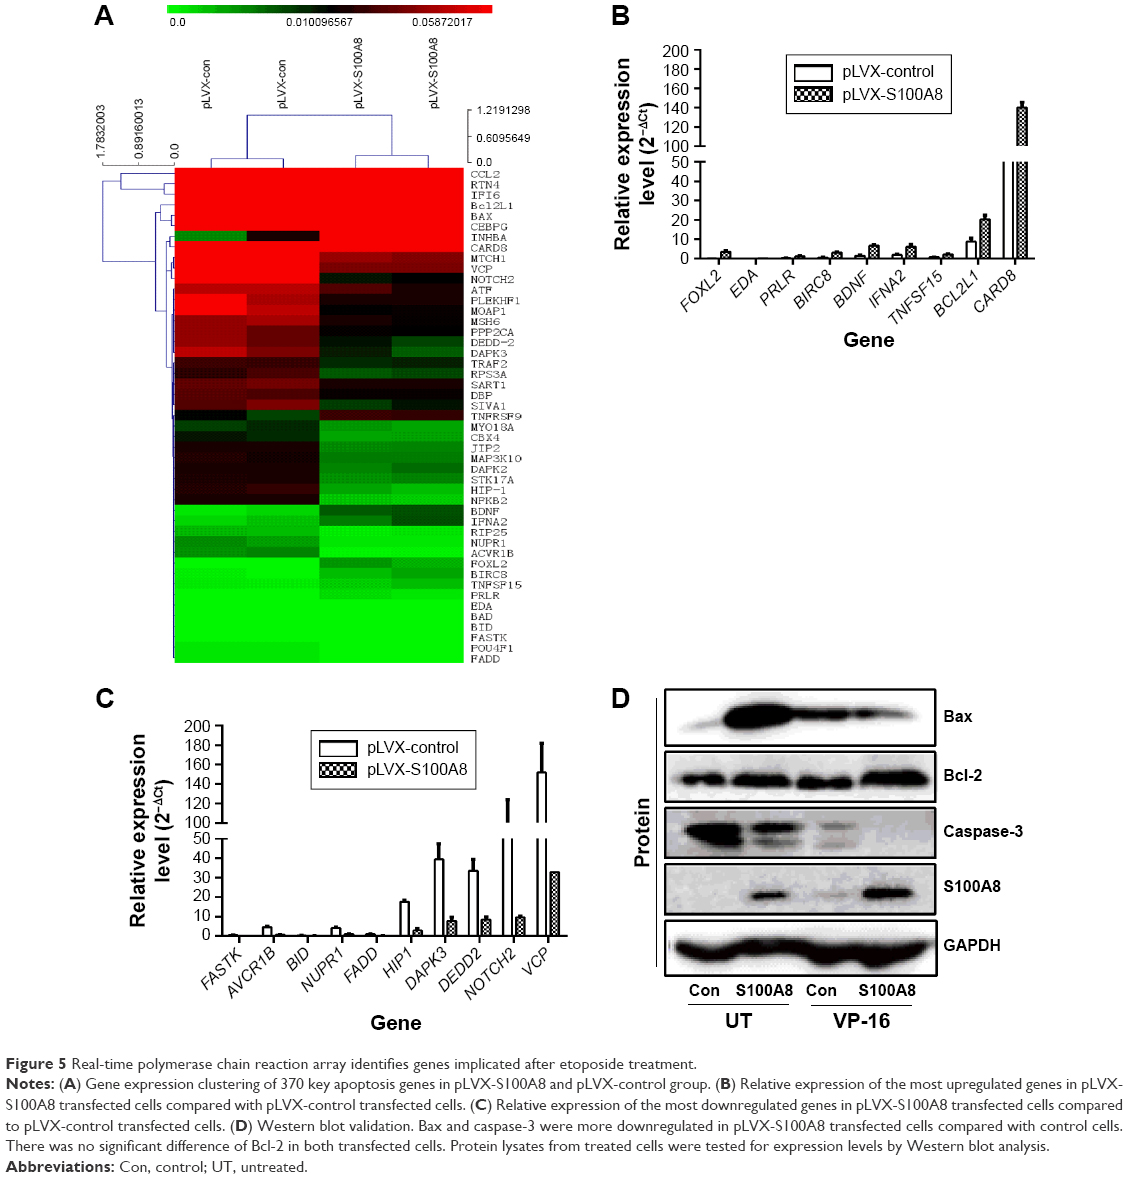 | Figure 5 Real-time polymerase chain reaction array identifies genes implicated after etoposide treatment. |
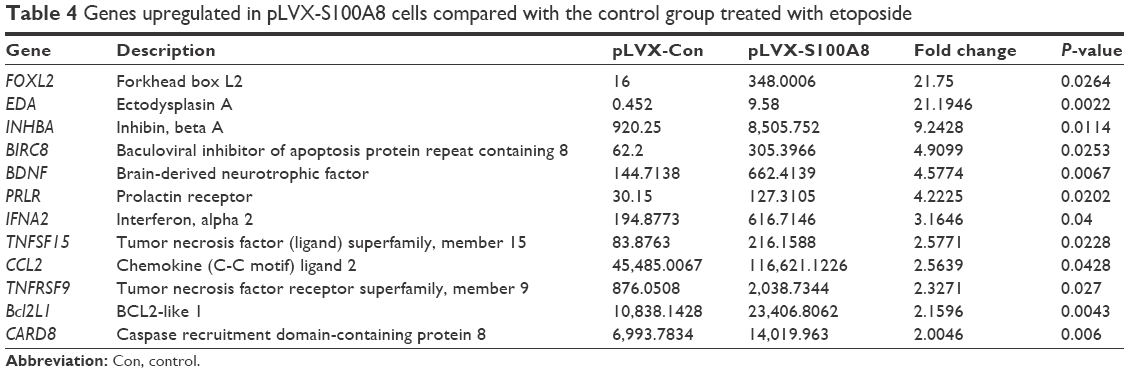 | Table 4 Genes upregulated in pLVX-S100A8 cells compared with the control group treated with etoposide |
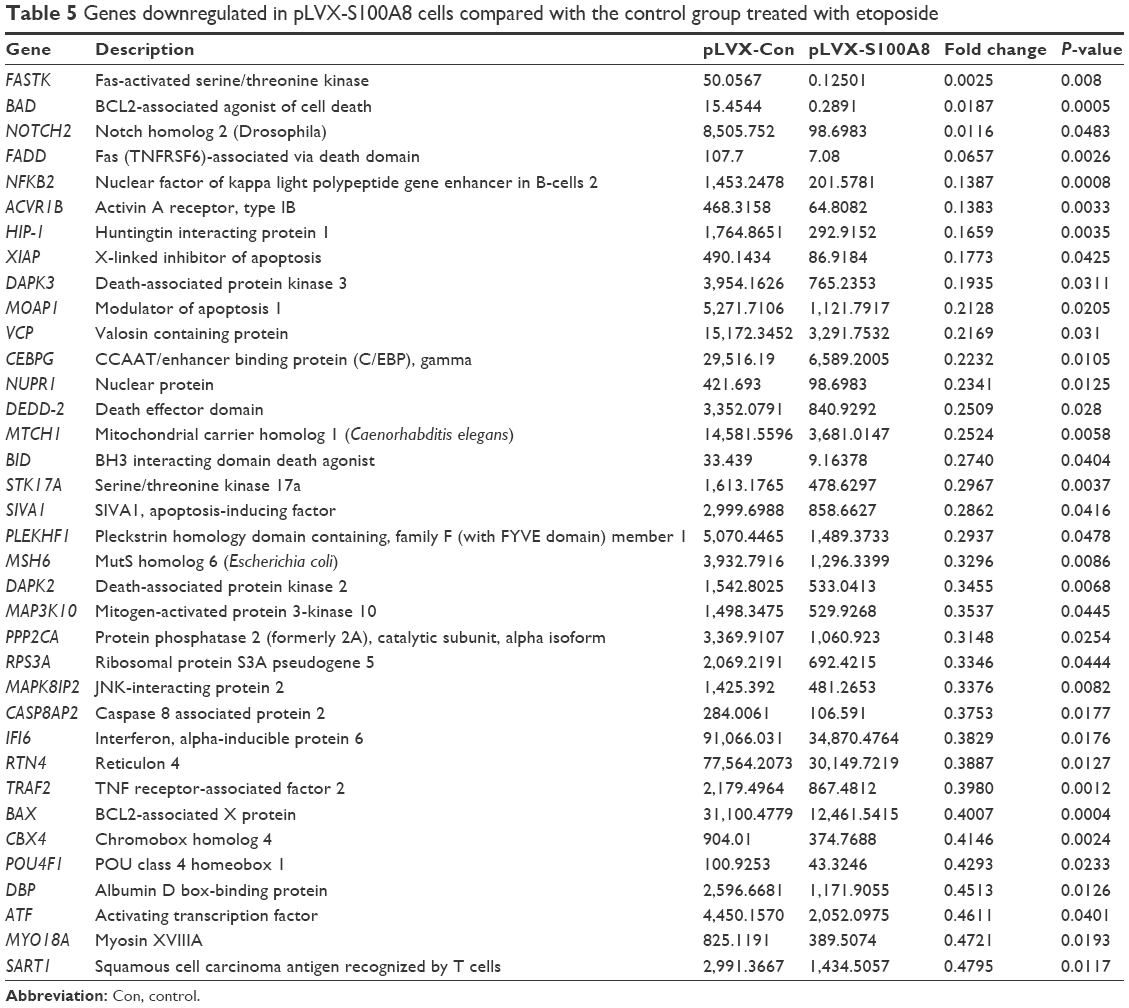 | Table 5 Genes downregulated in pLVX-S100A8 cells compared with the control group treated with etoposide |
Discussion
In this study, for the first time to our best knowledge, we demonstrated that the transcription levels of S100A8 in AML patients at different stages were diverse, that is, its transcription levels decreased in de novo and relapse stages when compared with patients in CR and control group. Our results showed that S100A8 is a predictor of poor survival in de novo AML patients. Overexpression of S100A8 enhances the drug resistance of AML cells to etoposide by downregulating the expression of Bax and caspase-3, suggesting chemoresistance induced by over expression of S100A8 involved in antiapoptosis pathway.
S100A8 is constitutively expressed by myeloid cells, including granulocytes, monocytes, and early differentiated cells of the myeloid lineage.19,20 The differential expression of S100A8 in various stages of AML provides us the opportunity of evaluating expression of S100A8 at the transcription level through treatment course. Furthermore, in de novo AML patients, S100A8 transcription levels were higher in FAB M4 and M5 than in the M0 and M1 subtypes (Figure 1B).
S100A8 belongs to a family of 25 homologous low-molecular-weight intracellular calcium-binding proteins that exhibit tissue and cell-specific expression.21 Twenty-one of the human S100 genes are clustered on chromosome 1q21, a frequent target region for chromosome rearrangements that occur during tumor development, indicating their possible involvement in malignancy.22 S100A8 gene expresses differentially in a wide variety of cell types, abundantly in myeloid cells. It has been reported to regulate cell proliferation and metastatic processes,23 to induce apoptosis,24 and to be involved in the progression of various cancers.25 In this context, we detected the mRNA expression level of S100A8 in bone marrow cells from AML patients at different stages to explore the influence of transcription level of S100A8 on the clinical characteristics, development, and prognosis of AML patients. Meanwhile, we explored its potential function in vitro. In this cohort of 91 de novo AML patients, we found that S100A8 transcription level correlated with OS in univariate analysis. Moreover, multivariate model showed S100A8 expression at transcriptional level was a strong prognostic factor for de novo AML patients.
Recently, Nicolas et al12 used mass spectrometry-based proteomic approaches to characterize de novo AML, revealing the expression of S100A8 in leukemic cells is a predictor of poor survival. Because of mRNA alternative splicing, allelic variations, and posttranslational modifications, the genome can produce well over a million protein species, but our qRT-PCR study and the previous proteomic analysis reached the same goal by different means. S100A8 transcription status could provide two subgroups of different treatment outcomes, refining risk stratification of de novo AML. Our data showed that S100A8 has been associated with worse prognosis and is a predictor of poor survival in AML patients. Meanwhile, in vitro data showed over expression, S100A8 decreased chemotherapy sensitivity and the apoptosis of leukemia cells when comparing with parental line suggesting a strong influence of S100A8 on chemoresistance of leukemia cells. Although mechanisms of chemoresistance for S100A8 can be multitude, and one novel finding suggested by Yang et al9,10 that S100A8 enhances drug resistance by regulating autophagy. However, chemoresistance results from multiple mechanisms including dysfunctional membrane transport, resistance to apoptosis, and the persistence of stem cell-like leukemia cells or in combination were all previously published.26,27 Therefore, further study is needed to help predict and overcome drug resistance thereby improving chemotherapy and ultimately the outcome of AML patients.
Mitochondrion-dependent apoptosis is the key mechanism of cell death induced by chemosensitizers.28 Mitochondrion-dependent apoptosis is controlled by Bcl-2 family members, which can be classified into three subfamilies: antiapoptotic members such as Bcl-2, Bcl-XL, and Mcl-1; proapoptotic members such as Bax and Bak; and BH3 (Bcl-2 homology domain 3)-only members such as Bim and Bad.28,29 The upregulation of Bcl-2/Bax ratio expression increases the resistance to chemotherapeutic drugs, whereas the upregulation of Bcl-2/Bax ratio expression promotes the apoptotic response to anticancer drugs.30 Our apoptosis PCR array result together with Western blot experiments showed that overexpression S100A8 in combination with etoposide decreased the expression of Bax compared with control group suggesting that the antiapoptotic mechanism of S100A8 in etoposide treated cells manifested by decreasing the expression of the Bax protein. In addition, caspase-3 were significantly decreased in the etoposide treatment groups, compared control groups (Figure 5D), suggesting that caspase-3 pathway were involved in S100A8 drug-resistance mechanism.
In summary, our retrospective study demonstrated the transcription level of S100A8 in AML were significantly associated with disease prognosis and could potentially be used as a marker of future novel therapeutic targeting. Additionally, S100A8 involved in chemoresistance via antiapoptosis way by inducing apoptosis and decreasing the expression of Bax and caspase-3 protein. These results further suggest that the transcription level of S100A8 emerged as a strong prognostic factor in AML patients with intensive chemotherapy, refining the stratification of de novo AML. Hence, we propose that developing more specific S100A8 inhibitor may well be beneficial for AML patients with S100A8 overexpression.
Acknowledgments
This study was supported by grants from The National Natural Science Foundation of China (81170513, 81370627, 81170468, 81100371, 81300423, and 81570125), Jiangsu Province Key Project (BL2013014), and the Project Funded by the Priority Academic Program Development of Jiangsu Higher Education Institutions.
Disclosure
The authors report no conflicts of interest in this work.
References
Siegel RL, Miller KD, Jemal A. Cancer statistics, 2015. CA Cancer J Clin. 2015;65(6):5–29. | ||
Vardiman JW, Thiele J, Arber DA, et al. The 2008 revision of the World Health Organization (WHO) classification of myeloid neoplasms and acute leukemia: rationale and important changes. Blood. 2009;114(5):937–951. | ||
Slovak ML, Kopecky KJ, Cassileth PA, et al. Karyotypic analysis predicts outcome of preremission and postremission therapy in adult acute myeloid leukemia: a Southwest Oncology Group/Eastern Cooperative Oncology Group Study. Blood. 2000;96(13):4075–4083. | ||
Rowe JM, Tallman MS. How I treat acute myeloid leukemia. Blood. 2010;116(17):3147–3156. | ||
Salama I, Malone PS, Mihaimeed F, Jones JL. A review of the S100 proteins in cancer. Eur J Surg Oncol. 2008;34(4):357–364. | ||
Gebhardt C, Nemeth J, Angel P, Hess J. S100A8 and S100A9 in inflammation and cancer. Biochem Pharmacol. 2006;72(11):1622–1631. | ||
Basso D, Bozzato D, Padoan A, et al. Inflammation and pancreatic cancer: molecular and functional interactions between S100A8, S100A9, NT-S100A8 and TGFbeta1. Cell Commun Signal. 2014;12:20. | ||
Yong HY, Moon A. Roles of calcium-binding proteins, S100A8 and S100A9, in invasive phenotype of human gastric cancer cells. Arch Pharm Res. 2007;30(1):75–81. | ||
Yang L, Yang M, Zhang H, et al. S100A8-targeting siRNA enhances arsenic trioxide-induced myeloid leukemia cell death by down-regulating autophagy. Int J Mol Med. 2012;29(1):65–72. | ||
Yang M, Zeng P, Kang R, et al. S100A8 contributes to drug resistance by promoting autophagy in leukemia cells. PLoS One. 2014;9(5):e97242. | ||
Spijkers-Hagelstein JA, Schneider P, Hulleman E, et al. Elevated S100A8/S100A9 expression causes glucocorticoid resistance in MLL-rearranged infant acute lymphoblastic leukemia. Leukemia. 2012;26(6):1255–1265. | ||
Nicolas E, Ramus C, Berthier S, et al. Expression of S100A8 in leukemic cells predicts poor survival in de novo AML patients. Leukemia. 2011;25(1):57–65. | ||
Zhang Y, Yang S, Wang J, et al. [Comparison of 10 mg/m2 or 8 mg/m2 idarubicin plus cytarabine regimen as induction chemotherapy for adult patients with newly diagnosed acute myeloid leukemia]. Zhonghua Xue Ye Xue Za Zhi. 2015;36(3):225–229. | ||
Yamada K, Furusawa S, Saito K, et al. Concurrent use of granulocyte colony-stimulating factor with low-dose cytosine arabinoside and aclarubicin for previously treated acute myelogenous leukemia: a pilot study. Leukemia. 1995;9(1):10–14. | ||
Martelli MP, Sportoletti P, Tiacci E, Martelli MF, Falini B. Mutational landscape of AML with normal cytogenetics: biological and clinical implications. Blood Rev. 2013;27(1):13–22. | ||
O’Donnell MR, Abboud CN, Altman J, et al. Acute myeloid leukemia. J Natl Compr Canc Netw. 2012;10(8):984–1021. | ||
Wu SY, Fan J, Hong D, et al. C3aR1 gene overexpressed at initial stage of acute myeloid leukemia-M2 predicting short-term survival. Leuk Lymphoma. 2015;56(7):2200–2202. | ||
Faul F, Erdfelder E, Lang AG, Buchner A. G*Power 3: a flexible statistical power analysis program for the social, behavioral, and biomedical sciences. Behav Res Methods. 2007;39(2):175–191. | ||
Goyette J, Geczy CL. Inflammation-associated S100 proteins: new mechanisms that regulate function. Amino Acids. 2011;41(4):821–842. | ||
Roth J, Vogl T, Sorg C, Sunderkotter C. Phagocyte-specific S100 proteins: a novel group of proinflammatory molecules. Trends Immunol. 2003;24(4):155–158. | ||
Heizmann CW, Fritz G, Schafer BW. S100 proteins: structure, functions and pathology. Front Biosci. 2002;7:d1356–d1368. | ||
Donato R. S100: a multigenic family of calcium-modulated proteins of the EF-hand type with intracellular and extracellular functional roles. Int J Biochem Cell Biol. 2001;33(7):637–668. | ||
Tolson JP, Flad T, Gnau V, et al. Differential detection of S100A8 in transitional cell carcinoma of the bladder by pair wise tissue proteomic and immunohistochemical analysis. Proteomics. 2006;6(2):697–708. | ||
Yui S, Mikami M, Yamazaki M. Induction of apoptotic cell death in mouse lymphoma and human leukemia cell lines by a calcium-binding protein complex, calprotectin, derived from inflammatory peritoneal exudate cells. J Leukoc Biol. 1995;58(6):650–658. | ||
Cross SS, Hamdy FC, Deloulme JC, Rehman I. Expression of S100 proteins in normal human tissues and common cancers using tissue microarrays: S100A6, S100A8, S100A9 and S100A11 are all overexpressed in common cancers. Histopathology. 2005;46(3):256–269. | ||
Esposito MT, So CW. DNA damage accumulation and repair defects in acute myeloid leukemia: implications for pathogenesis, disease progression, and chemotherapy resistance. Chromosoma. 2014;123(6):545–561. | ||
Mohamed AM, Balsat M, Thenoz M, et al. Oncogene- and drug resistance-associated alternative exon usage in acute myeloid leukemia (AML). Oncotarget. 2016;7(3):2889–2909. | ||
Kim R, Emi M, Tanabe K. Role of mitochondria as the gardens of cell death. Cancer Chemother Pharmacol. 2006;57(5):545–553. | ||
Cotter TG. Apoptosis and cancer: the genesis of a research field. Nat Rev Cancer. 2009;9(7):501–507. | ||
Balkham SE, Sargent JM, Elgie AW, Williamson CJ, Taylor CG. Comparison of BCL-2 and BAX protein expression with in vitro sensitivity to ARA-C and 6TG in AML. Adv Exp Med Biol. 1999;457:335–340. |
Supplementary material
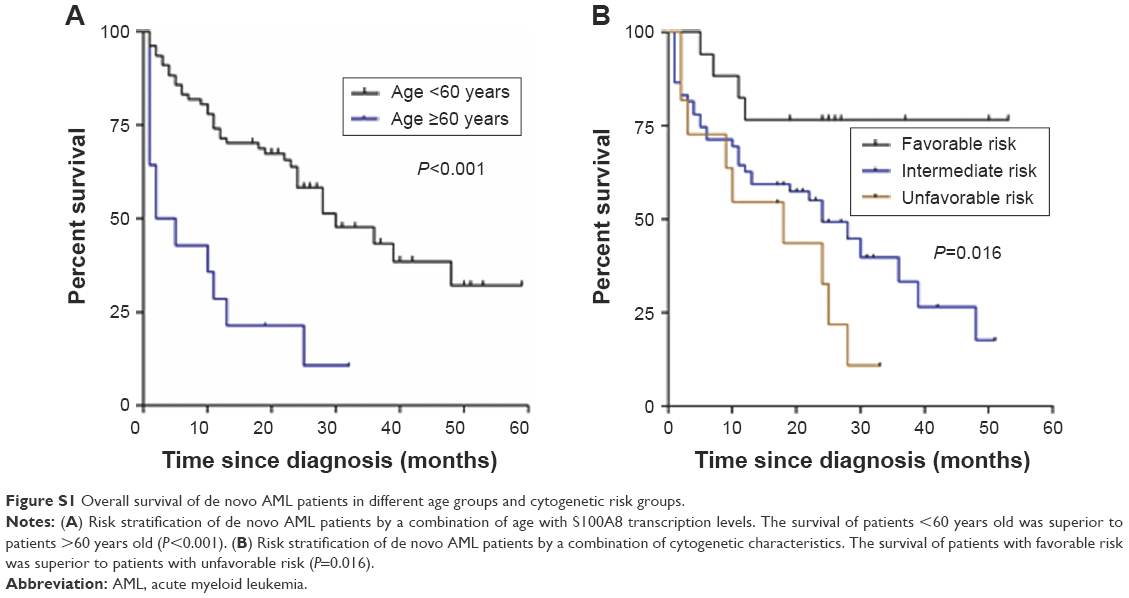 | Figure S1 Overall survival of de novo AML patients in different age groups and cytogenetic risk groups. |
 © 2016 The Author(s). This work is published and licensed by Dove Medical Press Limited. The full terms of this license are available at https://www.dovepress.com/terms.php and incorporate the Creative Commons Attribution - Non Commercial (unported, v3.0) License.
By accessing the work you hereby accept the Terms. Non-commercial uses of the work are permitted without any further permission from Dove Medical Press Limited, provided the work is properly attributed. For permission for commercial use of this work, please see paragraphs 4.2 and 5 of our Terms.
© 2016 The Author(s). This work is published and licensed by Dove Medical Press Limited. The full terms of this license are available at https://www.dovepress.com/terms.php and incorporate the Creative Commons Attribution - Non Commercial (unported, v3.0) License.
By accessing the work you hereby accept the Terms. Non-commercial uses of the work are permitted without any further permission from Dove Medical Press Limited, provided the work is properly attributed. For permission for commercial use of this work, please see paragraphs 4.2 and 5 of our Terms.