Back to Journals » International Journal of General Medicine » Volume 16
High Expression of MORC2 is Associated with Poor Clinical Outcomes and Immune Infiltrates in Colon Adenocarcinoma
Authors Zhao P, Ning J, Huang J, Wei B, Wang Z, Huang X ![]()
Received 20 May 2023
Accepted for publication 7 September 2023
Published 11 October 2023 Volume 2023:16 Pages 4595—4615
DOI https://doi.org/10.2147/IJGM.S420715
Checked for plagiarism Yes
Review by Single anonymous peer review
Peer reviewer comments 2
Editor who approved publication: Dr Scott Fraser
Peizhuang Zhao,* Jiajia Ning,* Jun Huang,* Binqian Wei, Zhen Wang, Xue Huang
Department of Geriatrics and Gastroenterology, the First Affiliated Hospital of Guangxi Medical University, Nanning, Guangxi, People’s Republic of China
*These authors contributed equally to this work
Correspondence: Xue Huang, Department of Geriatrics and Gastroenterology, the First Affiliated Hospital of Guangxi Medical University, Nanning, Guangxi, 530000, People’s Republic of China, Email [email protected]
Purpose: Microrchidia 2 (MORC2) is a universally expressed molecule that has recently been identified as a chromatin modulator and elevated in many malignancies. However, its prognostic value and immunological role of MORC2 in colon adenocarcinoma (COAD) have never been illustrated.
Methods: The clinical parameters and MORC2 expression datasets of COAD patients were obtained from The Cancer Genome Atlas (TCGA). Cancer and adjacent tissue specimens from surgically resected COAD patients were collected, and quantitative real-time PCR was used to detect MORC2 expression. Differentially expressed genes related to MORC2 were discovered and used for functional enrichment analysis. The diagnostic and prognostic values of MORC2 in COAD were conducted using receiver operating characteristics (ROC), Kaplan–Meier survival curve analysis, PrognoScan, Gene Expression Profiling Interactive Analysis (GEPIA) public databases and nomograms. Eventually, the association of MORC2 with tumor microenvironment was analyzed by using TIMER and GSVA package of R (v3.6.3).
Results: MORC2 expression was upregulated in COAD tissues, and the RT-qPCR results further verified the reliability of our differential analysis at the transcriptional level. Additionally, higher expression of MORC2 was correlated to a poor prognosis for COAD patients. MORC2 was an independent prognostic factor for COAD and could be a diagnostic factor for early COAD. Furthermore, MORC2 expression was positively correlated with immune cells such as NK cells, TFH cells and so on.
Conclusion: The findings demonstrated that overexpression of MORC2 was correlated with worse prognosis and immune infiltrates of COAD. MORC2 can serve as a reliable diagnostic and prognostic biomarker and a target of immunotherapy for COAD patients.
Keywords: MORC2, colon adenocarcinoma, diagnosis, prognosis, immune cell infiltration, biomarker
Introduction
In recent years, colorectal cancer (CRC) remains the third most common cancer worldwide, which accounts for 9.4% of cancer deaths, just lower than lung cancer with the proportion of 18%, and adenocarcinoma is the main pathologic type of colorectal cancer.1 Current methods for diagnosing CRC include colonoscopy, double-contrast barium enema, CT colonoscopy, and fecal occult blood test, but most of them are invasive and costly.2 How to use sensitive, non-invasive, and economical methods to accurately diagnose CRC earlier and how to monitor the prognosis of patients with confirmed disease has become a research hotspot in this field.3 Nowadays, biomarkers such as FOBT and CEA have the potential to be more specific in tracking the course of an illness or the effectiveness of a treatment, but they tend to be low sensitive.4 Therefore, investigating better molecules to establish an accurate diagnosis and prognosis evaluation for CRC is inevitable. Despite the treatment of CRC being constantly improving and optimizing, the increasing incidence of CRC cases and the rise in morbidity among the younger generation is still a huge challenge for public health and organizations and now causes a heavy financial burden.5 In recent years, immunotherapy-related drugs have been approved for use in advanced tumors with high microsatellite instability (MSI-H), including metastatic CRC (mCRC), and improved survival outcomes have sparked renewed interest in using the immune system as an anti-tumor biological weapon. Unfortunately, for the majority of mCRC patients who are not MSI-H, immunotherapy offers little benefit.6 Consequently, we urgently need new biomarkers as immunotherapy targets.
Human MORC2 (MORC family CW-type zinc-finger 2), a highly conserved nuclear matrix protein, is a member of the MORC nuclear protein family characterized by one CW-type zinc-finger and three coiled-coil domains.7,8 MORC2 has been validated to be associated with chromatin remodeling, promoting lipogenesis, facilitating DNA damage repair and repression gene transcription.9 MORC2 is reported to be closely associated with tumor progression. Studies have proven that high MORC2 expression is detected in several cancers, such as liver cancer, mammary cancer, and gastric cancer, and found that MORC2 expression level is much more upregulated in high-grade cancer tissues and related to unfavorable pathological features, poor overall survival, and disease-free survival.10 It has been reported that phosphorylation of MORC2 by PAK1 promotes the proliferation of gastric cancer cells and tumorigenesis;11 MORC2 promotes cell cycle progression by recruiting HDAC1 to the P21 promoter and down-regulating P21 in a p53-independent manner.12 Furthermore, MORC2 has been demonstrated to promote lipogenesis and adipogenesis of human breast cancer cells and be involved in a prognostic prediction model for breast cancer.13 Of note, Tuupanen et al reported that MORC2 is a candidate oncogene for mutational hot spots in micro-satellite-instable CRC.14 These results suggest that MORC2 may be an oncogene. Nevertheless, the mechanism of MORC2 in colorectal adenocarcinoma (COAD) remains unclear yet, and few studies have explored the potential role of MORC2 in COAD including its expression, prognostic value, or correlation with immune infiltration.
In this research, we performed a differential expression analysis of MORC2 and analyzed its association with clinicopathological features and prognosis in COAD by using several kinds of commonly used public databases such as The Cancer Genome Atlas (TCGA), UALCAN, PrognoScan, and Gene Expression Profiling Interactive Analysis (GEPIA). The potential function and pathway of MORC2 in COAD was predicted by performing Gene Ontology (GO) and the Kyoto Encyclopedia of Genes and Genomes (KEGG) enrichment analysis. Finally, the single-sample GSEA (ssGEAS), Tumor Immune Estimation Resource (TIMER) database, and ESTIMATE algorithm were used to explore the correlation of MORC2 expression with immune infiltration. This research provides new insights into the potential mechanism of COAD oncogenesis, and indicates that MORC2 can be an independent diagnostic and prognostic marker of COAD and a target of immunotherapy for COAD patients.
Materials and Methods
Acquisition and Analysis of RNA-Sequencing Data
We downloaded high-throughput RNAseq data and corresponding clinicopathological information of COAD from the TCGA database (https://portal.gdc.cancer.gov). Finally, 478 cases of COAD patients were eligible into analysis including 480 cancer tissues and 41 normal tissues. We converted transcripts of RNA sequencing data into log2 per million reads format for comparison of expression between normal, adjacent normal, and cancer samples. Next, we explored MORC2 expression between the COAD tissue and normal tissue from TCGA database, and we used the UALCAN website (http://ualcan.path.uab.edu/index.html) for further analysis. Then, we acquired MORC2 protein in COAD with immunohistochemical staining from the Human Protein Atlas (https://www.proteinatlas.org/).
Tissues Collection and Quantitative Real-Time PCR
Forty-one patients with pathologically diagnosed COAD were enrolled from 2022 April to 2022 August in the First Affiliated Hospital of Guangxi Medical University in this study, and all included patients underwent radical surgery without receiving any neoadjuvant radiotherapy and chemotherapy before their surgical operation. Furthermore, patients who were complicated with other known tumors were excluded. COAD tissues and their respective adjacent normal tissues (5 cm from the tumors) excised during surgery were immersed in RNA protective solution and quickly transferred to a −80°C refrigerator for preservation. This study has been approved by the Ethics Committee of the First Affiliated Hospital of Guangxi Medical University and informed consent of all patients. The clinical information of these 41 patients is presented in Table 1. RNAiso Plus solution (9109, Takara), isopropanol, and chloroform were used to extract and purify total RNA from tissues, and we then subjected the RNA to reverse transcription with a PrimeScript RT Reagent Kit with gDNA Eraser (RR047A, Takara). After that, the expression of the MORC2 gene was normalized to GAPDH expression. The mRNA expression levels of GAPDH and MORC2 were determined by amplification with GoTaq qPCR Master Mix (A6002, Promega) and a 7500 instrument. The levels of mRNA were normalized relative to GAPDH. The relative mRNA expression levels of the target genes were calculated by 2−ΔΔCT method. Specific primer base sequence:
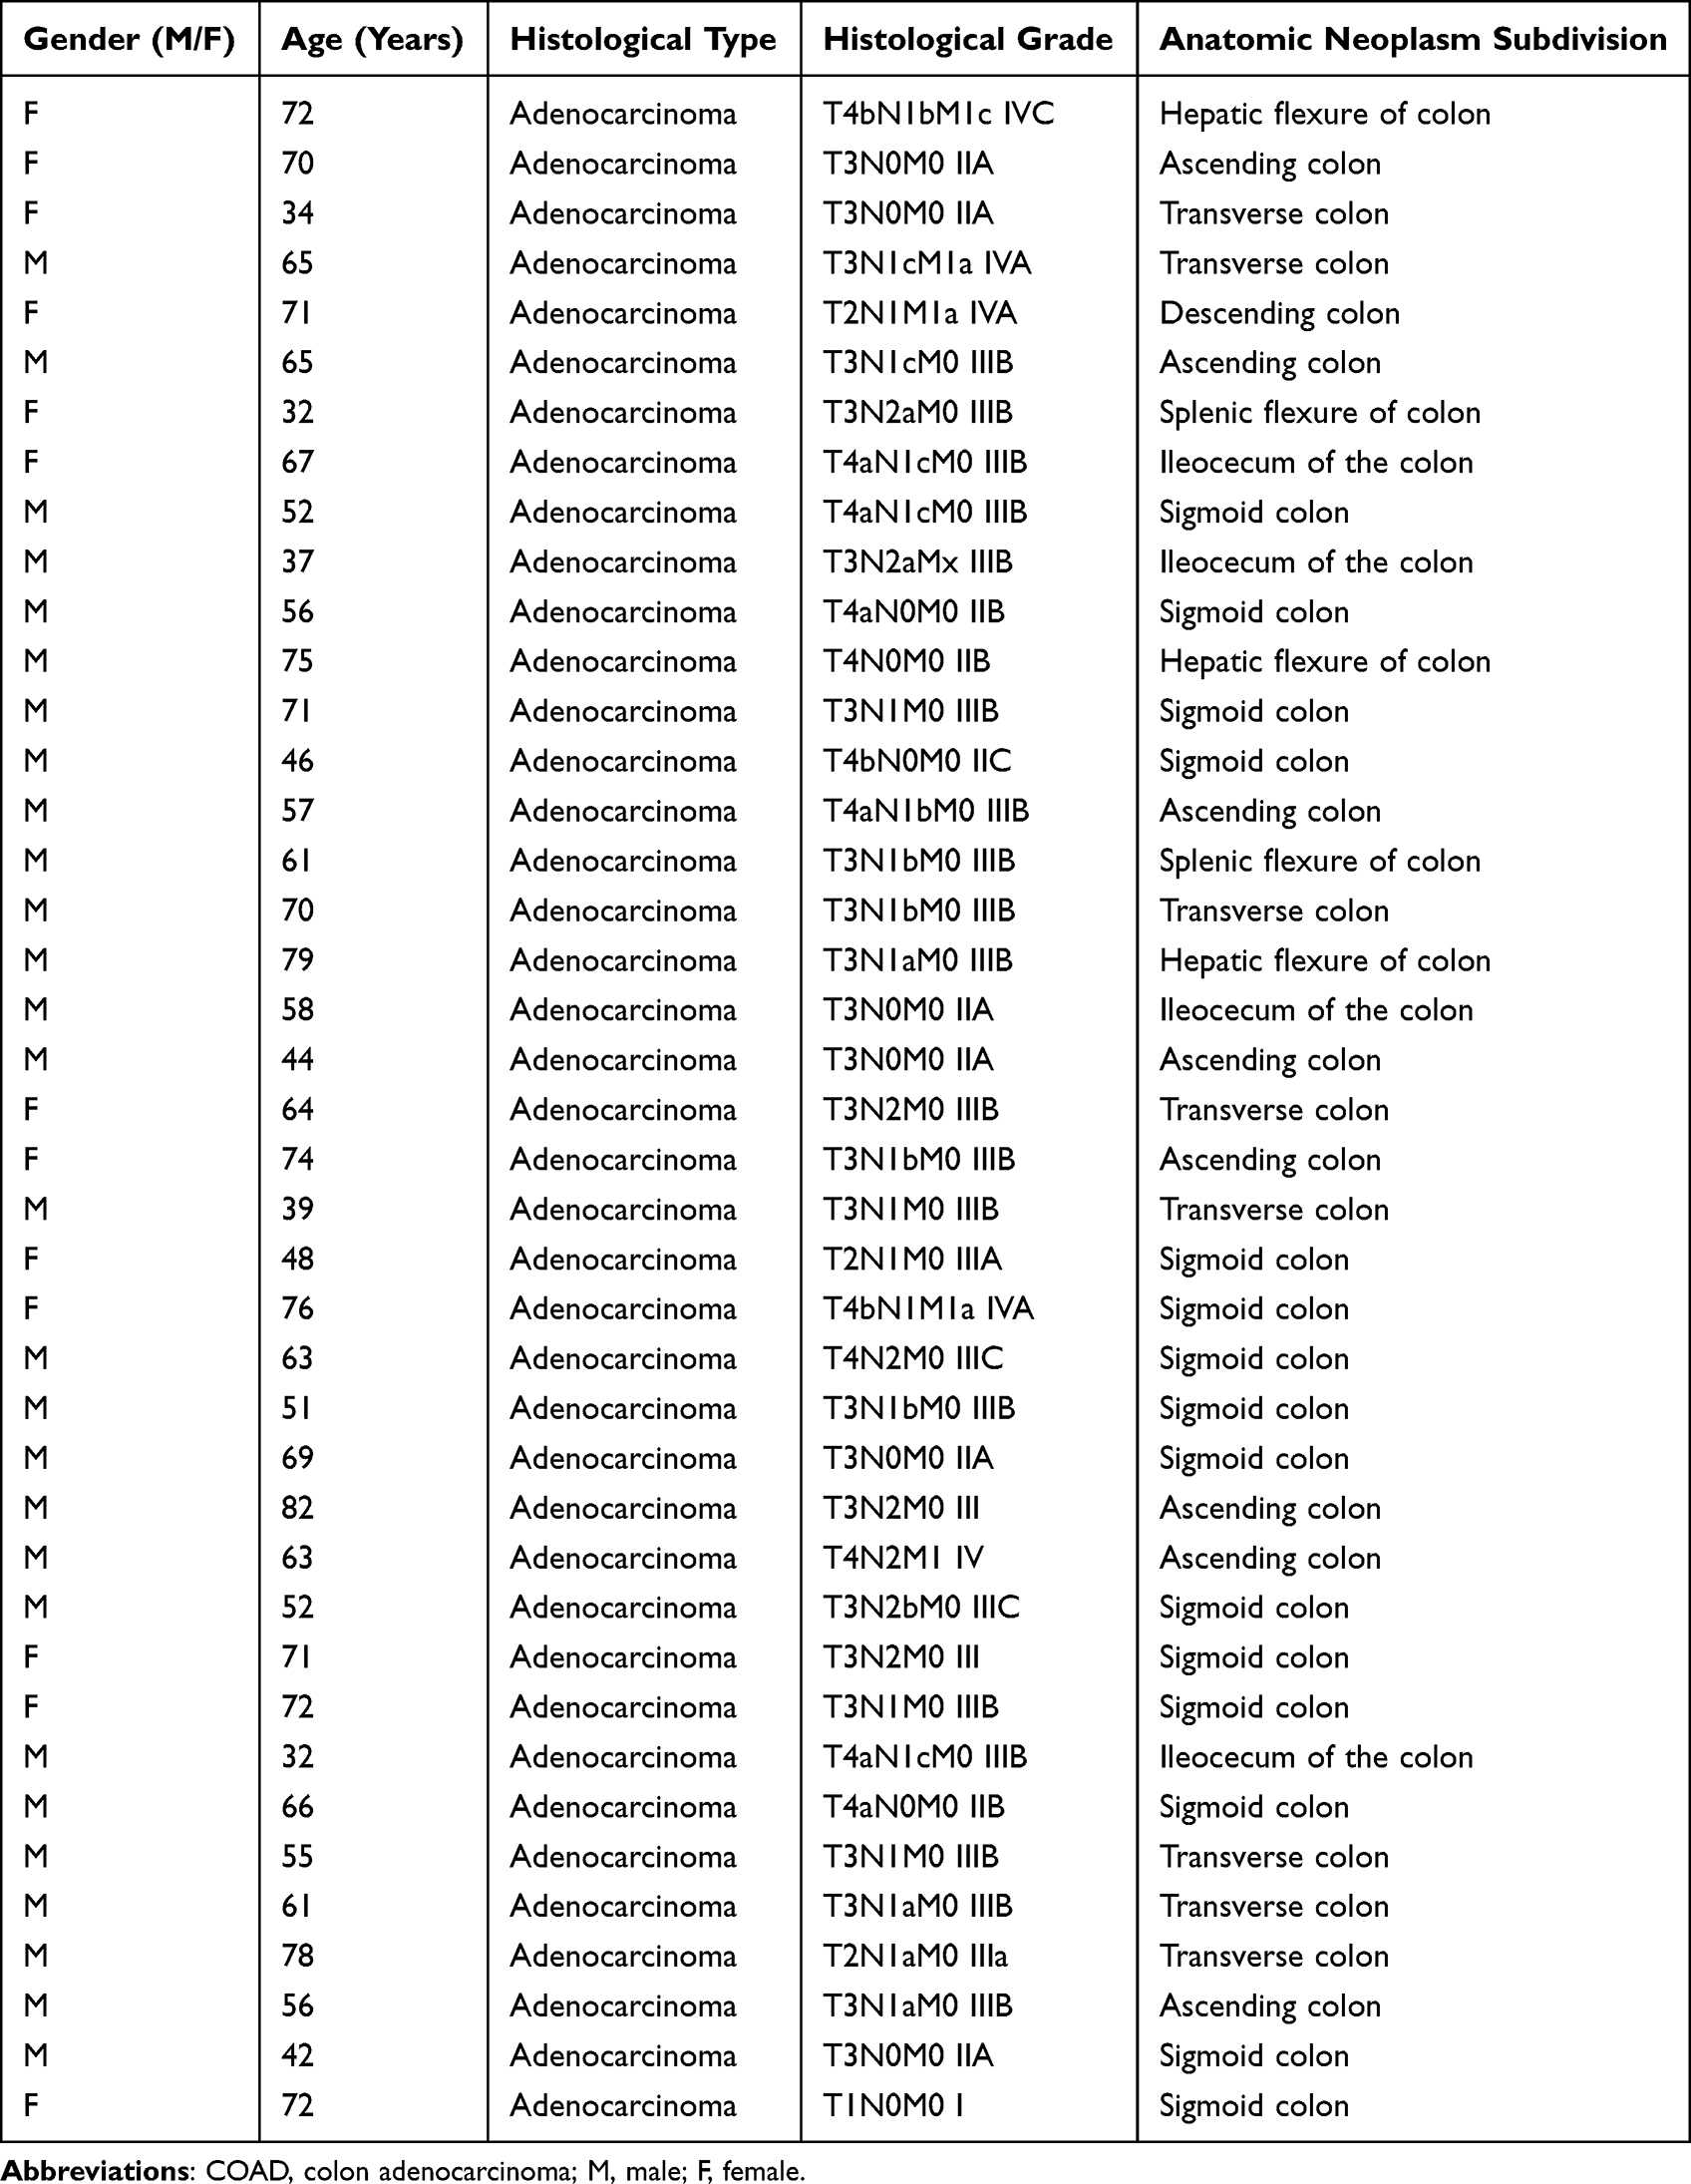 |
Table 1 Clinical Information of 41 Patients with COAD for Real-Time PCR |
MORC2-F: 5-GCGAGCACTTAAAGAACCTAAG-3.
MORC2-R: 5-CATTTTGATCAGTCGGCTACAG-3.
GAPDH-F: 5-GCACCGTCAAGGCTGAGAAC-3.
GAPDH-R: 5-TGG TGAAGACGCCAGTGGA-3.
Identification of DEGs
According to MORC2 median value, 478 COAD patients were stratified into high- and low-MORC2 expression groups. The differentially expressed genes (DEGs) were identified between the two groups by DESeq2 package with a threshold of | log2(Fold Change) | > 1 and adj. P. Val < 0.05. The volcano map showed detailed gene expression.
Functional Enrichment Analysis
The biological functions of DEGs were comprehensively observed by GO and KEGG that enable metabolic pathway integration and visualization. All GO and KEGG pathway enrichment studies were carried out using R package cluster Profiler.
Clinical Association of MORC2 in COAD
First, the association between MORC2 expression and clinical outcomes in COAD patients was analyzed, such as gender, age, weight, race, histological subtype, T stages, M stages, nodal metastasis status, and TP53 mutation status. In addition, receiver operating characteristic (ROC) curve analysis was used to analyze the diagnostic value of MORC2 in COAD patients and estimate the performance of MORC2 as a classifier to distinguish MORC2 patients with different tumor stages and grades via R package pROC.
Prognostic Analysis
The prognostic values of MORC2 in COAD patients were illustrated including overall survival (OS), disease-specific survival (DSS), and progression-free interval (PFI) using Kaplan–Meier survival curves that were accomplished using R packages survival and survminer. Meanwhile, we used the Gene Expression Profiling Interactive Analysis (GEPIA) to analyze disease-specific survival (DFS). Furthermore, PrognoScan, and the UALCAN website were applied to further show the link between MORC2 expression and patient survival. Additionally, to evaluate the individual survival of COAD patients, we combined TNM staging and MORC2 to establish a nomogram survival map using R package “RMS” and “survival”. Moreover, we used nomogram evaluation to further analyze the prognostic value of MORC2 and eventually compared the predictive accuracies of the nomogram and separate prognostic factors using the C-index.
Gene Mutation Analysis
cBioPortal database is a comprehensive web server. We can use it to explore, visualize, and analyze multi-dimensional cancer genomic data. In this research, mutations in the MORC2 gene were validated by cBioPortal database. OncoPrint was constructed in cBioPortal to straightly reflect all kinds of changes in MORC2 gene amplification, missense mutation, deep deletion, etc., in COAD patients.
Analysis of Immune Infiltration Characteristics
We used the ssGSEA method in R package GSVA to examine the levels of 24 common immune cells infiltration. Spearman correlation analysis was adopted to evaluate the relationship between MORC2 and immune checkpoints. Then, we investigated TME scores such as ESTIMATE Score, Immune Score, and Stromal Score in the high- and low-expression groups of MORC2 gene by using ESTIMATE method. Next, TIMER (http://timer.cistrome.org/) was applied to further evaluate the correlation among MORC2, tumor purity, and a number of immunocytes such as B cells, CD4+ T cells, CD8+ T cells, neutrophils, macrophages, and dendritic cells and a map is produced to further illustrate gene expression levels relative to tumor purity.
Statistical Analysis
The statistical analysis was performed using R software: R-3.6.3 and GraphPad Prism 8. We compared MORC2 mRNA expression levels in cancer and cancer-adjacent tissues using the two-sample t-test. Wilcoxon test was used if the normality test was not satisfied between the two groups, otherwise t-test was used. Kaplan–Meier plot with log-rank difference test was used to analyze survival differences. The correlation between molecular expression was determined by Spearman correlation and statistical significance. The diagnostic significance of MORC2 for COAD was evaluated using the ROC curve. P < 0.05 was considered as statistically significant.
Results
MORC2 Differential Expression in Pan-Cancer and COAD
The expression of MORC2 mRNA was explored in various types of cancers based on pan-cancer analysis. We found that the level of MORC2 mRNA was upregulated in most tumor tissues, particularly in lung adenocarcinoma, breast cancer, cervical squamous cell carcinoma, cervical cancer, COAD, and esophageal cancer (Figure 1A). Then, the expression of MORC2 in COAD and normal tissues was compared, illustrating the higher MORC2 expression levels in COAD than normal tissues (P < 0.05) (Figure 1B). Paired samples (carcinoma (41) and adjacent tissue (41)) were also shown to have high expression of MORC2 in COAD compared with paired normal tissues according to paired t-test results (P < 0.05) (Figure 1C). At the same time, we determined the expression of MORC2 in COAD using the UALCAN website, the results indicated that MORC2 was overexpressed in COAD tissues as well (P < 0.05) (Figure 1D). The quantitative real-time PCR results further verified the reliability of our differential analysis at the transcriptional level (Cancer-adjacent vs Cancer, P < 0.001) (Figure 1E). Furthermore, we downloaded the representative images from the Human Protein Atlas database to show that the expression level of MORC2 protein in COAD tissues was higher than normal colon tissues (Figure 1F and G).
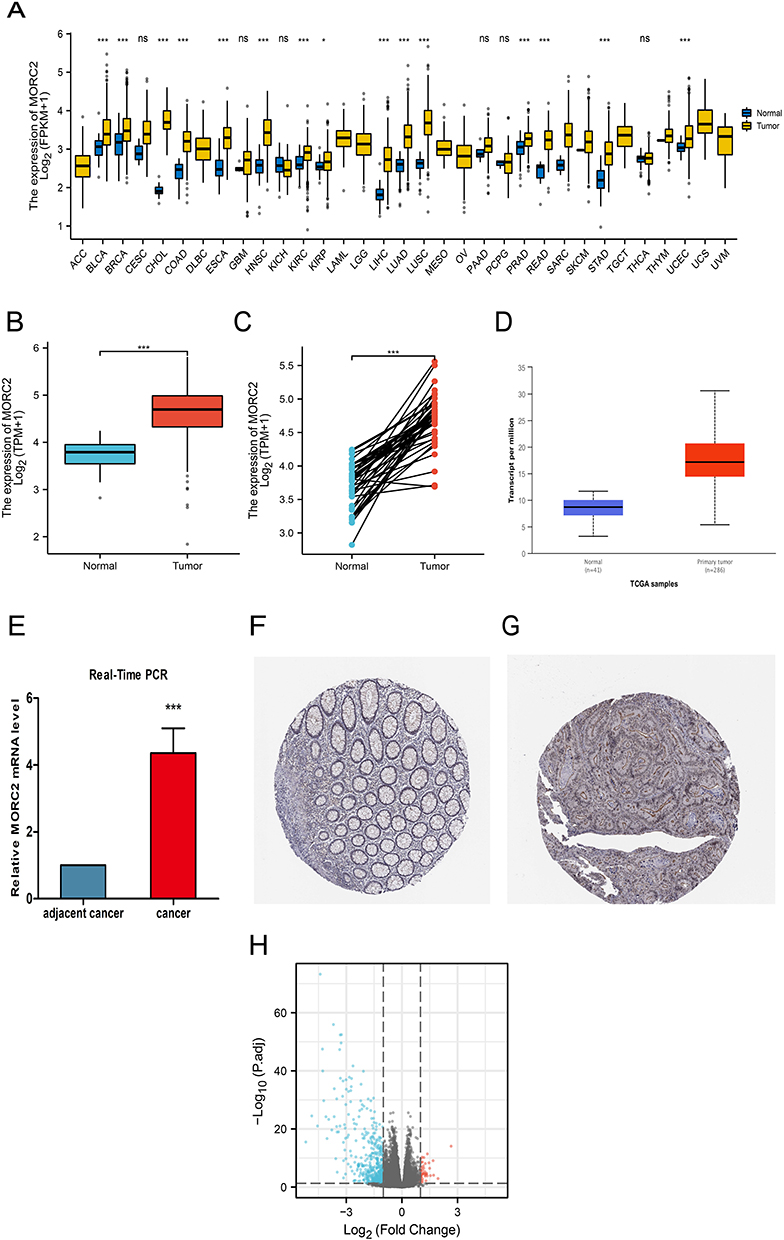 |
Figure 1 MORC2 expression in COAD tissues. (A) The comparison of MORC2 expression between tumor and pericarcinous tissue in different types of cancers based on TCGA database. (B) Expression of MORC2 in COAD were analyzed based on tissue samples present in the TCGA database. (C) Comparing the expression of MORC2 in normal tissue and primary tumor. (D) Expression of MORC2 in COAD were analyzed by using the UALCAN website. (E) Relative mRNA level of MORC2 in cancer and adjacent tissues of COAD. (F and G) Images of immunohistochemical staining showing MORC2 protein expression in colorectal tissue from The Human Protein Atlas. (H) Volcano plots of the DEGs. Blue represents down-regulated DEGs, red represents up-regulated DEGs. ns, P ≥ 0.05; *P < 0.05; ***P < 0.001. Abbreviations: MORC2, MORC family CW-type zinc finger 2; COAD, colon adenocarcinoma; DEGs, differentially expressed genes. |
DEGs Identification and Functional Enrichment Analysis of DEGs
Next, according to MORC2 median value, 478 COAD patients were stratified into high- and low-MORC2 expression groups. DEGs between the two groups were identified. Finally, a total of 519 DEGs were obtained, including 476 down-regulated genes and 43 up-regulated genes. Heatmaps were also used to depict representative DEGs (Figure 1H).
The potential function and pathway of MORC2-associated DEGs in COAD were predicted by performing GO and KEGG enrichment analysis. Key genes were mainly composed or involved in nucleosome assembly, chromatin assembly, nucleosome organization, chromatin assembly or disassembly, DNA packaging, nucleosome, DNA packaging complex, protein-DNA complex, nuclear nucleosome, nuclear chromatin, taste receptor activity, bitter taste receptor activity, nucleosome DNA binding, chromatin DNA binding, and nucleosome binding. The KEGG analysis revealed that the MORC2-associated DEGs were mainly enriched in systemic lupus erythematosus, alcoholism, taste transduction, olfactory transduction, and viral carcinogenesis signaling pathways (Table 2).
 |
Table 2 Details of GO and KEGG Enrichment Analyses |
Correlation Between Clinical Outcomes and MORC2 Expression in Patients with COAD
From the TCGA database, we obtained the clinicopathological characteristics of 478 COAD patients, including age, gender, TNM stages, and pathological stages, as shown in Table 3. The UALCAN database was performed to further analyze the influence of different clinical features on MORC2. Based on the patient’s ages, weights, and histological subtypes, we found that different ages, weights, and histological subtypes did not affect the MORC2 expression in the COAD patients (Figure 2A–C). In terms of gender, we discovered that MORC2 in male patients expressed higher than female patients with COAD (Figure 2D). Additionally, MOCR2 expression in Caucasians seemed to be more upregulated than Asians (Figure 2E). Moreover, logistic regression analysis was also performed to illustrate the association between MORC2 and clinical characteristics. The results demonstrated that MORC2 was closely related to the clinical indicators, including age [odds ratio (OR) = 0.658 (0.455–0.950), P = 0.026], pathologic stages [OR = 1.670 (1.155–2.422), P = 0.007], and N stage (R = 1.519 (1.053–2.197), P = 0.026), but significant difference was not detected in the correlation with gender, BMI, T stages, or M stages (Table 4).
 |
Table 3 Relationship Between MORC2 Expression and Clinicopathological Characteristics in Patients with COAD |
 |
Table 4 MORC2 Expression Correlated with Clinical Pathological Characteristics (Logistic Regression) |
 |
Figure 2 Relationship between MORC2 expression and clinical indicators in patients with COAD; (A) Subgroup analysis of MORC2 expression in COAD based on patient age; (B) Subgroup analysis of MORC2 expression in COAD based on patient weight; (C) Subgroup analysis of MORC2 expression in COAD based on the patient gender; (D) Subgroup analysis of MORC2 expression in COAD based on patient race; (E) Subgroup analysis of MORC2 expression in COAD based on individual cancer stages; (F) Subgroup analysis of MORC2 expression in COAD based on histological subtypes; (G) Subgroup analysis of MORC2 expression in COAD based on nodal metastasis status; (H) Subgroup analysis of MORC2 expression in COAD based on TP53 mutation status. Abbreviations: MORC2, MORC family CW-type zinc finger 2; COAD, colon adenocarcinoma. |
The statistical analysis showed significant differences between the normal group and the group of 1–4 stages on the basis of the individual cancer stages (Figure 2F). What’s more, the MORC2 expression in different nodal metastasis statuses was analyzed and the N0 status was lower than the status of N1-N2 (Figure 2G). The expression of MORC2 in COAD patients with a TP53 mutation was at a higher level (Figure 2H). Furthermore, the different expressions of MORC2 under different clinical indicators are shown in Table 5. These findings indicated that MORC2 expression was greatly associated with clinical characteristics.
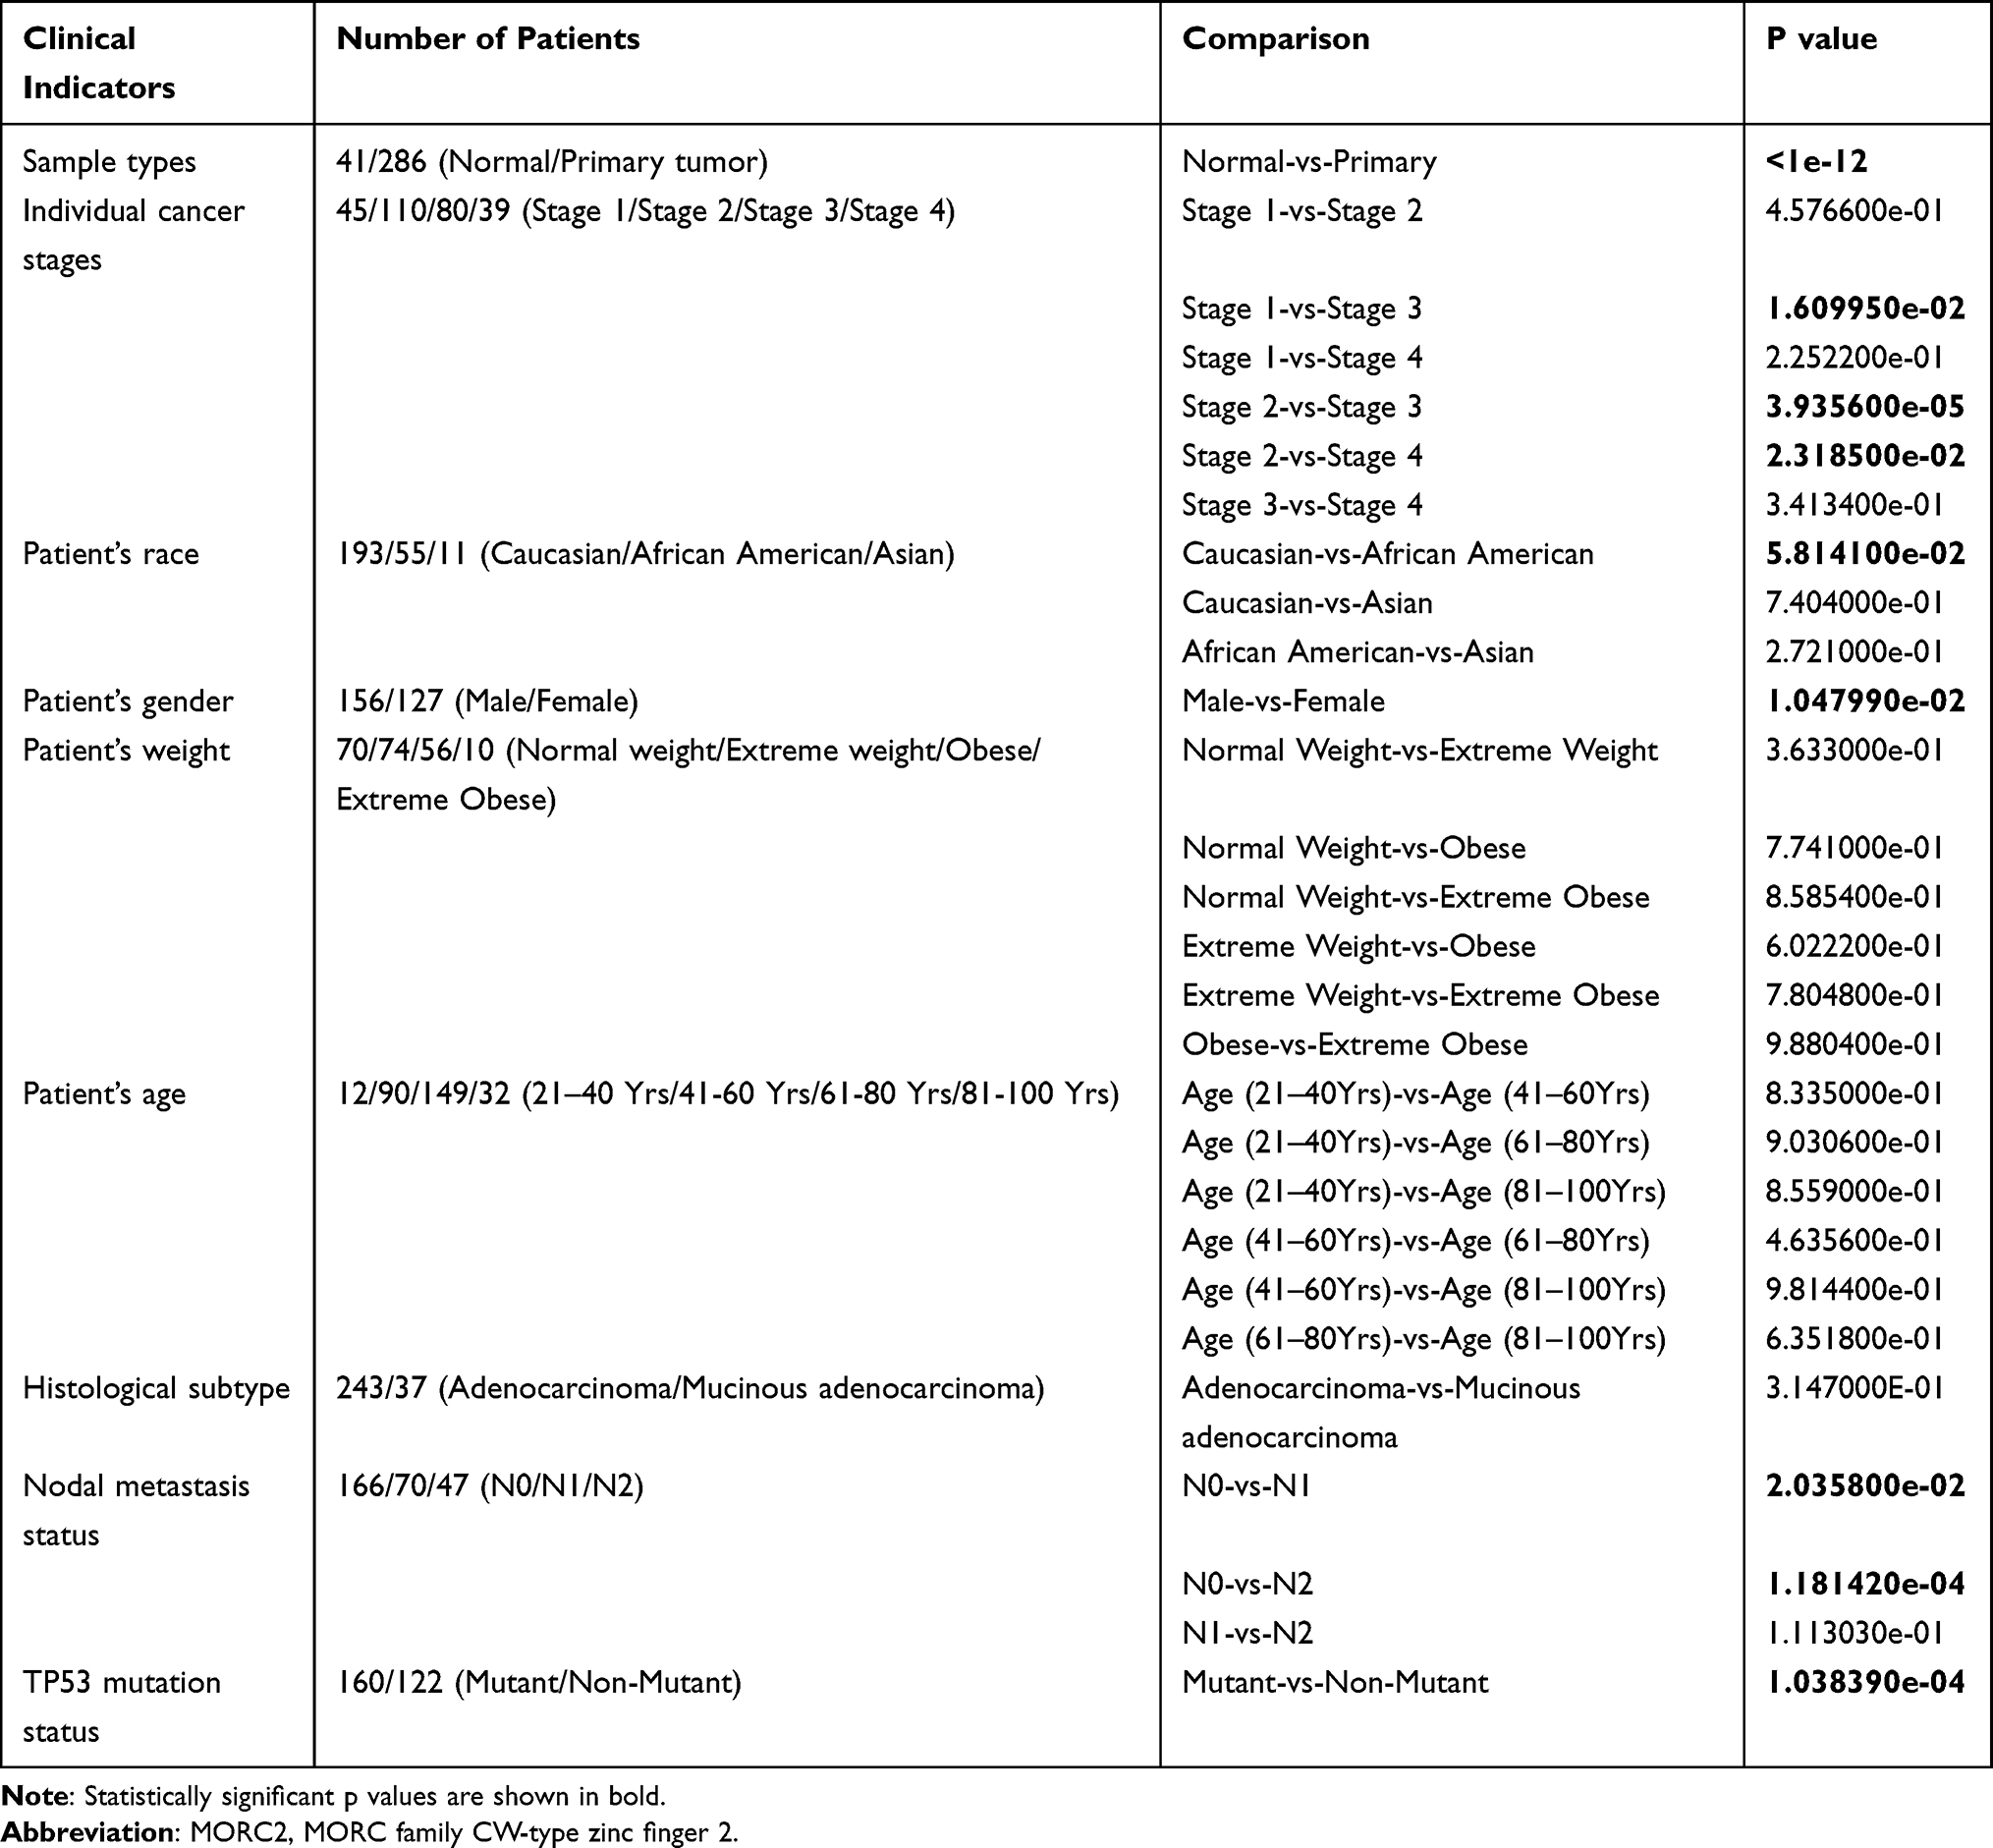 |
Table 5 MORC2 Expression Based on Different Clinical Indicators |
Predictive Value of MORC2 for COAD Diagnosis and Prognosis
The prediction of MORC2 on clinical outcomes was validated by K-M analyses, and the results showed that the high MORC2 group was worse than the low MORC2 group in OS [hazard ratio (HR): 1.59, P = 0.021)], DSS (HR: 1.76, P = 0.028), and PFI (HR: 1.63, P = 0.007) (Figure 3A–C). Next, we applied different databases to explore the association between MORC2 expression and prognosis in COAD patients. The low MORC2 expression group was significantly related with longer OS by using GEPIA database (n = 135, HR = 1.7, P = 0.035) (Figure 3D). However, there was no statistical difference in DFS (n = 135, HR = 1.6, p = 0.053) (Figure 3E). Using UNLCAN website, we detected that the effect of MORC2 expression level on COAD patient survival in high MORC2 was more significant than low MORC2 (p = 0.012) (Figure 3F). Nevertheless, the correlation between MORC2 expression and prognosis was further illustrated using the PrognoScan database. As expected, the high expression of MORC2 was associated with shorter OS (n = 177, HR = 2.18, COX P = 0.033631) and DSS (n = 49, HR = 11.27, COX P = 0.021714) for patients with COAD (Figure 3G and H). To further explore the predictive value of MORC2 on clinical outcomes, a multivariate Cox regression analysis was adopted. According to the result shown in Table 6, in multivariate Cox regression, MORC2 expression was an independent risk factor for OS (HR = 1.591, P = 0.024). These results suggested that MORC2 expression was linked to the prognosis of patients with COAD, indicating a promising prognostic significance of MORC2, and these findings have significant research implications, and potentially therapeutic implications.
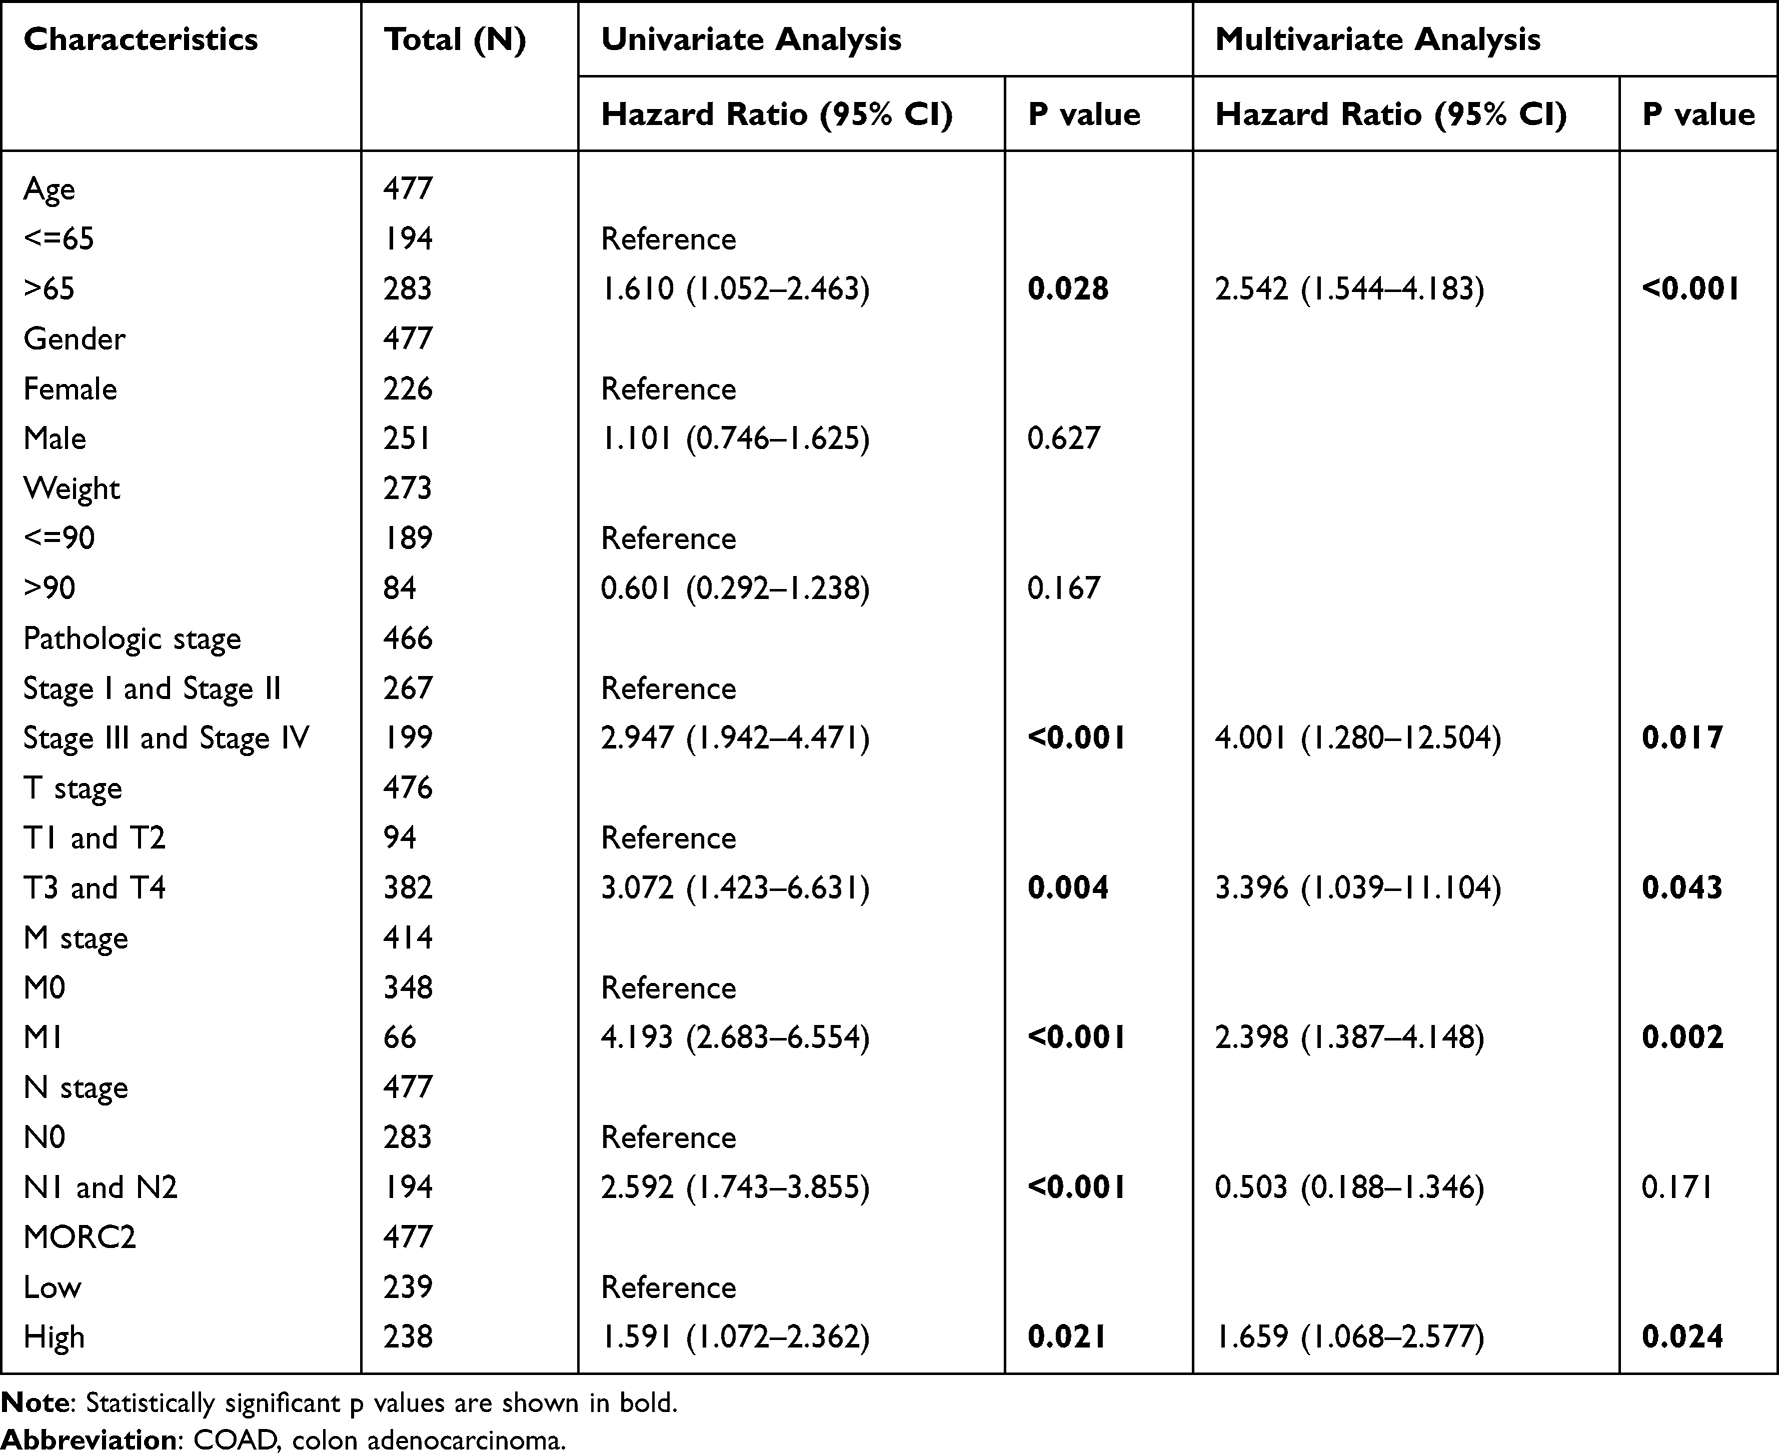 |
Table 6 Univariate and Multivariate Regression Analysis of Overall Survival (OS)-Related Factors in Patients with COAD |
 |
Figure 3 Predictive value of MORC2 expression for diagnosis and clinical outcomes in COAD patients; (A–C) OS, PFI, and DSS of patients with COAD based on MORC2 expression determined using R packages survival and survminer; (D and E) OS and DFS of patients with COAD based on MORC2 expression determined using GEPIA; (F) Effect of MORC2 expression level on COAD patient survival using UALCAN database; (G and H) DFS and OS of patients with COAD based on MORC2 expression determined using the PrognoScan database; (I) ROC curve showed MORC2 was an accurate ability to identify tumor from normal tissue. The AUC was 0.939. Abbreviations: MORC2, MORC family CW-type zinc finger 2; COAD, colon adenocarcinoma; OS, overall survival; PFI, progression free interval; DSS, disease-specific survival; DFS, disease-free survival; ROC, receiver operating characteristic; AUC, area under the curve. |
Biomarkers for tumor progression are still lacking in COAD patients. We wondered whether MORC2 could accurately diagnose patients with higher grades and stages COAD. The ROC curve was applied to determine the MORC2 value on discriminating COAD diagnosis, and MORC2 manifested great sensitivity and specificity for COAD diagnosis according to the area under the curve (AUC = 0.939) (Figure 3I). Results of MORC2 as a classifier for distinguishing normal individuals and patients with different stages or grades suggested high prediction performances of MORC2 for patients in each stage or grade (Figures 4A–L). The above findings indicated the potential of MORC2 to predict the progression of COAD at both early and late stages.
 |
Figure 4 Analysis of the diagnostic value of MORC2 for COAD patients with different stages or grades. (A–D) ROC curve analysis of the diagnostic value of MORC2 in patients with COAD at T stage. (E–H) ROC curve analysis of the diagnostic value of MORC2 in patients with COAD at N and M stages. (I–L) ROC curve analysis of the diagnostic value of MORC2 in patients with COAD at TNM stage. Abbreviations: MORC2, MORC family CW-type zinc finger 2; COAD, colon adenocarcinoma; ROC, receiver operating characteristic; AUC, area under the curve; TPR, true-positive rate; FPR, false-positive rate. |
To evaluate the validity of the nomogram, we created a calibration curve and calculated the C-index using prognostic parameters that are routinely used in clinics. Clinical outcomes such as T stage, M stage, N stage, and MORC2 were included in the nomogram (C-index = 0.716) (Figure 5A). The calibration curves demonstrated the optimal prediction for clinical outcomes of 1, 3, and 5 years (Figure 5B–D). According to the above results, we indicated that high MORC2 expression is related to adverse prognosis in COAD patients and it tends to be a molecular worthy of investigating.
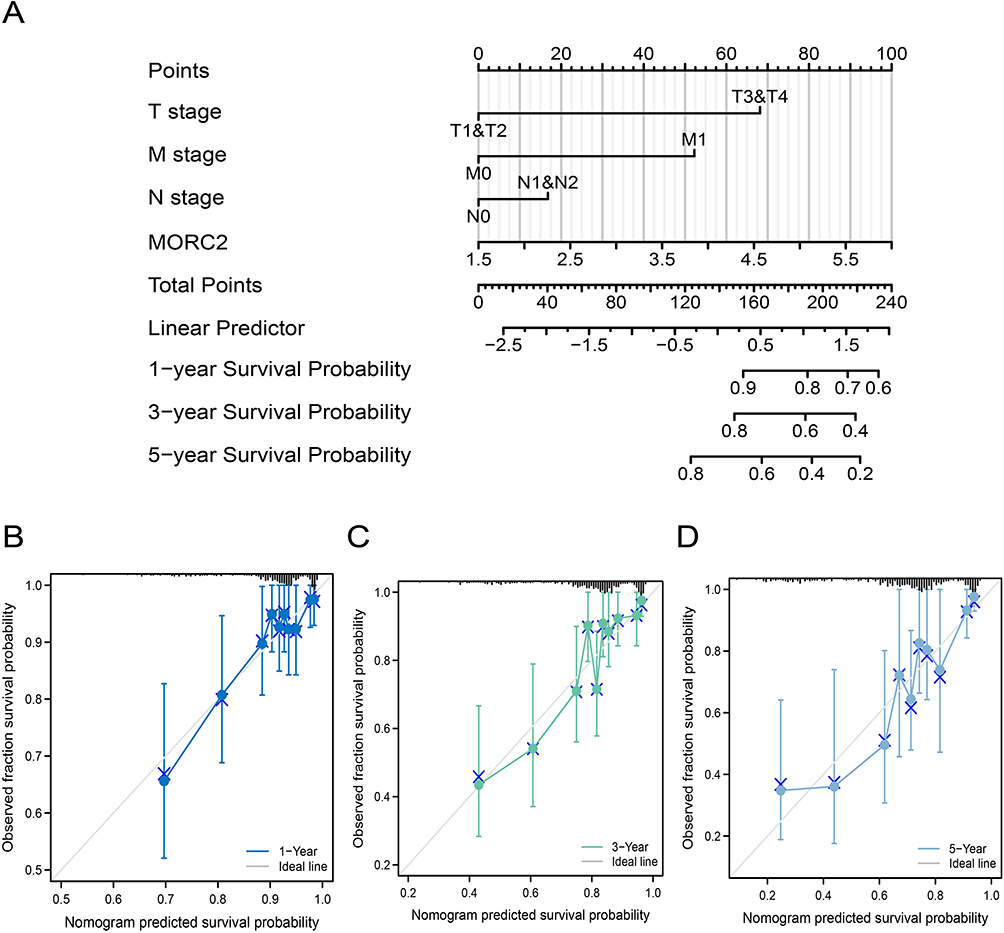 |
Figure 5 Construction and validation of nomograms based on MORC2 expression. (A) Shown are the nomograms constructed to establish MORC2 expression-based risk scoring models for 1-, 3-, and 5-year survival probability. (B–D) Calibration plots validating the efficiency of nomograms for 1-, 3-, and 5-year survival probability. Abbreviations: MORC2, MORC family CW-type zinc finger 2. |
Analysis of Alterations in MORC2 Gene
In this study, the cBioPortal database was applied to investigate the genetic alteration status in MORC2 with COAD patients. Alteration frequency of MORC2 in different COAD studies was validated, and amplification accounted for the majority of alteration types (Figure 6A). The proportions of amplification and deep deletion types were revealed (Figure 6B). The genetic alteration included amplification, deep deletion, truncating mutation, splice mutation, and missense mutation, and the percentage of mutation in MORC2 was 2.5% in COAD, and missense mutation was more common (Figure 6C). The details of all mutations in COAD are summarized. We also identified several mutation-prone loci of MORC2 among COAD patients, and the types of mutations were amplification and missense mutations (Figure 6D).
 |
Figure 6 Analysis of MORC2 genetic alterations using the cBioPortal database. (A) Alteration frequency of MORC2 in different COAD studies. (B) Fraction genome altered of MORC2 based on 480 COAD samples. (C) The percentage of alteration in MORC2 in COAD. (D) Mutation diagram providing information on the mutation sites, mutation types, and the number of cases, and the results were colored with respect to the corresponding mutation types. Abbreviations: MORC2, MORC family CW-type zinc finger 2; COAD, colon adenocarcinoma. |
Relationship Between MORC2 and Immune Cell Infiltration in COAD
The relationship between MORC2 and immune cells was analyzed in COAD patients from TCGA cohort by ssGSEA using R package GSVA, and the results showed that MORC2 was significantly related to a wide variety of immune cell types including DC, NK CD56dim cells, NK cells, TCD8+ T cells, T cells, Tcm, TFH, Th17 cells. The correlation between MORC2 expression and various immune cells including NK CD56dim cells, NK cells, Tcm, and TFH was positive, on the contrary, a close negative correlation between immune cells like T cells and Th17 cells and MORC2 expression was presented (Figure 7A). In order to further explore the effect of MORC2 on immune invasion and tumor purity, the score of immune-infiltrating cells was assessed using the ESTIMATE algorithm. The results from ESTIMATE method suggested that increased MORC2 expression was associated with poorer immunological score; however, there were no statistically significant differences between MORC2 expression and stromal score or ESTIMATE score (Figure 7B–D).
 |
Figure 7 Correlation between expression of MORC2 and immune infiltration; (A) Correlation between expression of MORC2 and immune cells infiltration; (B) The association of MORC2 expression with ImmuneScore; (C) The association of MORC2 expression with ESTIMATEScore; (D) The association of MORC2 expression with StromalScore. ns, P ≥ 0.05; ***P < 0.001. Abbreviations: MORC2, MORC family CW-type zinc finger 2; COAD, colon adenocarcinoma. |
What’s more, the possible association between MORC2 expression and levels of immune cell infiltration in COAD was further explored by using the TIMER database. The results from TIMER indicate a significant association between MORC2 and B cells (partial.cor = −0.053, P=2.89e-01), which was negatively related. And correlations with tumor purity (cor = 0.037, P = 4.57e-01) and the levels of CD8+ T cells (partial.cor = 0.039, P = 4.34e-0.039), CD4+ T cells (partial.cor = 0.41, P = 9.78e-18), macrophages (partial.cor = 022, P = 8.17e-06), neutrophils (partial.cor = 0.146, P = 3.36e-03), and dendritic cells (partial.cor = 0.152, P = 2.30e-03) were positively related (Figure 8A–G). Furthermore, we used the TIMER database to investigate the relationship between immune cells infiltration and survival time in COAD patients. Based on the Kaplan–Meier plots generated from TIMER, we observed no significant correlations between the cumulative survival of COAD and various immune cells, including B cells, CD8+ T cells, CD4+ T cells, macrophages, neutrophils, and dendritic cells (P > 0.05) except MORC2 (P < 0.05) (Figure 8H). These above results suggest that MORC2 plays a key role in immune invasion of colorectal adenocarcinoma.
 |
Figure 8 Correlation analysis between the MORC2 expression level and immune cell infiltration in COAD using the TIMER database; (A–G) The association of MORC2 expression with tumor purity and six types of immune cell infiltration level; (H) Relationship between immune cell abundance and cumulative survival of patients with COAD. Abbreviations: MORC2, MORC family CW-type zinc finger 2; COAD, colon adenocarcinoma; TIMER database, Tumor Immune Estimation Resource database. |
Discussion
CRC is one of the most common cancers in the world, affecting more than 1 million people worldwide each year.15 More than 90% of CRC are adenocarcinomas, which are malignant tumors that originate in the glandular epithelial cells of the colon and rectum.5 Many studies have shown that the 5-year survival rate of patients with early CRC was significantly higher than that of patients with advanced CRC; however, CRC is often diagnosed late in the clinic.16 Thus, early diagnosis is very important for survival and prognosis of patients with colorectal cancer. Currently, traditional colonoscopy is still the most effective way to diagnose CRC, but it has a high rate of patient noncompliance. As a result, it is critical to develop more effective methods for early detection of this disease, as well as biomarkers to diagnose CRC, assess disease severity, and predict course.17 Biomarkers are molecular patterns that can be used to detect cancer early and tailor treatment for CRC patients.18 Despite numerous new biomarkers for CRC over the past decades, biomarkers that can guide early diagnosis, targeted therapy, prognosis, and monitoring of patients with CRC are still lacking. As such, sensitive and specific methods for early detection of CRC are urgently needed to improve the outcomes of patients with CRC.19,20 Immunotherapy with immunoregulatory antibodies has revolutionized the treatment of various solid tumors in recent years, and immune biomarkers that could predict tumor growth have been proposed,21 calling for biomarkers that could serve as a drug target for immunotherapy or shed light on immune landscape of COAD.
Human MORC2 is a member of MORC family that was recently identified as a chromatin modifier. Inhibition of MORC2 gene transcription enhances chromatin remodeling and regulates adipogenesis in DNA damage responses, according to recent research.9,22,23 Furthermore, the role of MORC2 in tumor progression and its potential as a biomarker have been investigated. For example, MORC2 has been believed to be dormant oncogenes, whose overexpression is related to the more malignant pathological type and shorter OS in many cancers such as breast cancer and liver cancer.10,24 MORC protein activity is increased by aberrant expression and mutation, leading to genomic instability and target gene dysregulation, and eventually cancer.25–27 MORC2 promotes malignant phenotypes of cancer cells by promoting abnormal chromatin dynamics, enhancing DNA damage repair, and regenerating fat, all of which are critical events in cancer cells.28 Notably, MORC2 has been implicated in breast cancer prognostic models.29 Its clinical diagnostic and prognostic utility in CRC, however, has never been demonstrated. MORC2 was discovered to have significant diagnostic and prognostic values for CRC in this investigation. This study was the first systematic investigation of diagnostic and prognostic value, clinical significance, mutation, and immune cell infiltration of MORC2 in COAD.
Firstly, we investigated MORC2 expression and the link between abnormal expression and the prognosis of patients. We demonstrated that the expression in tumor tissues was significantly higher than in normal tissues, especially in breast cancer, cervical cancer, esophageal cancer, and COAD. This result is consistent with previous studies. Besides, high expression of MORC2 was found in COAD tissues, which was related to shorter OS, DSS, and PFI. Additionally, we revealed that increased MORC2 expression was associated with advanced clinicopathological features (TNM stage and clinical stage), survival time, and poor prognosis. MORC2 expression was found to be an independent risk factor for OS in COAD patients. These findings suggested that MORC2 expression may play a key role in COAD carcinogenesis, which are supported by several studies. For example, high expression of MORC2 was closely linked to poor differentiation, deep invasion, distant metastasis, clinical stage, and low 5-year survival rate of gastric cancer, indicating that MORC2 may be involved in the disease’s progression and prognosis.30 MORC2 expression levels were more elevated in high-grade cancer tissues and associated with poor OS and unfavorable pathological conditions in breast cancer and non-small cell lung cancer.31 Increasing evidence suggests that MORC2 is an oncogene that interacts with histone deacetylase 4 (HDAC4), histone deacetylase 1 (HDAC1), and EZH2 by inhibiting transcription of carbonic anhydrase IX (CAIX), p21Waf1/Cip1, and ArgBP2 genes, respectively, and participates in gastric cell proliferation and tumorigenesis.12,22,32 What’s more, MORC2 was discovered to induce epithelial-to-mesenchymal transition through modulating the AKT signaling pathway, resulting in cholangiocarcinoma proliferation and metastasis.33 MORC2 overexpression can drive lung cancer growth by stimulating the recruitment of TAMs in addition to angiogenesis.34 MORC2 was found to interact with methyltransferase DNMT3A to promote DNA hypermethylation of NF2 and KIBRA promoters, thereby driving tumorigenesis.35 More importantly, the regulatory mechanism by which MORC2 inhibits NDRG1 has been confirmed, suggesting that MORC2 could be a potential CRC treatment target.36 As such, MORC2 plays an important role in tumor progression, and may be a common prognostic biomarker for various malignancies, according to previous studies and our research.
Furthermore, many studies show that the earlier the tumor is detected, the higher the survival rate of CRC patients. Thus, the diagnosis method of early disease is very necessary.37–39 Interestingly, the value of MORC2 on discriminating COAD diagnosis with different stages or grades was high, according to the ROC analysis, indicating the potential of MORC2 to predict the progression of COAD at both early and late stages in this investigation. To evaluate the validity of the nomogram, we created a calibration curve and calculated the C-index using prognostic parameters that are routinely used in clinics. The calibration curves demonstrated the optimal prediction for clinical outcomes of 1, 3, and 5 years. In conclusion, our findings suggested that MORC2 might be employed as a biomarker for COAD diagnostic and prognostic values and could be used in COAD early screening.
We then studied genetic mutations in MORC2 to further understand the immunological properties of MORC2. Consistent with previous research,40 missense mutation was more common. We detected that about 2.5% of COAD patients had genetic alterations in MORC2 including amplification, deep deletion, truncating mutation, splice mutation, and missense mutation. It is reported that MORC2 mutations have been associated with Charcot–Marie–Tooth disease,26,41 neurodevelopmental problem,42 and cancer,27 highlighting the functional importance of MORC2 in human disorders. Liu et al reported that MORC2 is O-GlcNAcylated at threonine 556 by O-GlcNAc transferase (OGT). MORC2-mediated breast cancer cell migration and invasion in vitro and lung colonization in vivo are inhibited when this region is mutated or OGT is pharmacologically inhibited.43 However, the mechanism of MORC2 mutation on the progression of COAD needs to be further studied.
As we all known, TP53 mutations are very common among CRC mutations, TP53 plays an indispensable role in some important cell functions, such as cell cycle control, apoptosis, DNA repair, and so on, and is particularly important in maintaining the integrity of the genome.44 Studies have shown that TP53 mutations or loss of function is most common during the transition from adenoma to cancer, and the incidence of changes in the gene increases as the disease progresses.45 Many studies have linked somatic TP53 mutations or aberrant protein expression to poor prognosis or failure to respond to therapy.46 The progression of CRC is thought to be triggered by mutations in the APC, K-Ras, and p53 genes. Furthermore, p53 mutations are assumed to be important in the adenoma-carcinoma transition during the tumorous pathogenic process.47 Patients with mutant p53 appear to be more chemo-resistant and had a worse prognosis than patients with wild-type p53,48 while p53 mutations were more common in advanced-stage cancers and were adversely associated with survival.49 In our paper, we also found that the expression of MORC2 in COAD patients with a TP53 mutation was at a higher level and COAD patients with high TP53 mutations had a worse outcome, in agreement with previous investigations. The above revealed the indirect relationship between highly expressed MORC2 and TP53 mutation on the prognosis and survival of CRC patients, but the mechanism between the two needs to be further studied.
In order to explore the function of MORC2 in COAD, GO term and KEGG pathway analysis was used in this study. DEGs of MORC2 were largely involved in nucleosome assembly, DNA packaging, nucleosome, DNA packaging complex, taste receptor activity, bitter taste receptor activity, chromatin DNA binding, etc. And the signaling pathways were mainly enriched in systemic lupus erythematosus, alcoholism, taste transduction, olfactory transduction, and viral carcinogenesis. Further studies could help verify which processes and pathways of MORC2 functions through in CRC in vivo.
Equally important, using the ssGSEA database, our research discovered a link between MORC2 expression and COAD immune infiltration levels. The findings revealed a moderate to strong positive relationship between MORC2 expression and immune infiltrates, specifically NK cells, TFH cells, and NK CD56dim cells, and a negative relationship between MORC2 expression and immune cell infiltration, Th17 cells, and dendritic cells (DCs). Moreover, the results from ESTIMATE algorithm indicated higher MORC2 expression was associated with lower immune score. The tumor microenvironment (TME) is a hot issue that has the potential to influence tumor growth and recurrence. TME immune cells have been found to exhibit tumor-promoting or tumor-suppressing properties. They are thought to be a crucial determinant of both clinical outcome and therapeutic response.50,51 Researchers have found that T cell density decreased as the tumor progressed, whereas B cell and TFH cell density increased as the invasive CRC progressed.52 To put these findings into practice, the Immunoscore scoring system was created to define a tumor’s immune fitness so that patients could be predicted and stratified for optimal immunotherapy. And the fact that shorter survival is associated with a lower immunoscore has been illustrated.53 These findings demonstrated that MORC2 plays a major role in COAD immunological invasion, implying that MORC2 may reflect immune state in addition to disease prognosis. This research could provide thorough immunization data to aid in the development of novel immunotherapies.
However, one of the study’s limitations was that it only comprised one dataset, which was not confirmed in our own clinical samples. To gain a better understanding of MORC2’s direct impact on COAD, more experimental validations are needed to unravel the biological activities of these anticipated molecular processes in COAD. In addition, the predictive significance of MORC2 in COAD needs to be confirmed.
Conclusions
The data suggested that MORC2 could be a new predictive biomarker and immunotherapy target for COAD patients. MORC2 enhances tumor development and metastasis in COAD, although the exact mechanism of action remains unclear.
Data Sharing Statement
All data generated or analyzed during this study are included in this article.
Ethics Approval
All procedures performed in studies involving human participants were in accordance with the ethical standards of the institutional and/or national research committee and with the 1964 Helsinki declaration and its later amendments or comparable ethical standards. Our study was approved by the Ethics Committee of the First Affiliated Hospital of Guangxi Medical University (NO.2022-KY-E-(228)).
Acknowledgments
We are very grateful for TCGA and Xiantao database.
Author Contributions
All authors made a significant contribution to the work reported, whether that is in the conception, study design, execution, acquisition of data, analysis and interpretation, or in all these areas. All authors took part in drafting, revising, or critically reviewing the article and gave final approval of the version to be published. All authors have agreed on the journal to which the article has been submitted and agree to be accountable for all aspects of the work.
Funding
This study was supported by National Natural Science Foundation of China (No. 81660093).
Disclosure
The authors declare that they have no conflict of interest.
References
1. Xi Y, Xu P. Global colorectal cancer burden in 2020 and projections to 2040. Transl Oncol. 2021;14(10):101174. doi:10.1016/j.tranon.2021.101174
2. Villéger R, Lopès A, Veziant J, et al. Microbial markers in colorectal cancer detection and/or prognosis. World J Gastroenterol. 2018;24(22):2327–2347. doi:10.3748/wjg.v24.i22
3. Buccafusca G, Proserpio I, Tralongo AC, Rametta Giuliano S, Tralongo P. Early colorectal cancer: diagnosis, treatment and survivorship care. Crit Rev Oncol Hematol. 2019;136:20–30. doi:10.1016/j.critrevonc.2019.01.023
4. Mármol I, Sánchez-de-Diego C, Pradilla Dieste A, Cerrada E, Rodriguez Yoldi M. Colorectal Carcinoma: a General Overview and Future Perspectives in Colorectal Cancer. Int J Mol Sci. 2017;18(1):567.
5. Keum N, Giovannucci E. Global burden of colorectal cancer: emerging trends, risk factors and prevention strategies. Nat Rev Gastroenterol Hepatol. 2019;16(12):713–732. doi:10.1038/s41575-019-0189-8
6. Franke AJ, Skelton WP, Starr JS, et al. Immunotherapy for Colorectal Cancer: a Review of Current and Novel Therapeutic Approaches. J Natl Cancer Inst. 2019;111(11):1131–1141. doi:10.1093/jnci/djz093
7. Li DQ, Nair SS, Kumar R. The MORC family: new epigenetic regulators of transcription and DNA damage response. Epigenetics. 2013;8(7):685–693. doi:10.4161/epi.24976
8. Manning BD, Cantley LC. Rheb fills a GAP between TSC and TOR. Trends Biochem Sci. 2003;28(11):573–576. doi:10.1016/j.tibs.2003.09.003
9. Li DQ, Nair SS, Ohshiro K, et al. MORC2 signaling integrates phosphorylation-dependent, ATPase-coupled chromatin remodeling during the DNA damage response. Cell Rep. 2012;2(6):1657–1669. doi:10.1016/j.celrep.2012.11.018
10. Ding Q-S, Zhang L, Wang B-C, et al. Aberrant high expression level of MORC2 is a common character in multiple cancers. Hum Pathol. 2018;76:58–67. doi:10.1016/j.humpath.2018.03.011
11. Wang G, Song Y, Liu T, et al. PAK1-mediated MORC2 phosphorylation promotes gastric tumorigenesis. Oncotarget. 2015;6(12):9877–9886. doi:10.18632/oncotarget.3185
12. Zhang Q, Song Y, Chen W, et al. By recruiting HDAC1, MORC2 suppresses p21 Waf1/Cip1 in gastric cancer. Oncotarget. 2015;6(18):16461–16470. doi:10.18632/oncotarget.3889
13. Tuupanen S, Hanninen UA, Kondelin J, et al. Identification of 33 candidate oncogenes by screening for base-specific mutations. Br J Cancer. 2014;111(8):1657–1662. doi:10.1038/bjc.2014.429
14. Chen LH, Kuo WH, Tsai MH, et al. Identification of prognostic genes for recurrent risk prediction in triple negative breast cancer patients in Taiwan. PLoS One. 2011;6(11):e28222. doi:10.1371/journal.pone.0028222
15. Lukaszewicz-Zajac M, Mroczko B. Circulating Biomarkers of Colorectal Cancer (CRC)-Their Utility in Diagnosis and Prognosis. J Clin Med. 2021;10(11):567.
16. Han YD, Oh TJ, Chung TH, et al. Early detection of colorectal cancer based on presence of methylated syndecan-2 (SDC2) in stool DNA. Clin Epigenetics. 2019;11(1):51. doi:10.1186/s13148-019-0642-0
17. Zhang A, Sun H, Yan G, et al. Metabolomics in diagnosis and biomarker discovery of colorectal cancer. Cancer Lett. 2014;345(1):17–20. doi:10.1016/j.canlet.2013.11.011
18. Pellino G, Gallo G, Pallante P, et al. Noninvasive Biomarkers of Colorectal Cancer: role in Diagnosis and Personalised Treatment Perspectives. Gastroenterol Res Pract. 2018;2018:2397863. doi:10.1155/2018/2397863
19. Marcuello M, Vymetalkova V, Neves RPL, et al. Circulating biomarkers for early detection and clinical management of colorectal cancer. Mol Aspects Med. 2019;69:107–122. doi:10.1016/j.mam.2019.06.002
20. Ogunwobi OO, Mahmood F, Akingboye A. Biomarkers in Colorectal Cancer: current Research and Future Prospects. Int J Mol Sci. 2020;21(15). doi:10.3390/ijms21155311
21. Jin K, Ren C, Liu Y, Lan H, Wang Z. An update on colorectal cancer microenvironment, epigenetic and immunotherapy. Int Immunopharmacol. 2020;89(Pt A):107041. doi:10.1016/j.intimp.2020.107041
22. Shao Y, Li Y, Zhang J, et al. Involvement of histone deacetylation in MORC2-mediated down-regulation of carbonic anhydrase IX. Nucleic Acids Res. 2010;38(9):2813–2824. doi:10.1093/nar/gkq006
23. Wang GL, Wang CY, Cai XZ, et al. Identification and expression analysis of a novel CW-type zinc finger protein MORC2 in cancer cells. Anat Rec. 2010;293(6):1002–1009. doi:10.1002/ar.21119
24. Pan Z, Ding Q, Guo Q, et al. MORC2, a novel oncogene, is upregulated in liver cancer and contributes to proliferation, metastasis and chemoresistance. Int J Oncol. 2018;53(1):59–72. doi:10.3892/ijo.2018.4333
25. Koch A, Kang HG, Steinbrenner J, et al. MORC Proteins: novel Players in Plant and Animal Health. Front Plant Sci. 2017;8:1720. doi:10.3389/fpls.2017.01720
26. Sevilla T, Lupo V, Martinez-Rubio D, et al. Mutations in the MORC2 gene cause axonal Charcot-Marie-Tooth disease. Brain. 2016;139(Pt 1):62–72. doi:10.1093/brain/awv311
27. Zhang FL, Cao JL, Xie HY, et al. Cancer-Associated MORC2-Mutant M276I Regulates an hnRNPM-Mediated CD44 Splicing Switch to Promote Invasion and Metastasis in Triple-Negative Breast Cancer. Cancer Res. 2018;78(20):5780–5792. doi:10.1158/0008-5472.CAN-17-1394
28. Liao XH, Zhang Y, Dong WJ, Shao ZM, Li DQ. Chromatin remodeling protein MORC2 promotes breast cancer invasion and metastasis through a PRD domain-mediated interaction with CTNND1. Oncotarget. 2017;8(58):97941–97954. doi:10.18632/oncotarget.18556
29. Sanchez-Solana B, Li DQ, Kumar R. Cytosolic functions of MORC2 in lipogenesis and adipogenesis. Biochim Biophys Acta. 2014;1843(2):316–326. doi:10.1016/j.bbamcr.2013.11.012
30. Liu J, Zhang Q, Ruan B, et al. MORC2 regulates C/EBPalpha-mediated cell differentiation via sumoylation. Cell Death Differ. 2019;26(10):1905–1917. doi:10.1038/s41418-018-0259-4
31. Guddeti RK, Chutani N, Pakala SB. MORC2 Interactome: its Involvement in Metabolism and Cancer. Biophys Rev. 2021;13(4):507–514. doi:10.1007/s12551-021-00812-x
32. Tong Y, Li Y, Gu H, et al. HSF1, in association with MORC2, downregulates ArgBP2 via the PRC2 family in gastric cancer cells. Biochim Biophys Acta Mol Basis Dis. 2018;1864(4 Pt A):1104–1114. doi:10.1016/j.bbadis.2018.01.011
33. Liao G, Liu X, Wu D, et al. MORC2 promotes cell growth and metastasis in human cholangiocarcinoma and is negatively regulated by miR-186-5p. Aging. 2019;11(11):3639–3649. doi:10.18632/aging.102003
34. Liu M, Sun X, Shi S. MORC2 Enhances Tumor Growth by Promoting Angiogenesis and Tumor-Associated Macrophage Recruitment via Wnt/beta-Catenin in Lung Cancer. Cell Physiol Biochem. 2018;51(4):1679–1694. doi:10.1159/000495673
35. Wang T, Qin ZY, Wen LZ, et al. Epigenetic restriction of Hippo signaling by MORC2 underlies stemness of hepatocellular carcinoma cells. Cell Death Differ. 2018;25(12):2086–2100. doi:10.1038/s41418-018-0095-6
36. Liu J, Shao Y, He Y, et al. MORC2 promotes development of an aggressive colorectal cancer phenotype through inhibition of NDRG1. Cancer Sci. 2019;110(1):135–146. doi:10.1111/cas.13863
37. Binefa G, Rodriguez-Moranta F, Teule A, Medina-Hayas M. Colorectal cancer: from prevention to personalized medicine. World J Gastroenterol. 2014;20(22):6786–6808. doi:10.3748/wjg.v20.i22.6786
38. Ciccolallo L, Capocaccia R, Coleman MP, et al. Survival differences between European and US patients with colorectal cancer: role of stage at diagnosis and surgery. Gut. 2005;54(2):268–273. doi:10.1136/gut.2004.044214
39. Verdecchia A, Francisci S, Brenner H, et al. Recent cancer survival in Europe: a 2000–02 period analysis of EUROCARE-4 data. Lancet Oncol. 2007;8(9):784–796. doi:10.1016/s1470-2045(07)70246-2
40. Giuliani C. The Flavonoid Quercetin Induces AP-1 Activation in FRTL-5 Thyroid Cells. Antioxidants. 2019;8(5):79.
41. Ando M, Okamoto Y, Yoshimura A, et al. Clinical and mutational spectrum of Charcot-Marie-Tooth disease type 2Z caused by MORC2 variants in Japan. Eur J Neurol. 2017;24(10):1274–1282. doi:10.1111/ene.13360
42. Guillen Sacoto MJ, Tchasovnikarova IA, Torti E, et al. De Novo Variants in the ATPase Module of MORC2 Cause a Neurodevelopmental Disorder with Growth Retardation and Variable Craniofacial Dysmorphism. Am J Hum Genet. 2020;107(2):352–363. doi:10.1016/j.ajhg.2020.06.013
43. Liu YY, Liu HY, Yu TJ, et al. O-GlcNAcylation of MORC2 at threonine 556 by OGT couples TGF-beta signaling to breast cancer progression. Cell Death Differ. 2022. doi:10.1038/s41418-021-00901-0
44. Naccarati A, Polakova V, Pardini B, et al. Mutations and polymorphisms in TP53 gene--an overview on the role in colorectal cancer. Mutagenesis. 2012;27(2):211–218. doi:10.1093/mutage/ger067
45. Worthley DL, Whitehall VL, Spring KJ, Leggett BA. Colorectal carcinogenesis: road maps to cancer. World J Gastroenterol. 2007;13(28):3784–3791. doi:10.3748/wjg.v13.i28.3784
46. Smith FM, Stephens RB, Kennedy MJ, Reynolds JV. P53 abnormalities and outcomes in colorectal cancer: a systematic review. Br J Cancer. 2005;92(9):1813. doi:10.1038/sj.bjc.6602589
47. Lopez I, PO L, Tucci P, et al. Different mutation profiles associated to P53 accumulation in colorectal cancer. Gene. 2012;499(1):81–87. doi:10.1016/j.gene.2012.02.011
48. Iacopetta B. TP53 mutation in colorectal cancer. Hum Mutat. 2003;21(3):271–276. doi:10.1002/humu.10175
49. Iacopetta B, Russo A, Bazan V, et al. Functional categories of TP53 mutation in colorectal cancer: results of an International Collaborative Study. Ann Oncol. 2006;17(5):842–847. doi:10.1093/annonc/mdl035
50. Sun J, Zhang Z, Bao S, et al. Identification of tumor immune infiltration-associated lncRNAs for improving prognosis and immunotherapy response of patients with non-small cell lung cancer. J Immunother Cancer. 2020;8(1):34.
51. Zhou M, Zhang Z, Bao S, et al. Computational recognition of lncRNA signature of tumor-infiltrating B lymphocytes with potential implications in prognosis and immunotherapy of bladder cancer. Brief Bioinform. 2021;22(3). doi:10.1093/bib/bbaa047
52. Kim J, Kwon J, Kim M, et al. Low-dielectric-constant polyimide aerogel composite films with low water uptake. Polymer Journal. 2016;48(7):829–834. doi:10.1038/pj.2016.37
53. Pagès F, Mlecnik B, Marliot F, et al. International validation of the consensus Immunoscore for the classification of colon cancer: a prognostic and accuracy study. Lancet. 2018;391(10135):2128–2139. doi:10.1016/s0140-6736(18)30789-x
 © 2023 The Author(s). This work is published and licensed by Dove Medical Press Limited. The
full terms of this license are available at https://www.dovepress.com/terms
and incorporate the Creative Commons Attribution
- Non Commercial (unported, 3.0) License.
By accessing the work you hereby accept the Terms. Non-commercial uses of the work are permitted
without any further permission from Dove Medical Press Limited, provided the work is properly
attributed. For permission for commercial use of this work, please see paragraphs 4.2 and 5 of our Terms.
© 2023 The Author(s). This work is published and licensed by Dove Medical Press Limited. The
full terms of this license are available at https://www.dovepress.com/terms
and incorporate the Creative Commons Attribution
- Non Commercial (unported, 3.0) License.
By accessing the work you hereby accept the Terms. Non-commercial uses of the work are permitted
without any further permission from Dove Medical Press Limited, provided the work is properly
attributed. For permission for commercial use of this work, please see paragraphs 4.2 and 5 of our Terms.
Recommended articles
Diagnostic and Prognostic Value of Monocyte Distribution Width in Sepsis
Wu J, Li L, Luo J
Journal of Inflammation Research 2022, 15:4107-4117
Published Date: 20 July 2022
CENPO is Associated with Immune Cell Infiltration and is a Potential Diagnostic and Prognostic Marker for Hepatocellular Carcinoma
He K, Xie M, Li J, He Y, Yin Y
International Journal of General Medicine 2022, 15:7493-7510
Published Date: 25 September 2022
Leiomyoma with Bizarre Nuclei: A Current Update
Guo E, Li C, Hu Y, Zhao K, Zheng Q, Wang L
International Journal of Women's Health 2022, 14:1641-1656
Published Date: 25 November 2022
Characterization of the Microbiome and Host’s Metabolites of the Lower Respiratory Tract During Acute Community-Acquired Pneumonia Identifies Potential Novel Markers
Xiao Q, Tan S, Liu C, Liu B, Li Y, Guo Y, Hu P, Su Z, Chen S, Lei W, Li X, Su M, Rong F
Infection and Drug Resistance 2023, 16:581-594
Published Date: 26 January 2023
Diagnosis, Prognosis, and Treatment of Triple-Negative Breast Cancer: A Review
Jie H, Ma W, Huang C
Breast Cancer: Targets and Therapy 2025, 17:265-274
Published Date: 17 March 2025