Back to Journals » Cancer Management and Research » Volume 13
High Endothelin Receptor Type A Expression as an Independent Prognostic Biomarker and Correlated with Immune Infiltrates in Stomach Adenocarcinoma
Authors Yan Y, Nie K, Zheng J, Jiang X ![]() , Huang Y
, Huang Y ![]() , Zheng Z, Wen Y, Li P
, Zheng Z, Wen Y, Li P
Received 29 March 2021
Accepted for publication 2 June 2021
Published 28 June 2021 Volume 2021:13 Pages 5013—5026
DOI https://doi.org/10.2147/CMAR.S313078
Checked for plagiarism Yes
Review by Single anonymous peer review
Peer reviewer comments 3
Editor who approved publication: Professor Bilikere Dwarakanath
Yanhua Yan,1 Kechao Nie,2 Junhui Zheng,1 Xiaotao Jiang,1 Yuancheng Huang,1 Zhihua Zheng,1 Yi Wen,3 Peiwu Li3
1The First Clinical Medical College, Guangzhou University of Chinese Medicine, Guangzhou, 510000, People’s Republic of China; 2Department of Integrated Traditional Chinese & Western Medicine, The Second Xiangya Hospital, Central South University, Changsha, Hunan, 410011, People’s Republic of China; 3Department of Gastroenterology, The First Affiliated Hospital of Guangzhou University of Chinese Medicine, Guangzhou, 510000, People’s Republic of China
Correspondence: Peiwu Li; Yi Wen Email [email protected]; [email protected]
Background: Stomach adenocarcinoma (STAD) is the most common gastrointestinal cancer and is associated with high mortality worldwide. Endothelin receptor type A (EDNRA) is associated with guanine-nucleotide-binding (G) proteins and plays important roles in cellular processes and various diseases.
Purpose: To investigate the prognosis value of EDNRA expression and its correlation with immune infiltrates in patients with STAD.
Methods: The association between clinical characteristics and EDNRA expression in STAD was analyzed using the Wilcoxon signed-rank test and logistic regression. The Kaplan–Meier plotter analysis and Cox regression were constructed to evaluate the influence of EDNRA on prognosis, and a receiver operating characteristic (ROC) curve and nomogram were constructed. Gene set enrichment analysis (GSEA) and single-sample gene set enrichment analysis (ssGSEA) were conducted to analyze the correlation between EDNRA and immune infiltrates. In addition, Oncomine, TIMER databases and qRT-PCR of STAD cell lines were used to verify the EDNRA expression in STAD.
Results: Our results revealed that EDNRA expression was significantly higher in patients with STAD than normal gastric tissues, and the results have been confirmed by RT-qPCR. KM-plotter analysis revealed that patients with STAD had shorter OS, FP, and PPS (P< 0.001). Multivariate Cox analysis further confirmed that high EDNRA expression was an independent risk factor for OS in patients with STAD. Moreover, other clinicopathologic features were related with worse prognosis in STAD, including age, lymph nodes metastases and primary outcome. More importantly, ROC analysis also confirmed the diagnostic value, and a prognostic nomogram involving age, T, M, N classification, pathologic stage, residual tumor and EDNRA was constructed. GSEA revealed that high EDNRA expression was correlated with immunoregulatory interactions between lymphoid and non lymphoid cells pathways, natural killer cell activation involved in immune response, interleukin 1 receptor binding and pathways in cancer, and ssGSEA showed that EDNRA is correlated with macrophages and NK cells.
Conclusion: Collectively, EDNRA can be an independent prognostic biomarker and correlated with immune infiltration in stomach adenocarcinoma.
Keywords: EDNRA, STAD, bioinformatics, prognosis
Background
Stomach adenocarcinoma (STAD) is the most common gastrointestinal cancer and is associated with elevated mortality worldwide.1,2 The wide invasion and metastasis of STAD, which had been declining due to the increase of gastric endoscopy, contribute to poor prognosis of patients with STAD. Immune-related mechanisms and markers are involved in the occurrence and progression of STAD, and immune-related targeted therapy provides a promising option for the treatment of STAD.3 However, the research of exploring the novel molecular targets and markers with high efficiency is in its infancy. Therefore, there is an urgent need to identify novel immune-related markers to achieve early diagnosis and treatment in GC.
Endothelin Receptor Type A (EDNRA), also named ETA receptor (ETAR), an endothelin-1 (ET-1) receptor, is associated with guanine-nucleotide-binding (G) proteins and plays important roles in different diseases, such as intracranial aneurysm, mandibulofacial dysostosis with alopecia, migraine with or without aura and various cancers and so on.4–6 It has been reported that EDNRA is expressed in many human malignancies and is closely associated with cell proliferation, invasion and migration, metastasis and drug resistance.7,8 In addition, the EDNRA/ET-1 axis participates in the reprogramming of tumor-associated immune cells, such as neutrophils,9 dendritic cells (DC),10 tumor-associated macrophages (TAM),11,12 tumor infiltrating lymphocytes (TIL)13 and regulates the communication between tumor cells and tumor microenvironment (TME).14 The existing body of research on bladder cancer suggests EDNRA is one of immune function-related genes, and has the potential to assess prognosis and predict the efficacy of immunotherapy.15 Wei et al. observed that EDNRA expression can be downregulated by miR-200c in regulation of gastric carcinoma cells proliferation, apoptosis and invasiveness.16 However, the prognosis value of EDNRA expression and its correlation with TME in patients with STAD remains unclear.
Here we investigated the EDNRA expression in STAD and its prognostic value in patients with STAD. Then, gene set enrichment analysis (GSEA) of the STAD data set from TCGA was applied to evaluate the underlying mechanisms of EDNRA, and the correlation between EDNRA expression and tumor infiltrating immune cells (TIILs) and immune markers in the TME were assessed. Finally, we systematically examined mRNA expression level of EDNRA in numerous databases and used qRT-PCR to verify the EDNRA expression in STAD cell lines.
Methods
Patient Data Sets
All raw data of STAD, with transcriptome RNA-seq data and the corresponding clinical information, were downloaded from TCGA database (https://tcga-data.nci.nih.gov/tcga/).17
Gene Set Enrichment Analysis (GSEA)
GSEA was conducted to identify potential biological processes and pathways in high-risk groups in the “cluster Profiler” R package.18,19 The c2.cp.v7.2.symbols.gmt (KEGG) and c5.all.v7.2.symbols.gmt (Gene ontology) were downloaded from the Molecular Signatures Database (MSigDB). Gene sets with |NES|>1, NOM p<0.05 and FDR<0.05 were considered as statistical significance.
Immune Cells Infiltration of ssGSEA
Immune infiltration analysis of STAD was performed by single-sample gene set enrichment analysis (ssGSEA) in the “GSVA” R package,20 and the infiltration levels of 24 immune cell types21 were quantified from gene expression profiles. In addition, a Spearman correlation was performed to explore the association of immune cells infiltration with EDNRA expression and Wilcoxon rank sum test was conducted to analyze the correlation between infiltration level of immune cells and EDNRA.
Cell Cultures
STAD cell lines MKN-45, MGC-803 and human normal gastric epithelial cell line GES-1 were acquired from the American Type Culture Collection (ATCC, Manassas, VA, USA). All cells were cultured in RPMI-1640 Medium (Life Technologies, Grand Island, NY, USA) supplemented with 10% fetal bovine serum (FBS, Life Technologies) and antibiotics (100 units/mL penicillin and 100 ug/mL streptomycin) at 37°C, 5% CO2 in a humidified atmosphere incubator.
Quantitative Real-Time Polymerase Chain Reactions (qRT-PCR) of Cell Lines
Total RNA was extracted from cell lines with TRIzol reagent (Invitrogen, China) in accordance with the manufacturer’s instructions. Using the PrimeScript RT Reagent Kit (Takara, China), the RNA was reversely transcribed into cDNA, and quantitative real-time PCR (qRT-PCR) analyses were quantified with SYBR Green (Takara). The EDNRA expression was calculated based on 2−ΔΔCt method with GAPDHJ as an internal reference. qRT-PCR primers used in this study were as follows: EDNRA forward primer, 5ʹ-TCGGGTTCTATTTCTGTATGCCC−3ʹ; EDNRA reverse primer, 3ʹ- TGTTTTTGCCACTTCTCGACG-5ʹ; GAPDH forward primer, 5ʹ-GGACCTGACCTGCCGTCTAG-3ʹ; GAPDH reverse primer, 3ʹ-GTAGCCCAGGATGCCCTTGA-5ʹ.
Statistical Analysis
The EDNRA expression in patients with STAD was assessed by using box plots compared with normal gastric tissues of GTEx samples. The median method of EDNRA expression was selected as the cut-off value. Then, the association between clinical features and EDNRA expression in STAD were analyzed using Wilcoxon signed-rank test and logistic regression. The overall survival (OS), free progression (FP), post progression survival (PFS), between the high and low EDNRA expression groups were analyzed using the Kaplan–Meier plotter (http://kmplot.com/analysis/). A receiver operating characteristic (ROC) curve was applied to assess the diagnostic value of EDNRA expression, with the area under the ROC curve used as the diagnostic value. Univariate and multivariate Cox analyses of TCGA-STAD dataset were performed to screen potential prognostic factors. Subsequently, multivariate Cox analysis was used to verify the independent prognostic factors of EDNRA expression, and a nomogram was constructed to predict 1-, 3- and 5-year OS for patients with STAD. The EDNRA expression level in patients with STAD was further verified in the Oncomine database (https://www.oncomine.org/resource/main.html)22 and TIMER database (https://cistrome.shinyapps.io/timer/).23
Results
High EDNRA Expression is Correlated with Clinicopathologic Features in Patients with STAD
Compared between 375 STAD tissues and 32 adjacent STAD tissues, we investigated the expression of EDNRA in STAD patients, and found that EDNTA expression level was significantly higher in STAD tissues than in adjacent STAD tissues (P = 8.4e-04) (Figure 1A). Meanwhile, different expression of EDNRA in normal samples of GTEx combined adjacent STAD tissues and STAD samples were analyzed, and found that EDNRA was overexpressed in STAD (P = 1.4e−19) (Figure 1B). However, Among 27 STAD samples and matched adjacent samples, EDNRA expression was increased in tumor tissues but there was no significant difference (Figure 1C), that the number of paired samples is not large enough to be significant. Moreover, the receiver operating characteristic (ROC) curve was carried out to analyze the effectiveness of EDNRA expression in normal samples of GTEx combined adjacent STAD tissues and STAD samples. The area under curve (AUC) of EDNRA was 0.722, which suggested high diagnostic value (Figure 1D).
 |
Figure 1 High EDNRA expression is correlated with clinicopathologic features in patients with STAD. (A) Wilcoxon signed rank sum test was used to analyze the difference expression of EDNRA in STAD tissues and adjacent STAD tissues; (B) Wilcoxon signed rank sum test was used to detect the different expression of EDNRA in normal samples of GTEx combined adjacent STAD tissues and STAD samples; (C) the different expression of EDNRA in 27 STAD samples and matched adjacent samples; (D) ROC curve for EDNRA in normal samples of GTEx combined adjacent STAD tissues and STAD samples. |
Correlation Between EDNRA Expression and Clinical Characteristics
The characteristics of 375 patients with STAD including clinical and gene expression data were collected from TCGA database. Based on the mean value of EDNRA expression, the patients with STAD were divided into high- and low-EDNRA expression groups (Table 1), and then we conducted Wilcoxon signed-rank test and logistic regression to analyze the correlation between EDNRA expression and clinical characteristics. High EDNRA expression was significantly associated with T classification (P = 3.7e-06), H. pylori infection (P = 0.03) and pathologic stage (P = 3.7e-03) (Figure 2), while it was not associated with other features (Supplementary Figure 1). The results of univariate analysis using logistic regression demonstrated that EDNRA expression was correlated with poor prognostic clinical characteristics in patients with STAD (Table 2). High EDNRA expression was significantly correlated with gender (OR = 2.042, 95% CI = 1.331–3.155, P = 0.001), T classification (T3&T4 vs T2&T1: OR = 0.568, 95% CI = 0.354–0.905, P = 0.018), H. pylori infection (OR = 0.235, 95% CI = 0.072–0.660, P = 0.009) and primary outcome (PR&CR vs PD&SD: OR = 0.563, 95% CI = 0.336–0.935).
 |
Table 1 Correlation Between EDNRA Expression and Clinicopathologic Characteristics of Patients with STAD |
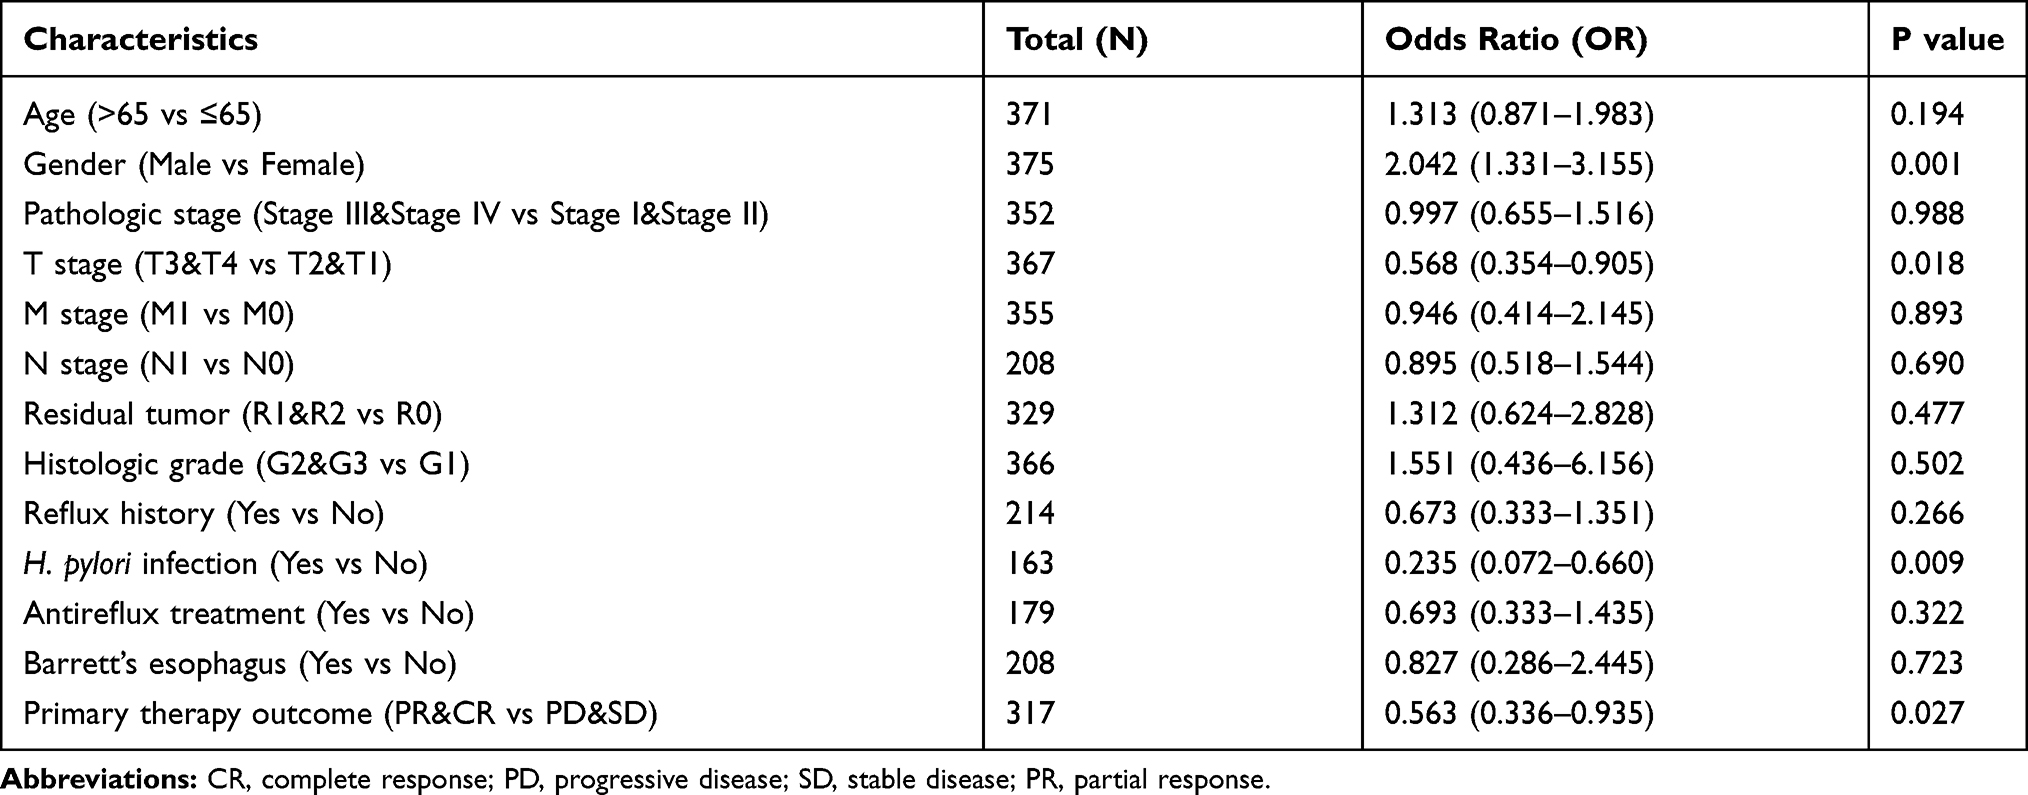 |
Table 2 EDNRA Expression Associated with Clinicopathologic Characteristics (Logistic Regression) |
 |
Figure 2 Box plot assessing EDNRA expression of patients with STAD according to different clinical characteristics. (A) T classification; (B) H. pylori infection; (C) pathologic stage. |
The Independent Risk and Diagnostic Value of EDNRA Expression in STAD
The survival analysis of the TCGA-STAD dataset demonstrated that high EDNRA expression was correlated with poor OS (P = 0.011) (Figure 3A), and the results of Kaplan–Meier plotter indicated that it was associated with poor OS (P = 6.5e-06) (Figure 3B); poor (FP, P = 0.00029)(Figure 3C) and poor (PFS, P = 3.8e-06) (Figure 3D). Univariate Cox analysis showed that high EDNRA expression was significantly correlated with poor OS (hazard ratio [HR] = 1.537, 95% CI = 1.105–2.139). Moreover, multivariate regression analysis further verified that EDNRA expression was an independent prognostic factor for OS in patients with STAD (HR = 2.414, 95% CI = 1.568–3.715, P<0.001) (Table 3 and Figure 4). Then, the nomogram used age, T, M, N classification, pathologic stage, residual tumor and EDNRA to predict the 1, 3, 5-year OS in the TCGA-STAD (Figure 5).
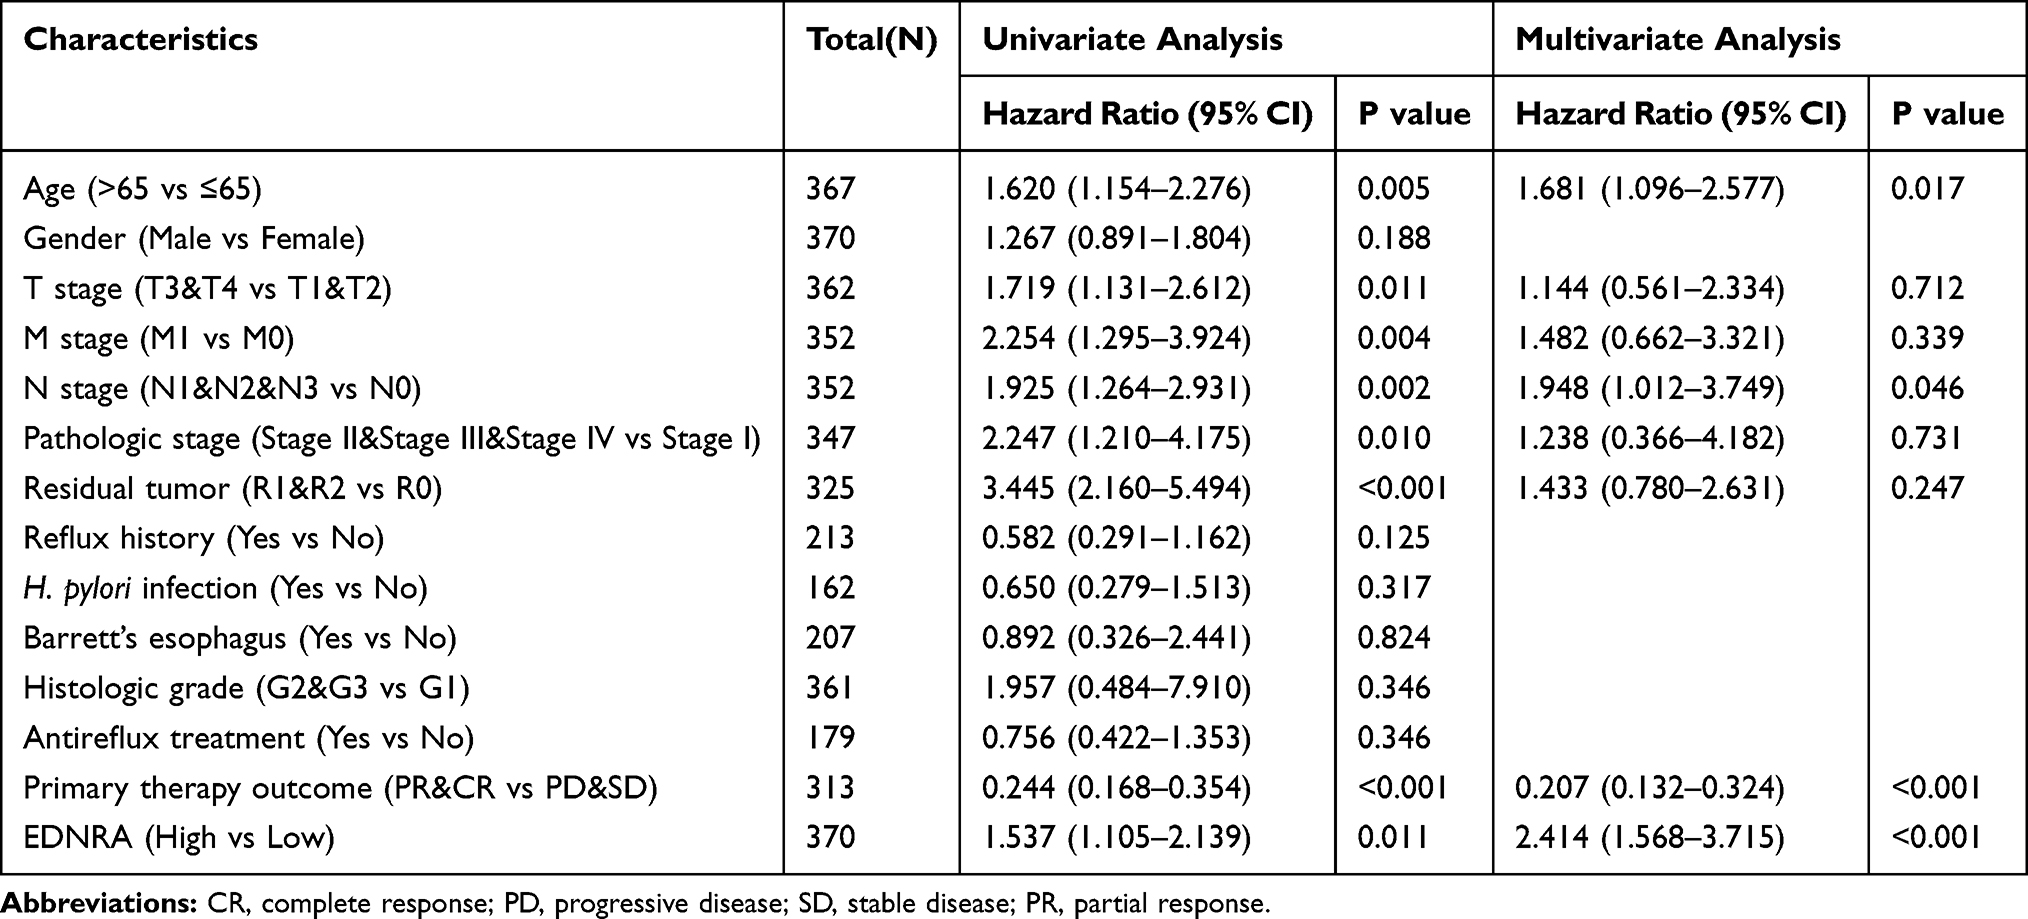 |
Table 3 Associations with Clinicopathologic Characteristics in STAD Patients Using Cox Regression |
 |
Figure 3 The independent risk and diagnostic value of EDNRA expression in STAD. (A) The survival analysis of overall survival (OS) of TCGA-STAD database; (B) Kaplan–Meier survival analysis of OS; (C) free progression (FP); (D) post progression survival (PPS). |
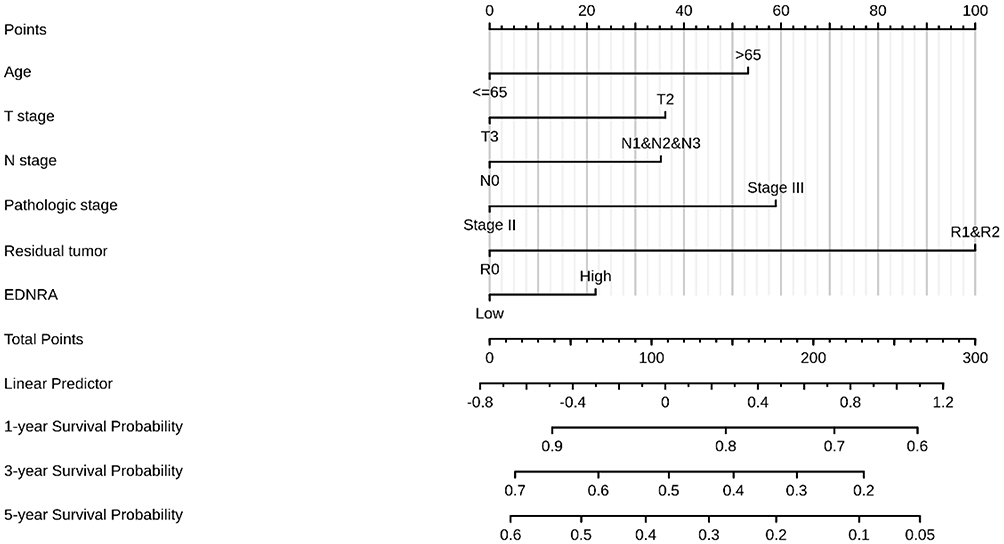 |
Figure 4 A nomogram for predicting probability of patients with 1-, 3- and 5-year overall survival (OS). |
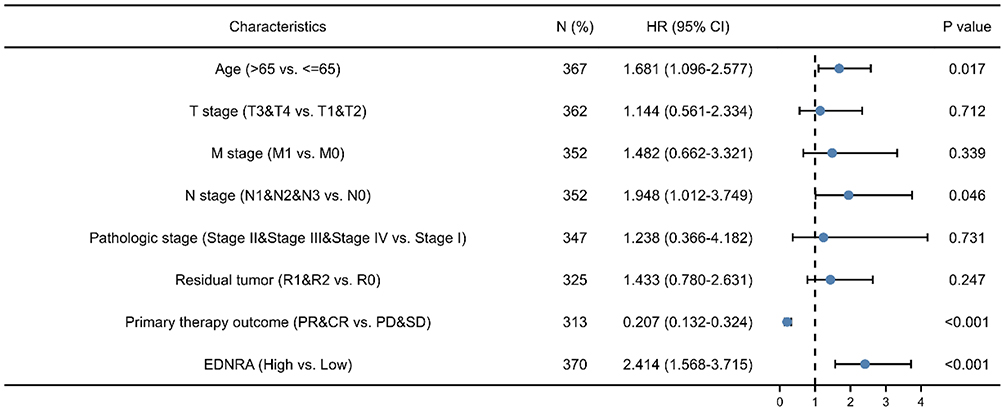 |
Figure 5 Forest plot of the multivariate Cox regression analysis in TCGA-STAD. |
EDNRA-Related Signaling Pathways Based on GSEA
To explore EDNRA-related signaling pathways, gene set enrichment analysis (GSEA) was conducted. As shown in Figure 5, we found that some immune-related signaling pathways were enriched in EDNRA high expression phenotype (Figure 6).
 |
Figure 6 Enrichment plots from GSEA. (A–C) EDNRA-related signaling pathways in c2.cp.v7.2.symbols.gmt; (D–F) EDNRA-related signaling pathways in c5.all.v7.2.symbols.gmt (Gene ontology). |
Immune Cell Infiltration Analysis of EDNRA in the TCGA-STAD
We further explored the association between EDNRA and immune cell infiltration level quantified by ssGSEA in STAD using Spearman correlation. The results showed that high EDNRA expression was significantly positively correlated with infiltration levels of natural killer (NK) cells and macrophages (P<0.001, Figure 7).
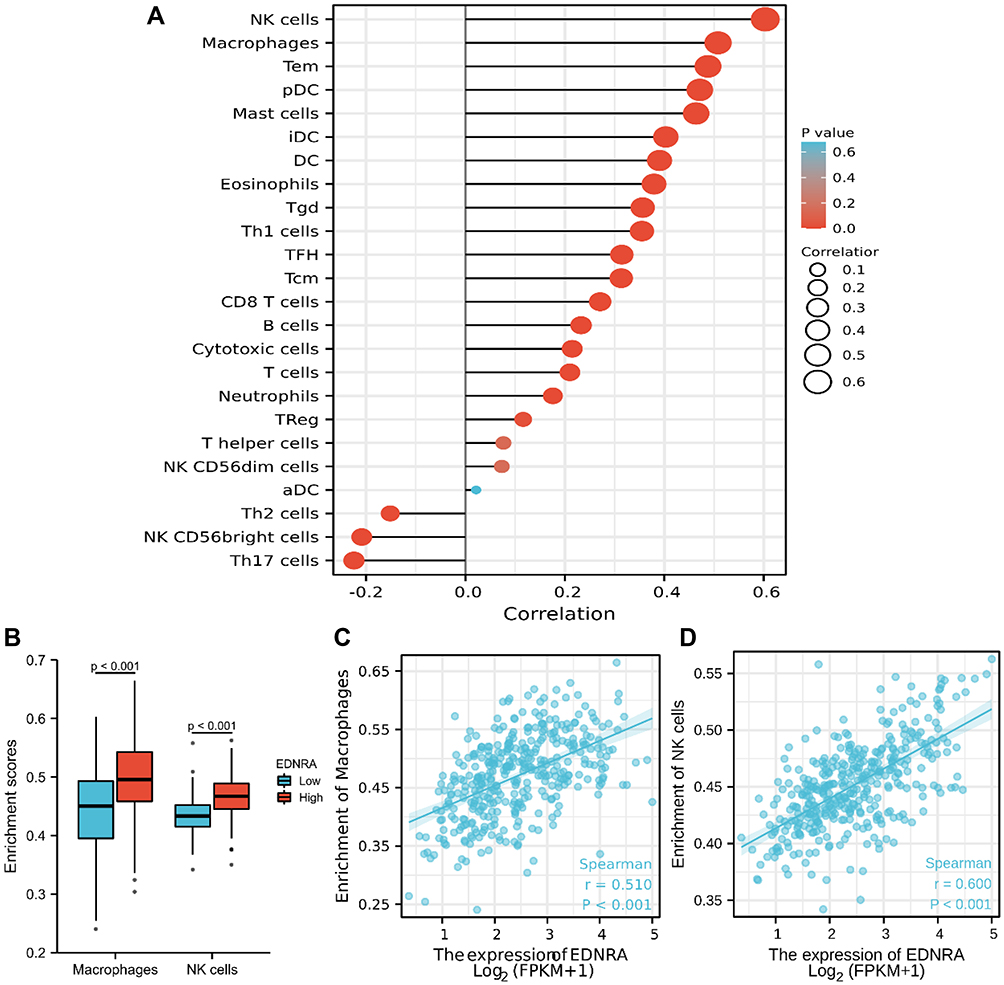 |
Figure 7 Immune Cell Infiltration Analysis of EDNRA in the TCGA-STAD. (A) The forest plot shows the correlation between EDNRA expression level and 24 immune cells; (B) the enrichment scores of EDNRA expression in NK cells and macrophages; (C) The correlation between EDNRA expression and macrophages; (D) the correlation between EDNRA expression and NK cells. Abbreviations: Tcm, Tcentral memory; Tem, Teffector memory; Tgd, Tgamma delta; Tfh, Tfollicular helper; NK, natural killer; pDC, plasmacytoid dendritic cells. |
Expression Analysis of EDNRA by Oncomine and TIMER Databases
We further verified the EDNRA expression by Oncomine and TIMER databases, and the results of EDNRA expression in STAD were consistent with the above. Interestingly, high EDNRA expression was also detected in other tumors, including brain cancer, colorectal cancer, kidney cancer and others (Figure 8).
 |
Figure 8 EDNRA expression levels in different types of cancers. (A) Compared with adjacent tissues, increased or decreased expression of EDNRA in Oncomine. (B) EDNRA expression levels in different types of cancers from TCGA datasets in TIMER, **P <0.01, ***P < 0.001. |
EDNRA Overexpression in Gastric Cancer Cell Lines by qRT-PCR
We examined the EDNRA expression in three STAD cell lines (MKN-45, MGC-803), and the results showed that EDNRA expression was significantly higher than that in the normal gastric epithelial cell line GES-1 (Figure 9), which is consistent with the results of TCGA-STAD.
 |
Figure 9 qRT-PCR of EDNRA expression in STAD cell lines (MGC-803, MKN-45) and human normal gastric epithelial cell line GES-1; *P < 0.05, ***P < 0.001. |
Discussion
EDNRA, binding to EDN1, is part of the G protein-coupled receptors and can regulate relevant signal pathways. The EDN1/EDNRA axis plays a major role in cellular processes, such as cell growth, differentiation, invasiveness, and tumor progression in several cancers. Moreover, overexpression of EDNRA is involved in the genesis and development of cancer. ET-1 and its receptors, EDNRA and EDNRB, expressed in white blood cells and macrophages, was involved in development of tumor and tumor microenvironment through cell proliferation, apoptosis, migration, invasion, epithelial-mesenchymal transition, chemoresistance and neovascularization.7
In this study, we investigated the EDNRA expression profile in various cancers using Oncomine and TIMER databases. The results showed that EDNRA expression was higher in brain, colorectal, gastric, and kidney cancer than in adjacent normal tissues in two databases. In 2018, Wei et al. found that miR-200c can downregulate EDNRA expression in gastric carcinoma cells.16 The potential prognostic value of EDNRA in patients with STAD has not been evaluated. Therefore, we conducted a comprehensive analysis to evaluate EDNRA expression in prognosis of patients with STAD. In the present research, we found that EDNRA expression was significantly higher in patients with STAD than in normal gastric tissues, and the results have been confirmed by RT-qPCR. KM-plotter analysis revealed that patients with STAD had shorter OS, FP, PPS (P<0.001). Multivariate Cox analysis further confirmed that high EDNRA expression was an independent risk factor for OS in patients with STAD. Moreover, high EDNRA expression was correlated with clinicopathologic features in STAD, including T classification, pathologic stage and H. pylori infection. The result showed that high EDNRA expression was correlated with advanced gastric cancer, which indicated that it may be a marker to identify early GC and advanced GC. It has been reported that the 5-year survival rates were 89.6%/83.8% for stage IA/B, however, 77.3%/69.1% for stage IIA/B, 58.7%/44.1%/30.1% for stage IIIA/B/C, and 13.4% for stage IV in Japan.24 In addition, high ENDRA expression was correlated with H. pylori infection, which was suggested as a cause or co-factor for GC, however, there are no reports of the association of EDNRA with H. pylori infection. What’s more important, ROC analysis also confirmed the diagnostic value. In recent years, there was no predictive nomogram for STAD combining the EDNRA expression reported. Therefore, a prognostic nomogram involving age, T, M, N classification, pathologic stage, residual tumor and EDNRA was constructed, which can be used by the physician to improve the accuracy of identifying high-risk patients.
In addition, we found that high EDNRA expression was correlated with immunoregulatory interactions between lymphoid and non lymphoid cells pathways, natural killer cell activation involved in immune response, interleukin 1 receptor binding and pathways in cancer by GSEA, which is involved in tumor microenvironment (TME).25 Then, ssGSEA were used to explore the association between EDNRA expression and immune cell infiltration in STAD. Among the immune cells subpopulations, B cells, T cells and subsets including Th1, Th2, Th17, Tfh cells, and tumor-associated macrophages (TAMs) play a major role in gastric cancer.26 Numerous studies have showed that EDN1 and its receptors, EDNRA and EDNRB, take an important role in the maturation and activity of different immune cells, including DCs,10 TAM,12 and tumor-infiltrating lymphocytes.13 Recently, it was reported that EDNRA was one of the survival-associated and immune-related genes and closely related to tumor infiltration of macrophages in bladder cancer. Compared with the low-EDNRA expression group, there were more TAMs and NK cells enriching in high-EDNRA expression group, indicating the innate immunity may improve. Besides, NK cells and TAMs infiltrating in GC have proinflammatory and immunosuppressive activity through producing IFN-γ, TNF-α and IL-10.26–28 Interestingly, macrophages can be activated by H. pylori infection to induce tumor suppression,29 which may be an explanation of the association of high EDNRA expression with H. pylori infection. However, the underlying mechanisms should be further explored.
There are some limitations in our study. Cell function tests and validation of gastric cancer tissues which are other solid evidence were lacking. In addition, it is possible that some biases caused by confounding factors exist because of data from public databases.
To our best knowledge, it is the first research to investigate the prognostic value of EDNRA expression and explore the immune-related mechanism in STAD. However, some limitations exist, and some mechanisms of EDNRA in STAD require further investigation.
Conclusion
Collectively, our study demonstrated that overexpression of EDNRA was correlated with poor prognosis in STAD and considered as an independent factor in patients with STAD. Moreover, immunoregulatory interactions between lymphoid and non lymphoid cells pathways, natural killer cell activation involved in immune response, interleukin 1 receptor binding and pathways in cancer may be regulated by EDNRA in STAD, and high EDNRA was correlated with NK cells and macrophages. High EDNRA expression may be an independent prognostic biomarker and correlated with immune infiltrates in stomach adenocarcinoma.
Abbreviations
STAD, stomach adenocarcinoma; EDNRA, endothelin Receptor Type A; ETAR, ETA receptor; ET-1, endothelin-1; DC, dendritic cells; TAM, tumor-associated macrophages; TIL, tumor-infiltrating lymphocytes; TME, tumor microenvironment; GSEA, gene set enrichment analysis; ssGSEA, single-sample gene set enrichment analysis; qRT-PCR, Quantitative Real-Time polymerase chain reaction; NK cells, natural killer cells; TAMs, tumor-associated macrophages.
Acknowledgments
This study benefited from the Cancer Genome Atlas (TCGA).
Author Contributions
All authors contributed to data analysis, drafting or revising the article, gave final approval of the version to be published, and agree to be accountable for all aspects of the work.
Funding
This study was supported by D3-2-4 Young scholar of Qihuang, No. 08004001004003002004; Guangdong natural science fund project, China (2019), No.2019A1515011145; Major research project of Guangzhou University of Chinese medicine, China, No. A1-AFD018201A51; The first affiliated hospital of Guangzhou University of Chinese medicine “Innovative Strong Hospital ” clinical research project, China (2019), No.2019IIT19;Liu Fengbin, Guangdong famous traditional Chinese medicine inheritance studio (Guangdong traditional Chinese medicine office [2020] no. 1).
Disclosure
The authors declare no conflicts of interest.
References
1. Bray F, Ferlay J, Soerjomataram I, Siegel RL, Torre LA, Jemal A. Global cancer statistics 2018: GLOBOCAN estimates of incidence and mortality worldwide for 36 cancers in 185 countries. CA Cancer J Clin. 2018;68(6):394–424. doi:10.3322/caac.21492
2. Tirino G, Pompella L, Petrillo A, et al. What’s new in gastric cancer: the therapeutic implications of molecular classifications and future perspectives. Int J Mol Sci. 2018;19(9):2659. doi:10.3390/ijms19092659
3. Procaccio L, Schirripa M, Fassan M, et al. Immunotherapy in gastrointestinal cancers. Biomed Res Int. 2017;2017:4346576. doi:10.1155/2017/4346576
4. Yasuno K, Bakircioglu M, Low SK, et al. Common variant near the endothelin receptor type A (EDNRA) gene is associated with intracranial aneurysm risk. Proc Natl Acad Sci. 2011;108(49):19707–19712. doi:10.1073/pnas.1117137108
5. Gordon CT, Weaver KN, Zechi-Ceide RM, et al. Mutations in the endothelin receptor type A cause mandibulofacial dysostosis with alopecia. Am J Hum Genet. 2015;96(4):519–531. doi:10.1016/j.ajhg.2015.01.015
6. Miao J, Wang F, Fang Y. Association of 231G>A polymorphism of endothelin type A receptor gene with migraine: a meta-analysis. J Neurol Sci. 2012;323(1–2):232–235. doi:10.1016/j.jns.2012.09.027
7. Rosanò L, Spinella F, Bagnato A. Endothelin 1 in cancer: biological implications and therapeutic opportunities. Nat Rev Cancer. 2013;13(9):637–651. doi:10.1038/nrc3546
8. Gupta S, Prajapati A, Gulati M, et al. Irreversible and sustained upregulation of endothelin axis during oncogene-associated pancreatic inflammation and cancer. Neoplasia. 2020;22(2):98–110. doi:10.1016/j.neo.2019.11.001
9. Cabral-Marques O, Marques A, Giil LM, et al. GPCR-specific autoantibody signatures are associated with physiological and pathological immune homeostasis. Nat Commun. 2018;9(1):5224. doi:10.1038/s41467-018-07598-9
10. Patel KV, Sheth HG, Schrey MP. Stimulation or endothelin–1 secretion byhuman breast cancer cells through protein kinase A activation: a possiblenovel paracrine loop involving breast fibroblast-derived prostaglandin E2. Mol Cell Endocrinol. 1997;126:143–151. doi:10.1016/S0303-7207(96)03983-4
11. Guruli G, Pflug BR, Pecher S, Makarenkova V, Shurin MR, Nelson JB. Functionand survival of dendritic cells depend on endothelin-1 and endothelinreceptor autocrine loops. Blood. 2004;104:2107–2115. doi:10.1182/blood-2003-10-3559
12. Kandalaft LE, Motz GT, Duraiswamy J, Coukos G. Tumor immune surveillanceand ovarian cancer: lessons on immune mediated tumor rejection ortolerance. Cancer Metastasis Rev. 2011;30:141–151. doi:10.1007/s10555-011-9289-9
13. Kandalaft LE, Facciabene A, Buckanovich RJ, Coukos G. Endothelin B receptor, a new target in cancer immune therapy. Clin Cancer Res. 2009;15:4521–4528. doi:10.1158/1078-0432.CCR-08-0543
14. Tocci P, Blandino G, Bagnato A. YAP and endothelin-1 signaling: an emerging alliance in cancer. J Exp Clin Cancer Res. 2021;40(1):27. doi:10.1186/s13046-021-01827-8
15. Liu L, Hu J, Wang Y, et al. Establishment of a novel risk score model by comprehensively analyzing the immunogen database of bladder cancer to indicate clinical significance and predict prognosis. Aging. 2020;12(12):11967–11989. doi:10.18632/aging.103364
16. Wei W, Shi L, Chen W, et al. miR-200c regulates the proliferation, apoptosis and invasion of gastric carcinoma cells through the downregulation of EDNRA expression. Int J Mol Med. 2018;41(3):1619–1626. doi:10.3892/ijmm.2017.3317
17. Blum A, Wang P, Zenklusen JC. SnapShot: TCGA-analyzed tumors. Cell. 2018;173(2):530. doi:10.1016/j.cell.2018.03.059
18. Yu G, Wang L-G, Han Y, et al. clusterProfiler: an R package for comparing biological themes among gene clusters. OMICS. 2012;16(5):284–287. doi:10.1089/omi.2011.0118
19. Subramanian A, Tamayo P, Mootha VK, et al. Gene set enrichment analysis: a knowledge-based approach for interpreting genome-wide expression profiles. Proc Natl Acad Sci. 2005;102(43):15545–15550. doi:10.1073/pnas.0506580102
20. Hänzelmann S, Castelo R, Guinney J. GSVA: gene set variation analysis for microarray and RNA-seq data. BMC Bioinform. 2013;14(1):1–15. doi:10.1186/1471-2105-14-7
21. Bindea G, Mlecnik B, Tosolini M, et al. Spatiotemporal dynamics of intratumoral immune cells reveal the immune landscape in human cancer. Immunity. 2013;39(4):782–795. doi:10.1016/j.immuni.2013.10.003
22. Rhodes DR, Yu J, Shanker K, et al. ONCOMINE: a cancer microarray database and integrated data-mining platform. Neoplasia. 2004;6(1):1–6. doi:10.1016/S1476-5586(04)80047-2
23. Li T, Fu J, Zeng Z, et al. TIMER2.0 for analysis of tumor-infiltrating immune cells. Nucleic Acids Res. 2020;48(W1):W509–W514. doi:10.1093/nar/gkaa407
24. Suzuki S, Takahashi A, Ishikawa T, et al. Surgically treated gastric cancer in Japan: 2011 annual report of the national clinical database gastric cancer registry. Gastric Cancer. 2021;24(3):545–566. doi:10.1007/s10120-021-01178-5
25. Bassani B, Baci D, Gallazzi M, Poggi A, Bruno A, Mortara L. Natural killer cells as key players of tumor progression and angiogenesis: old and novel tools to divert their pro-tumor activities into potent anti-tumor effects. Cancers. 2019;11(4):461. doi:10.3390/cancers11040461
26. Lee K, Hwang H, Nam KT. Immune response and the tumor microenvironment: how they communicate to regulate gastric cancer. Gut Liver. 2014;8(2):131–139. doi:10.5009/gnl.2014.8.2.131
27. Biswas SK, Mantovani A. Macrophage plasticity and interaction with lymphocyte subsets: cancer as a paradigm. Nat Immunol. 2010;11(10):889–896. doi:10.1038/ni.1937
28. Solinas G, Germano G, Mantovani A, Allavena P. Tumor-associated macrophages (TAM) as major players of the cancer-related inflammation. J Leukocyte Biol. 2009;86(5):1065–1073. doi:10.1189/jlb.0609385
29. Fehlings M, Drobbe L, Moos V, et al. Comparative analysis of the interaction of Helicobacter pylori with human dendritic cells, mac-rophages, and monocytes. Infect Immun. 2012;80:2724–2734. doi:10.1128/IAI.00381-12
 © 2021 The Author(s). This work is published and licensed by Dove Medical Press Limited. The
full terms of this license are available at https://www.dovepress.com/terms
and incorporate the Creative Commons Attribution
- Non Commercial (unported, 3.0) License.
By accessing the work you hereby accept the Terms. Non-commercial uses of the work are permitted
without any further permission from Dove Medical Press Limited, provided the work is properly
attributed. For permission for commercial use of this work, please see paragraphs 4.2 and 5 of our Terms.
© 2021 The Author(s). This work is published and licensed by Dove Medical Press Limited. The
full terms of this license are available at https://www.dovepress.com/terms
and incorporate the Creative Commons Attribution
- Non Commercial (unported, 3.0) License.
By accessing the work you hereby accept the Terms. Non-commercial uses of the work are permitted
without any further permission from Dove Medical Press Limited, provided the work is properly
attributed. For permission for commercial use of this work, please see paragraphs 4.2 and 5 of our Terms.