Back to Journals » Diabetes, Metabolic Syndrome and Obesity » Volume 16
High Atherogenic Risk in Ketosis-Prone Type 2 Diabetic Individuals with Ketosis Episodes: A Cross-Sectional Study
Authors He X ![]() , Luo Y
, Luo Y ![]() , Hao J
, Hao J ![]() , Hu R
, Hu R ![]() , Yang X, Ren L
, Yang X, Ren L
Received 13 May 2023
Accepted for publication 14 September 2023
Published 5 October 2023 Volume 2023:16 Pages 3085—3094
DOI https://doi.org/10.2147/DMSO.S421203
Checked for plagiarism Yes
Review by Single anonymous peer review
Peer reviewer comments 2
Editor who approved publication: Professor Gian Paolo Fadini
Xiaoyu He,1,2 Yu Luo,2 Jianan Hao,1,2 Rui Hu,1,2 Xiaoyue Yang,1,2 Luping Ren2
1Graduate School, Hebei Medical University, Shijiazhuang, Hebei, People’s Republic of China; 2Department of Endocrinology, Hebei General Hospital, Shijiazhuang, Hebei, People’s Republic of China
Correspondence: Luping Ren, Department of Endocrinology, Hebei General Hospital, 348 Heping West Road, Shijiazhuang, 050051, People’s Republic of China, Tel +86 311 859 889 75, Email [email protected]
Purpose: Diabetes is an important contributor to the progression of atherosclerosis (AS). We aimed to investigate the correlation between ketosis episodes and lipid-related parameters in patients with new-onset ketosis-prone type 2 diabetes (KPT2D), further attempting to assess the impact of ketosis episodes on AS.
Patients and Methods: A cross-sectional study of 147 subjects with new-onset diabetes was performed, including 65 KPT2D subjects (KPT2D group) and 82 non-ketotic type 2 diabetes (T2D) (T2D group) subjects. Anthropometric and biochemical parameters were measured in all subjects. Calculation of atherogenic index of plasma (AIP) by traditional lipid parameters.
Results: The AIP (P = 0.008) level and the percentage of AIP ≥ 0.24 (P = 0.026) in subjects with KPT2D were higher than in subjects with T2D. The apoA1 (P = 0.001) levels were significantly lower in patients with KPT2D than in patients with T2D. In the KPT2D group, plasma ketones were positively correlated with AIP (P = 0.023) and negatively correlated with apoA1 (P = 0.002). Univariate logistic regression suggested that plasma ketone (OR = 1.704, P = 0.040) was an important related factor for the AS in subjects with KPT2D. Multiple linear regression suggested plasma ketone was significantly positive with AIP (β = 0.437, P = 0.020). In multiple linear regression analysis suggests that apolipoprotein A1 (β = – 0.335, P = 0.033) is strongly associated with ketotic episodes in newly diagnosed ketosis-prone type 2 diabetic patients.
Conclusion: Ketosis episodes in patients with KPT2D were significantly and positively associated with elevated AIP levels and reduced apoA1 levels. Frequent ketosis episodes may accelerate the progression of AS.
Keywords: ketosis onset, ketosis-prone type 2 diabetes, lipid metabolism, atherosclerosis, atherogenic index of plasma
Introduction
Currently, diabetes is widespread worldwide. Type 2 diabetes (T2D) is expected to increase to 439 million by 2030.1 Recently, diabetes mellitus with spontaneous ketosis or ketoacidosis as the first symptom has attracted attention. This type of diabetes is now often known as “ketosis-prone type 2 diabetes” (KPT2D)2 and defined KPT2D as a hybrid form of diabetes.3 Compared to type 1 diabetes (T1D), KPT2D retains better islet β-cell function. Compared to classical T2D, KPT2D exhibits transient islet β-cell suppression and has a strong family history of diabetes.4 A retrospective study in China found that patients with newly diagnosed KPT2D had significantly higher blood glucose levels and significantly lower islet cell function during ketosis episodes compared with patients with T2D.5 Studies have shown that 90% of these people will experience a ketosis episode within 10 years.3 Frequent episodes of ketosis in diabetic patients increase the morbidity and mortality of vascular disease.6
The abnormalities of lipid metabolism are a recognized risk factor for cardiovascular disease (CVD).7 Studies have shown that the prevalence of the metabolic syndrome is increased in subjects with young KPT2D than in subjects with T1D. In particular, subjects with KPT2D have lower High-density lipoprotein cholesterol (HDL-C) and higher triglycerides (TG) and Low-density lipoprotein cholesterol (LDL-C) compared to T1D.8 Current guidelines state that the main therapy focuses on lowering LDL-C, but even if LDL-C is normal, dyslipidemia can increase the risk of CVD.9 HDL has a direct atheroprotective effect on different cells within the atherosclerotic plaque.10 The body can excrete cholesterol and other lipids by reverse transportation of cholesterol, thus preventing atherosclerosis. ApoA1 is an important component of HDL and plays a key role in the reverse cholesterol transport.11
An atherogenic index may be better in detecting diabetic cardiovascular aspects within the normal range of conventional lipids.12 Many clinical studies have endeavored to introduce a better marker of atherosclerotic dyslipidemia.13 Both TG and HDL are associated with the development of atherosclerosis (AS), and the atherogenic index of plasma (AIP) was derived from the basis of these two factors. It reflects the interaction between atherogenic and protective lipoproteins.9 Shabnam Niroumand et al showed that AIP was significantly related to exercise and body mass index (BMI), which are important risk factors for AS. AIP is considered to be a useful monitoring indicator for CVD in subjects with cardiovascular risk factors.13 Some studies have shown that AIP values < 0.11 are relevant to less risk of CVD; values of AIP in the range of 0.11–0.21 and AIP > 0.21 are related to moderate and higher risk, respectively.14 In addition, in a longitudinal study, maintaining high AIP, low to high AIP, and high to low AIP were related to T2D.15 Many studies have demonstrated that AIP is associated with both the development of AS and the development of diabetes.
However, there are no studies on the correlation between ketosis episodes and lipid-related parameters in patients with KPT2D. Therefore, the purpose of this study was to investigate the relationship between ketosis episodes and lipid-related parameters in patients with KPT2D.
Patients and Methods
Study Design
This cross-sectional study strictly adheres to the Declaration of Helsinki. The work was approved by the Hebei General Hospital Ethics Committee (NO. 2023015). All subjects’ information was kept confidential. Each subject has signed an informed consent form.
Subjects Collected
The subjects of the study were 147 newly diagnosed diabetic patients attending the Hebei General Hospital from January 2017 to December 2020, including 65 new-onset patients with KPT2D (KPT2D group) and 82 new-onset non-ketotic type 2 diabetics (T2D group), all aged >18 years. All diagnoses conformed to the definition of the 2006 America Diabetes Association diagnostic criteria. Inclusion and exclusion criteria are shown in Table 1.
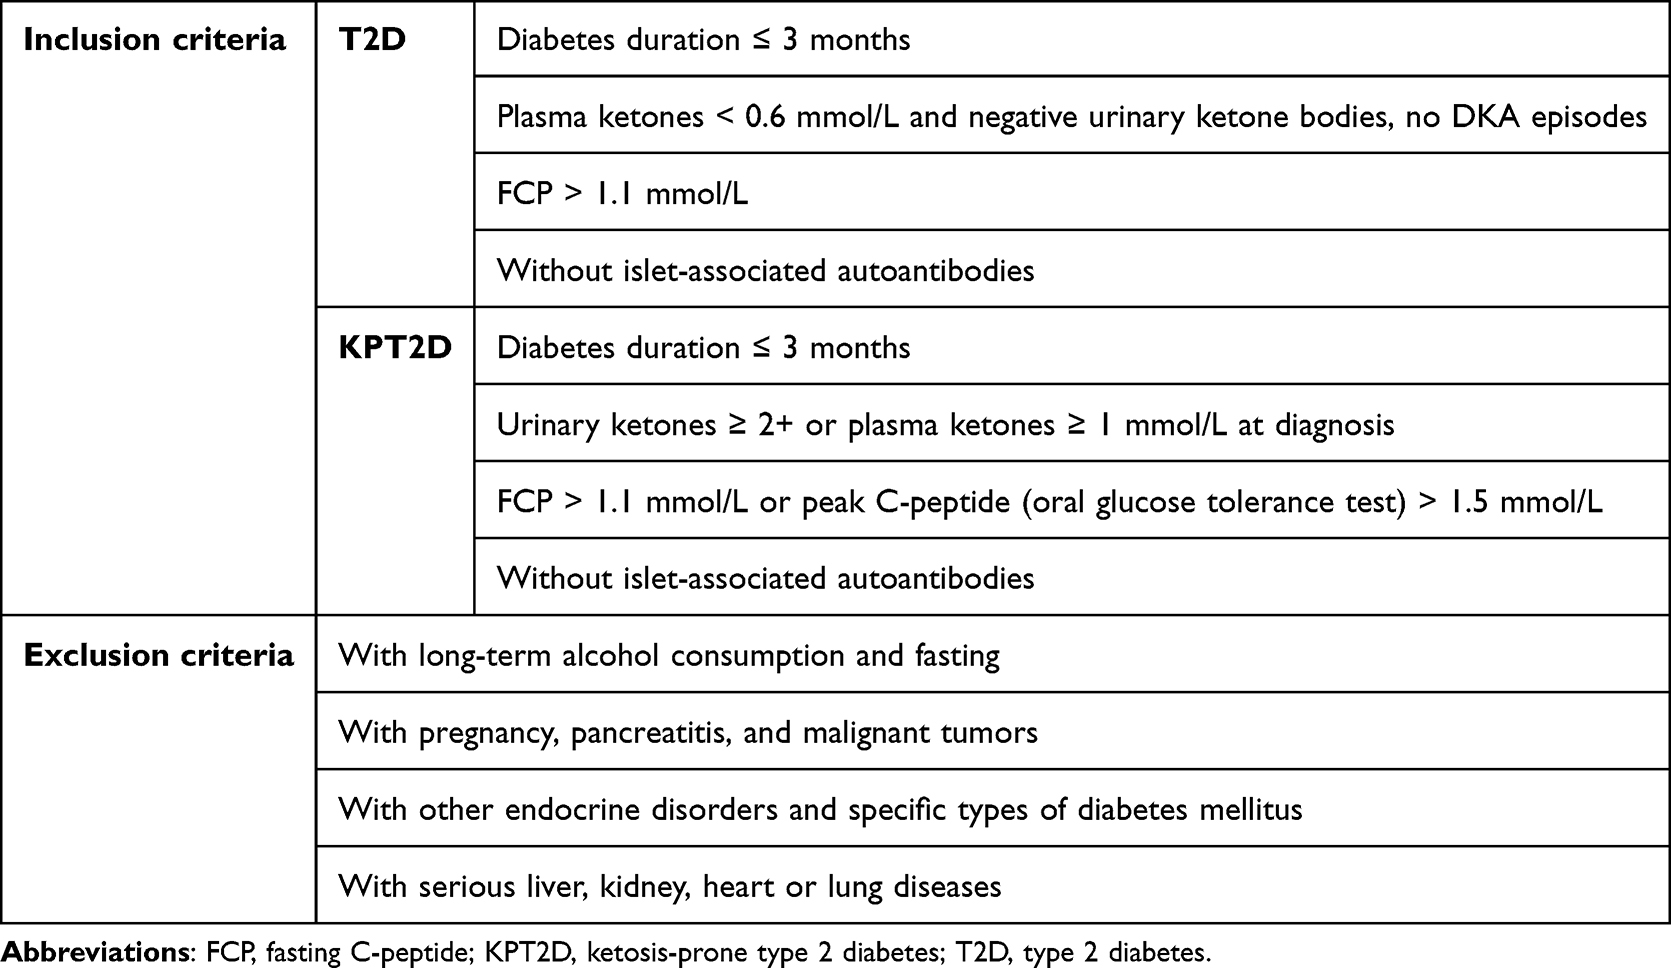 |
Table 1 Inclusion and Exclusion Criteria |
Clinical Data Collection
Physical and biochemical examinations were performed on all subjects upon admission. Basic information includes gender, age, weight, height, blood pressure, and BMI. The standard formula was used to calculate the BMI of the subjects. BMI = weight (kg)/height2 (m2). Venous blood samples were collected in the next morning after overnight fasting for at least 8 h. laboratory examinations indicators are total protein, albumin (ALB), blood uric acid (UA), blood urine nitrogen (BUN), blood creatinine (SCr), gamma-glutamyl transpeptidase (GGT), glomerular filtration rate (GFR), aspartate aminotransferase (AST), alanine aminotransferase (ALT), Apolipoprotein B (apoB), Apolipoprotein A1 (apoA1), TG, total cholesterol (TC), HDL-C, LDL-C, hemoglobin A1c (HbA1c), FCP level, fasting insulin level, and fasting blood glucose (FBG). Assessment of insulin resistance (HOMA-IR) and β cell function (HOMA-β) using homeostatic models. HOMA-IR = fasting insulin × FBG/22.5; HOMA-β = 20 × fasting insulin level / (FBG - 3.5). The AIP was computed as follows: AIP = log10 (TG/HDL-C). The likelihood of developing AS was assessed with the AIP. AIP ≥ 0.24 were considered to have a higher cardiovascular risk.16
Statistical Analysis
The data was analyzed using SPSS 26.0. Data that did not fit the normal distribution were expressed as the median (quartile) and the Mann–Whitney test to assess difference between two groups. Normally distributed data were given as mean ± S.D. and analyzed using the t-test. Categorical variables were demonstrated by percentages, and analyzed using χ2 tests. The correlation between plasma ketones and lipid-related parameters was assessed by calculating the correlation coefficient. Logistic regression and multiple linear regression analysis of the relationship between ketosis episodes and lipid-related parameters. P value < 0.05 was considered significant.
Results
Comparison of Clinical Characteristics and Anthropometric Features
The subjects of the KPT2D group were younger than the T2D group (P < 0.001) (Table 2). Height was significantly elevated in subjects with KPT2D than in subjects with T2D (P = 0.006). The KPT2D group had a significant predominance of males compared with the T2D group (P = 0.024), but no statistical significance differences in blood pressure, weight, and BMI, in T2D and KPT2D groups.
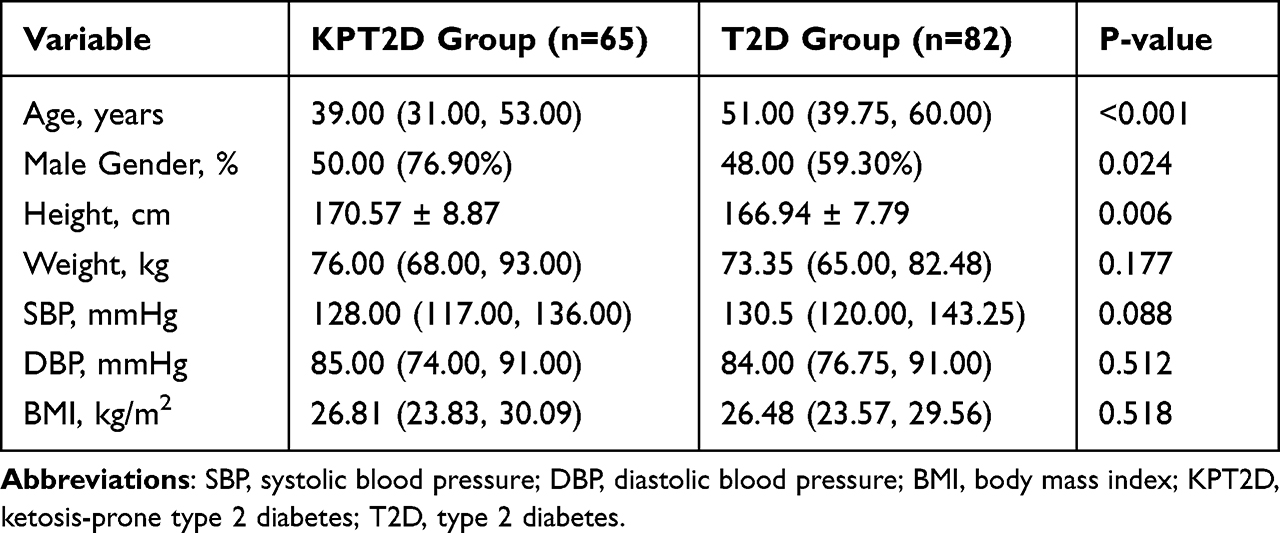 |
Table 2 Comparison of Clinical Characteristics and Anthropometric Features |
Comparison of Biochemical Analysis Between the Groups
Compared with subjects with T2D, the levels of GFR (P = 0.035), FBG (P < 0.001), and HbA1c (P < 0.001) were increased in subjects with KPT2D (Table 3). The total protein (P = 0.029), fasting insulin (P = 0.001), FCP (P < 0.001), and HOMA-β (P < 0.001) were significantly decreased in the KPT2D group than in the T2D group. No significant differences in ALT, ALB, AST, GGT, SCr, BUN, UA, and HOMA-IR between the 2 groups.
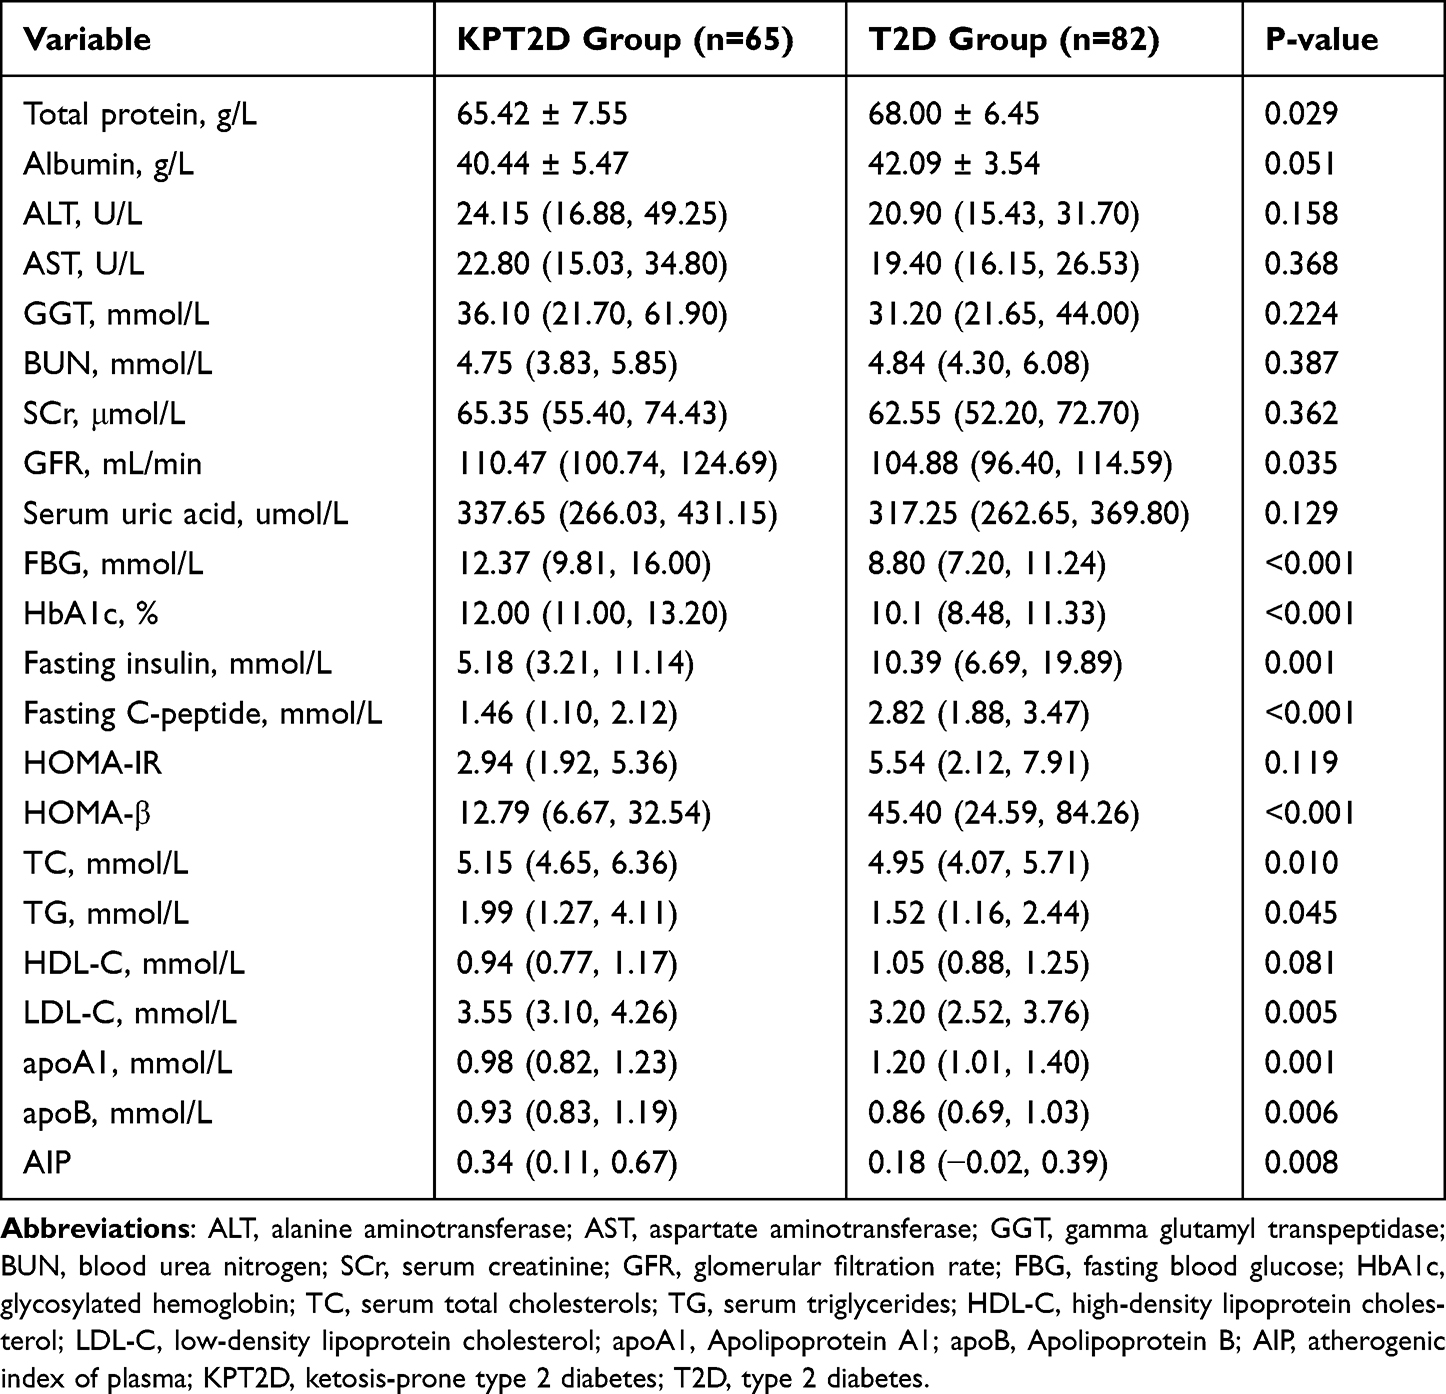 |
Table 3 Comparison of Biochemical Analysis Between the Groups |
AIP (P = 0.008) was significantly increased in the KPT2D than in the T2D. The TC (P = 0.010), TG (P = 0.045), LDL-C (P = 0.005), and apoB (P = 0.006) were significantly increased in participants with KPT2D than in participants with T2D, while apoA1 (P = 0.001) was decreased. No significant difference was seen in HDL-C level between subjects with KPT2D and those with T2D.
Subgroup Analysis Between KPT2D and T2D Groups
According to the AIP level, the KPT2D group and the T2D group were further divided into AIP ≥ 0.24 and AIP < 0.24 groups, respectively (Figure 1). The percentage of subjects with AIP ≥ 0.24 was significantly elevated in participants in KPT2D group compared with the T2D (P = 0.026).
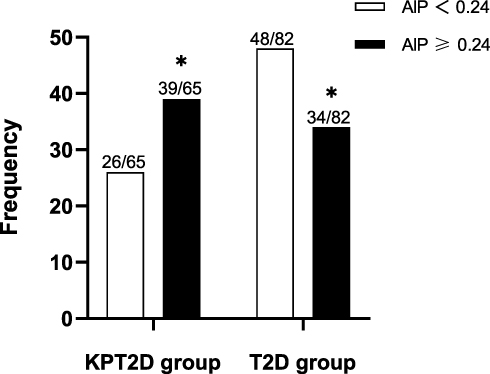 |
Figure 1 Subgroup analysis between KPT2DM and T2D groups. P = 0.026. *P<0.05. Abbreviations: AIP, atherogenic index of plasma; KPT2D, ketosis-prone type 2 diabetes; T2D, type 2 diabetes. |
Correlation Analysis of Plasma Ketones and Lipid-Related Parameters in Patients with KPT2D
Figure 2 showed the association between the plasma ketones and AIP in subjects with KPT2D. In the KPT2D group, plasma ketones showed a significant positive correlation with AIP (R = 0.345, P = 0.023).
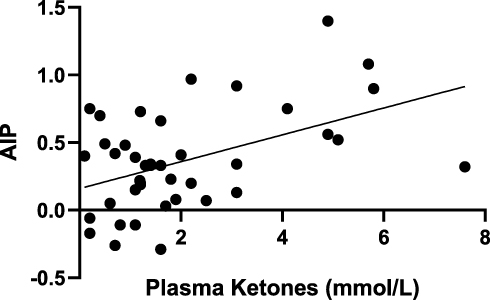 |
Figure 2 Correlation Analysis of Plasma Ketones and AIP in Patients with KPT2D. R = 0.345 P = 0.023. Abbreviation: AIP, atherogenic index of plasma. |
(Figure 3A) shows the relationship between plasma ketones and apoA1 in patients with KPT2D (R = −0.460, P = 0.002). (Figure 3B) shows the relationship between plasma ketones and apoB in subjects with KPT2D (R = −0.142, P = 0.363).
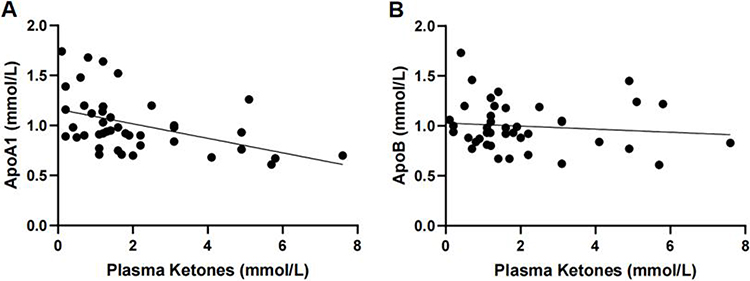 |
Figure 3 (A) Correlation Analysis of Plasma Ketones and ApoA1 in Patients with KPT2D. R = −0.460 P = 0.002. (B) Correlation Analysis of Plasma Ketones and ApoB in Patients with KPT2D. R = −0.142 P = 0.363. Abbreviations: ApoA1, Apolipoprotein A1; ApoB, Apolipoprotein B. |
Univariate Logistic Regression Analysis of the Relationship Between Plasma Ketones and AIP
Univariate logistic regression suggested that plasma ketones levels were a risk factor for AS in subjects with KPT2D (OR 1.708 [95% Cl 1.018–2.865], P = 0.043) (Table 4).
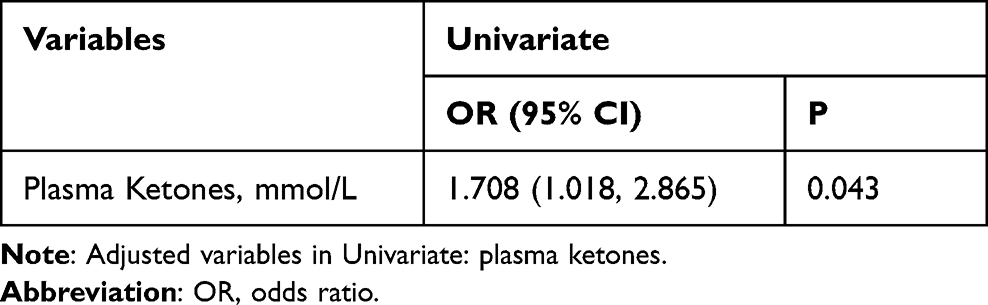 |
Table 4 Parameters of the Binary Logistic Regression Model |
Multiple Linear Regression of AIP and Relevant Indicators in KPT2D Patients
As shown in Table 5, for the KPT2D group, plasma ketones were positively correlated with AIP in the crude Model 1 (P = 0.001), Model 2 (P = 0.011) (adjusted for height, age, and gender), Model 3 (P = 0.038) (adjusted for height, age, gender, total protein, and GFR) and Model 4 (P = 0.020) (adjusted for height, age, gender, total protein, GFR, FBG, and HbA1c).
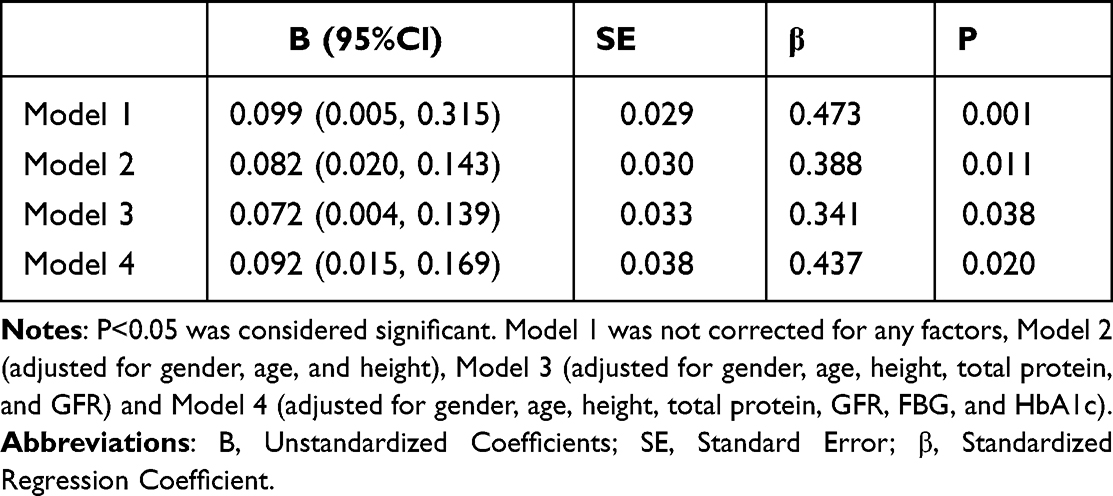 |
Table 5 Multiple Linear Regression of AIP and Relevant Indicators in KPT2D Patients |
Multiple Linear Regression of apoA1 and Relevant Indicators in KPT2D Patients
As shown in Table 6, for the KPT2D group, plasma ketones were negatively correlated with apoA1 in the crude Model 1 (P = 0.003), Model 2 (P = 0.021) (adjusted for age, gender, and BMI), Model 3 (P = 0.027) (adjusted for age, gender, BMI, AIP, apoB, LDL, and HDL) and Model 4 (P = 0.033) (adjusted for age, gender, BMI, AIP, apoB, LDL, HDL, FBG, and HbA1c).
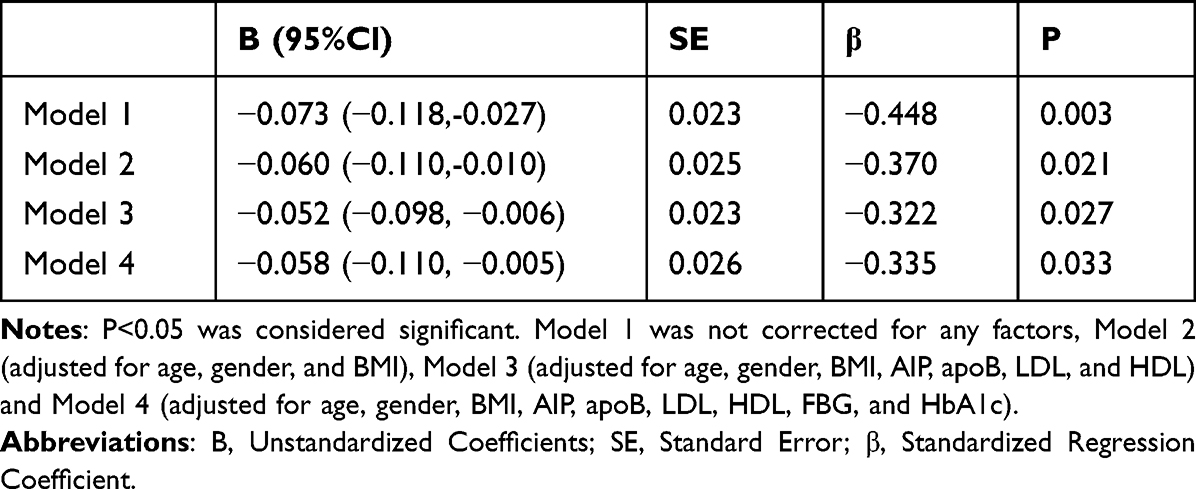 |
Table 6 Multiple Linear Regression of apoA1 and Relevant Indicators in KPT2D Patients |
Discussion
AS is one of the most common macrovascular complications of diabetes and can increase the risk of cardiovascular events such as myocardial infarction, stroke and death. Metabolic changes in diabetes can also accelerate the development of AS.17 It has been shown that AIP is significantly associated with lipoprotein particle size. AIP can be considered as an indicator of atherogenic lipoprotein status.13 Many evidences suggest that AIP is an important predictor of AS. The higher the AIP, the smaller the diameter of the small, dense low-density lipoprotein cholesterol (sdLDL) particles and the higher the risk of vascular sclerosis. The sdLDL can be replaced by AIP.18 In our study, the results suggested that the mean AIP was elevated than 0.11 in both KPT2D and T2D patients. This indicates that diabetic patients have a higher risk of atherosclerosis. AIP was significantly elevated in subjects with KPT2D than in subjects with T2D. Compared with the T2D group, the percentage of AIP above 0.24 was elevated in the KPT2D group. Our results suggested that patients with KPT2D may have a higher risk of AS compared to patients with T2D. This is the first study to explore the association between ketosis or ketoacidosis onset and AIP in KPT2D.
There are relatively few studies on the relationship between patients with KPT2D and AS. In those studies, the results were also inconsistent. In a cross-sectional study, the prevalence of carotid AS in participants with KPT2D was similar to that in participants with T2D, excluding age and gender factors.19 Li et al showed that the prevalence of lower limb AS in patients with KPT2D was similar to that of patients with T2D.20 However, in most hospitalized diabetic patients, carotid and lower limb ultrasonography is used to assess macrovascular disease. However, most previous studies have been based on imaging of a single region, which may underestimate the severity of AS. Wang et al indicated that the KPT2D group was positively associated with AS after adjusting for sex and age. After age-matching the KPT2D group to the T2D group, the prevalence of (lower limb or carotid) AS was significantly increased in participants with the KPT2D than in participants with T2D.21 They suggested that ketosis maybe play an important part in the progression of AS.
To assess the relationship between ketosis episodes and AIP in the KPT2D group, further results of this study showed that plasma ketones were positively correlated with AIP. The results of Univariate logistic regression suggested that plasma ketones levels are a risk factor for elevated AIP levels. Multiple linear regression showed that plasma ketones levels during ketosis episodes in the KPT2D group were significantly and positively correlated with AIP. Our results suggested that ketosis episodes in patients with KPT2D may increase the risk of AS.
Hyperketonemia is mainly caused by elevated blood acetoacetate, β-hydroxybutyrate, and acetone.22 We all know that endothelial cells play an important part in maintaining the function of blood vessels.23 Studies have demonstrated that lipid peroxidation in diabetic patients increases the evolutionary process of AS.24,25 In a previous study to determine whether blood ketones can generate oxygen free radicals, human umbilical vein endothelial cells (HUVEC) and ketone bodies (acetoacetate, β-hydroxybutyrate) were incubated at 37°C for 24 h and studied using a cell-free buffer solution. The results showed that acetoacetic acid produced superoxide anion radicals that caused elevated lipid peroxidation and growth suppression in HUVEC.26 SUSHIL et al showed that lipid peroxidation was significantly elevated in diabetic subjects with hyperketonemia compared to age-matched normal subjects, whereas there was no significant change in lipid peroxidation in non-ketotic diabetic subjects. Ketosis episodes are an important risk factor for elevated lipid peroxidation levels in diabetic patients.6 Thus, recurrent episodes of ketosis or ketoacidosis promote the progression of AS in patients with KPT2D. Prospective studies are demanded to further investigate the association between ketosis episodes and AS in KPT2D patients.
Regarding the lipid profile of KPT2D patients, our study suggested that TC, TG, LDL-C, and apoB in the KPT2D were increased when compared with the T2D, and apoA1 was decreased than in the T2D. This is the same as the results of previous studies. It is well known that the reverse cholesterol transport pathway works by transporting abnormally deposited cholesterol from peripheral tissue cells (including foam cells in atherosclerotic plaques) to the liver for excretion. This is the primary mechanism for inhibiting AS.27 HDL is the only plasma lipoprotein with anti-AS effects. ApoA1, the major structural protein, accounts for approximately 70% of the protein content of HDL.28 A recent study showed that apoA1 was negatively associated with the prevalence of type 2 diabetes and fasting glucose.29 ApoA1 in vivo prevents necrotic prolapse and necrotic core formation in macrophages in atherosclerosis.10 In our study, Correlation analysis and multiple linear regression showed that plasma ketones levels were negatively correlated with apoA1. Du et al suggested that TG, TC, and LDL-C were higher in young KPT2D than in T2D. They also found that 21.4% of male KPT2D patients had serum TG concentrations ≥5.6 mmol/L and 8.3% of male patients had serum TG concentrations ≥11.2 mmol/L2. Ye et al showed that patients with KPT2D were characterized by overweight and obesity. Compared to type 2 diabetes, serum TG levels were significantly higher in KPT2D patients.30 Earlier studies have suggested that Elevated TG leads to an increase in sdLDL particles.31 The sdLDL particles penetrate the vascular endothelium more easily and thus bind to glycoproteins on the vessel wall to form lipid deposits. In addition, sdLDL is also susceptible to oxidation to form oxidized LDL-C, which induces the conversion of monocytes to macrophages through aggregation and other effects. Both of these processes can produce large numbers of foam cells leading to AS. It has been found that sdLDL also slows down the production of antioxidants, thus accelerating the onset of AS.32
In this study regarding the comparison of indicators related to increased glucose levels, our results suggested that FBG and HbA1c were significantly elevated in subjects with KPT2D when compared with subjects with T2D. HOMA-β was significantly lower in patients with KPT2D than in patients with T2D. This indicates that patients with KPT2D had poorer glycemic control than patients with T2D. This is consistent with previous findings.33 Thus, insulin deficiency in patients with KPT2D and hyperglycemia before the disease is diagnosed also promote AS development. Data from many studies suggested that chronic hyperglycemia may lead to disruption of intravascular homeostasis. The mechanism of the link between AS and diabetes has not been directly elucidated.34 Previous studies have shown that hyperglycemia produces many cellular effects, such as high glucose regulation of arachidonic acid metabolism, the elevated release of prostaglandin E2 and thromboxane B, leading to endothelial dysfunction and increased inflammation.35 Furthermore, high glucose may induce 12/15 lipoxygenase expression and increase the level of 12/15 lipoxygenase products in aortic endothelial cells (AECs),35 stimulating monocyte adhesion to AECs. In this condition, oxidized LDL and oxidized phospholipids also mediate their action in AECs through increased arachidonic acid release and subsequent stimulation of the lipoxygenase pathway. In addition, elevated glucose leads to LDL oxidation, while reactive carbonyl groups, advanced glycation end products (AGEs) and advanced lipid oxidation end products may also contribute to the modification of lipids in lipoproteins. The functional properties of endothelial cells regulating nitric oxide (NO) bioavailability are essential for normal endothelial function. Studies have shown that AS preferentially occurs in arterial branches where blood flow is disturbed, resulting in low and oscillatory shear stress. Hyperglycemia exacerbates the impairment of hemodynamic forces, especially shear stress, which usually downregulates NO and leads to altered endothelial phenotype.34 At the same time, the synergistic effect of blood glucose and lipids accelerates the formation of AS in diabetic patients.34
Although this study provides reliable data, it still has some limitations. First, this is a cross-sectional study. We cannot make inferences of causality. Second, the data on subjects included in this study did not have vascular ultrasound results to clarify the prevalence of AS. Third, in this study, the number of subjects was small, and further studies on a larger scale are needed to assess the relationship between patients with KPT2D and AS.
Conclusion
We found that dyslipidemia was more severe in participants with KPT2D. The AIP was increased in participants with KPT2D than in participants with T2D. Ketosis episodes in patients with KPT2D may accelerate the progression of AS.
Acknowledgments
We thank all participants of this research.
Disclosure
The authors declare no conflicts of interest in this work.
References
1. Namitha D, Nusrath A, Asha Rani N, et al. Role of lipid indices in the assessment of microvascular risk in type 2 diabetic retinopathy patients. Cureus. 2022;14(3):e23395. doi:10.7759/cureus.23395
2. Du S, Zhang H, Wu H, Ye S, Li W, Su Q. Prevalence and Gender Differences of Metabolic Syndrome in Young Ketosis-Prone Type 2 Diabetic Individuals: a Retrospective Study. Diabetes Metab Syndr Obes. 2020;13:2719–2727. doi:10.2147/DMSO.S252492
3. He X, Luo Y, Hao J, et al. Association between serum vitamin D levels and ketosis episodes in hospitalized patients with newly diagnosed ketosis-prone type 2 diabetes. Diabetes Metab Syndr Obes. 2022;15:3821–3829. doi:10.2147/DMSO.S389609
4. Zhang M, Li Y, Cui W, et al. The clinical and metabolic characteristics of young-onset ketosis-prone type 2 diabetes in China. Endocr Pract. 2015;21(12):1364–1371. doi:10.4158/EP15778.OR
5. Jiang Y, Zhu J, Lai X. Development and validation of a risk prediction model for ketosis-prone type 2 diabetes mellitus among patients newly diagnosed with type 2 diabetes mellitus in China. Diabetes Metab Syndr Obes. 2023;16:2491–2502. doi:10.2147/dmso.S424267
6. Jain SK, McVie R, Jackson R, Levine SN, Lim G. Effect of hyperketonemia on plasma lipid peroxidation levels in diabetic patients. Diabetes Care. 1999;22(7):1171–1175. doi:10.2337/diacare.22.7.1171
7. Gebreyesus HA, Abreha GF, Besherae SD, et al. High atherogenic risk concomitant with elevated HbA1c among persons with type 2 diabetes mellitus in North Ethiopia. PLoS One. 2022;17(2):e0262610. doi:10.1371/journal.pone.0262610
8. Wang JW, Wang AP, Chen MY, et al. Prevalence and clinical characteristics of hypertension and metabolic syndrome in newly diagnosed patients with ketosis-onset diabetes: a cross-sectional study. Diabetol Metab Syndr. 2019;11:31. doi:10.1186/s13098-019-0426-x
9. Zhang X, Zhang X, Li X, Feng J, Chen X. Association of metabolic syndrome with atherogenic index of plasma in an urban Chinese population: a 15-year prospective study. Nutr Metab Cardiovasc Dis. 2019;29(11):1214–1219. doi:10.1016/j.numecd.2019.07.006
10. Kluck GEG, Qian AS, Sakarya EH, Quach H, Deng YD, Trigatti BL. Apolipoprotein A1 protects against necrotic core development in atherosclerotic plaques: PDZK1-dependent high-density lipoprotein suppression of necroptosis in macrophages. Arterioscler Thromb Vasc Biol. 2023;43(1):45–63. doi:10.1161/ATVBAHA.122.318062
11. Xu X, Song Z, Mao B, Xu G, Garcia V. Apolipoprotein A1-related proteins and reverse cholesterol transport in antiatherosclerosis therapy: recent progress and future perspectives. Cardiovasc Ther. 2022;2022:1–9. doi:10.1155/2022/4610834
12. Chou YC, You SL, Bai CH, Liao YC, Wei CY, Sun CA. Utility of apolipoprotein measurements in predicting incident type 2 diabetes: a Chinese cohort study. J Formos Med Assoc. 2020;119(1 Pt 1):51–58. doi:10.1016/j.jfma.2019.03.001
13. Niroumand S, Khajedaluee M, Khadem-Rezaiyan M, et al. Atherogenic Index of Plasma (AIP): a marker of cardiovascular disease. Med J Islam Repub Iran. 2015;29:240. doi:10.1186/1476-511X-6-1
14. Akdogan M, Ustundag-Budak Y, Huysal K. The association of hematologic inflammatory markers with atherogenic index in type 2 diabetic retinopathy patients. Clin Ophthalmol. 2016;10:1797–1801. doi:10.2147/OPTH.S110749
15. Yi Q, Ren Z, Bai G, et al. The longitudinal effect of the atherogenic index of plasma on type 2 diabetes in middle-aged and older Chinese. Acta Diabetol. 2022;59(2):269–279. doi:10.1007/s00592-021-01801-y
16. Landowska M, Zebrowska A, Fajer K, et al. Atherosclerosis risk factors in patients with reactive hypoglycemia. Diabetes Metab Syndr Obes. 2022;15:3133–3142. doi:10.2147/DMSO.S371706
17. Haas AV, McDonnell ME. Pathogenesis of cardiovascular disease in diabetes. Endocrinol Metab Clin North Am. 2018;47(1):51–63. doi:10.1016/j.ecl.2017.10.010
18. Zhu L, Lu Z, Zhu L, et al. Lipoprotein ratios are better than conventional lipid parameters in predicting coronary heart disease in Chinese Han people. Kardiol Pol. 2015;73(10):931–938. doi:10.5603/KP.a2015.0086
19. Li LX, Zhao CC, Ren Y, et al. Prevalence and clinical characteristics of carotid atherosclerosis in newly diagnosed patients with ketosis-onset diabetes: a cross-sectional study. Cardiovasc Diabetol. 2013;12:18. doi:10.1186/1475-2840-12-18
20. Li MF, Ren Y, Zhao CC, et al. Prevalence and clinical characteristics of lower limb atherosclerotic lesions in newly diagnosed patients with ketosis-onset diabetes: a cross-sectional study. Diabetol Metab Syndr. 2014;6:71. doi:10.1186/1758-5996-6-71
21. Wang Y, Lu C, Augusto Monteiro Cardoso Lopes M, et al. A cross-sectional study of atherosclerosis in newly diagnosed patients with ketosis-prone type 2 diabetes. Diabetes Metab Syndr Obes. 2022;15:933–941. doi:10.2147/DMSO.S349467
22. Kanikarla-Marie P, Jain SK. Hyperketonemia and ketosis increase the risk of complications in type 1 diabetes. Free Radic Biol Med. 2016;95:268–277. doi:10.1016/j.freeradbiomed.2016.03.020
23. Chappey O, Wautier MP, Boval B, Wautier JL. Endothelial cells in culture: an experimental model for the study of vascular dysfunctions. Cell Biol Toxicol. 1996;12(4–6):199–205. doi:10.1007/BF00438146
24. Alharby H, Abdelati T, Rizk M, et al. Association of lipid peroxidation and interleukin-6 with carotid atherosclerosis in type 2 diabetes. Cardiovasc Endocrinol Metab. 2019;8(3):73–76. doi:10.1097/XCE.0000000000000175
25. Ito F, Sono Y, Ito T. Measurement and clinical significance of lipid peroxidation as a biomarker of oxidative stress: oxidative stress in diabetes, atherosclerosis, and chronic inflammation. Antioxidants. 2019;8:
26. Velusamy T, Jain SK. Effects of high glucose and ketosis (acetoacetate, ss-hydroxybutyrate) on PAI-1 secretion in human umbilical vascular endothelial cells. Clin Appl Thromb Hemost. 2011;17(3):288–292. doi:10.1177/1076029610366434
27. Ouimet M, Barrett TJ, Fisher EA. HDL and reverse cholesterol transport. Circ Res. 2019;124(10):1505–1518. doi:10.1161/circresaha.119.312617
28. Ben-Aicha S, Badimon L, Vilahur G. Advances in HDL: much more than lipid transporters. Int J Mol Sci. 2020;21:
29. Gao L, Zhang Y, Wang X, Dong H. Association of apolipoproteins A1 and B with type 2 diabetes and fasting blood glucose: a cross-sectional study. BMC Endocr Disord. 2021;21(1). doi:10.1186/s12902-021-00726-5
30. Ye S, Ran H, Zhang H, et al. Elevated serum triglycerides are associated with ketosis-prone type 2 diabetes in young individuals. Diabetes Metab Syndr Obes. 2021;14:497–504. doi:10.2147/DMSO.S296085
31. Kawakami A, Aikawa M, Alcaide P, Luscinskas FW, Libby P, Sacks FM. Apolipoprotein CIII induces expression of vascular cell adhesion molecule-1 in vascular endothelial cells and increases adhesion of monocytic cells. Circulation. 2006;114(7):681–687. doi:10.1161/CIRCULATIONAHA.106.622514
32. Huang Y, Hu Y, Mai W, et al. Plasma oxidized low-density lipoprotein is an independent risk factor in young patients with coronary artery disease. Dis Markers. 2011;31(5):295–301. doi:10.3233/DMA-2011-0832
33. Zhu B, Bu L, Zhang M, et al. HbA1c as a screening tool for ketosis in patients with type 2 diabetes mellitus. Sci Rep. 2016;6:39687. doi:10.1038/srep39687
34. Sala L PF L, Ceriello A, Ceriello A. The link between diabetes and atherosclerosis. Eur J Prev Cardiol. 2019;26(2_suppl):15–24. doi:10.1177/2047487319878373
35. Patricia MK, Natarajan R, Dooley AN, et al. Adenoviral delivery of a leukocyte-type 12 lipoxygenase ribozyme inhibits effects of glucose and platelet-derived growth factor in vascular endothelial and smooth muscle cells. Circ Res. 2001;88(7):659–665. doi:10.1161/hh0701.088838
 © 2023 The Author(s). This work is published and licensed by Dove Medical Press Limited. The
full terms of this license are available at https://www.dovepress.com/terms
and incorporate the Creative Commons Attribution
- Non Commercial (unported, 3.0) License.
By accessing the work you hereby accept the Terms. Non-commercial uses of the work are permitted
without any further permission from Dove Medical Press Limited, provided the work is properly
attributed. For permission for commercial use of this work, please see paragraphs 4.2 and 5 of our Terms.
© 2023 The Author(s). This work is published and licensed by Dove Medical Press Limited. The
full terms of this license are available at https://www.dovepress.com/terms
and incorporate the Creative Commons Attribution
- Non Commercial (unported, 3.0) License.
By accessing the work you hereby accept the Terms. Non-commercial uses of the work are permitted
without any further permission from Dove Medical Press Limited, provided the work is properly
attributed. For permission for commercial use of this work, please see paragraphs 4.2 and 5 of our Terms.
Recommended articles
The SELP, CD93, IL2RG, and VAV1 Genes Associated with Atherosclerosis May Be Potential Diagnostic Biomarkers for Psoriasis
Liu S, Liu F, Zhang Z, Zhuang Z, Yuan X, Chen Y
Journal of Inflammation Research 2023, 16:827-843
Published Date: 27 February 2023
Association Between the Atherogenic Index of Plasma and 90-Day Clinical Prognosis in Patients with Acute Pontine Infarction: A Single Center Study
Cheng Y, Wang Q, Sun C, Cui D
International Journal of General Medicine 2024, 17:3453-3463
Published Date: 12 August 2024
The Role of Neutrophil Extracellular Traps in Atherosclerosis: From the Molecular to the Clinical Level

Yuan Y, Sun C, Liu X, Hu L, Wang Z, Li X, Zhang J, Li D, Zhang X, Wu M, Liu L
Journal of Inflammation Research 2025, 18:4421-4433
Published Date: 26 March 2025