")
Back to Journals » OncoTargets and Therapy » Volume 10
HIF pathway and c-Myc as biomarkers for response to sunitinib in metastatic clear-cell renal cell carcinoma
Authors Maroto P, Esteban E, Fernández Parra E, Mendez-Vidal MJ, Domenech M, Pérez-Valderrama B, Calderero V, Pérez-Gracia JL , Grande E, Algaba F
Received 22 March 2017
Accepted for publication 6 July 2017
Published 20 September 2017 Volume 2017:10 Pages 4635—4643
DOI https://doi.org/10.2147/OTT.S137677
Checked for plagiarism Yes
Review by Single anonymous peer review
Peer reviewer comments 2
Editor who approved publication: Dr Faris Farassati
P Maroto,1 E Esteban,2 E Fernández Parra,3 MJ Mendez-Vidal,4 M Domenech,5 B Pérez-Valderrama,6 V Calderero,7 JL Pérez-Gracia,8 E Grande,9 F Algaba10
1Department of Oncology, Hospital de la Santa Creu i Sant Pau, Barcelona, 2Department of Oncology, Nuevo HUCA, Oviedo, 3Department of Oncology, H. U. Nuestra Señora de Valme, Sevilla, 4Department of Oncology, H. U. Reina Sofía, Córdoba, 5Department of Oncology, Hospital de Althaia Xarxa Asistencial Manresa, Barcelona, 6Department of Oncology, H. U. Virgen del Rocio, Sevilla, 7Department of Oncology, H. Fundación Miguel Servet, Zaragoza, 8Department of Oncology, Clinica Universitaria de Pamplona, Pamplona, 9Department of Oncology, H. Ramón y Cajal, Madrid, 10Pathology Unit, Fundació Puigvert, Universitat Autònoma de Barcelona, Barcelona, Spain
Background: Clear-cell renal cell carcinoma (ccRCC) is a heterogeneous disease with a different clinical behavior and response to targeted therapies. Differences in hypoxia-inducible factor (HIF) expression have been used to classify von Hippel–Lindau gene (VHL)-deficient ccRCC tumors. c-Myc may be driving proliferation in HIF-2α-expressing tumors in a growth factor-independent manner.
Objective: To explore the HIF-1α, HIF-2α and c-Myc baseline expression as potential predictors of sunitinib outcome as well as the effectiveness and safety with sunitinib in patients with metastatic ccRCC in routine clinical practice.
Methods: This was an observational and prospective study involving 10 Spanish hospitals. Formalin-fixed, paraffin-embedded primary tumor samples from metastatic ccRCC patients who received sunitinib as first-line treatment were analyzed. Association between biomarker expression and sunitinib treatment outcomes was evaluated. Kaplan–Meier method was applied to measure progression-free survival (PFS) and overall survival.
Results: Eighty-one patients were included: median PFS was 10.8 months (95% CI: 7.4–13.5 months), median overall survival was 21.8 months (95% CI: 14.7–29.8 months) and objective response rate was 40.7%, with 7.4% of patients achieving a complete response. Molecular marker staining was performed in the 69 available tumor samples. Significant association with lower PFS was identified for double c-Myc/HIF-2α-positive staining tumors (median 4.3 vs 11.5 months, hazard ratio =2.64, 95% CI: 1.03–6.80, P=0.036). A trend toward a lower PFS was found in positive c-Myc tumors (median 5.9 vs 10.9 months, P=0.263). HIF-1α and HIF-2α expression levels were not associated with clinical outcome.
Conclusion: These preliminary results suggest that predictive subgroups might be defined based on biomarkers such as c-Myc/HIF-2α. Further validation with more patients will be needed in order to confirm it. Outcomes with sunitinib in metastatic ccRCC in daily clinical practice resemble those obtained in clinical trials.
Keywords: c-Myc, clear-cell renal cell carcinoma, HIF, sunitinib
Introduction
Clear-cell renal cell carcinoma (ccRCC) is the most common type of adult kidney cancer. Local recurrence or distant metastasis develops in up to 40% of the patients treated for localized tumors.1,2
Despite the solid molecular and genetic background of antiangiogenic therapy in renal cell carcinoma (RCC), predictive biomarkers of response have not been identified. A few studies that concentrated on the genomic biomarkers and their impact on anti-vascular endothelial growth factor (anti-VEGF) targeted therapies have been reported.3–5 New tools are needed to identify the most suitable drug for an individual patient; they are especially important nowadays due to the availability of new drugs for the treatment of RCC.6,7
Mutation or silencing of the von Hippel–Lindau gene (VHL) occurs in nearly 80% of sporadic ccRCC tumors.8–10 Through its oxygen-dependent polyubiquitylation of hypoxia-inducible factors (HIFs), the VHL tumor suppressor protein (pVHL) plays a central role in the mammalian oxygen-sensing pathway.11 In the absence of pVHL, HIF subunits (HIF-1α and HIF-2α) are stabilized, translocate to the nucleus, dimerize with the stable β-subunit (ARNT) and promote the expression of their target genes12 such as vascular endothelial growth factor (VEGF) and platelet-derived growth factor (PDGF). HIF-1α and HIF-2α have overlapping effects on angiogenesis, invasion and metabolism, all of which contribute to tumor growth and progression, but each isoform also has unique targets.13 HIF-1α uniquely activates glycolytic enzyme genes, while HIF-2α preferentially activates transforming growth factor-α and Oct4 and promotes c-Myc transcriptional activity.14,15
In spite of the tremendous correlation of ccRCC with loss or inactivation of VHL, the effect on HIF deregulation is not uniform.16 Differences in HIF expression have been used to classify VHL-deficient ccRCC tumors into two subtypes, with one subtype expressing both HIF-1α and HIF-2α and another expressing only HIF-2α.13,17 These data show that ccRCC is a heterogeneous disease with a different clinical behavior and a different response to available targeted therapies.13,17
Sunitinib malate is a highly potent, selective inhibitor of certain protein tyrosine kinases including PDGFR-α and PDGFR-β; VEGF-1, VEGF-2 and VEGF-3; stem cell factor KIT receptor and FLT3.18–20 It is a standard of care for first-line treatment of metastatic ccRCC.21,22
Currently, predictive biomarkers for response to sunitinib are still lacking. This study assesses the value of HIF-1α, HIF-2α and c-Myc as potential molecular predictors of benefit from sunitinib as first-line treatment for metastatic ccRCC as well as the effectiveness outcomes in routine clinical practice.
Materials and methods
This is an observational and prospective study involving 10 Spanish hospitals. Enrolled patients had a centralized pathologically confirmed diagnosis of metastatic RCC with a component of clear cell histology and received sunitinib as first-line treatment. Effectiveness data were prospectively assessed and retrospectively correlated with the expression of biomarkers of primary tumor samples.
All patients provided their written informed consent for this study. In accordance with the Spanish recommendations, the study was approved by the Ethics Committee of Santa Creu i Sant Pau Hospital, Central of Asturias Hospital (HUCA), Reina Sofía Hospital, Althaia Xarxa Asistencial de Manresa Hospital, Virgen del Rocio Hospital, Fundation Miguel Servet Hospital, Universitary Clinic of Navarra and Clinico Universitario de Santiago Hospital, and it was conducted in compliance with the principles contained in the Declaration of Helsinki.
Tumor response was monitored according to normal clinical practice and assessed according to Response Evaluation Criteria in Solid Tumors.23 Tumor assessments were done as per local standard pattern of care for metastatic RCC. Safety and tolerability were assessed throughout treatment. Adverse events (AEs) were rated according to the National Cancer Institute for Adverse Events version 3.0 (NCI CTCAE v3.0.) and version 4.0 once it became available.
Sunitinib was administered orally at 50 mg/day (4 weeks on/2 weeks off). Drug reductions and drug interruptions were under label. Treatment continued until disease progression, unacceptable toxicity or withdrawal of consent.
Immunohistochemistry
Tumor samples were available for 69 out of 81 patients. Formalin-fixed, paraffin-embedded primary tumor tissue samples were analyzed in the molecular analysis. Hematoxylin and eosin-stained sections of each tumor sample were examined by an experienced pathologist to confirm the diagnosis and to select the representative areas of preserved clear-cell histology. Two tissue microarrays with two to six tissue cores per tumor were constructed. Immunohistochemistry (IHC) was performed on 4–5 μm tissue microarray sections. Antibodies were applied to sections at 1:8000 dilution for HIF-1α (Cell Signaling), 1:500 dilution for HIF-2α (Nous Biologicals) and 1:300 dilution for c-Myc (DD Biosciences). Assays were conducted following the manufacturers’ instructions.
Molecular assessments of selected biomarkers were performed at the Pathology Laboratory of the Puigvert Foundation (Barcelona, Spain). C-Myc and HIF staining were assessed in the nucleus. IHC staining was considered positive in all cases with strong reactivity in any proportion ≥1%, except in the case of isolated cells.
Human placenta and thyroid gland were used as positive controls and tumor stroma as negative control. Staining was evaluated by an expert pathologist in the field, who was blinded to clinical information.
Statistical analysis
Median progression-free survival (PFS) and overall survival (OS) were estimated by the Kaplan–Meier method and survival distribution functions compared with the log-rank test. Objective response rate (ORR) was defined as the number of complete responses (CRs) or partial responses (PRs), and clinical benefit rate (CBR) was defined as the percentage of patients with advanced or metastatic cancer who have achieved CR, PR and stable disease. Patients were grouped according to the prognostic risk category on the basis of the Memorial Sloan-Kettering Cancer Center (MSKCC)24 criteria: favorable (0 risk factors), intermediate (1–2 risk factors) and poor (≥3 risk factors). The Heng classification was not universally applied at the time the study was designed. Association between biomarkers’ expression and sunitinib treatment outcomes was evaluated. Tests were two-tailed with a significance level of 5%. Data were analyzed using SPSS statistical software v17.0 (SPSS Inc., Chicago, IL, USA).
Results
A total of 81 patients with metastatic ccRCC were included from February 2008 to December 2010. Seventy-four tumors presented clear-cell histology and seven presented mixed histology with a clear-cell component. Table 1 summarizes the patient characteristics. The majority were men (66.7%) who had undergone prior nephrectomy (83.9%) and had an intermediate–poor prognostic risk according to MSKCC criteria (70.3%). Thirteen (16.0%) patients had an Eastern Cooperative Oncology Group performance status of ≥2. Lung was the most common site of metastasis (77.8%) and 4.9% of the patients presented brain metastases (Table 1). Forty-nine (60.5%) of the patients presented a time interval of <1 year between diagnosis and treatment.
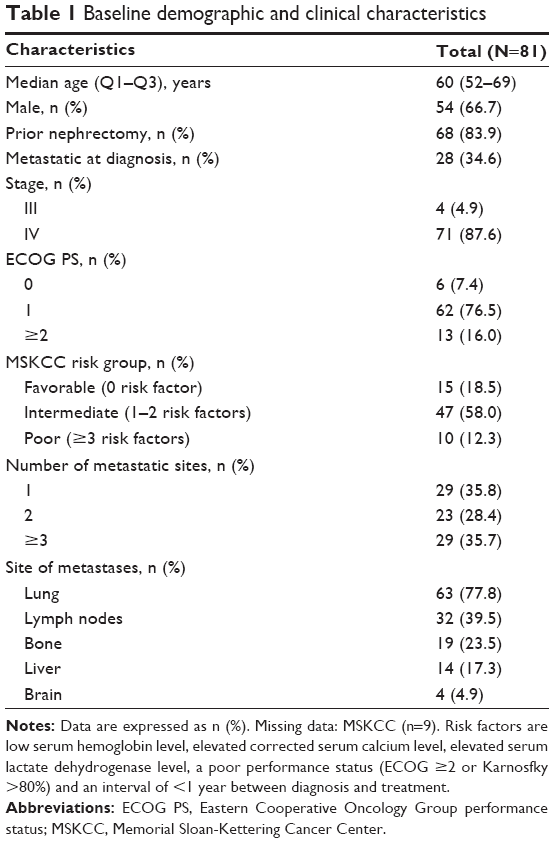 | Table 1 Baseline demographic and clinical characteristics |
Nonsignificant differences regarding baseline characteristics were found between positive and negative biomarker groups (Tables 2 and 3) with the exception of differences in the metastatic patient rate at diagnosis in the nuclear Myc/HIF-2α-positive group and the group of patients with at least Myc or HIF-2α-positive (80.0% vs 27.7%, P=0.0312; Table 3).
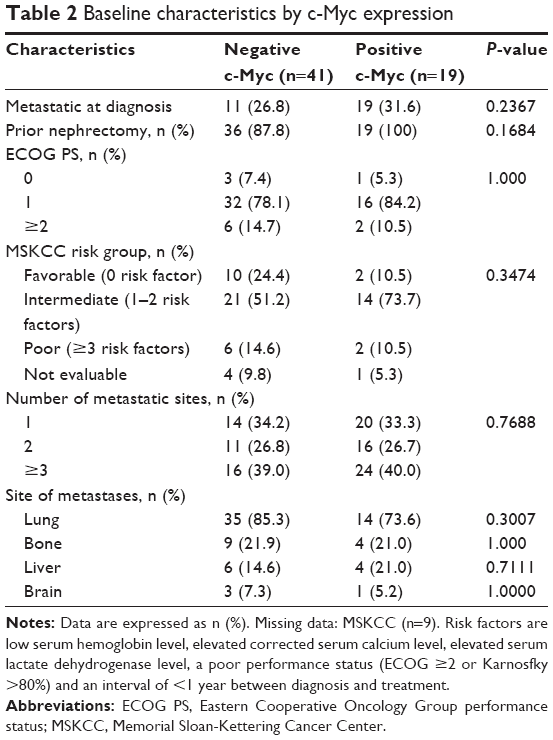 | Table 2 Baseline characteristics by c-Myc expression |
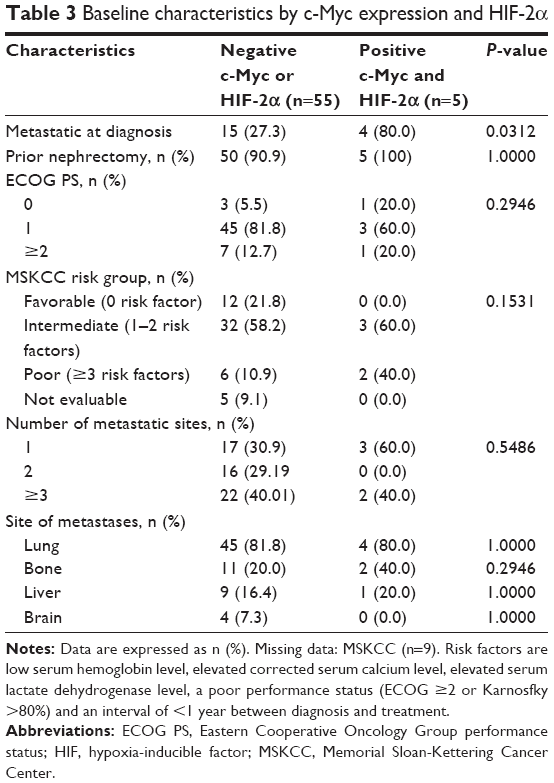 | Table 3 Baseline characteristics by c-Myc expression and HIF-2α |
Efficacy and safety in the overall population
At a median follow-up of 32.4 months (95% CI: 28.2–38.4), the median PFS for all patients was 10.8 months (95% CI: 7.4–13.5), as shown in Figure 1A. Seventy-two out of 81 patients reported were evaluable for PFS according to the MKSCC risk criteria. MSKCC risk group was not reported for nine patients. Median PFS for favorable, intermediate and poor risk groups was 11.5 months (95% IC: 6.0–not reached [NR]), 10.8 months (95% CI: 6.7–17.8) and 8.6 months (95% CI: 0.6–10.9), respectively (P=0.1131); also, poor risk vs favorable: hazard ratio (HR) 2.64 (1.02, 6.79) and intermediate risk vs favorable: HR 1.36 (0.68, 2.75), as shown in Figure 1B.
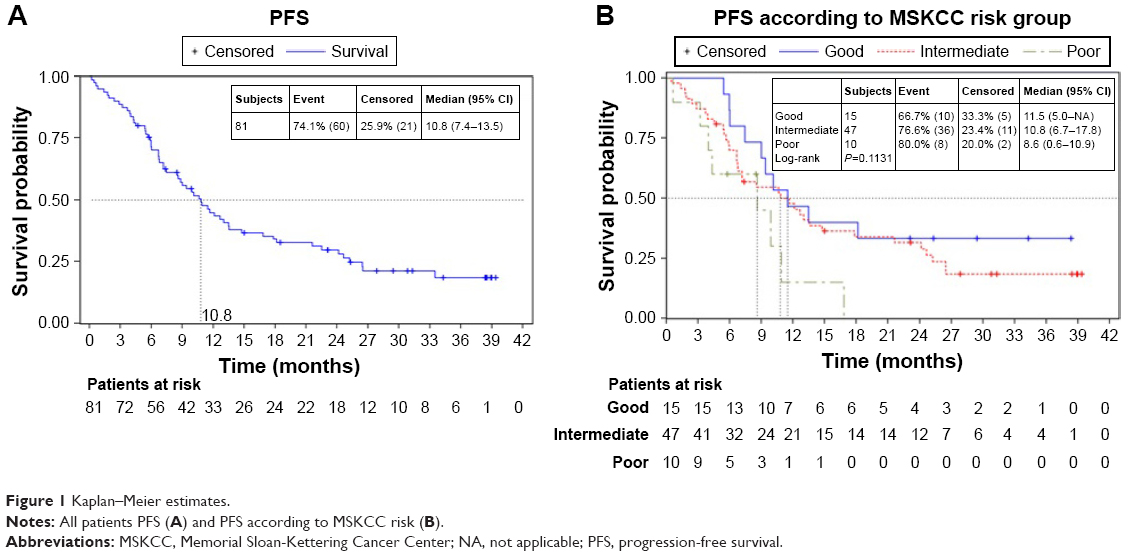 | Figure 1 Kaplan–Meier estimates. |
At the time of analyses, 50 (61.7%) patients had died. Median OS was 21.8 months (95% CI: 14.7–29.8). Median OS for favorable, intermediate and poor risk groups according to MKSCC criteria was 33.4 months (95% IC: 18–NR), 21.8 months (95% CI: 13.8–35) and 10.7 months (95% CI: 0.6–21.6), respectively (P=0.010); also, poor risk vs favorable: HR 4.48 (1.58, 12.64) and intermediate risk vs favorable: HR 2.01 (0.83, 4.84).
Seventy-four (91%) patients were evaluable for tumor response; 6 (7.4%) patients achieved a CR, 27 (33.3%) a PR and 37 (45.6%) a stable disease (72.9% lasting >6 months and 56.7% lasting >9 months), yielding an ORR of 40.7% (29.9%, 52.2%) and a CBR of 86.4% (77.0%, 93.0%). Table 4 shows the baseline characteristics of patients with CR.
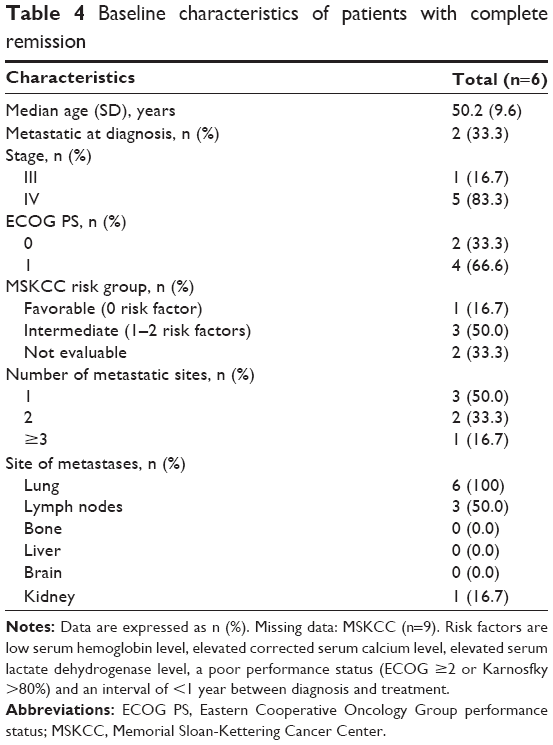 | Table 4 Baseline characteristics of patients with complete remission |
The median duration of sunitinib treatment was 10.5 months (Q1–Q3: 5.8–21.4). At the time of analysis, 68 (83.9%) patients had discontinued treatment, 45 (66.1%) of them due to progressive disease, 12 (17.6%) due to AEs and 4 (5.8%) due to both. Forty-eight (59.2%) patients needed dose reduction at least once. Toxicity was the main reason for dose reduction (87.5%). All patients were treated with the classical schedule 4 weeks on and 2 weeks off, and dose reductions were performed according to label.
Seventy-eight (96.3%) of the total patients experienced at least one treatment-related AE of any severity grade. Overall, most common related AEs were asthenia/fatigue (70.3%), mucosal inflammation (61.7%), hypertension (48.1%) and diarrhea (45.6%), neutropenia (37.0%), thrombocytopenia (32.10%), hand–foot syndrome (30.8%) and hypothyroidism (29.6%). Grade 3 AEs most frequently occurring were asthenia/fatigue (22.2%), diarrhea (8.6%) and hand–foot syndrome (8.6%). Only one case of grade 4 toxicity (mucosal inflammation) was reported.
Molecular markers and clinical outcomes
Molecular marker staining was performed in the 69 available tumor samples with clear cell histology. Of the evaluable tumor samples, 29% (20/62) showed positive staining for HIF-1α, 29% (20/60) for HIF-2α, and 28% (19/60) for nuclear c-Myc, and 8% (5/60) showed double-positive staining for c-Myc and HIF-2α proteins (Figure 2).
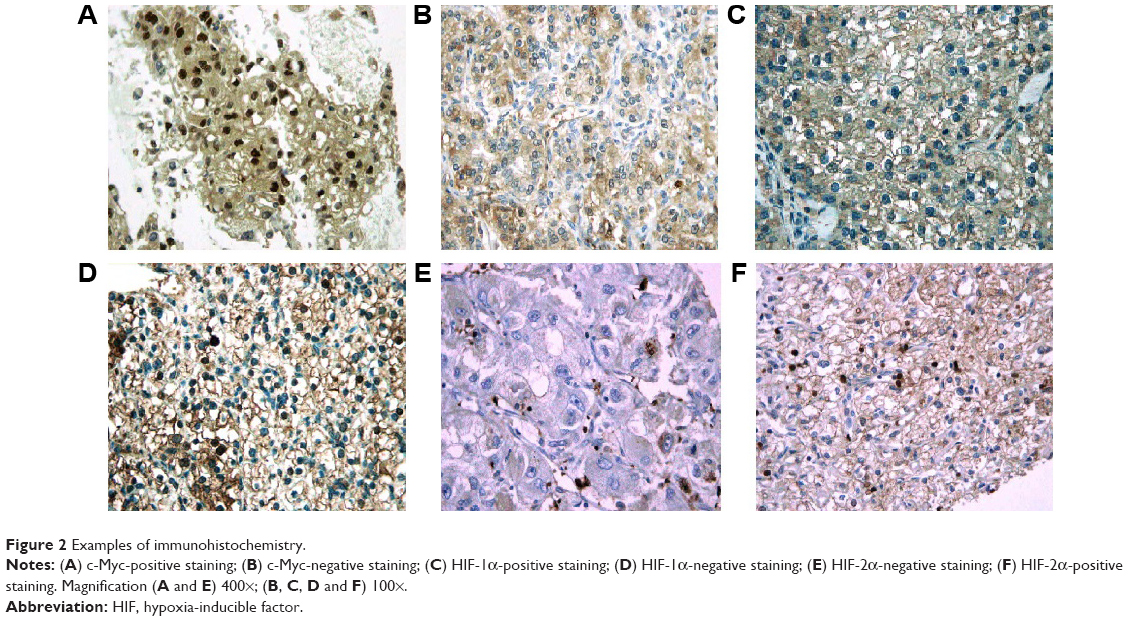 | Figure 2 Examples of immunohistochemistry. |
Numerical but not statistically significant differences were observed regarding the PFS curves between patients bearing tumors with positive or negative c-Myc staining (5.9 vs 10.9 months, HR =1.44, 95% CI: 0.76–2.72, P=0.263) or between favorable/intermediate MSKCC risk patients with positive or negative c-Myc staining (5.9 vs 12.7 months, HR =2.64, 95% CI: 1.03–6.80, P=0.1280), as shown in Figure 3. Significant association with lower PFS was identified for double c-Myc/HIF-2α-positive staining (4.3 vs 11.5 months) in tumors with at least one negative biomarker (HR =2.64, 95% CI: 1.03–6.80, P=0.0360), as shown in Figure 3. With regard to HIF-1α and HIF-2α, no statistically significant differences were found in PFS (median HIF-2α-positive staining 8.5 months vs HIF-2α-negative staining 11.6, HR =1.6, P=0.05; median HIF-1α-positive staining 8.8 months vs HIF-1α-negative staining 11.5, HR =1.32, P>0.05). A similar trend in terms of OS was found in patients with positive staining compared with those with negative tumors for these biomarkers (median OS: c-Myc-positive staining 15.4 vs 24.1 months in negative tumors, HR =1.13, P>0.05; HIF-2α/c-Myc-positive staining 13.3 vs 24.1 months in tumors with at least one negative marker, HR =1.63, P>0.05; HIF-2α-positive staining 13.9 vs 32.8 months in negative tumors, HR =1.77, P>0.05; HIF-1α-positive staining 15 vs 29.5 months in negative tumors, HR =1.80, P>0.05).
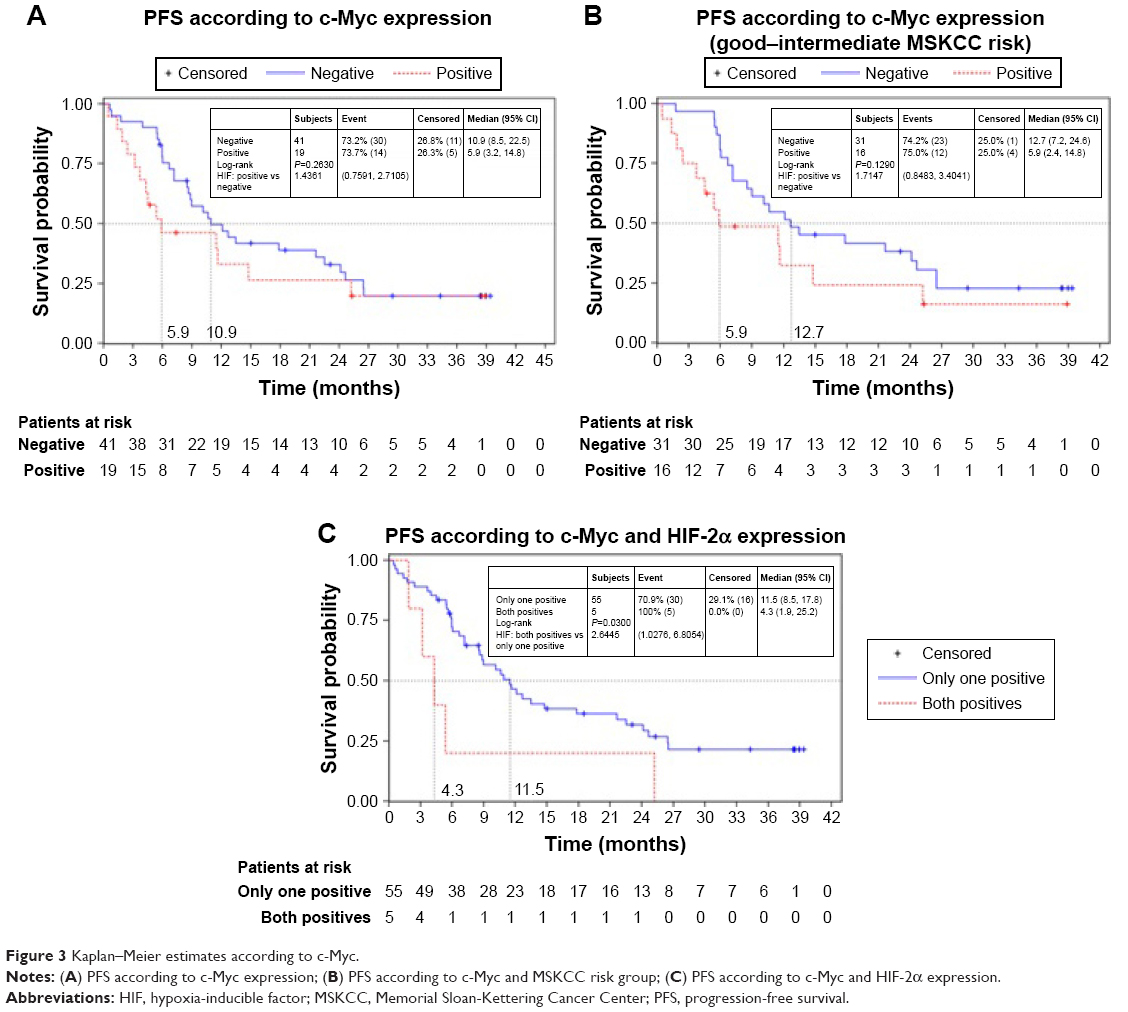 | Figure 3 Kaplan–Meier estimates according to c-Myc. |
Discussion
In this study, primary tumors with double c-Myc/HIF-2α-positive staining were associated with a significantly worst response to sunitinib in patients with mRCC. Meanwhile, analyses from only one biomarker related to HIF pathway have not shown it to be a predictor of response.
The Myc pathway is activated in most cases of human RCC,25 genomically amplified in 5%–10% of patients, overexpressed in 20%10 and associated with a hereditary RCC syndrome.26,27 Vindrieux et al demonstrated that in RCC, loss of VHL tumor suppressor and activation of the oncogenic HIF-2α–c-MYC pathway repress the phospholipase A2 receptor (PLA2R1) expression, which favors RCC tumorigenicity.28 Recently, a study carried out with a conditional transgenic mouse model showed that c-Myc initiates and maintains RCC.29
HIF-1α and HIF-2α influence tumor progression by directly regulating unique and shared target genes. However, recent evidence indicates that these HIF-α proteins also affect tumor progression by exerting distinct, often opposing effects on critical oncogenes and tumor suppressors, including cMyc, p53 and mTOR.15 Particularly, the presence of HIF-1α directly blocks interaction of c-Myc with its DNA-binding partners, whereas HIF-2α might promote c-Myc interaction with Max and, thus, Sp1 and Miz1, by recruiting it directly to these complexes or by stabilizing these complexes once they are formed.14
A molecular classification of ccRCC based on the combination of VHL genotype and HIF-α expression, which could differentiate tumors responding to different targeted therapies (mTOR inhibitors vs tyrosine kinase inhibitors), has been proposed.13 Wild-type VHL tumors, as well as VHL-deficient tumors expressing detectable HIF-1α and HIF-2α proteins, exhibit enhanced Akt/mTOR and ERK/MAPK signaling and are more likely to respond to tyrosine kinase inhibitors.13 In contrast, VHL-deficient tumors expressing only HIF-2α display elevated c-Myc activity, driving proliferation in a growth factor-independent manner and resulting in enhanced proliferation and resistance to replication stress, and may therefore mark a subset of RCCs that are uniquely resistant to the current targeted drugs.13
In this study, we found that tumors with double c-Myc/HIF-2α-positive staining were associated with a significantly lower PFS, which would be in consonance with that hypothesis. In addition, a trend toward worse, but not significant clinical outcomes was found in those patients bearing tumors with positive staining to c-Myc.
Many clinical studies have correlated the presence of either HIF-α subunit with poor patient outcomes. However, each HIF-α may have the potential to be a tumor promoter or suppressor depending on the biology of a given type and its stage of development.14
Here, we also explored the correlation between HIF-α expression and sunitinib activity. In our study, 29% of the samples showed positive staining for HIF-1α or HIF-2α, although this was not associated with clinical response to sunitinib. This is in contrast to data from previous studies that are not published yet in which it was observed that HIF-α levels in tumors were strongly associated with sunitinib efficacy.30,31 These authors suggested that patients with tumors containing a high level of HIF-1α or HIF-2α were more likely to achieve a favorable sunitinib outcome. These findings are consistent with a recent study, where it was suggested that the immunoexpression of HIF-1α might support the prediction of a good response to sunitinib treatment.6 In agreement, Garcia-Donas et al, in an observational and prospective study carried out in 101 ccRCC patients treated with first-line sunitinib, observed that overexpression of HIF-2α was significantly associated with clinical benefit, longer OS and a tendency for longer PFS.32 Conversely, but in consonance with our results, Choueiri et al, in a study conducted in 65 available tumor samples of patients who received pazopanib, did not find any association between the level of expression of HIF-1α or HIF-2α and clinical response to pazopanib.33 As found in our study, treatment benefit differences probably cannot be explained on the basis of one marker only.
On the other hand, our findings, stemming from the usual clinical practice, showed an ORR of 41%, a CBR of 87% and a median PFS of 10.5 months with a safety profile as was expected. These data resemble those obtained in the Phase III pivotal clinical trial with sunitinib.22 The rate of CR with sunitinib in our population was greater than expected (7.4% in our study vs 3% in the Phase III clinical trial), and it could be associated with a good therapy management.
Some limitations of this study have to be addressed. First, compared with data previously reported,13,31,33 there was a lower proportion of tissue tumor samples in which positive expression of the biomarkers analyzed was identified. These studies used different antibodies against HIF-1α and HIF-2α from our study. In addition, we should also bear in mind the variable quality of the tissue sections used for IHC analysis and the techniques used, such as IHC scoring, not employed in daily practice; thus, no consensus criteria for quantification are established yet. Another limitation is the small sample size; despite the fact that baseline characteristics were similar and balanced, the sample size for each tested biomarker was small, particularly for the HIF2-α/c-Myc-positive subset. In addition, it should be borne in mind that intratumor heterogeneity can lead to underestimation of the tumor genomics landscape portrayed from single tumor biopsy samples and may present major challenges to biomarker development.34 Finally, we used tissue from the primary tumor; nowadays, it seems to be more important to analyze what is happening in the metastases rather than in the tumor, considering the neoplasms as a changing entity that can express different biomarkers over time, according to the information provided by the studies with modern immunotherapies.
In conclusion, these preliminary results suggest that predictive subgroups might be defined based on biomarkers such as c-Myc/HIF-2α. Further validation with a larger sample of patients is needed to confirm it.
Acknowledgments
This study was funded by Pfizer, S.L.U. Funding paid by the sponsor was received by Esther Tapia, PhD, for drafting the manuscript. Statistical analyses were provided by Pivotal. The authors are grateful to M Victoria Bolós and Julia Linares from Pfizer and Dr L León for their valuable contribution in all the steps of the study.
Disclosure
The authors report no conflicts of interest in this work.
References
Lam JS, Leppert JT, Belldegrun AS, Figlin RA. Novel approaches in the therapy of metastatic renal cell carcinoma. World J Urol. 2005;23(3):202–212. | ||
Janzen NK, Kim HL, Figlin RA, Belldegrun AS. Surveillance after radical or partial nephrectomy for localized renal cell carcinoma and management of recurrent disease. Urol Clin North Am. 2003;30(4):843–852. | ||
Hsieh JJ, Chen D, Wang PI, et al. Genomic biomarkers of a randomized trial comparing first-line everolimus and sunitinib in patients with metastatic renal cell carcinoma. Eur Urol. 2017;71(3):405–414. | ||
Funakoshi T, Lee CH, Hsieh JJ. A systematic review of predictive and prognostic biomarkers for VEGF-targeted therapy in renal cell carcinoma. Cancer Treat Rev. 2014;40(4):533–547. | ||
Ho TH, Choueiri TK, Wang K, Karam JA, Chalmers Z. Correlation between molecular subclassifications of clear cell renal cell carcinoma and targeted therapy response. Eur J Focus. 2016;2(2):204–209. | ||
Dornbusch J, Zacharis A, Meinhardt M, et al. Analyses of potential predictive markers and survival data for a response to sunitinib in patients with metastatic renal cell carcinoma. PLoS One. 2013;8(9):e76386. | ||
Hsieh JJ, Purdue MP, Signoretti S, et al. Renal cell carcinoma. Nat Rev Dis Primers. 2017;3:17009. | ||
Young AC, Craven RA, Cohen D, et al. Analysis of VHL gene alterations and their relationship to clinical parameters in sporadic conventional renal cell carcinoma. Clin Cancer Res. 2009;15(24):7582–7592. | ||
Nickerson ML, Jaeger E, Shi Y. et al. Improved identification of von Hippel-Lindau gene alterations in clear cell renal tumors. Clin Cancer Res. 2008;14(15):4726–4734. | ||
Cancer Genome Atlas Research Network. Comprehensive molecular characterization of clear cell renal cell carcinoma. Nature. 2013;499(7456):43–49. | ||
Kim WY, Kaelin WG. Role of VHL gene mutation in human cancer. J Clin Oncol. 2004;22(24):4991–5004. | ||
Gordan JD, Thompson CB, Simon MC. HIF and c-Myc: sibling rivals for control of cancer cell metabolism and proliferation. Cancer Cell. 2007;12(2):108–113. | ||
Gordan JD, Lal P, Dondeti VR, et al. HIF-alpha effects on c-Myc distinguish two subtypes of sporadic VHL-deficient clear cell renal carcinoma. Cancer Cell. 2008;14(6):435–446. | ||
Gordan JD, Bertout JA, Hu CJ, Diehl JA, Simon MC. HIF-2alpha promotes hypoxic cell proliferation by enhancing c-myc transcriptional activity. Cancer Cell. 2007;11(4):335–347. | ||
Keith B, Johnson RS, Simon MC. HIF1alpha and HIF2alpha: sibling rivalry in hypoxic tumour growth and progression. Nat Rev Cancer. 2012;12(1):9–22. | ||
Brannon AR, Rathmell WK. Renal cell carcinoma: where will the state-of-the-art lead us? Curr Oncol Rep. 2010;12(3):193–201. | ||
Dondeti VR, Wubbenhorst B, Lal P, et al. Integrative genomic analyses of sporadic clear cell renal cell carcinoma define disease subtypes and potential new therapeutic targets. Cancer Res. 2012;72(1):112–121. | ||
Abrams TJ, Lee LB, Murray LJ, Pryer NK, Cherrington JM. SU11248 inhibits KIT and platelet-derived growth factor receptor beta in preclinical models of human small cell lung cancer. Mol Cancer Ther. 2003;2(5):471–478. | ||
Mendel DB, Laird AD, Xin X, et al. In vivo antitumor activity of SU11248, a novel tyrosine kinase inhibitor targeting vascular endothelial growth factor and platelet-derived growth factor receptors: determination of a pharmacokinetic/pharmacodynamic relationship. Clin Cancer Res. 2003;9(1):327–337. | ||
O’Farrell AM, Abrams TJ, Yuen HA, et al. SU11248 is a novel FLT3 tyrosine kinase inhibitor with potent activity in vitro and in vivo. Blood 2003;101(9):3597–3605. | ||
Motzer RJ, Hutson TE, Tomczak P, et al. Sunitinib versus interferon alfa in metastatic renal-cell carcinoma. N Engl J Med. 2007;356(2):115–124. | ||
Motzer RJ, Hutson TE, Tomczak P, et al. Overall survival and updated results for sunitinib compared with interferon alfa in patients with metastatic renal cell carcinoma. J Clin Oncol. 2009;27(22):3584–3590. | ||
Therasse P, Arbuck SG, Eisenhauer EA, et al. New guidelines to evaluate the response to treatment in solid tumors. European Organization for Research and Treatment of Cancer, National Cancer Institute of the United States, National Cancer Institute of Canada. J Natl Cancer Inst. 2000;92(3):205–216. | ||
Motzer RJ, Bacik J, Murphy BA, Russo P, Mazumdar M. Interferon-alfa as a comparative treatment for clinical trials of new therapies against advanced renal cell carcinoma. J Clin Oncol. 2002;20(1):289–296. | ||
Tang SW, Chang WH, Su YC, et al. MYC pathway is activated in clear cell renal cell carcinoma and essential for proliferation of clear cell renal cell carcinoma cells. Cancer Lett. 2009;273(1):35–43. | ||
Drabkin HA, Bradley C, Hart I, Bleskan J, Li FP, Patterson D. Translocation of c-myc in the hereditary renal cell carcinoma associated with a t(3;8)(p14.2;q24.13) chromosomal translocation. Proc Natl Acad Sci U S A. 1985;82(20):6980–6984. | ||
Shroff EH, Eberlin LS, Dang VM, et al. MYC oncogene overexpression drives renal cell carcinoma in a mouse model through glutamine metabolism. Proc Natl Acad Sci U S A. 2015;112(21):6539–6544. | ||
Vindrieux D, Devailly G, Augert A, et al. Repression of PLA2R1 by c-MYC and HIF-2alpha promotes cancer growth. Oncotarget. 2014;5(4):1004–1013. | ||
Shroff EH, Eberlin LS, Dang VM, et al. MYC oncogene overexpression drives renal cell carcinoma in a mouse model through glutamine metabolism. Proc Natl Acad Sci U S A. 2015;112(21):6539–6544. | ||
Patel PH, Chadalavada RS, Ishill NM, et al. Hypoxia-inducible factor (HIF) 1α and 2α levels in cell lines and human tumor predicts response to sunitinib in renal cell carcinoma (RCC) [presented at 2008 ASCO Annual Meeting]. J Clin Oncol. 2008;26(Suppl; abstract 5008):252s. | ||
Saez MI, Perez JMT, Perez-Rivas LG, Perez-villa L, Villatoro R, Montesa A. Hypoxia-inducible factor (HIF) 1a and 2a as predictive markers of outcome to VEGFR tyrosine kinase inhibitors (TKI) in renal cell carcinoma (RCC). J Clin Oncol. 2012;30(Suppl; abstract 4630):309s. | ||
Garcia-Donas J, Leandro-Garcia LJ, Gonzalez Del AA, et al. Prospective study assessing hypoxia-related proteins as markers for the outcome of treatment with sunitinib in advanced clear-cell renal cell carcinoma. Ann Oncol. 2013;24(9):2409–2414. | ||
Choueiri TK, Fay AP, Gagnon R, et al. The role of aberrant VHL/HIF pathway elements in predicting clinical outcome to pazopanib therapy in patients with metastatic clear-cell renal cell carcinoma. Clin Cancer Res. 2013;19(18):5218–5226. | ||
Gerlinger M, Rowan AJ, Horswell S, et al. Intratumor heterogeneity and branched evolution revealed by multiregion sequencing. N Engl J Med. 2012;366(10):883–892. |
 © 2017 The Author(s). This work is published and licensed by Dove Medical Press Limited. The full terms of this license are available at https://www.dovepress.com/terms.php and incorporate the Creative Commons Attribution - Non Commercial (unported, v3.0) License.
By accessing the work you hereby accept the Terms. Non-commercial uses of the work are permitted without any further permission from Dove Medical Press Limited, provided the work is properly attributed. For permission for commercial use of this work, please see paragraphs 4.2 and 5 of our Terms.
© 2017 The Author(s). This work is published and licensed by Dove Medical Press Limited. The full terms of this license are available at https://www.dovepress.com/terms.php and incorporate the Creative Commons Attribution - Non Commercial (unported, v3.0) License.
By accessing the work you hereby accept the Terms. Non-commercial uses of the work are permitted without any further permission from Dove Medical Press Limited, provided the work is properly attributed. For permission for commercial use of this work, please see paragraphs 4.2 and 5 of our Terms.