Back to Journals » International Journal of General Medicine » Volume 17
Health Hazard Among Shrimp Cultivators in India: A Quantitative Burden of Disease Study
Authors Swain CK ![]() , Rout HS
, Rout HS ![]() , Jakovljevic M
, Jakovljevic M ![]()
Received 14 December 2023
Accepted for publication 13 March 2024
Published 21 March 2024 Volume 2024:17 Pages 1101—1116
DOI https://doi.org/10.2147/IJGM.S449364
Checked for plagiarism Yes
Review by Single anonymous peer review
Peer reviewer comments 2
Editor who approved publication: Dr Scott Fraser
Chandan Kumar Swain,1 Himanshu Sekhar Rout,2 Mihajlo Jakovljevic3– 5
1Department of Analytical & Applied Economics, Utkal University, Vani Vihar, Bhubaneswar, Odisha, 751 004, India; 2Department of Analytical and Applied Economics & RUSA Centre of Excellence in Public Policy and Governance, Utkal University, Vani Vihar, Bhubaneswar, Odisha, 751 004, India; 3UNESCO - The World Academy of Sciences (TWAS), Trieste, Italy; 4Shaanxi University of Technology, Hanzhong, Shaanxi, 723099, People’s Republic of China; 5Department of Global Health Economics and Policy, University of Kragujevac, Kragujevac, Serbia
Correspondence: Himanshu Sekhar Rout, Email [email protected]
Background: The lack of focus on the health status of shrimp cultivators by previous studies while the production of shrimp has been rising over the years after the introduction of the blue revolution in India. The present study estimated the burden of diseases among shrimp cultivators in India.
Methods: Primary data were collected by using simple random sampling. The sample size was 357. The classification of diseases were made by using the international classification of diseases, tenth revision (ICD-10), version 2019. Disability-adjusted life years (DALY) were used to measure the health status of shrimp cultivators. DALY is the summation of the burden of disease from mortality and morbidity. Sensitive and uncertainty analysis was used by changing the value of the parameter and method, respectively.
Results: The burden of disease among shrimp cultivators in 2020 ranges from 101.03 DALY based on equal age weightage, without discount rate, and potential life expectancy (DALY0,0,PLE) to 84.02 DALY based on unequal age weightage, discount rate, and standardized life expectancy (DALY1,0.03,SLE). The burden of disease per 100,000 shrimp cultivators was 28,477.74 DALY and 23,600.84 DALY when calculated by using DALY0,0,PLE and DALY1,0.03,SLE method, respectively. The higher burden of diseases from non-communicable diseases was followed by injury and communicable diseases for both methods. The disease burden from mortality was more than two-thirds of the total burden of disease and the rest from morbidity. The burden of disease among shrimp cultivators was sensitive to parameter changes because it changes between 92.10 DALY and 63.03 DALY with the change in the parameter. Uncertainty in the burden of disease among them was due to method variation, which ranges from 120.03 DALY to 74.06 DALY.
Conclusion: The higher burden of non-communicable diseases, and the lower burden of communicable, and injuries per 100,000 shrimp cultivators compared to the national level in India.
Keywords: shrimp cultivators, DALY, occupational hazard, epidemiology, India
Introduction
Fish cultivation led to the pollution of water bodies because fishermen did not have adequate knowledge about the quantity of chemicals to be used per acre.1,2 Consumption of fish produced from contaminated water bodies has led to health complications due to the transfer of chemicals from the fish to the human body.3–5 In addition, other environmental factors were responsible for illness among the fishermen, such as exposure to sunlight, light reflection at the sea surface, and air pollution. For example, sunlight exposure caused skin cancer in fishermen,6,7 while sunlight reflection at the sea surface caused eye problems.8 Other illnesses resulting from environmental pollution were respiratory problems among fishermen.8–11
Besides environmental degradation, a hazardous working environment also created health issues among fishermen.12,13 Loud noise during fishing caused hearing problems among fishermen.6,8,14 Another consequence of the continuous noise at the workplace was the fishermen being deprived of sound sleep. Moreover, long working hours left the fishermen with fewer sleeping hours. Consequently, fishermen who had worked more than eight hours with disturbed sleep were more susceptible to illness than the other fishermen. As a result of long work hours, fishermen were affected by musculoskeletal diseases and stress.8,15
The lifestyle factors of fishermen were also responsible for illnesses among them. The consumption of alcohol, and tobacco16 by fishermen to overcome body pain resulting from long hours of work.17–19 However, their lack of knowledge regarding the safe amount of consumption of alcohol,20 smoking, and tobacco led to illness among them.18 Also, poor oral health status among fishermen was due to the consumption of alcohol and tobacco.21,22 Moreover, the higher rate of hernias among fishermen aged 20–35 years was because of the high prevalence of smoking among this age group compared to other age groups.23 The consumption of alcohol and tobacco was also the cause of the increased risk of cancer among fishermen.24 Another cause of fishermen suffering from cancer was higher consumption of fish compared to vegetables and fruits due to lack of storage facilities when they went to sea for fishing. Fishermen’s consumption patterns were also linked to the prevalence of diabetes25 and digestive diseases.26
The main causes of mental health problems among fishermen were risk and uncertainty in fishing. The reasons for risk and uncertainty were working conditions, market variation, amount of fishing, and risk of unemployment.25 Furthermore, self-employed people were significantly associated with higher mental health problems than paid workers.7 Hence, the prevalence of high blood pressure among fishermen was due to stress at work resulting from being self-employed.6
16 million people depend on fisheries in India. Fisheries are divided into two parts. One is marine fishery and another one is inland fisheries. The marine fishery spread along the large coastal area which includes 2.02 million square km of exclusive economic zone and 0.53 million sq. km of continental shelf area.27 Shrimp cultivation comes under inland fisheries. Those who cultivate shrimp are known as shrimp cultivators. Therefore, they are coming under a sub-category of fishermen. During the time of the growth of the shrimp firm, it was banned by the Supreme Court in India to avoid problems related to disease, and environmental problems.28 Currently, shrimp cultivation is regulated by the Coastal Aquaculture Authority (CAA) of India by issuing of license to shrimp cultivator.29 Shrimp cultivation is mostly affected by viruses such as white spot syndrome (WSS)30 and hepatopancreatic microsporidiosis disease.31 One study in Bangladesh found that WSS virus transmission from shrimp to shrimp cultivators creates a health hazard among them.32 However, there is no study on the health status of the shrimp cultivator in India. Hence, estimating the burden of diseases among shrimp cultivators is the novelty of our study.
Existing literature exhibits three limitations. (i) Many studies have been conducted on the health status of fishermen in India and the world. In addition, most of the studies have been conducted on sea fishermen and very few studies have also been done on the health status of inland fisheries in India and the world. (ii) Further, there is a lack of focus on the health status of shrimp cultivators in India while the production of shrimp culture has been rising over the years after the introduction of the blue revolution in India. (iii) Previous studies have used traditional methodologies to measure health status, including morbidity and mortality rates, standardized incident rates, standardized mortality rates, and relative risk to measure health status. In this regard and with the shortcomings of the existing literature,33 we attempted to perform a concise analysis of the burden of diseases among shrimp cultivators in India using a new methodology, disability-adjusted life years (DALY).
Materials and Methods
Materials
The present study was based on primary data. Primary data were collected through simple random sampling employing the lottery method, using a structured schedule. Data were collected for 2020 by using a one-year recall period. Therefore, a survey was conducted between 3 January and 24 February 2021. Odisha was selected randomly out of the top five shrimp-producing states in India.34 Shrimp was cultivated in the seven districts of Odisha such as Ganjam, Bhadrak, Balasore, Puri, Kendrapara, Jagatsinghpur, and Khorda. Jagatsinghpur district was randomly selected out of seven shrimp-cultivated districts of Odisha.29 There were eight blocks in Jagatsinghpur district, and shrimps were cultivated in three blocks, namely Balikuda, Erasama, and Kujanga.35 Erasama block was selected randomly by lottery method out of three shrimp cultivated blocks in Jagatsinghpur district.
This study considered only shrimp cultivators of licensed shrimp-cultivated ponds. The list of licensed shrimp-cultivated ponds was collected from the Fishery Office, Jagatsinghpur. There were twenty-five panchayats in the Erasama block. Shrimps have been cultivated in seventeen panchayats of the Erasama block. Out of seventeen shrimp-cultivated panchayats in the Erasama block, Padmapur and Gadaharispur panchayats were selected through random sampling by the lottery method. All licensed shrimp-cultivated ponds of the two panchayats were taken for the present study. All shrimp cultivators of licensed shrimp-cultivated ponds in the two panchayats were included in this survey. Criteria for cultivators included in this study were at least two years actively employed in shrimp cultivation to know its impact on their health status effectively. The sample unit was the shrimp cultivator and the sample size was 357.
Methods
Disability-adjusted life years (DALY) have been used to estimate the burden of diseases and injuries among shrimp cultivators. Time is the unit of measure of DALY, and it is measured by year. One DALY shows the loss of one healthy life year.36–38 Years of life lost from morbidity (YLD) and life lost from mortality (YLL) are two components of DALY. YLL is always based on incidence. YLD is either calculated by the incidence approach or the prevalence approach.39 To calculate YLD, the present study used the prevalence approach employed in the Global Burden of Diseases Study (GBD) 2019.40 The classification of diseases in this study is based on the international classification of diseases, tenth revision (ICD-10), version 2019.41
Two methods are used to estimate the burden of diseases and injuries among shrimp cultivators to compare the results. One method is based on equal age weightage, without the discount rate and potential life expectancy (DALY0, 0, PLE) shown in equations 1.1, 1.2, and 1.3.40,42 Potential years of life expectancy (PLE) are the years of life expectancy at birth. The second method is based on the assignment of unequal age weightage, use of the discount rate, and standard expected years of life lost (DALY1, 0.03, SLE) given in equations 2.1, 2.2, and 2.5.43–46 For both methods, the assignment of disability weight varies from zero to one. It represents the severity of the disease. Disability weightage zero shows perfect health while one shows death. The WHO assigns disability weightage to different diseases according to the severity of diseases.40

Where x = age groups, x = 0 and x = l are the first and last age groups respectively, Px is the number of prevalence cases among the age group x, DW is the disability weightage, and Lx is the average duration of illness among age group x in a year in equation 1.1.
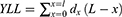
Where dx is the number of people dead among age group x, L is PLE, and x is the average age at death among x age group people if dead before the years of PLE in equation 1.2. For example, PLE in Odisha is 69.8 years.47
Equations 1.1 and 1.2 calculate YLD and YLL for all shrimp cultivators. Therefore, DALY among all shrimp cultivators is the summation of YLD and YLL given in equation 1.3 by using DALY0, 0, PLE method.

where a = age of onset of disability, L = disease duration, D = Disability weightage, K = age weightage modulation factor (K = 1 for assignment of unequal age weightage and K = 0 for equal age weightage), C = age weightage constant (0.1658), β = parameter from age weightage function (0.04), and r = discount rate (0.03).

Where a = age at death, L = standard expectation of life expectancy at age a, and other parameters in equation 2.2 are the same as in equation 2.1. The only difference between equations 2.1 and 2.2 is disability weightage. When one person dies from disease, disability weightage is equal to one. Therefore, disability weightage is not taken in equation 2.2 for YLL. Standardized life expectancy at different ages in Odisha was obtained from Sample Registration System-Abridged Life Tables 2015–2019.47
When solving the integration in equations 2.1 and 2.2, the formula for calculating YLD and YLL is given in equations 2.3 and 2.4, respectively.


Equations 2.3 and 2.4 are used to calculate YLD and YLL for an individual. Therefore, DALY among all the shrimp cultivators in the second method (DALY1,0.03,SLE) is the summation of all individuals YLD and YLL, which is given in equation 2.5.

The discount rate is used to determine the present value of the future loss of healthy life years because people prefer to live healthy at present rather than in the future. The reason is that the future is uncertain and the value of life decreases with age. The discount rate is low when calculating the return on investment in the long term.48 The return to society from health in the long term rather than the short term. Therefore, a low discount rate is used for health outcomes.37 Economists have preferred a 5% discount rate for health and social perspectives. At the same time, modern environmentalists and renewable energy experts say that a low discount rate is used from a social perspective.49 The present study used a 3% discount rate.37,43–46,49
The assignment of age weightage to different age groups is justifiable based on the contribution of each age group to national income. Therefore, the higher age weightage has been given to the working age group than to children and elderly people. The age weightage function estimates the age weightage given in equation 3.37

All parameters in equation 3 are the same as in equation 2.1. Here, x is age. C is constant, used for no significant variation of health outcome when the use of age weightage is compared to no use of age weightage. According to Murray (1994),37 the age weightage function (β) is used between 0.03 and 0.05. The GBD has used 0.04 for β. So, the present study used 0.04 for β. There is no logical reason to use 0.04 for β. When changing the value of β, we need to change the value of C to keep the total area under all age groups remain constant.
Results
Age Weightage
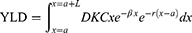
Equal and unequal age weightage given to different age groups is listed in Figure 1. The horizontal straight line shows equal age weightage for all age groups. Using equation 3, weightage is assigned to different age groups. Age weight rises with age up to the age group of 25–30 years, then falls continuously. The lowest age weightage (0.08) is given to the age group of 0–1 years.
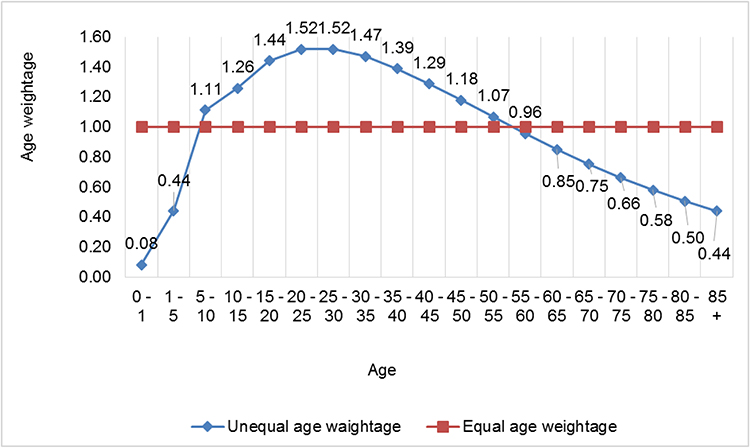 |
Figure 1 Age weightage to different age groups. Note: Authors' estimated by using equation 3. |
The change in the values of β and C to know the variation in the economic importance of each age group is presented in Table 1. The different combinations of β and C have been taken from the previous study.38 The value of β increases with increasing C to keep the total area the same under all age groups, as reflected in Figure 2. The maximum and the minimum age weightage has increased with the rise in the values of β and C. There is an inverse relationship between the values of β and C and the highest age-weighted age group.
 |
Table 1 Impact of Change in β and C on the Maximum and Minimum Age Weightage |
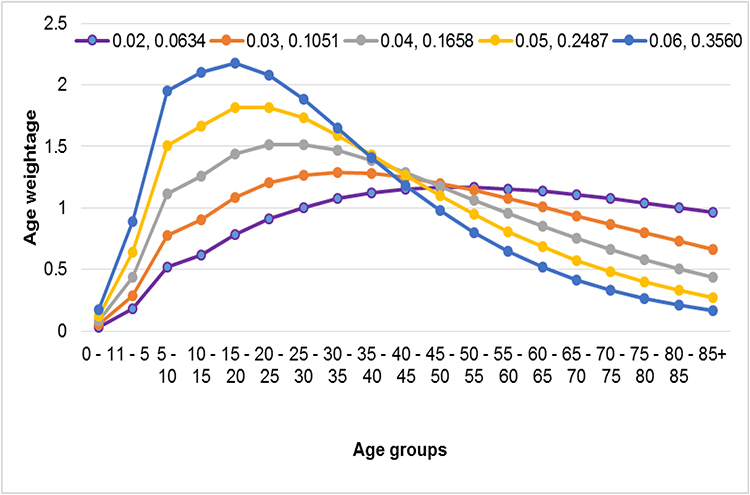 |
Figure 2 Impact of change in the value of β and C on age weightage to different age groups. Note: Authors' estimated by using equation 3. |
Years of Life Lost Based on Different Methods
The DALY from mortality at different ages has been calculated by using two methods; (a) YLL based on equal age weightage, without discount rate, and potential life expectancy (YLL0,0,PLE) and YLL based on unequal age weightage, discount rate, and standardized life expectancy (YLL1,0.03,SLE) shown in Figure 3. The PLE and SLE at the different ages are given in Appendix Table 1. The loss of healthy life years in the YLL1,0.03,SLE method is lower than in the YLL0,0,PLE method up to the age of 60 years, while life expectancy is higher based on the SLE than PLE method. The reason is the rise in life expectancy in the SLE method is less than the fall in life expectancy50 due to a discount at 3% in YLL1,0.03,SLE compared to YLL0,0,PLE method. The highest loss of healthy life years occurred among the age group of 0–1 year in the YLL 0.0,PLE method, and 5–10 years in the YLL1,3,SLE method. The reason is the age weightage and discount rate used in the YLL1,0.03,SLE methods. In the YLL1,0.03,SLE method, the highest age weightage is assigned to the age group of 25–30 years, while the highest loss of healthy life years occurred among the age group of 5–10 years. This is because the increase in loss of healthy life years caused by assigning unequal age weightage is less than the fall in loss of healthy life years caused by the use of a 3% discount rate for the age between 10 and 30 years.
 |
Figure 3 Years of life lost from mortality at different age. Note: Authors' calculated from SRS-abridged life tables. |
Disability-Adjusted Life Years
The total loss of healthy life years is 101.38 years among 357 shrimp cultivators in 2020 due to disability and mortality based on DALY0,0,PLE. However, the loss of healthy life years has been reduced by 17.36 years as the total DALY is 84.02 years based on DALY1,0.03,SLE, presented in Figure 4. The reason for the change in DALY due to the change in method is explained in Figures 5 and 6.
 |
Figure 4 Change in disability-adjusted life years from change in method. Note: Authors' calculation from primary data. |
 |
Figure 5 DALY (0,0,PLE). Note: Authors' calculation from primary data. |
 |
Figure 6 DALY (1,0.03,SLE). Note: Authors' calculation from primary data. |
Based on DALY0,0,PLE, the loss of healthy life years from YLL and YLD are 74.7 (73.68%) and 26.68 (26.32%) years, respectively, as shown in Figure 5. YLL has reduced to 56.72 (67.51%), while YLD has increased to 27.3 (32.49%) when estimated by the DALY1,0.03,SLE method, as presented in Figure 6. The rise in YLD is offset more by the fall in YLL-based DALY1,0.03,SLE, which leads to a DALY reduction of 16.84%, based on the DALY1,0.03,SLE compared to DALY0,0,PLE.
The reason for the fall in YLL and rise in YLD when changing the method from DALY0,0,PLE to DALY1,0.03,SLE is presented in Figure 7. The rise in the loss of healthy life years from 0.28 to 0.36 for communicable diseases and 0.73 to 0.76 for injuries when the method is changed from DALY0,0,PLE to DALY1,0.03,SLE while the loss of healthy life years falls from 100.37 to 82.9 for NCDs. The main reason for the falling DALY based on DALY1,0.03,SLE compared to DALY0,0,PLE is that the rise in the DALY from communicable diseases and injury has been offset by the fall in the DALY from NCDs in the former method. The reason for the rise in DALY from communicable diseases based on the DALY1,0.03,SLE is the rise in DALY from tuberculosis, malaria, dengue, and typhoid, because higher age weightage is given to younger shrimp cultivators who have suffered from these diseases. On the other hand, the rise in DALY from injury has resulted in a rise in YLD from all types of injuries except traumatic brain injury long-term consequences (TBILTC) and fracture of the patella. The main reason for the fall in DALY from NCDs is the fall in YLL from 74.47 to 56.72 years when changing methods from the DALY0,0,PLE to DALY1,0.03,SLE because of the fall in YLL from diabetics, heart attack, and depressive disorder (Appendix Table 2). The reason for falling YLL from these three diseases is discounted at 3% in DALY1,0.03,SLE method.
 |
Figure 7 Burden of a broad category of diseases and injuries. Note: Authors' calculation from primary data. |
Figure 8 reflects the rank of diseases in descending order. The highest disease burden among shrimp cultivators is from mental disorders, followed by cardiovascular diseases, diabetes, musculoskeletal diseases, and digestive diseases. Six subcategories of diseases change their rank when the method of estimation of DALY changes from DALY0,0,PLE to DALY1,0.03,SLE. Skin diseases, endocrine diseases, infectious and parasitic disease (IPD), and other diseases have improved their rank by one each. In contrast, the rank of sense of organ diseases and neurological conditions has deteriorated by two each due to the change in methodology. The main causes of the deterioration in the rank of neurological conditions from 8 to 10 are that DALY from parkinson’s disease and dementia have fallen by 41% and 47%, respectively, due to the fall in age weightage in DALY1,0.03,SLE method. The reason for the fall in age weightage is that one person from each of the two diseases suffered between the age of 75 and 80 years. The reason for the improvement of the rank of IPD and endocrine diseases by one each is the deterioration in the rank of sense organ diseases. The fall in the DALY from 0.25 to 0.168 for hearing problems is responsible for the deterioration in the rank of sense organ diseases from 11 to 13.
 |
Figure 8 Impact of change in methodology on the rank of diseases (in descending order). Note: Authors' calculation from primary data. |
The percentage change in DALY is due to the change in method from DALY0,0,PLE to DALY1,0.03,SLE as presented in Figure 9. DALY0,0,PLE has been taken as the base to determine the percentage change. The percentage change in DALY negatively shows a fall in DALY in the DALY1,0.03,SLE compared to the DALY0,0,PLE, and vice-versa. The percentage of change in DALY is highest for oral health conditions, followed by sense organ diseases, and lowest for musculoskeletal diseases.
 |
Figure 9 Percentage change in DALY (1,0.03,SLE) compared to DALY (0,0,PLE). Note: Authors' calculation from primary data. |
Table 2 shows the DALY per lakh shrimp cultivators because most of the studies on the burden of diseases are estimated per one lakh people. DALY0,0,SLE method is based on equal age weightage, without discount rate, and standardized life expectancy. DALY is estimated in DALY0,0,SLE method to compare the burden of disease between shrimp cultivators and the national level in India estimated by the GBD 2019. The DALY per 100,000 shrimp cultivators is 28,477.74, 33,837.50, and 23,600.84 using DALY0,0,PLE, DALY0,0,SLE, and DALY1,0.03,SLE methods, respectively. The lowest DALY in the DALY1, 0.03, SLE methods is because of the use of 3% discounting rate. The highest DALY based on DALY0, 0, SLE is due to the higher life expectancy at each age when using the SLE method. The difference in DALY between DALY0, 0, SLE and DALY0, 0, PLE methods is the increase in YLL caused by the increase in life expectancy based on SLE compared to PLE
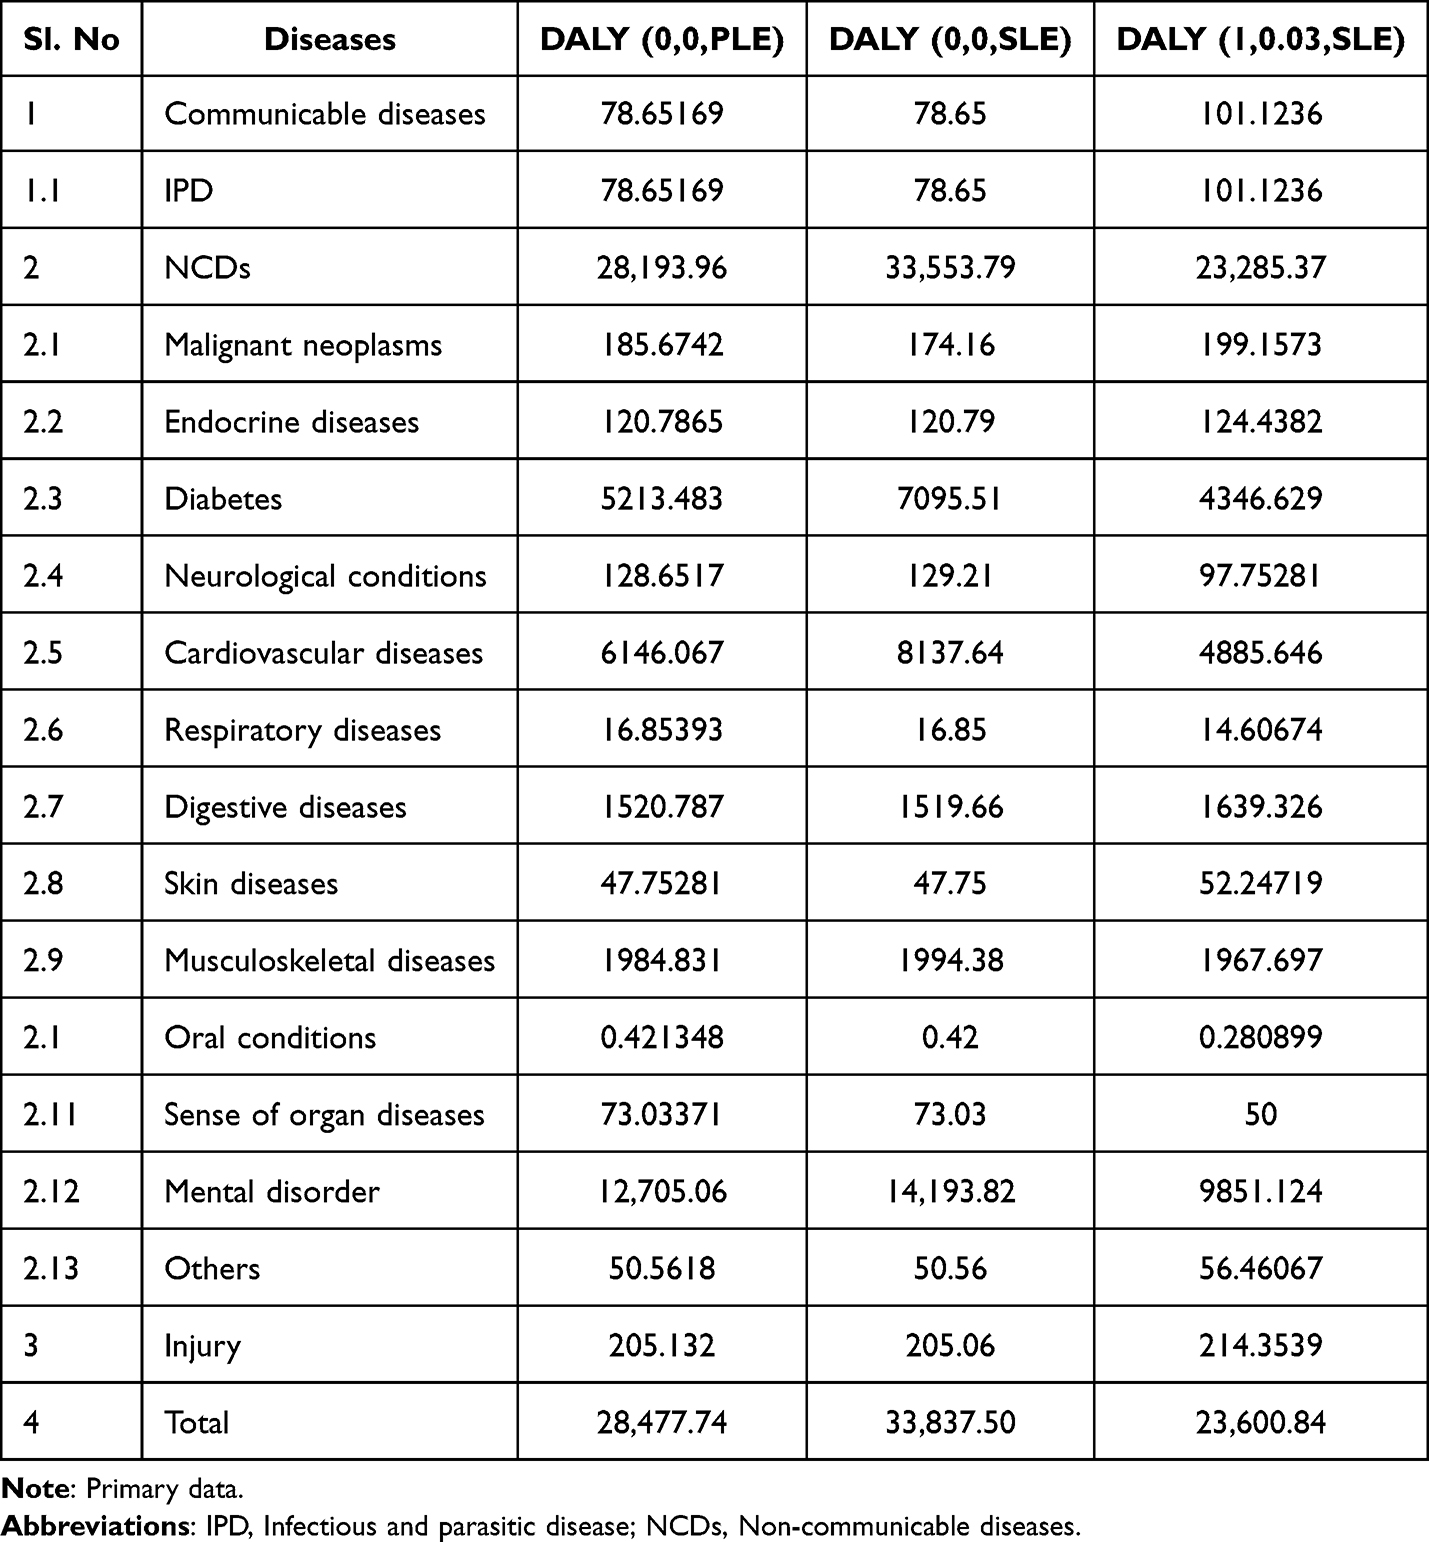 |
Table 2 Disability-Adjusted Life Years per 100,000 Shrimp Cultivator |
Sensitive Analysis of Disability-Adjusted Life Years
The sensitivity of DALY to the change in the parameter’s value is presented in Table 3. Sensitivity analysis shows the impact of parameters on the DALY. We used the DALY 1.0.03,SLE method and only changed the values of C and β for sensitive analysis. The highest DALY is obtained when using β = 0.02 and C = 0.0634. DALY continuously falls with the rise in the value of C and β because the age weightage for people aged between 15 and 45 years is continuously falling, then rising. In the present study, 59% of people are between the age of 15 and 45 years. Therefore, the DALY continuously falls with the rise in C and β.
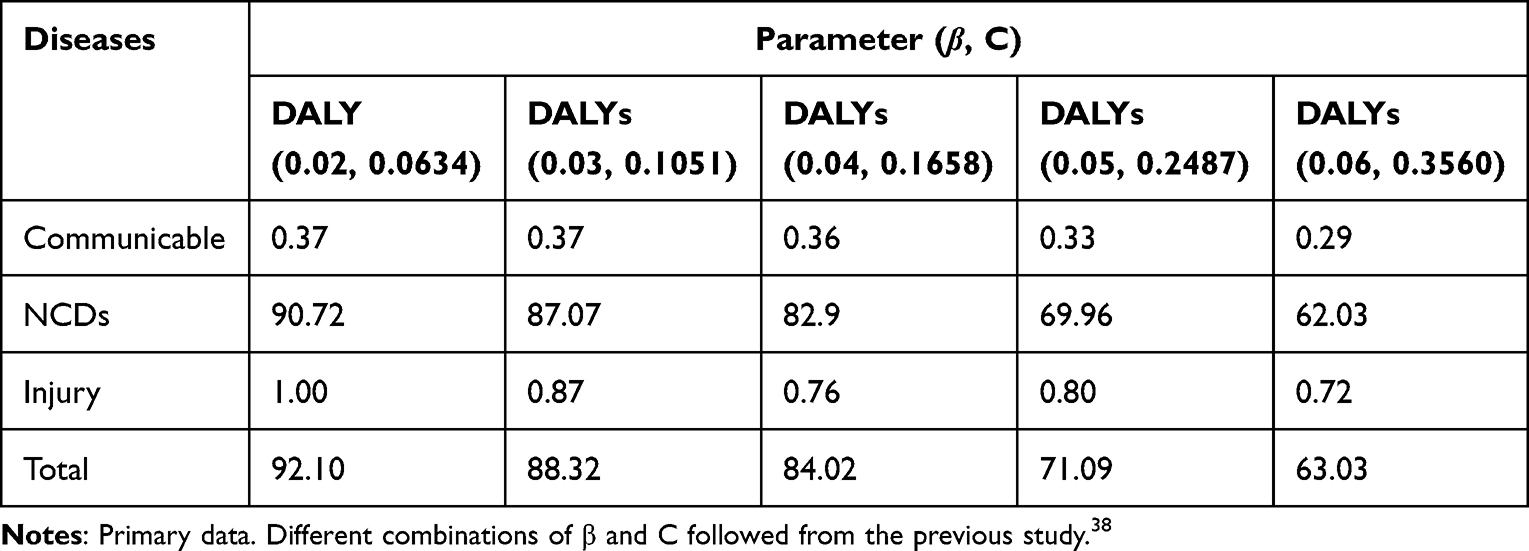 |
Table 3 Sensitiveness of DALY to Changes in the Value of Parameters (β, C) |
Uncertainty Analysis of Disability-Adjusted Life Years
Scenario analysis of DALY is reflected in Figure 10. Scenario analysis explains the uncertainty in DALY due to changes in methods of estimation of DALY, such as applying equal age weightage (K = 0) or unequal age weightage (K = 1) and discount rate (r = 3%) or without discount rate (r = 0%). For this analysis, we use SLE for all methods, and C = 0.1658 and β = 0.04 when K = 1. The highest DALY in the DALY(0,0) method is then followed by DALY(1,0), DALY(1,0.03), and DALY(0,0.03).
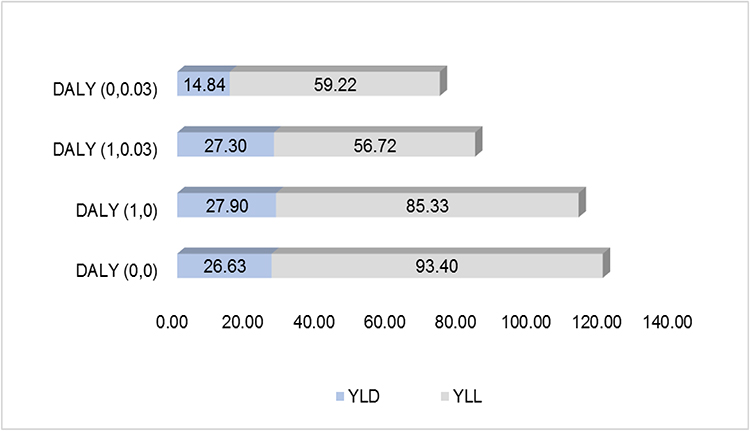 |
Figure 10 Scenario Analysis of DALY (k,r). Note: Authors' calculation from primary data. For the calculation of DALY (1, 0) and DALY (0, 0.03), see reference numbers, respectively.43,49 |
Discussion
The literature review of the health status of fishermen in the present study is based on traditional health status measures like mortality rate, morbidity rate, standardized incident ratio, and relative risk of suffering from a given disease. However, this study used the DALY to measure health status. As a result, challenges arise when comparing the current study’s findings with other studies due to methodological variation.51 Besides these challenges, the present study’s findings compare with other studies based on the number of people suffering from diseases.
The justification for the lowest age weightage given to the age group of 0–1 years (0.08) is that there is less economic loss when one person dies or suffers from illness at this age compared to other age groups because, at this age, there is less investment in a person compared to other age groups. The highest age weightage (1.518) is given to the age group of 25–30 years because of the peak stage of investment in a person at this age.37 The greatest societal loss occurs when a person dies or suffers from illness at this age. Age weightage continuously falls after the age of 30 years because there is less loss to society when a death after this age.52 There is zero or negligible return from investment in human capital between the ages of 20 and 30 years while receiving some return after the age of 30 years by participating in economic activity. Returns to human capital increase with age after the age of 30 years.53
Only one person has suffered from malaria. This finding contradicted the findings of the previous study which found that malaria was the main health problem among the fishermen.54 The very negligible burden of malaria in the present study is due to shrimp cultivators being aware of malaria. There is zero prevalence of HIV among shrimp cultivators, while a previous study55 found 19.7% prevalence of HIV among fishermen. This disparity is because of differences in occupational environments and countries.56 Furthermore, typhoid is the main communicable disease among shrimp cultivators, but its prevalence is low (0.84%).
The present study used the DALY0,0,SLE method to compare the burden of diseases among shrimp cultivators with the national level burden of disease in India.57,58 The burden of communicable diseases is lower among shrimp cultivators (0.23%) than at the national level in India (30.45%).58 The reason is the higher burden of communicable diseases among the elderly and children in India. In this study, children are not included. In addition, No one died from communicable diseases among the shrimp cultivators. It leads to a lower burden of diseases from communicable diseases. Another reason is that the sample size is limited to 357 shrimp cultivators. Further study is needed to compare the burden of diseases among shrimp cultivators with the burden of diseases at the national level in India.
The percentage of fishermen who have diabetes varies between 2.1 and 11, as found in previous studies.6,19 In the present study, 5.6% of shrimp cultivators have diabetes, which is consistent with one study.6 The percentage of shrimp cultivators who have suffered from digestive diseases is 9.8, supported by a previous study.59 The reason is 64.6% of the shrimp cultivators do not have a timetable for eating meals due to heavy workload, as higher emphasis has been given to shrimp cultivation due to a mean expenditure of Rs. 291,679 per acre within three months for one-time cultivation of Vannamei shrimp. A lower percentage of shrimp cultivators has been affected by cancer compared to the previous studies.7,24,26,60,61 The reason is the consumption of alcohol by shrimp cultivators (12.4%) is lower than in the previous study.17–19,62 Also, 60.9% of shrimp cultivators coming under the ideal body mass index (BMI) is responsible for a lower burden of cancer in this study, which is consistent with the previous studies.60,63 The long hours of physical work have led to more than 60% of shrimp cultivators having an ideal BMI.64
Cardiovascular diseases account for 33.33% of deaths among shrimp cultivators, while a previous study60 discovered that it varies between 45% and 55%. The low mortality rate from cardiovascular disease in this study is because 87.1% of the shrimp cultivators belong to the working age.65 The percentage of shrimp cultivators who have suffered from musculoskeletal diseases is 26.40. This finding is close to the previous study.60 The reason for the second highest prevalence of musculoskeletal diseases among all types of diseases is the long work hours.25 49.2% of shrimp cultivators worked more than 10 hours per day. The prevalence of respiratory diseases varied from 0.3% to 13% in previous studies.8,9 Its prevalence is 1.12% among shrimp cultivators, similar to one previous study.10 The lower rate of prevalence of respiratory diseases in this study compared to the existing study8 is due to the shrimp cultivators being more aware of respiratory problems because 86.8% of them have used masks during the process of administering medicine and bleaching in the pond.
The prevalence of work-related stress among shrimp cultivators is 85.39%. According to the literature review,6,8 it ranges between 0.5% and 10.7%. The reason for higher stress among shrimp cultivators in this study is that 4.2% of the workers are from outside the family, and the rest are from within the family. Therefore, 95.8% of shrimp cultivators are self-employed. The higher risk of stress among self-employed people compared to paid employees.7 The higher uncertainty in shrimp cultivation is another important cause of stress among them. Another reason for the prevalence of higher stress found in this study compared to other studies is that shrimp production is affected by an uncontrollable factor like shrimp viruses, which communicate from one pond to another pond. A percentage of 3.92 of the shrimp cultivators are affected by injuries, which is lower than in the previous study.17 Previous studies on marine fishermen showed a higher risk of accidents. This study only considers the risk of accidents when transporting fish for sale and input to a cultivated place. The other sources of injury are the pump set and the aerator at the workplace. Therefore, the low prevalence of injury in this study is due to the low risk of injury at the workplace compared to the previous studies.27
Uncertainty analysis shows that the highest burden of disease among shrimp cultivators based on DALY (0,0) because of the fall in YLD due to not assigning age weightage is less than the rise in YLL for using without the discount rate.65 The highest loss of YLD in the DALY (1, 0) method is because of the assignment of unequal age weightage.32 The higher age weightage has been given to the age group between 15 and 45 years in unequal age weightage than equal age weightage.33 This age group has the highest number of participants in this study.65
The YLL falls in DALY (1,0) compared to the DALY (0,0) method because the rise in YLL for a person dying at the age of 32 years is less than the fall in YLL due to a person dying at the age of 51 years and a person dying at the age of 55 years in the former method. The rise in YLL for a person’s death at the age of 32 years is that the assigned age weightage is 1.468, which is higher than the uniform weightage equal to 1. The fall in YLL due to a person’s death at the age of 51 years and a person’s death at the age of 55 years resulted in the fall in age weightage for both ages in unequal age weightage.37,38,66
DALY estimated based on DALY (1,0.03) is less than the DALY (1, 0) method because of the fall in both YLD and YLL due to the use of a 3% discount rate in the former method.38 The lowest DALY in the DALY (0,0.03) method is due to a fall in YLD and YLL compared to other methods. There are two reasons for the fall in YLD. One is assigning equal age weightage to all age groups; 59% of the people who are between the ages of 15 and 45 years65 lead a fall in YLD due to age weightage for this age group being less in equal age weightage than unequal age weightage. The second is that using a discount rate reduces YLD. YLL is also reduced due to the use of a discount rate.37,43,66 Furthermore, YLL has been reduced more in the DALY (0,0.03) compared to DALY (1,0) method because the fall in YLL due to discounting rate is higher than the fall in YLL due to the use of age weightage in the present data.38
Conclusions
The contribution of the present study to the existing literature is the first attempt to quantify the burden of diseases by using DALY for the shrimp cultivators in India. Government intervention helps reduce the burden of diseases caused by mental disorders, diabetes, cardiovascular diseases, and musculoskeletal diseases among shrimp cultivators. The government should provide training to shrimp cultivators to manage stress. The introduction of an insurance scheme for shrimp cultivation against loss by the government should help to reduce stress among shrimp cultivators. Shift-wise working hours can help to reduce musculoskeletal and other diseases. Shrimp cultivators should take meals at a given time each day to minimize the burden of digestive diseases.
The limitation of this study is the small sample size. The result may change when the study is conducted by taking a large sample. This study did not adjust for the prevailing co-morbidity. Future research should concentrate on the burden of diseases by age group and gender, the comparison of the health and economic burdens of diseases, and the factors influencing the burden of diseases among shrimp cultivators.
Abbreviations
DALY, Disability-adjusted life years; YLD, Years of life lost from morbidity or disability; YLL, Years of life lost from mortality; PLE, Potential life expectancy; SLE, Standardised life expectancy; DALY0,0,PLE, Disability-adjusted life years based on equal age weights, without discount rate, and potential life expectancy;DALY1,0.03,SLE, Disability-adjusted life years based on unequal age weights, discount rate (3%), and standardized life expectancy; YLD0,0,PLE, Years of life lost from disability based on equal age weights, without discount rate, and potential life expectancy; YLD1,0.03,SLE, Years of life lost from disability based on unequal age weights, discount rate (3%), and standardized life expectancy; YLL0,0,PLE, Years of life lost from mortality based on equal age weights, without discount rate, and potential life expectancy; YLL1,0.03,SLE, Years of life lost from mortality based on unequal age weights, discount rate (3%), and standardized life expectancy; GBD, Global burden of disease study; NCDs, Non-communicable diseases; IPD, Infectious and parasitic disease; TBILTC, Traumatic brain injury long-term consequences; DALY (0.02,0.0634), Disability-adjusted life years estimated by using parameter β = 0.02 and C = 0.0634; DALY (0.03,0.1051), Disability-adjusted life years estimated by using parameter β = 0.03 and C = 0.1051; DALY (0.04,0.1658), Disability-adjusted life years estimated by using parameter β = 0.04 and C = 0.1658; DALY (0.05,0.2487), Disability-adjusted life years estimated by using parameter β = 0.05 and C = 0.2487; DALY (0.06,0.3560), Disability-adjusted life years estimated by using parameter β = 0.06 and C = 0.3560; DALY (0,0.03), Disability-adjusted life years based on equal age weights and discount rate (3%); DALY (1,0.03), Disability-adjusted life years based on unequal age weights and discount rate (3%); DALY (1,0), Disability-adjusted life years based on unequal age weights and without discount rate; DALY (0,0), Disability-adjusted life years based on equal age weights and without discount rate; BMI, Body mass index; ICD-10, International classification of diseases 10.
Data Sharing Statement
The datasets used and/or analyzed during the current study are available from the corresponding author upon reasonable request.
Ethics Approval
The present study was based on primary data. The participants/respondents provided their informed consent to collect data and the study complied with the Declaration of Helsinki. The study was conducted after obtaining approval from the Departmental Research Committee (DRC) of the Department of Analytical & Applied Economics, Utkal University, Bhubaneswar, India (Approval no. ECO/85(A)/2020 and Date of approval: 21/03/2020).
Acknowledgments
The authors would like to thank the Fishery Office of Jagatsinghpur district of Odisha, India for providing the list of licensed shrimp cultivation ponds in this district. We are also grateful to all faculty and research scholars of the Department of Analytical and Applied Economics, Utkal University, Vani Vihar, Bhubaneswar, Odisha, for providing valuable suggestions for the improvement of the present paper. Last but not least, thanks to The Indian Econometrics Society (TIES) for thoughtful feedback to modify this paper presented at the 57th Annual Conference of this Society in January 2023.
Author Contributions
All authors have made substantial contributions to the study whether that is in the conception or design of the work; the acquisition, analysis, or interpretation of data; took part in drafting, revising, or critically reviewing the article; gave final approval of the version to be published; have agreed on the journal to which the article has been submitted; and agree to be accountable for all aspects of the work.
Funding
This research did not receive any specific grant from funding agencies in the public, commercial, or not-for-profit sectors.
Disclosure
The authors declare that they have no competing interests in this work.
References
1. Saha A. A study of environmental awareness and knowledge of occupational hazard of fishermen in a remote district of India. Ann Pharma Res. 2014;2(2):61–65.
2. Watterson A, Little D, Young JA, Boyd K, Azim E, Murray F. Towards integration of environmental and health impact assessments for wild capture fishing and farmed fish with particular reference to public health and occupational health dimensions. Int J Environ Res Public Health. 2008;5(4):258–277. doi:10.3390/ijerph5040258
3. Kosatsky T, Przybysz R, Shatenstein B, Weber JP, Armstrong B. Fish consumption and contaminant exposure among Montreal-area sportfishers: pilot study. Environ Res. 1999;80(2):150–158. doi:10.1006/enrs.1998.3910
4. Wu RS. The environmental impact of marine fish culture: towards a sustainable future. Marine Pollution Bulletin. 1995;31(4–12):159–166. doi:10.1016/0025-326X(95)00100-2
5. Wallin E, Rylander L, Hagmar L. Exposure to persistent organochlorine compounds through fish consumption and the incidence of osteoporotic fractures. Scand J Work Environ Health. 2004;30(1):30–35. doi:10.5271/sjweh.762
6. Novalbos J, Nogueroles P, Soriguer M, Piniella F. Occupational health in the Andalusian Fisheries Sector. Occup Med. 2008;58(2):141–143. doi:10.1093/occmed/kqm156
7. Hounsome B, Edwards RT, Hounsome N, Edwards-Jones G. Psychological morbidity of farmers and non-farming population: results from a UK survey. Community Ment Health J. 2012;48(4):503–510. doi:10.1007/s10597-011-9415-8
8. Percin F, Akyol O, Davas A, Saygi H. Occupational health of Turkish Aegean small-scale fishermen. Occup Med. 2012;62(2):148–151. doi:10.1093/occmed/kqr181
9. Roberts SE. Occupational mortality in British commercial fishing, 1976-95. Occup Environ Med. 2004;61(1):16–23.
10. Grimsmo-Powney H, Harris EC, Reading I, Coggon D. Occupational health needs of commercial fishermen in South West England. Occup Med. 2010;60(1):49–53. doi:10.1093/occmed/kqp137
11. Nugroho AS, Inaoka T. Changes in socio-economic status, community health and environmental conditions of fishermen by transmigration in lampung timur, Indonesia. Life Sci J. 2012;9(4):2547–2556. doi:10.7537/marslsj090412.124
12. Roberts SE. Britain’s most hazardous occupation: commercial fishing. Accid Anal Prev. 2010;42(1):44–49. doi:10.1016/j.aap.2009.06.031
13. Bull N, Riise T, Moen BE. Occupational injuries to fisheries workers in Norway reported to insurance companies from 1991 to 1996. Occup Med. 2001;51(5):299–304. doi:10.1093/occmed/51.5.299
14. Zeigelboim BS, Silva TP, Carvalho H, et al. Otoneurologic findings in a fishermen population of the state of Santa Catarina: preliminary study. Int Arch Otorhinolaryngol. 2014;18(1):6–10. doi:10.1055/s-0033-1358584
15. Marzuki NI, Abdulrahman SA, Rashid A. Prevalence and risk factors of depression among a population of economically-disadvantaged fishermen in Teluk Bahang, Penang. J Adv Med Med Res. 2017;23(9):1–20. doi:10.9734/JAMMR/2017/35980
16. Ranabhat CL, Kim CB, Park MB, Jakovljevic MM. Situation, impacts, and future challenges of tobacco control policies for youth: an explorative systematic policy review. Front Pharmacol. 2019;10:981. doi:10.3389/fphar.2019.00981
17. Frantzeskou E, Kastania AN, Riza E, Jensen OC, Linos A. Risk factors for fishermen’s health and safety in Greece. Int Marit Health. 2012;63(3):155–161.
18. Bhondve A, Mahajan H, Sharma B, Kasbe A. Assessment of Addictions among Fishermen in Southern-East Coastal Area of Mumbai, India. J Dental Med Sci. 2013;6(6):71–79. doi:10.9790/0853-0667179
19. Annadurai K, Balan N, Ranaganathan K. Non-communicable disease risk factor profile among fishermen community of Kancheepuram district, Tamil Nadu: a cross-sectional study. Int J Community Med Public Health. 2018;5(2):708–713. doi:10.18203/2394-6040.ijcmph20180255
20. Jakovljevic M, Riegler A, Jovanovic M, et al. Serbian and Austrian alcohol-dependent patients: a comparison of two samples regarding therapeutically relevant clinical features. Alcohol Alcohol. 2013;48(4):505–508. doi:10.1093/alcalc/agt011
21. Saravanan N, Kunjappan SM, Reddy CV, Veeresh DJ. A study to assess the oral health status and treatment needs of fishermen population in coastal region of Kerala. Kerala Dental J. 2012;35(4):657.
22. Asawa K, Pujara P, Tak M, et al. Oral health status of fishermen and non-fishermen community of Kutch district, Gujarat, India: a comparative study. Int Marit Health. 2014;65(1):1–6. doi:10.5603/MH.2014.0001
23. Rao G, Rao A, Pujara N, Pujara P, Patel S. Prevalence of hernia among fishermen population in Kutch District, India. Natl J Integr Res Med. 2015;6(4):44–51.
24. Kaerlev L, Hansen J, Hansen HL, Nielsen PS. Cancer incidence among Danish seafarers: a population-based study. Occup Environ Med. 2005;62:761–765. doi:10.1136/oem.2005.020818
25. King T, Kilpatrick S, Willis K, Speldewinde C. A different kettle of fish: mental health strategies for Australian fishers, and farmers. Mar Policy. 2015;60:134–140. doi:10.1016/j.marpol.2015.06.013
26. Hagmar L, Lindén K, Nilsson A, et al. Cancer incidence and mortality among Swedish Baltic sea fishermen. Scand J Work Environ Health. 1992;18(4):217–224. doi:10.5271/sjweh.1586
27. Economic survey 2019-20. Government of India; 2020. Available from: https://www.indiabudget.gov.in/budget2020-21/economicsurvey/doc/echapter.pdf.
28. Shrimp farming. TNAU Agritech portal-farm enterprises; 2024. Available from: https://agritech.tnau.ac.in/farm_enterprises/Farm%20enterprises_shrimps.html.
29. Coastal Aquaculture Authority, Department of Fisheries, Government of India; 2020. Available from: https://caa.gov.in/farms.html.
30. Sivakumar S, Vimal S, Abdul Majeed S, et al. A new strain of white spot syndrome virus affecting Litopenaeus vannamei in Indian shrimp farms. J Fish Dis. 2018;41(7):1129–1146. doi:10.1111/jfd.12811
31. Mithun R, Sathiyaraj G, Biju N, et al. Characterization of Enterocytozoon hepatopenaei causing hepatopancreatic microsporidiosis in L. vannamei and a new molecular method for its detection in shrimps, and other environmental samples. J Invertebr Pathol. 2023;199:107951. doi:10.1016/j.jip.2023.107951
32. Belton B. Shrimp, prawn and the political economy of social wellbeing in rural Bangladesh. J Rural Stud. 2016;45:230–242. doi:10.1016/j.jrurstud.2016.03.014
33. Haagsma JA, James SL, Castle CD, et al. Burden of injury along the development spectrum: associations between the socio-demographic Index and disability-adjusted life year estimates from the Global Burden of Disease study 2017. Inj Prev. 2020;26(Suppl 2):i12–i26. doi:10.1136/injuryprev-2019-043296
34. Marine Product Export Development Authority. State-wise aquaculture production; 2020. Available from: https://mpeda.gov.in/?page_id=651.
35. Directorate of Economics & Statistics, Odisha. District statistical hand book, Jagatsinghpurt 2015; 2016. Available from: http://www.desorissa.nic.in/pdf/Jagtsinghpur-dshb-15.pdf.
36. Jakovljevic MM, Ogura S. Health economics at the crossroads of centuries - from the past to the future. Front Public Health. 2016;4:115. doi:10.3389/fpubh.2016.00115
37. Murray CJ. Quantifying the burden of disease: the technical basis for disability-adjusted life years. Bull World Health Organiz. 1994;72(3):429–445.
38. Lopez AD, Mathers CD, Ezzati M, Jamison DT, Murray CJ. Global Burden of Disease and Risk Factors. Oxford University Press; 2006.
39. Jakovljevic M, Timofeyev Y, Ekkert NV, et al. The impact of health expenditures on public health in BRICS nations. J Sport Health Sci. 2019;8(6):516–519. doi:10.1016/j.jshs.2019.09.002
40. World Health Organization. Methods and Data Sources for Global Burden of Diseases Estimates 2000-2019 (Global Health Estimates Technical Paper WHO/ DDI/DNA/GHE/2020.3); 2020.
41. World Health Organization. International Statistical Classification of Diseases and Related Health Problems (10th Revision); 2019. Available from: https://icd.who.int/browse10/2019/en#/I10.
42. Swain CK, Padhee S, Sahoo U, Rout HS, Swain PK. Changing patterns of cancer burden among elderly across Indian states: evidence from the global burden of disease study 1990-2019. Aging Medicine. 2023;6(3):254–263. doi:10.1002/agm2.12264
43. Fox-Rushby JA, Hanson K. Calculating and presenting disability adjusted life years (DALYs) in cost-effectiveness analysis. Health Policy Plan. 2001;16(3):326–331. doi:10.1093/heapol/16.3.326
44. Swain CK, Rout HS. Gender and age group-wise inequality in health burden and value of premature death from COVID-19 in India. Aging Health Res. 2023;3(3):100151. doi:10.1016/j.ahr.2023.100151
45. Devleesschauwer B, McDonald S, Haagsma J, Praet N, Havelaar A, Speybroeck N. DALY: the DALY Calculator – graphical User Interface for Probabilistic DALY Calculation in R; 2016. Available from: http://daly.cbra.be/latest-release/DALYmanual.pdf.
46. Nurchis MC, Pascucci D, Sapienza M, et al. Impact of the Burden of COVID-19 in Italy: results of Disability-Adjusted Life Years (DALYs) and Productivity Loss. Int J Environ Res Public Health. 2020;17(12):4233. doi:10.3390/ijerph17124233
47. Sample Registration System-Abridged Life Tables. ORGI, Ministry of Home Affairs, Government of India; 2022. Available from: https://censusindia.gov.in/nada/index.php/catalog/43473.
48. Sahoo PM, Rout HS, Jakovljevic M. Future health expenditure in the BRICS countries: a forecasting analysis for 2035. Globalization Health. 2023;19(1):49. doi:10.1186/s12992-023-00947-4
49. Mohanty SK, Dubey M, Mishra US, Sahoo U. Impact of covid-19 attributable deaths on longevity, premature mortality and DALYs: estimates of USA, Italy, Germany, and Sweden. Global J Med Res. 2020;20(9):13–25. doi:10.17406/GJMRA
50. Ranabhat CL, Atkinson J, Park MB, Kim CB, Jakovljevic M. The influence of universal health coverage on life expectancy at birth (LEAB) and healthy life expectancy (HALE): m multi-country cross-sectional study. Front Pharmacol. 2018;9:960. doi:10.3389/fphar.2018.00960
51. Local Burden of Disease WaSH Collaborators. Mapping geographical inequalities in access to drinking water and sanitation facilities in low-income and middle-income countries, 2000-17. Lancet Glob Health. 2020;8(9):e1162–e1185. doi:10.1016/S2214-109X(20)30278-3
52. Jakovljevic M, Chang H, Pan J. Successes and challenges of China’s health care reform: a four-decade perspective spanning 1985-2023. Cost Eff Resour Alloc. 2023;21(1):59. doi:10.1186/s12962-023-00461-9
53. Jakovljevic M, Vukovic M, Chen CC, et al. Do health reforms impact cost consciousness of health care professionals? Results from a nation-wide survey in the Balkans. Balkan Med J. 2016;33(1):8–17. doi:10.5152/balkanmedj.2015.15869
54. Hansen HL, Hansen KG, Andersen PL. Incidence and relative risk for hepatitis A, hepatitis B and tuberculosis and occurrence of malaria among merchant seamen. Scand J Infect Dis. 1996;28(2):107–110. doi:10.3109/00365549609049058
55. Mafigiri R, Matovu JK, Makumbi FE, et al. HIV prevalence and uptake of HIV/AIDS services among youths (15-24 Years) in fishing and neighboring communities of Kasensero, Rakai District, South Western Uganda. BMC Public Health. 2017;17(1):251. doi:10.1186/s12889-017-4166-2
56. Local Burden of Disease HIV Collaborators. Mapping subnational HIV mortality in six Latin American countries with incomplete vital registration systems. BMC Med. 2021;19:1–25. doi:10.1186/s12916-020-01876-4
57. Jakovljevic M, Liu Y, Cerda A, et al. The Global South political economy of health financing and spending landscape - history and presence. J Med Econ. 2021;24(Suppl 1):25–33. doi:10.1080/13696998.2021.2007691
58. World Health Organization. Data on global health estimates 2020: diseases burden by cause, age, by region, 2000-2019; 2020. Available from: https://www.who.int/data/gho/data/themes/mortality-and-global-health-estimates/global-health-estimates-leading-causes-of-dalys.
59. Matheson C, Morrison S, Murphy E, Lawrie T, Ritchie L, Bond C. The health of fishermen in the catching sector of the fishing industry: a gap analysis. Occup Med. 2001;51(5):305–311. doi:10.1093/occmed/51.5.305
60. Mikoczy Z, Rylander L. Mortality and cancer incidence in cohorts of Swedish fishermen and fishermen’s wives: updated findings. Chemosphere. 2009;74(7):938–943. doi:10.1016/j.chemosphere.2008.10.006
61. Oldenburg M, Baur X, Schlaich C. Occupational risks and challenges of seafaring. J Occup Health. 2010;52(5):249–256. doi:10.1539/joh.k10004
62. Lawrie T, Matheson C, Ritchie L, Murphy E, Bond C. The health and lifestyle of Scottish fishermen: a need for health promotion. Health Educ Res. 2004;19(4):373–379. doi:10.1093/her/cyg045
63. Global Burden of Disease Cancer Collaboration. Global, regional, and national cancer incidence, mortality, years of life lost, years lived with disability, and disability-adjusted life-years for 29 cancer groups, 1990 to 2017: a systematic analysis for the Global Burden of Disease Study. JAMA Oncol. 2019;5(12):1749–1768. doi:10.1001/jamaoncol.2019.2996
64. Sengupta P, Sahoo S. A fitness assessment study among young fishermen of coastal areas of East Midnapore district of West Bengal, India. South East Asia J Public Health. 2011;1(1):28–34. doi:10.3329/seajph.v1i1.13210
65. Global Burden of Disease 2016 Greece Collaborators. The burden of disease in Greece, health loss, risk factors, and health financing, 2000-16: an analysis of the Global Burden of Disease Study 2016. Lancet Public Health. 2018;3(8):e395–e406. doi:10.1016/S2468-2667(18)30130-0
66. Barendregt JJ, Bonneux L, Van der Maas PJ. DALYs: the age-weights on balance. Bull World Health Organ. 1996;74(4):439–443.
 © 2024 The Author(s). This work is published and licensed by Dove Medical Press Limited. The
full terms of this license are available at https://www.dovepress.com/terms
and incorporate the Creative Commons Attribution
- Non Commercial (unported, 3.0) License.
By accessing the work you hereby accept the Terms. Non-commercial uses of the work are permitted
without any further permission from Dove Medical Press Limited, provided the work is properly
attributed. For permission for commercial use of this work, please see paragraphs 4.2 and 5 of our Terms.
© 2024 The Author(s). This work is published and licensed by Dove Medical Press Limited. The
full terms of this license are available at https://www.dovepress.com/terms
and incorporate the Creative Commons Attribution
- Non Commercial (unported, 3.0) License.
By accessing the work you hereby accept the Terms. Non-commercial uses of the work are permitted
without any further permission from Dove Medical Press Limited, provided the work is properly
attributed. For permission for commercial use of this work, please see paragraphs 4.2 and 5 of our Terms.
Recommended articles
Predictors of Cardiovascular Morbidity Among Adult Hypertensive Patients: A Cross-Sectional Study from the Kingdom of Saudi Arabia
Al-Ghamdi S, Aldosari KH, Hussain ABO
Patient Preference and Adherence 2023, 17:1361-1369
Published Date: 6 June 2023
Uneven Between-Hospital Distribution of Patient-Related Risk Factors for Adverse Outcomes of Colorectal Cancer Treatment: A Population-Based Register Study
Rattenborg S, Möller S, Frostberg E, Rahr HB
Clinical Epidemiology 2023, 15:867-880
Published Date: 22 July 2023
Early Postoperative Complications in Colorectal Cancer Patients Following Colorectal Surgery Among Yemeni Patients: A Prospective Study
Al-Amry AL, Obadiel YA, Al-Shehari MM, Gailan WM, Bajubair MH, Jowah HM
Open Access Surgery 2024, 17:81-90
Published Date: 26 June 2024
Global Trends in Incidence and Mortality Rates of Endometrial Cancer Among Individuals Aged 55 years and Above From 1990 to 2021: An Analysis of the Global Burden of Disease
Gao S, Wang J, Li Z, Wang T, Wang J
International Journal of Women's Health 2025, 17:651-662
Published Date: 6 March 2025
The Burden of COPD with Type 2 Inflammation in North-West Continental Europe
Sandelowsky H, Løkke A, Kocks JWH, Grøttum HS, Bakke PS, Vasankari T
International Journal of Chronic Obstructive Pulmonary Disease 2025, 20:2767-2785
Published Date: 7 August 2025