Back to Journals » Journal of Multidisciplinary Healthcare » Volume 15
Health Care Responsiveness by Conventional, Traditional and Complementary Medicine Providers in a National Sample of Middle-Aged and Older Adults in India in 2017–2018
Received 10 January 2022
Accepted for publication 28 March 2022
Published 8 April 2022 Volume 2022:15 Pages 773—782
DOI https://doi.org/10.2147/JMDH.S357761
Checked for plagiarism Yes
Review by Single anonymous peer review
Peer reviewer comments 2
Editor who approved publication: Dr Scott Fraser
Supa Pengpid,1,2 Karl Peltzer3,4
1Department of Health Education and Behavioral Sciences, Faculty of Public Health Mahidol University, Bangkok, Thailand; 2Department of Research Administration and Development, University of Limpopo, Turfloop, South Africa; 3Department of Psychology, University of the Free State, Bloemfontein, South Africa; 4Department of Psychology, College of Medical and Health Science, Asia University, Taichung, Taiwan
Correspondence: Karl Peltzer, Department of Psychology, University of the Free State, Bloemfontein, South Africa, Email [email protected]
Introduction: This study aimed to determine the prevalence and correlates of health care responsiveness by conventional, traditional and complementary medicine providers in middle-aged and older community-dwelling adults from the India Longitudinal Ageing Study in India (LASI) Wave 1 in 2017– 2018.
Methods: The cross-sectional sample included 37,852 participants who received outpatient health care in the past 12 months, of which 33,615 had visited a conventional health facility, 2120 an AYUSH facility, and 2117 a traditional health practitioner (THP).
Results: The prevalence of poor health care responsiveness was 10.1% overall, and 10.7% for the conventional health facility, 8.3% for AYUSH, and 5.7% for the THP. In adjusted logistic regression analysis using the whole sample, the prevalence of poor health care responsiveness was significantly lower among AYUSH and THP clients than among conventional health care clients. Having higher education, higher socioeconomic status and being a Sikh decreased the odds of poor health care responsiveness, while being a member of a caste, having two or more chronic diseases, functional disability, and visiting the health facility for immunisation increased the odds of poor health care responsiveness. In regard to the AYUSH provider, older age decreased the odds and member of a caste, being a Christian and functional disability increased the odds of poor health care responsiveness, and in terms of the THP, being a Sikh decreased the odds and older age, functional disability and visiting the THP for immunisation and for treatment for injury/accident increased the odds of poor health care responsiveness.
Discussion: One in ten middle-aged or older adults in India reported poor health care responsiveness, and several sociodemographic and health factors were identified associated with poor health care responsiveness by different service providers.
Keywords: health care responsiveness, complementary medicine, middle-aged, older adults, India
Introduction
India, the second most populous nation on earth, is faced with a growing number of older adults.1,2 “As populations age, health systems must adapt and develop approaches that meet the needs of older patients with increasing multiple chronic conditions. Understanding older populations’ perceptions of quality of care is critical to developing measures to increase the utilization of primary healthcare services”.3 In response to demographic and epidemiological changes, it is important to assess health care responsiveness to improve effective health care in low-resource settings.4 According to the World Health Organization (WHO) one of the key outcomes of health system performance is responsiveness.5 Persons with a poorer assessment of the responsiveness to health care may avoid seeking and receiving needed health care.6 The prevalence of poor outpatient health care responsiveness in six low- and middle-income countries was 7.5%, ranging from 3.8% in China to 28.8% in South Africa, and 10.1% in India in 2007–2008.4
Previous studies in India found that higher socioeconomic status was associated with better health care responsiveness among users of both public and private health facilities.7 Although several studies distinguished public and private health care providers in determining health care responsiveness, mostly finding that private health care facilities had higher health care responsiveness than public health facilities,3,4,8–10 we were unable to identify studies assessing health care responsiveness in different types of health system, such as conventional and complementary and/or alternative medicine. The Indian government recognises apart from conventional health care, “Indian systems of medicine AYUSH (Ayurveda, Yoga, Naturopathy, Unani, Siddha and Homeopathy), and traditional health practitioners (THP) who fall under Local Health Traditions (LHT) representing the healing practices and knowledge following an oral tradition of learning and passing on of the knowledge”.11,12 In India, a significant proportion of middle-aged and older adults have visited AYUSH practitioners (6.5%) and THP (7.0%) in the past 12 months.13
Sociodemographic and health factors may be associated with poor health care responsiveness. For example, in a study in India, lower social class was associated with a longer waiting time,10 and in another study in India, persons in the lower wealth group had poorer dignity health care response,7 and among internal migrants in India, “only about 30% discussed treatment options (autonomy), 40% dignity, 50–60% clarity of communication and 59% confidentiality”.14 In a six-country study among middle-aged and older adults in low- and middle-income countries lower wealth, rural residence, female sex, and difficulties with traveling time were associated with poor health care responsiveness.4 In a study among middle-aged and older adults in South Africa, poor subjective health status and receipt of health insurance were associated with outpatient health care responsiveness.3 In a four-country online survey, being from India (compared to Kenya, Mexico and Nigeria), younger age, rural residence and seen by a pharmacist or drug seller (compared to community health workers and specialists) were more likely to report poor health care quality,15 and in a study among outpatients in Germany having chronic conditions and functional disability were associated with poor health care responsiveness indicators.6 This study aimed to determine the prevalence and correlates of health care responsiveness by conventional, traditional and complementary medicine providers in middle-aged and older community-dwelling adults from the India Longitudinal Ageing Study in India (LASI) Wave 1 in 2017–2018.
Methods
Sample and Procedures
National secondary data from the cross-sectional “Longitudinal Ageing Study in India (LASI) Wave 1, 2017–2018” were analysed; “the overall household response rate is 96%, and the overall individual response rate is 87%”.16 In a household survey, “interview, physical measurement and biomarker data were collected from individuals aged 45 and above and their spouses, regardless of age”.16 The study was approved by the “Indian Council of Medical Research (ICMR) Ethics Committee and written informed consent was obtained from the participants”.16
Measures
Outpatient health care utilization was assessed with the question, “Which type of health care provider did you visit, or came to visit you, most recently in the past 12 months?” Responses were grouped into 1) conventional (Doctor with MBBS, including surgeon, physician, gynecologist, psychiatrist, ophthalmologist, pharmacist, dentist, physiotherapist, and nurse/midwife), 2) AYUSH (ayurvedic/yoga/siddha/unani /homeopathy), and 3) “Traditional/Folk healers (tribal medicine/bhopa/jhaad-fook/Black magic)”. Those who answered affirmatively to this question, were asked six items on health care responsiveness including prompt attention (waiting time), dignity (talked respectfully), communication (clear explanations), choice (choice of health care provider), confidentiality (of information), and quality of basic amenities (cleanliness).16 For each of the domain questions, the degree of responsiveness was evaluated from 1 very good to 5 very bad. Following previous scoring,3,17 participants with any “bad” or “very bad” responses to the six items received a poor health care responsiveness score =1, and participants with any “moderate”, “good” or “very good” received a responsiveness score of “0”.
Reasons of the last outpatient health care visit were asked, allowing multiple responses on 1) Immunization, 2) Consultation, 3) Medical check-up (under observation/routine checkup), 4) Treatment for illness, and 5) Treatment for injury/accident.16
Traveling time to the health facility was sourced from the questions “What was your travel time (one-way) to that facility?” (hours/minutes).16
Receipt of health insurance was asked with the question, “Are you covered by health insurance?” (Yes/No).16
The factors of health care need were evaluated with self-rated health status (1=poor or fair and 0=good, very good, or excellent) and seven chronic conditions (0, 1, 2–7). Chronic conditions were sourced from the questions, “Has any health professional ever told you that you have … ?”: (1) “chronic lung disease such as asthma, chronic obstructive pulmonary disease/chronic bronchitis or other chronic lung problems; (2) cancer or malignant tumor; (3) chronic heart diseases such as coronary heart disease (heart attack or myocardial infarction), congestive heart failure, or other chronic heart problems; (4) diabetes or high blood sugar; (5) bone or joint disorder (arthritis or rheumatism, Osteoporosis or other bone/joint diseases); and (6) stroke. (Yes, No)”.16 Angina was assessed with the “World Health Organization’s Rose angina questionnaire”.18
Sociodemographic variables included education and age in years, sex, religion, residence status, and caste (“Scheduled tribes, scheduled castes, other backward classes, and none of these”). “Scheduled tribes, scheduled castes, and other backward classes have been historically disadvantaged due to various socio-economic factors like wealth or traditional occupation and are given reservation by the government of India”.19 Perceived socioeconomic status was sourced from the item, “Please imagine a ten-step ladder, where at the bottom are the people who are the worst off – who have the least money, least education, and the worst jobs or no jobs, and at the top of the ladder are the people who are the best off – those who have the most money, most education, and best jobs. Please indicate the number (1–10) on the rung on the ladder where you would place yourself”.16 Steps 1 to 3 on the socioeconomic ladder were defined as low, 4–5 as medium, and 6–10 as high socioeconomic status.
The LASI survey instrument was validated in the LASI pilot study in 2010.20
Data Analysis
Descriptive statistics were applied to describe sociodemographic information, health indicators, and health care responsiveness. Pearson’s chi-square tests were used to calculate differences in proportions. Unadjusted and adjusted logistic regression was utilized to assess associations between sociodemographic, health variables, and poor health care responsiveness (dependent variable). P < 0.05 was accepted as significant, no multi-collinearity was detected, and missing values were excluded. Statistical analyses were conducted using “STATA software version 15.0 (Stata Corporation, College Station, TX, USA)”, taking the complex study design into account.
Results
Sample Characteristics
The sample included 37,852 participants that received outpatient health care in the past 12 months, of which 33,615 had visited a conventional health facility, 2120 an AYUSH facility and 2117 a traditional health practitioner. The prevalence of poor health care responsiveness was 10.1% overall, and 10.7% for the conventional health facility, 8.3% for AYUSH, and 5.7% for the THP (see Table 1).
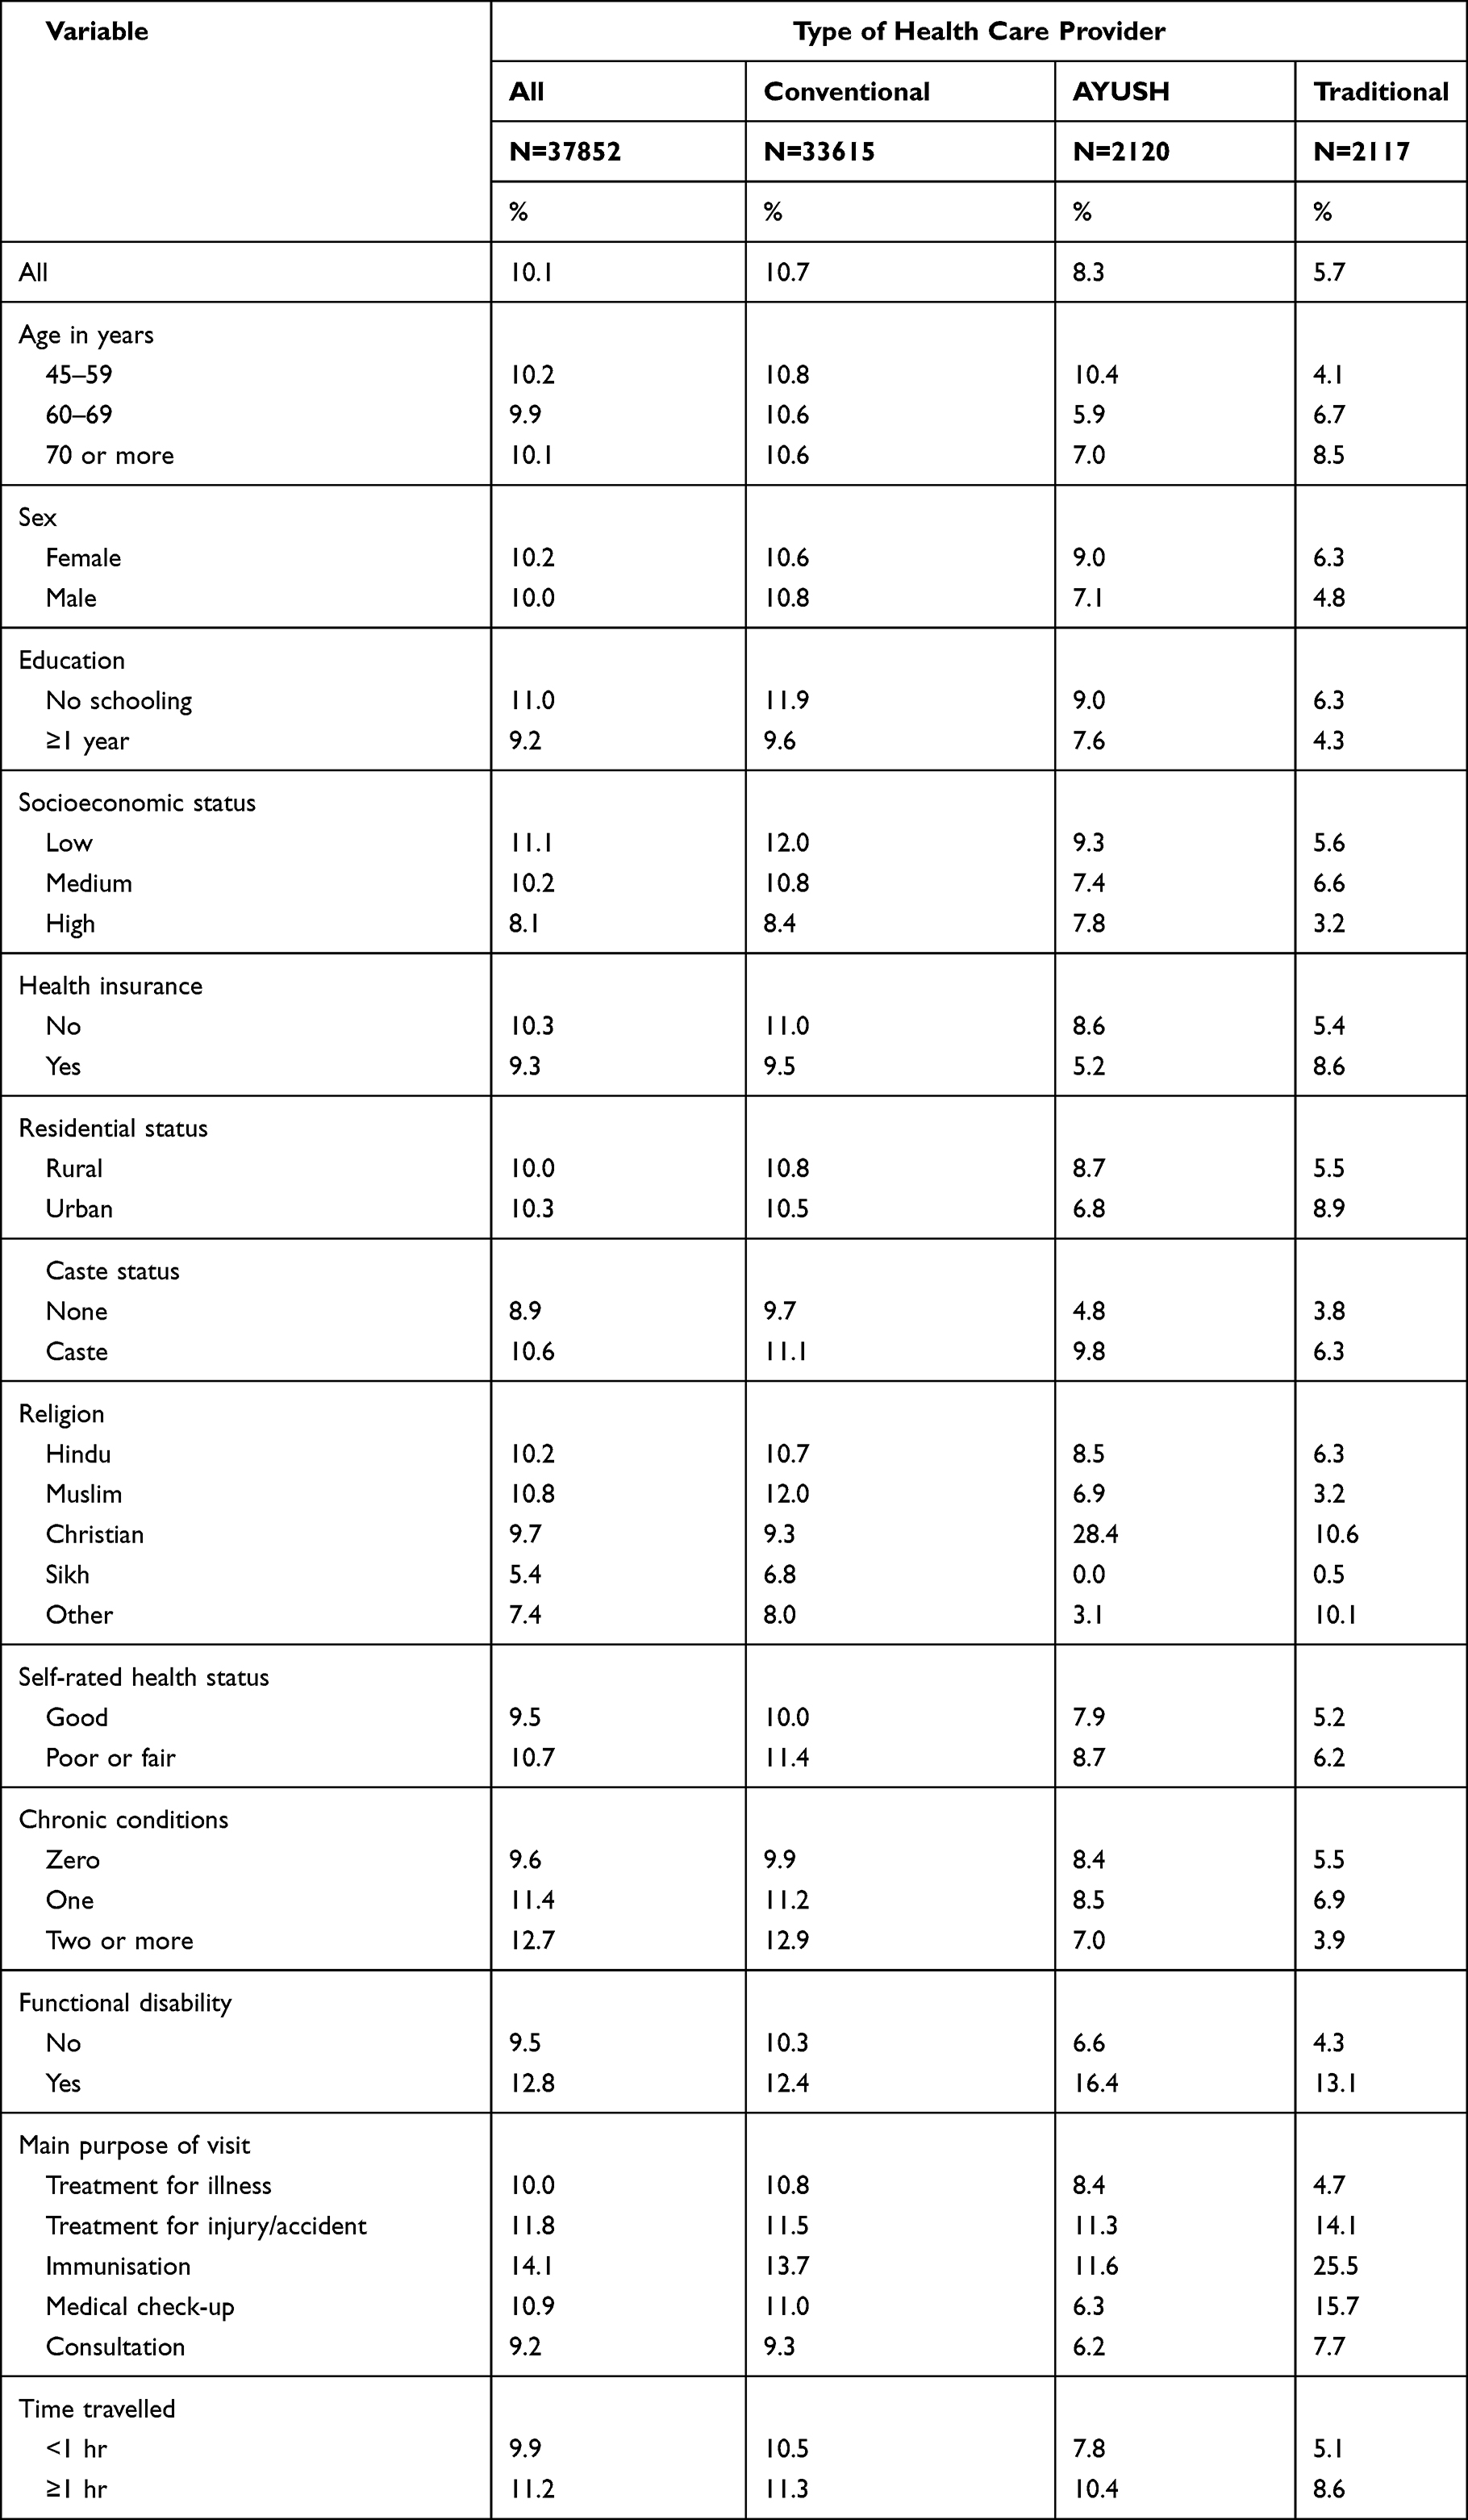 |
Table 1 Descriptive Data on Poor Health System Responsiveness by Type of Last Outpatient Visit Among Middle-Aged and Older Adults in India, 2017–2018 |
Health Responsiveness by Domain and by Health Care Type
Table 2 describes each domain of health system responsiveness by type of health care provider. Prompt attention, dignity, communication, choice, confidentiality, and basic amenities were the poorest for conventional, followed by AYUSH and/or THP (see Table 2).
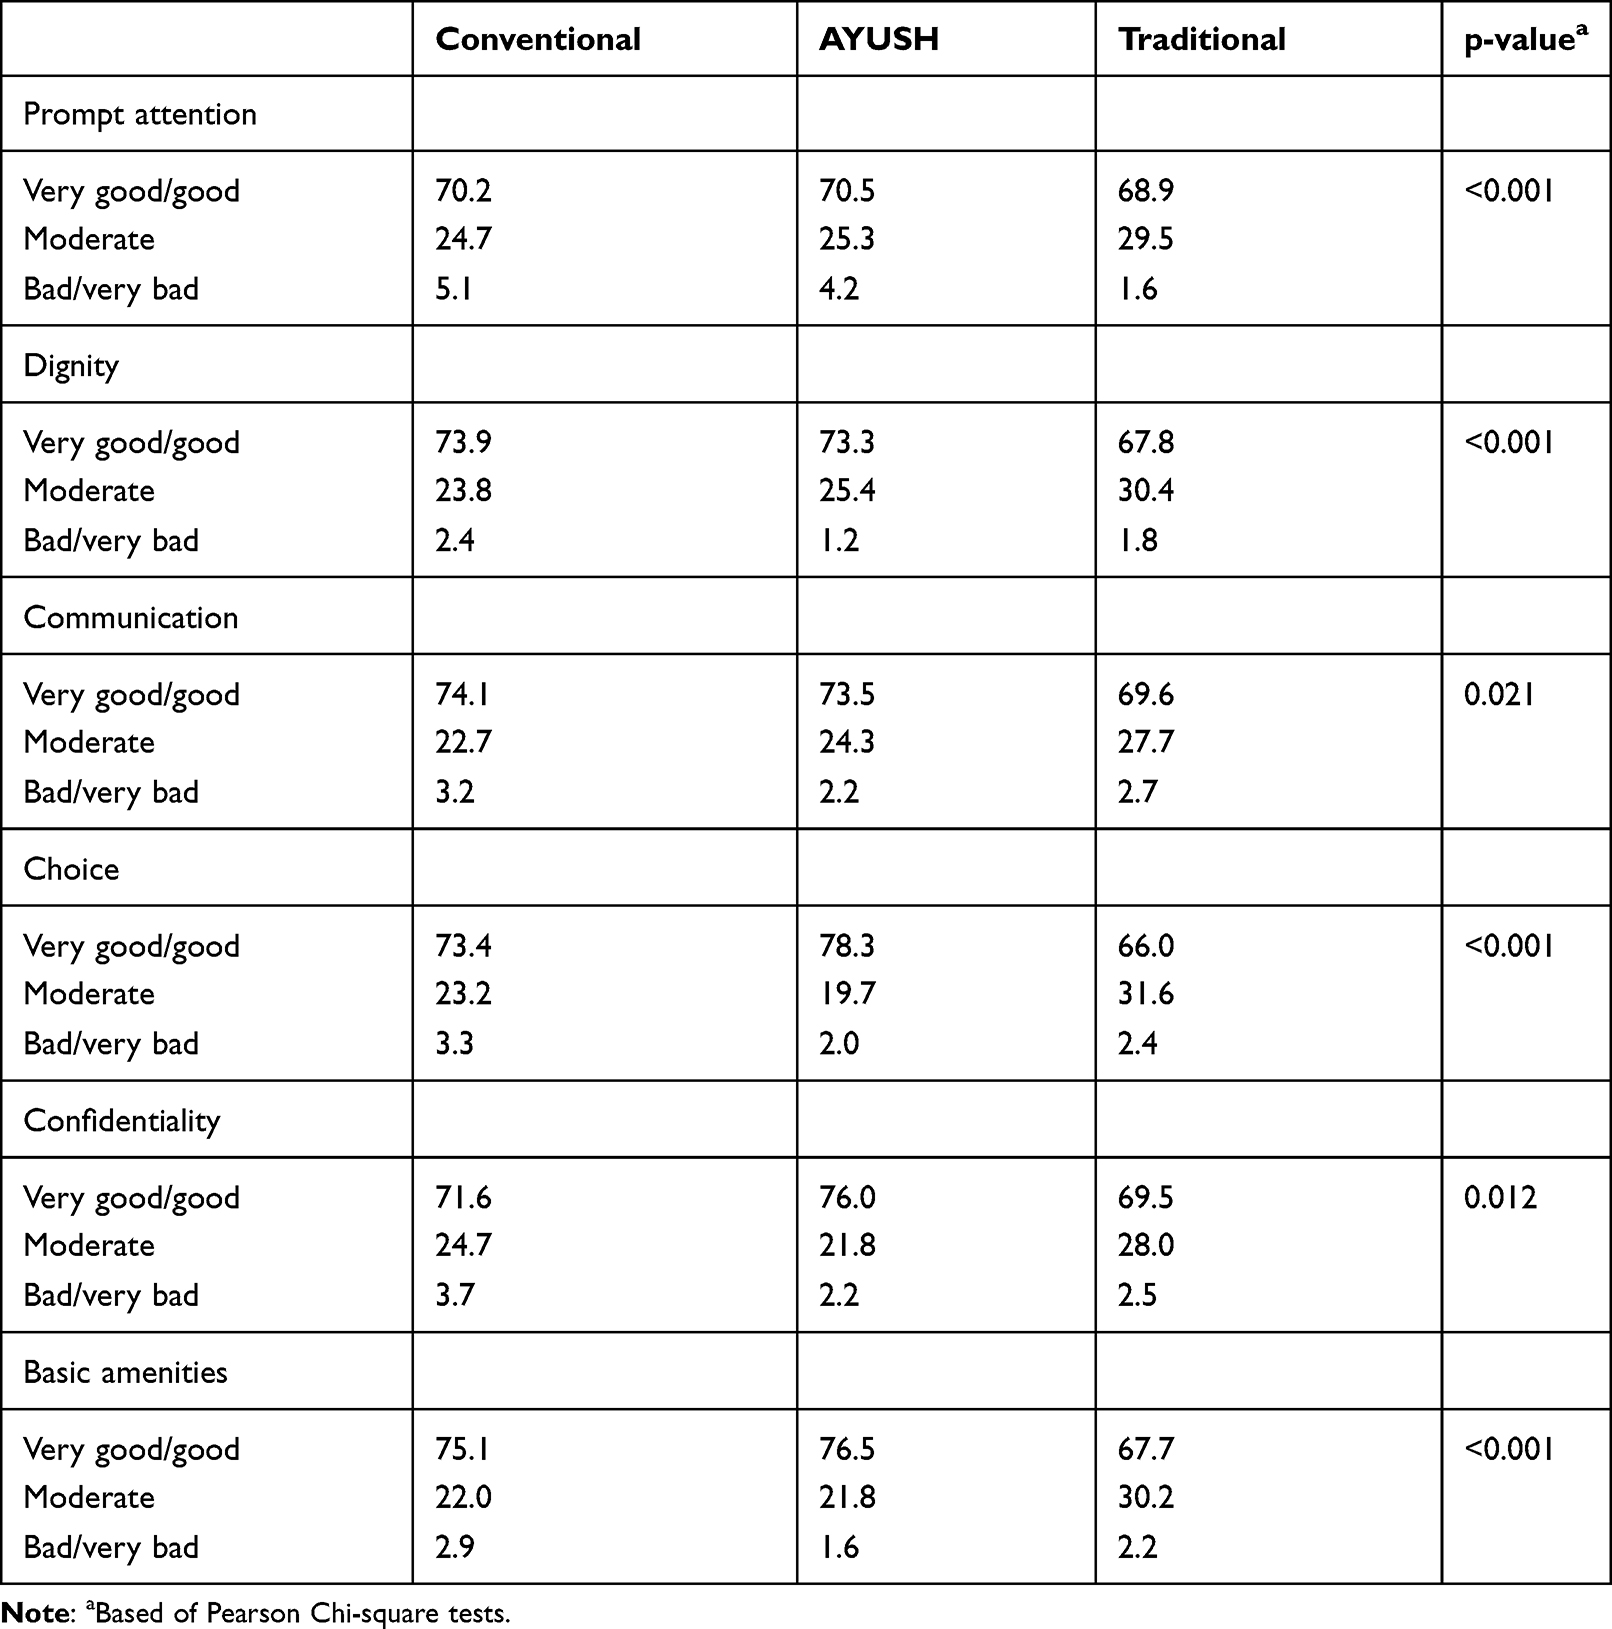 |
Table 2 Health System Responsiveness by Domain and by Type of Health Care Provider |
Associations with Poor Health Care Responsiveness
In adjusted logistic regression analysis using the whole sample, the prevalence of poor health care responsiveness was significantly lower among AYUSH and traditional health practitioner (THP) clients than among conventional health care clients. Having higher education, higher socioeconomic status and being a Sikh decreased the odds of poor health care responsiveness, while being a member of a caste, having two or more chronic diseases, functional disability, and visiting the health facility for immunisation increased the odds of poor health care responsiveness. In addition, in unadjusted analysis, poor or fair self-rated health status increased the odds of poor health care responsiveness.
Regarding the conventional provider, having higher education, higher socioeconomic status and being a Sikh decreased the odds or poor health care responsiveness while having two or more chronic conditions, and visiting the health facility for immunisation increased the odds of poor health care responsiveness.
In regard to the AYUSH provider, older age decreased the odds and member of a caste, being a Christian and functional disability increased the odds of poor health care responsiveness.
In terms of the THP, being a Sikh decreased the odds and older age, functional disability and visiting the THP for immunisation and for treatment for injury/accident increased the odds of poor health care responsiveness (see Tables 3 and 4).
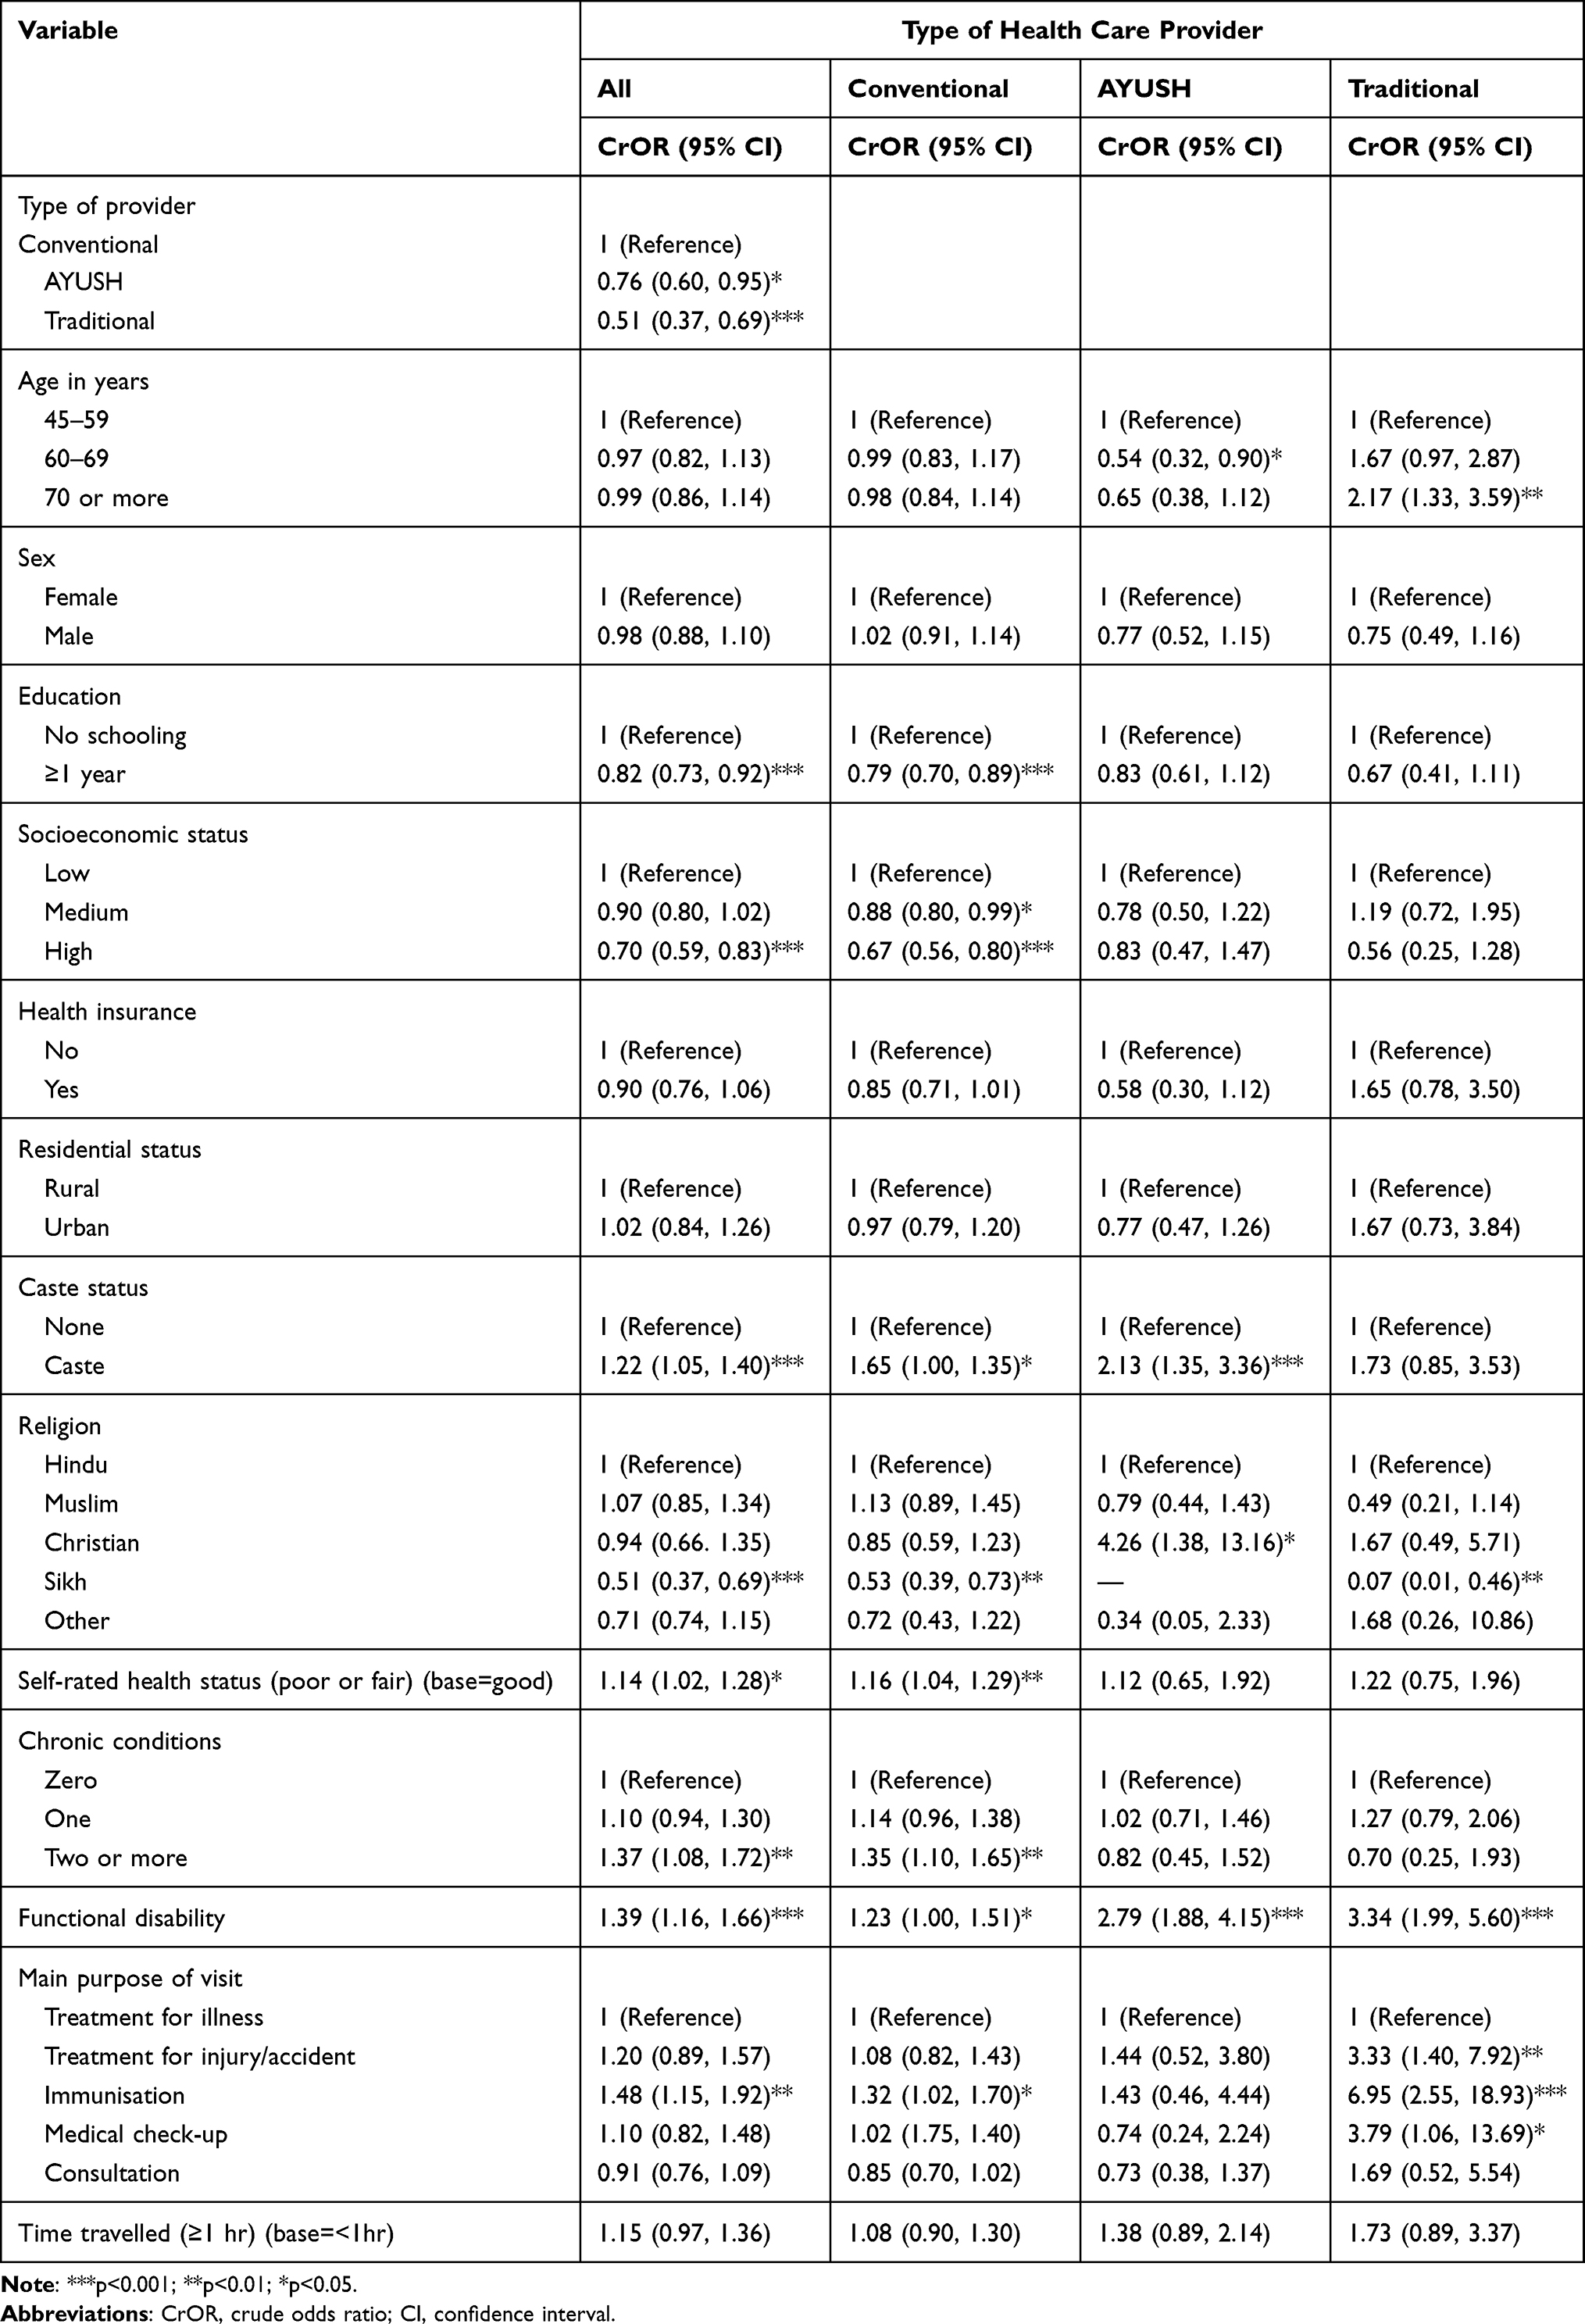 |
Table 3 Crude Odds Ratios (Based on Logistic Regression) of Poor Healthcare Responsiveness of Last Outpatient Visit by Type of Health Care Provider Among Middle- and Older Aged Adults in India, 2017–2018 |
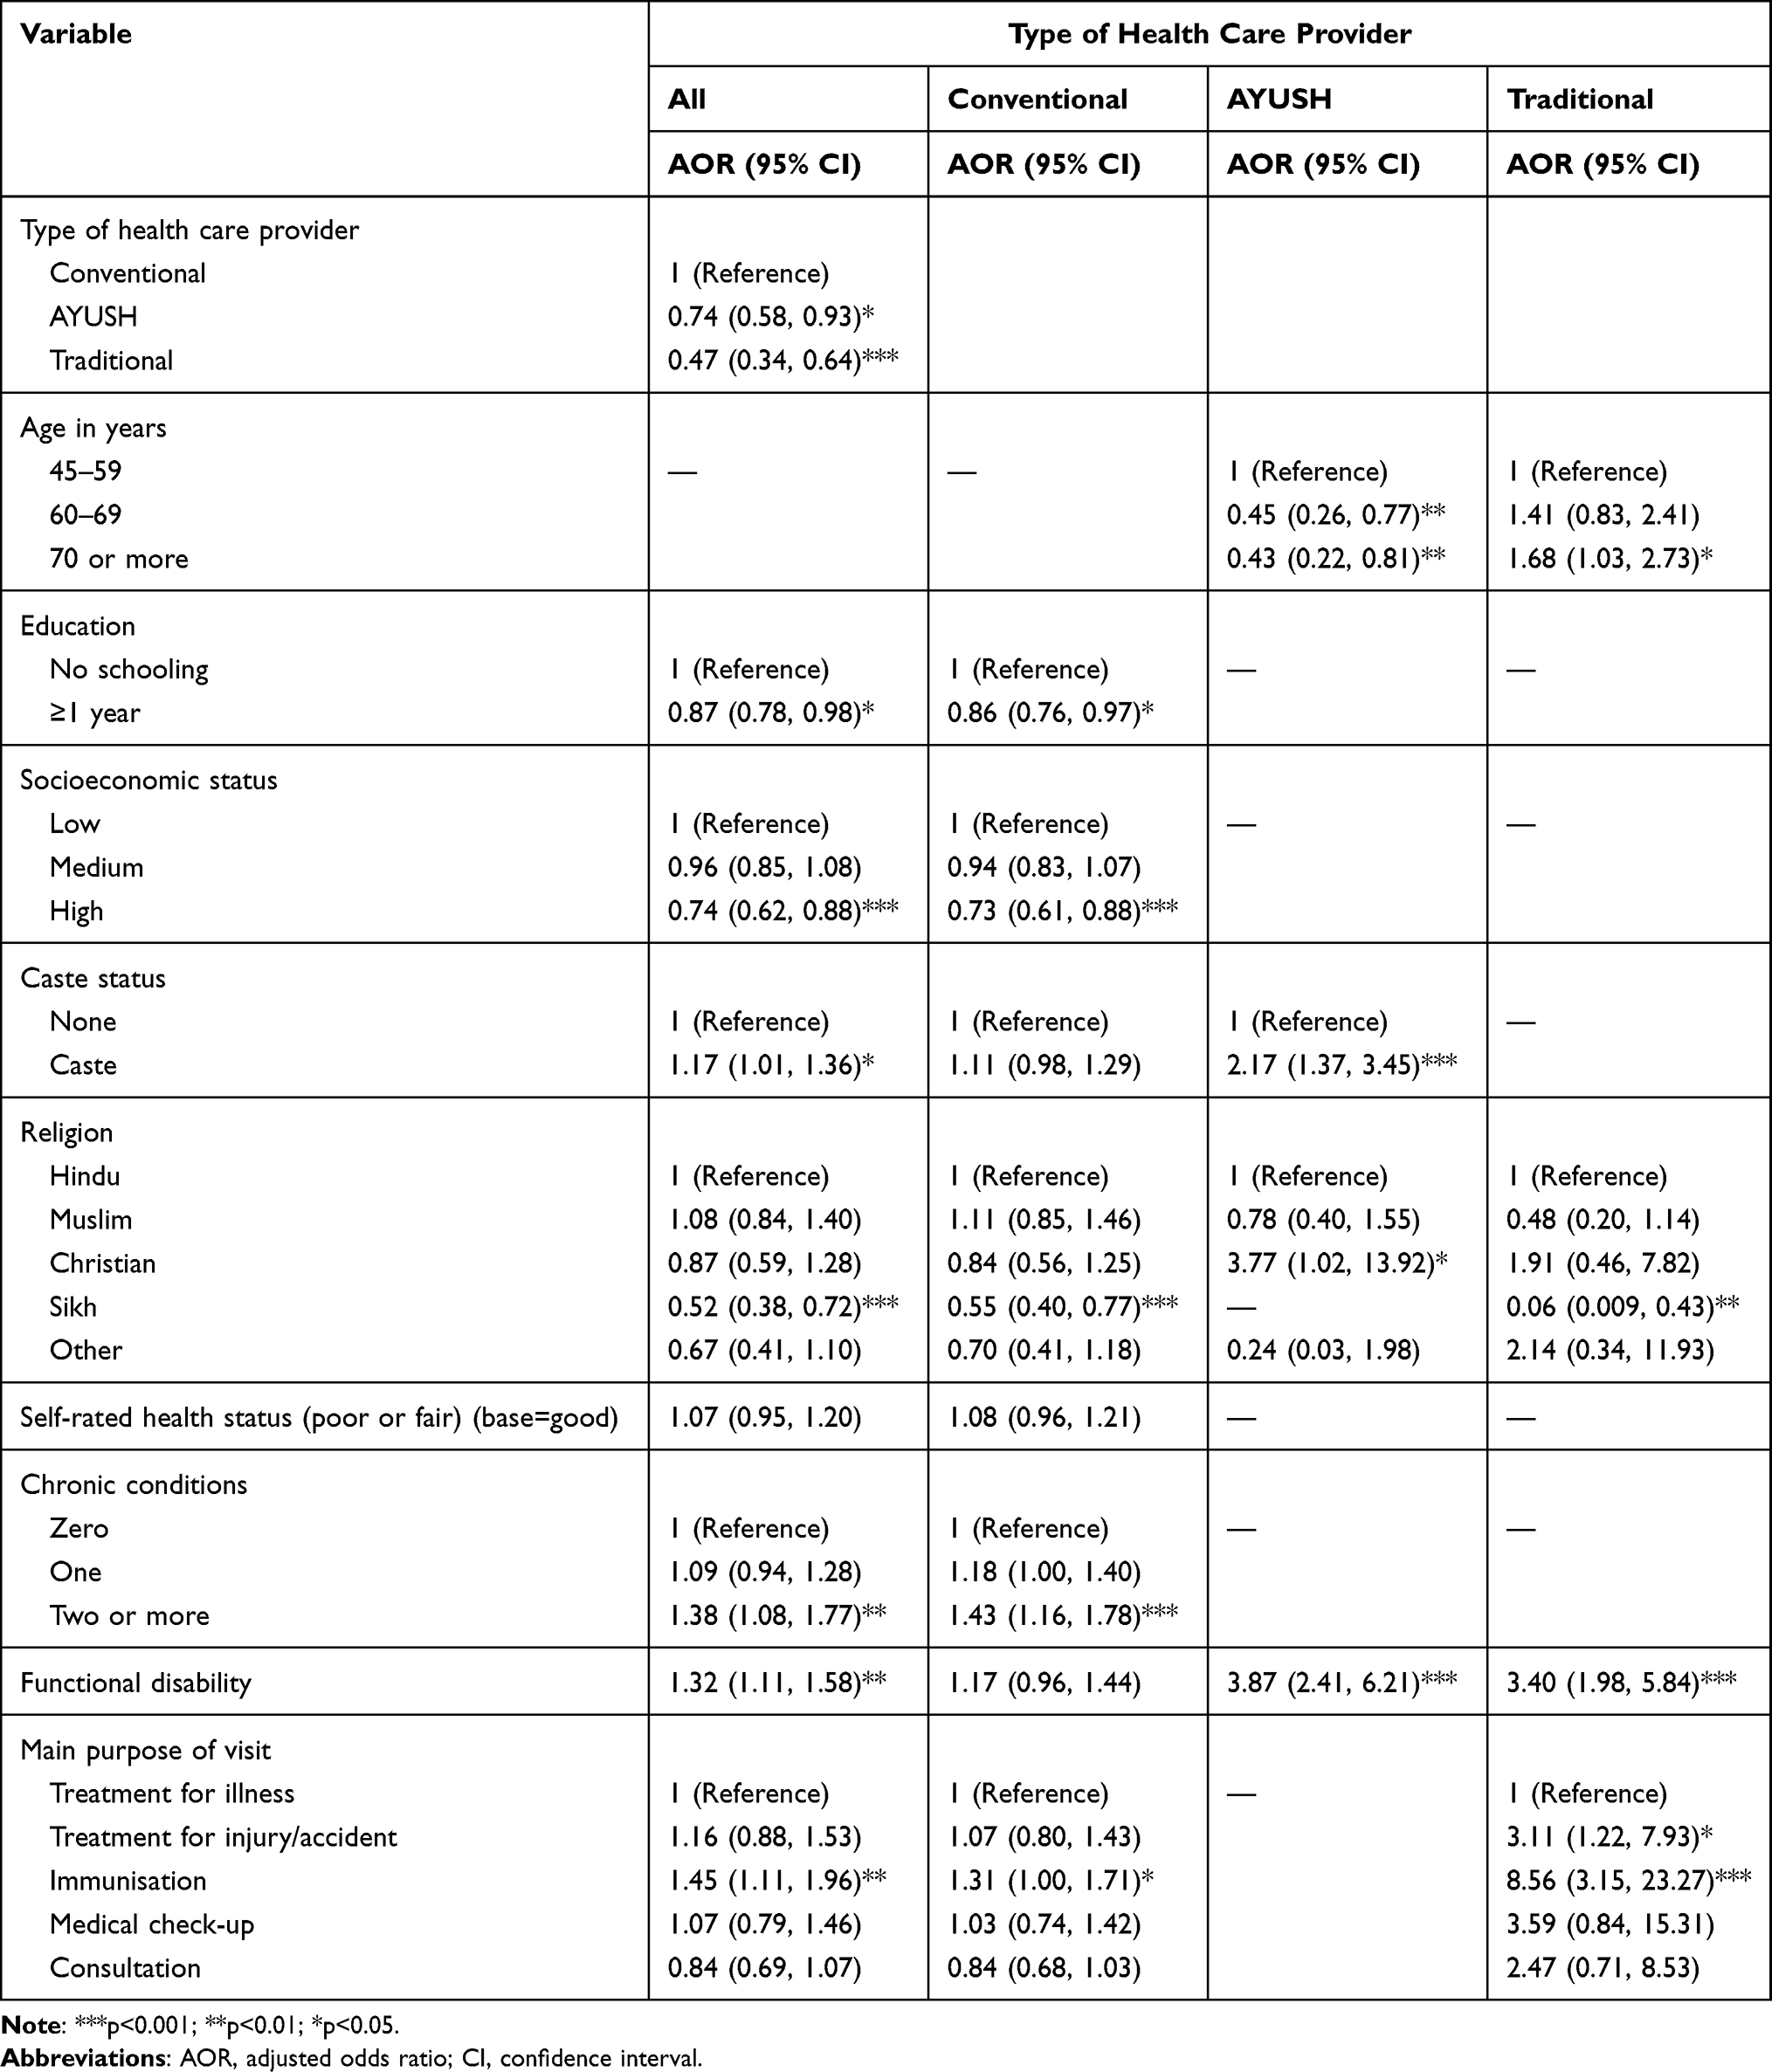 |
Table 4 Adjusted Odds Ratios (Based on Logistic Regression) of Poor Health Care Responsiveness of Last Outpatient Visit by Type of Health Care Provider Among Middle- and Older Aged Adults in India, 2017–2018 |
Discussion
To our knowledge, this is the first evaluation on the prevalence and factors associated health care responsiveness by conventional, traditional and complementary medicine providers among middle-aged and older adults in a national community-based sample in India in 2017–2018. The overall prevalence of poor health care responsiveness (10.1%) in this study in 2017–2018 was the same (10.1%) as in a previous survey in 2007–2008 in India, higher than in China (3.8%) and lower than in South Africa (28.8%).4 However, we found that the prevalence of poor outpatient health care responsiveness was significantly higher for the conventional facility (10.7%) than for AYUSH (8.3%) and THP (5.7%). In comparison, in a four-country study, including India, seen by a pharmacist or drug seller (compared to community health workers and specialists) were more likely to report poor health care quality.15 Possible explanations for the found differences may be related the better quality of AYUSH and/or THP mainly private services or high expectations among these service users.8 In addition, large conventional facilities can be compromised with a longer waiting time than smaller AYUSH and THP facilities, and the latter will probably need to build a client base by increasing the quality of nonclinical care provided.7 However, it should be noted that AYUSH and THP scored lower on the good or very good health care responsiveness indicators compared to conventional services.
Factors associated with poor health care responsiveness included the conventional health care provider, lower education, lower socioeconomic status, member of a caste, having two or more chronic conditions, functional disability and visiting the health facility for immunisation. In addition, in regard to the AYUSH provider, older age decreased and being a Christian increased the odds of poor health care responsiveness, and in terms of the THP, being a Sikh decreased the odds and older age, and visiting the THP for the treatment of injury/accident increased the odds of poor health care responsiveness.
Consistent with previous research,4,7,10,17 we found that lower socioeconomic status and a member of a caste were associated with poor health care responsiveness. However, in our study this socioeconomic gradient was observed only for the conventional sector, and not for the AYUSH and THP services. This result may be explained by the lower cost of consulting primarily public conventional health care, which are more likely to be utilized by poorer than richer segments of society.7 Some previous research3,4,15 showed an association between younger age, rural residence, female sex, not having health insurance, and difficulties with traveling time and poor health care responsiveness, but we did not find significant differences in our study.
Consistent with previous research,6 we found that having two or more chronic conditions, functional disability and visiting the health facility for immunisation was associated with poor health care. However, poorer health care responsiveness for people with two or more chronic conditions was in this study only found for the conventional and not the AYUSH and THP sector, and poorer health care responsiveness for people with functional disability was in this study only found for the AYUSH and THP and not the conventional sector. This finding could mean that the conventional sector should improve health care responsiveness for people with multiple chronic conditions and the AYUSH and THP sector should improve health care responsiveness for people with functional disability. We did not find a positive association between poor or fair self-rated health and poor health care responsiveness, contrary to what was found in a study in South Africa.3
Study limitations include the self-report of the data used in this analysis, which may have biased responses, and the cross-sectional study design, which hinders us to draw causative conclusions. Furthermore, the study focused on community-dwelling middle-aged and older adults and excluded institutionalised persons.
Conclusions
One in ten middle-aged or older adults in India reported poor health care responsiveness. Overall, factors associated with poor health care responsiveness included the conventional health care provider, lower education, lower socioeconomic status, member of a caste, having two or more chronic conditions, functional disability and visiting the health facility for immunisation. In addition, in regard to the AYUSH provider, older age decreased and being a Christian increased the odds of poor health care responsiveness, and in terms of the THP, being a Sikh decreased the odds and older age, and visiting the THP for the treatment of injury/accident increased the odds of poor health care responsiveness. The study highlights significant disparities in health systems response, such as the type of health care provider, socioeconomic and health status, which need to be addressed in order to provide good-quality health care services among the middle-aged and older population in India.
Acknowledgments
The Longitudinal Aging Study in India Project is funded by the Ministry of Health and Family Welfare, Government of India, the National Institute on Aging (R01 AG042778, R01 AG030153), and United Nations Population Fund, India.
Disclosure
All authors declare no conflicts of interest in this paper.
References
1. The United Nations population fund, India; 2018. Available from: https://www.unfpa.org/sites/default/files/IN_UNFPA_Results_07_27.pdf.
2. United Nations Population Fund 2017. Caring for our elders: early responses - India ageing report. New Delhi, India: UNFPA; 2017. Available from: https://india.unfpa.org/sites/default/files/pub-pdf/India%20Ageing%20Report%20-%202017%20%28Final%20Version%29.pdf.
3. Peltzer K, Phaswana-Mafuya N. Patient experiences and health system responsiveness among older adults in South Africa. Glob Health Action. 2012;5:1–11. doi:10.3402/gha.v5i0.18545
4. Stewart Williams J, Myléus A, Chatterji S, Valentine N. Health systems responsiveness among older adults: findings from the World Health Organization Study on global AGEing and adult health. Glob Public Health. 2020;15(7):999–1015. doi:10.1080/17441692.2020.1742365
5. Mirzoev T, Kane S. What is health systems responsiveness? Review of existing knowledge and proposed conceptual framework. BMJ Glob Health. 2017;2(4):e000486. doi:10.1136/bmjgh-2017-000486
6. Fitzpatrick AL, Powe NR, Cooper LS, Ives DG, Robbins JA. Barriers to health care access among the elderly and who perceives them. Am J Public Health. 2004;94(10):1788–1794. doi:10.2105/ajph.94.10.1788
7. Malhotra C, Do YK. Socio-economic disparities in health system responsiveness in India. Health Policy Plan. 2013;28(2):197–205. doi:10.1093/heapol/czs051
8. Peltzer K. Patient experiences and health system responsiveness in South Africa. BMC Health Serv Res. 2009;9:117. doi:10.1186/1472-6963-9-117
9. Awoke MA, Negin J, Moller J, et al. Predictors of public and private healthcare utilization and associated health system responsiveness among older adults in Ghana. Glob Health Action. 2017;10(1):1301723. doi:10.1080/16549716.2017.1301723
10. Shaikh M, Miraldo M, Renner AT. Waiting time at health facilities and social class: evidence from the Indian caste system. PLoS One. 2018;13(10):e0205641. doi:10.1371/journal.pone.0205641
11. Priya R, Shweta AS. Status and Role of AYUSH and Local Health Traditions Under the National Rural Health Mission. New Delhi: National Health Systems Resource Centre; 2010.
12. Ravishankar B, Shukla VJ. Indian systems of medicine: a brief profile. Afr J Tradit Complement Altern Med. 2007;4(3):319–337. doi:10.4314/ajtcam.v4i3.31226
13. Pengpid S, Peltzer K. Utilization of complementary and traditional medicine practitioners among middle-aged and older adults in India: results of a national survey in 2017–2018. BMC Complement Med Ther. 2021;21(1):262. doi:10.1186/s12906-021-03432-w
14. Babu BV, Sharma Y, Kusuma YS, et al. Patient experiences and health system responsiveness among internal migrants: a nationwide study in 13 Indian cities. J Healthc Qual Res. 2019;34(4):167–175. doi:10.1016/j.jhqr.2019.04.003
15. Kim JH, Bell GA, Ratcliffe HL, et al. Predictors of patient-reported quality of care in low- and middle-income countries: a four-country survey of person-centered care. Int J Qual Health Care. 2021;33(3):mzab110. doi:10.1093/intqhc/mzab110
16. International Institute for Population Sciences (IIPS), NPHCE, MoHFW, Harvard T. H. Chan School of Public Health (HSPH) and the University of Southern California (USC). Longitudinal Ageing Study in India (LASI) wave 1, 2017–18, India report, International Institute for Population Sciences, Mumbai. 2020.
17. Geldsetzer P, Haakenstad A, James EK, Atun R. Non-technical health care quality and health system responsiveness in middle-income countries: a cross-sectional study in China, Ghana, India, Mexico, Russia, and South Africa. J Glob Health. 2018;8(2):020417. doi:10.7189/jogh.08.020417
18. Rose GA. The diagnosis of ischaemic heart pain and intermittent claudication in field surveys. Bull World Health Organ. 1962;27(6):645–658.
19. Legal Affairs. Issues of social justice: scheduled castes and scheduled tribes and other backward classes – an unfinished national Agenda. Available from: https://legalaffairs.gov.in/sites/default/files/IX.ISSUESOF%20SOCIAL%20JUSTICE%20%20SCHEDULED%20CASTES%20%20AND%20SCHEDULED%20TRIBES%20AND%20OTHER%20BACKWARD%20CLASSESAN%20UNFINISHED%20NATION.pdf.
20. International Institute for Population Sciences (IIPS), Harvard School of Public Health (HSPH), and RAND Corporation USA. Longitudinal Ageing Study in India (LASI-pilot survey). India. 2010.
 © 2022 The Author(s). This work is published and licensed by Dove Medical Press Limited. The
full terms of this license are available at https://www.dovepress.com/terms
and incorporate the Creative Commons Attribution
- Non Commercial (unported, 3.0) License.
By accessing the work you hereby accept the Terms. Non-commercial uses of the work are permitted
without any further permission from Dove Medical Press Limited, provided the work is properly
attributed. For permission for commercial use of this work, please see paragraphs 4.2 and 5 of our Terms.
© 2022 The Author(s). This work is published and licensed by Dove Medical Press Limited. The
full terms of this license are available at https://www.dovepress.com/terms
and incorporate the Creative Commons Attribution
- Non Commercial (unported, 3.0) License.
By accessing the work you hereby accept the Terms. Non-commercial uses of the work are permitted
without any further permission from Dove Medical Press Limited, provided the work is properly
attributed. For permission for commercial use of this work, please see paragraphs 4.2 and 5 of our Terms.