")
Back to Journals » International Journal of General Medicine » Volume 8
Health behaviors and quality of life predictors for risk of hospitalization in an electronic health record-linked biobank
Authors Takahashi P, Ryu E, Olson J, Winkler E, Hathcock M, Gupta R, Sloan J, Pathak J, Bielinski S , Cerhan J
Received 26 March 2015
Accepted for publication 4 June 2015
Published 11 August 2015 Volume 2015:8 Pages 247—254
DOI https://doi.org/10.2147/IJGM.S85473
Checked for plagiarism Yes
Review by Single anonymous peer review
Peer reviewer comments 4
Editor who approved publication: Dr Scott Fraser
Paul Y Takahashi,1,2 Euijung Ryu,3 Janet E Olson,3 Erin M Winkler,4 Matthew A Hathcock,3 Ruchi Gupta,3 Jeff A Sloan,3 Jyotishman Pathak,3 Suzette J Bielinski,3 James R Cerhan3
1Division of Primary Care Internal Medicine, 2Department of Internal Medicine, 3Department of Health Sciences Research, 4Center for Individualized Medicine, Mayo Clinic, Rochester, MN, USA
Background: Hospital risk stratification models using electronic health records (EHRs) often use age and comorbid health burden. Our primary aim was to determine if quality of life or health behaviors captured in an EHR-linked biobank can predict future risk of hospitalization.
Methods: Participants in the Mayo Clinic Biobank completed self-administered questionnaires at enrollment that included quality of life and health behaviors. Participants enrolled as of December 31, 2010 were followed for one year to ascertain hospitalization. Data on comorbidities and hospitalization were derived from the Mayo Clinic EHR. Hazard ratios (HR) and 95% confidence interval (CI) were used, adjusted for age and sex. We used gradient boosting machines models to integrate multiple factors. Different models were compared using C-statistic.
Results: Of the 8,927 eligible Mayo Clinic Biobank participants, 834 (9.3%) were hospitalized. Self-perceived health status and alcohol use had the strongest associations with risk of hospitalization. Compared to participants with excellent self-perceived health, those reporting poor/fair health had higher risk of hospitalization (HR =3.66, 95% CI 2.74–4.88). Alcohol use was inversely associated with hospitalization (HR =0.57 95% CI 0.45–0.72). The gradient boosting machines model estimated self-perceived health as the most influential factor (relative influence =16%). The predictive ability of the model based on comorbidities was slightly higher than the one based on the self-perceived health (C-statistic =0.67 vs 0.65).
Conclusion: This study demonstrates that self-perceived health may be an important piece of information to add to the EHR. It may be another method to determine hospitalization risk.
Keywords: alcohol, aging, multiple chronic conditions, EHR, health behavior, hospitalization, quality of life
Introduction
With the passage of the Affordable Care Act in the United States, health care groups and hospitals have focused on methods of identifying patients at highest risk of hospitalization or emergency room (ER) visits.1 The number and severity of comorbid health conditions is often a common method of ranking patients for risk of hospitalization using the electronic health record (EHR). Comorbid health burden is the basis for the adjusted clinical group (ACG), which is a commonly used risk stratification method.2 In a prior work, we have shown that Minnesota medical tiering, based on the ACG, has good predictive value for hospitalization.3,4 Haas et al found a similar predictive ability for the ACG tiering (C-statistic, 0.73) and Minnesota tiering (C-statistic, 0.71).3 Patients with a higher comorbid health burden possess higher health costs compared to patients with lower or no comorbid health burden.5 Older age, in particular those patients over 80, also places a patient at higher risk of hospitalization and ER visit.6 Comorbid health burden and age play a role in initial determination of risk in adults and can be the method of determining eligibility for case management.
While comorbid health burden and age are useful for hospitalization risk stratification, the expanding types of data in EHRs may allow for additional predictors or factors. Specifically, patient reported outcomes (PROs), health behaviors, and environmental factors pertaining to an individual patient may provide better predictions for risk. For example, quality of life (QoL) is increasingly being collected within EHRs as a part of assessing outcomes of health care,7 but may also play a role in risk assessment. The self-assessed QoL is a component of the probability of repeated admissions (PRA®) which is a common instrument to predict hospitalization.8 However, the association of hospitalization risk and specific aspects of QoL such as physical, emotional, spiritual, and social QoL are less well known. There is potential for using QoL information in a reminder system within the EHR, much like body mass index (BMI) to alert the providers about potential actions for care.9
While health behaviors like nutrition, alcohol, and smoking habits are increasingly being assessed by health care providers and stored in EHR systems, these factors are not commonly included in hospitalization risk prediction models.6,8 Other demographic factors like BMI are also not routinely included in models. Individually, these factors have been shown to play a role in hospitalization. For example, our prior work showed that low BMI (BMI <18.5) is associated with increased risk of hospitalization10 and smoking has been associated with multiple illnesses,11 which lead to hospitalization. Historically, these lifestyle factors have not been collected systematically and therefore have not been included in risk prediction models. If health behaviors have a strong association with hospitalization, better documentation within the EHR may be warranted.12
Therefore, given the increasing use of EHRs to capture PROs, there is a need to evaluate other potential risk stratification methods for hospitalization. The PRO instruments would ideally be easy to administer, standardized across institutions, and incorporated in EHRs for use in patient care as well as predictive algorithms. This might be especially relevant for smaller and/or rural health care practices that typically do not have a large information technology or data analyst workforce for implementation and validation of a standard risk prediction model such as ACG or Minnesota tiering. We evaluated whether self-rated health status, QoL, or other health behaviors can predict hospitalization risk and compared this to the standard model of age and comorbid health conditions derived from the Mayo Clinic EHR for all patients enrolled within Mayo Clinic Biobank (MCB).
Methods
Study setting and participants
This analysis was conducted within the MCB. The MCB enrolled over 21,000 subjects with both clinical and biospecimens data in the first 3 years of recruitment.13 Those participants who also enrolled in Employee and Community Health (ECH) were eligible for this analysis. Patients are considered enrolled in ECH if they have seen a provider within 3.5 years prior to index date. ECH is comprised of three primary care divisions at Mayo Clinic’s campus in Rochester, Minnesota, including Family Medicine, Primary Care Internal Medicine, and Community Pediatrics. ECH patients receive their primary care at Mayo Clinic and are primarily served by the Mayo Clinic Hospital – Rochester (includes Mayo Clinic Hospital, St Marys Campus and Mayo Clinic Hospital, Methodist Campus). Each patient has a primary care provider and their care is coordinated through a Minnesota Medical Home model which requires population health management.14 The MCB participants who were assigned to ECH on December 31, 2010, were selected for this study, henceforth referred to as Biobank-ECH. Participants were followed for 12 months through December 31, 2011, for the primary outcome of hospitalization status. This study was approved by the Mayo Clinic Institutional Review Board.
Mayo Clinic Biobank
Upon entry within the program, the MCB catalogs information on biospecimens and initial questionnaire data. MCB has a robust study data management system which tracks sample information and provides linkage to subject data like questionnaire data or demographics. The MCB has linkage to Mayo Clinic EHR phenotypic and health outcomes data. The use of the MCB for population health has been supported by our previous work comparing the participants in the MCB to the broader ECH population.4
Outcome
The primary outcome variable was hospitalization during the 12 months following December 31, 2010. Hospitalization was determined from the Mayo Clinic EHR after excluding patients for outpatient surgical interventions and colonoscopies.
Predictor variables
Demographic factors included age, sex, self-reported employment status (not working, working full-time, and working part-time), and educational status (high school or less, associate degree, college degree, and graduate/professional degree). BMI was calculated from self-reported weight (kg) divided by height (m) squared from the survey, or if not available, from the EHR.
Self-perceived health status (“In general, would you say your health is excellent, very good, good, fair, or poor?”) was analyzed as a four category variable (excellent, very good, good, and fair/poor combined). Change in self-perceived health status (“Compared to one year ago, how would you rate your health in general now?”) was classified as somewhat or much better, about the same, or somewhat or much worse. The biobank questionnaires are available online (http://www.mayo.edu/research/documents/biobank-questionnaire/doc-20086430).
Overall QoL, and QoL for the specific domains of mental, physical, emotional, social activity, and spiritual well-being, were self-reported using a Likert scale of 0 (as bad as it can be) to 10 (as good as it can be). The scores from the subgroups were categorized into low (0–5), low normal (6–7), and high normal (8–10). Optimism was evaluated using the Life Orientation Test-Revised, a 6-item scale of optimism and pessimism.15 We also measured fatigue using a 0 (no fatigue) to 10 (greatest possible fatigue) point Likert scale.16 Social support was measured using a 7-question instrument and summarized using the ENRICHD Social Support Instrument; higher scores represent greater social support.17
Alcohol consumption was categorized as having a drink containing alcohol < once a month, < once a week, 2–3 times per week, and ≥4 times per week. A never smoker was defined as someone who had smoked less than 100 cigarettes in their lifetime, and smoking status was defined as ever vs never. Diet data included daily intake of vegetables, categorized as 0–1, 2, and 3+ servings. Physical activity was assessed using the Godin score, with a high score representing more frequent exercise.18
For chronic disease burden, each participant had Minnesota medical tiering calculated as of December 31, 2010, using data from the Mayo Clinic EHR. Each outpatient or inpatient visit yields a diagnosis with an ICD 9 code. Each outpatient visit can have up to four codes and each inpatient visit can have up to 25 codes. ICD 9 codes are considered within the year prior to coding. Each diagnosis is placed within an expanded diagnosis clusters which is further clustered into one of 22 major expanded diagnosis clusters (MEDCs). These MEDCs are then counted to form the tiers of Minnesota tiering. The model uses the MEDCs and categorizes patients into five tiers including low (0 chronic conditions), basic (1–3 conditions), intermediate (4–6 conditions), extended (7–9 conditions), and complex (10 or more conditions). Minnesota medical tiering is based upon the adjusted clinical group (ACG®) methodology.2 Administrative data from the EHR used to calculate the ACG, have proven effective in predicting hospitalization using this methodology.19
Statistical analysis
We report the basic demographic characteristics of the Biobank-ECH cohort, stratified by the status of hospitalization during 1-year follow-up. The two groups were compared using the chi-squared test for categorical variables and the Mann–Whitney test for continuous variable (age). Adjusting for age and sex, Cox proportional hazards models were used to estimate hazard ratios (HRs) and 95% confidence intervals (CIs) for the association with risk of hospitalization and each of demographic factors (BMI, education, employment status), QoL factors (overall health, health compared to one year ago, physical shape compared to others, overall QoL, subgroup QoLs [mental, physical, emotional, and spiritual], level of social activity, optimism, level of fatigue, psychological health, and social support), and health behaviors (general dental check-up, vegetable intakes, exercise, smoking, and alcohol consumption).
Gradient boosting machines (GBM) models were applied to integrate multiple factors listed above for the risk of hospitalization. GBM modeling is a machine learning technique that focuses on improving prediction by combining information from many variables that individually may not be significant but together are very informative.20 In GBM models based on demographic factors, QoL, and health behaviors, relative influence of each variable was estimated with higher number indicating stronger influence on the risk of hospitalization risk. Using tenfold cross-validation, the variation of relative influence of each variable was calculated. Two models (a standard model of age, sex, and comorbid conditions based on Minnesota medical tiering, and a model based on factors with highest relative influence) were compared using C-statistics. Calibrations of both models were also assessed using the method based on Hosmer–Lemeshow formula.21 In addition, tenfold cross-validation approaches were used to calculate the average C-statistics for each model. All analysis was conducted using R software (http://cran.us.r-project.org/) including R library gbm for GBM modeling.22
Results
On December 31, 2010, there were 16,631 people enrolled in the MCB, of which 8,927 (54%) were also enrolled within ECH (Biobank-ECH). Table 1 summarizes the demographic characteristics at enrollment of the Biobank-ECH participants stratified on hospitalization status in 2011. Those hospitalized during follow-up were older and had higher Minnesota medical tiering score. They were also less likely to work full time.
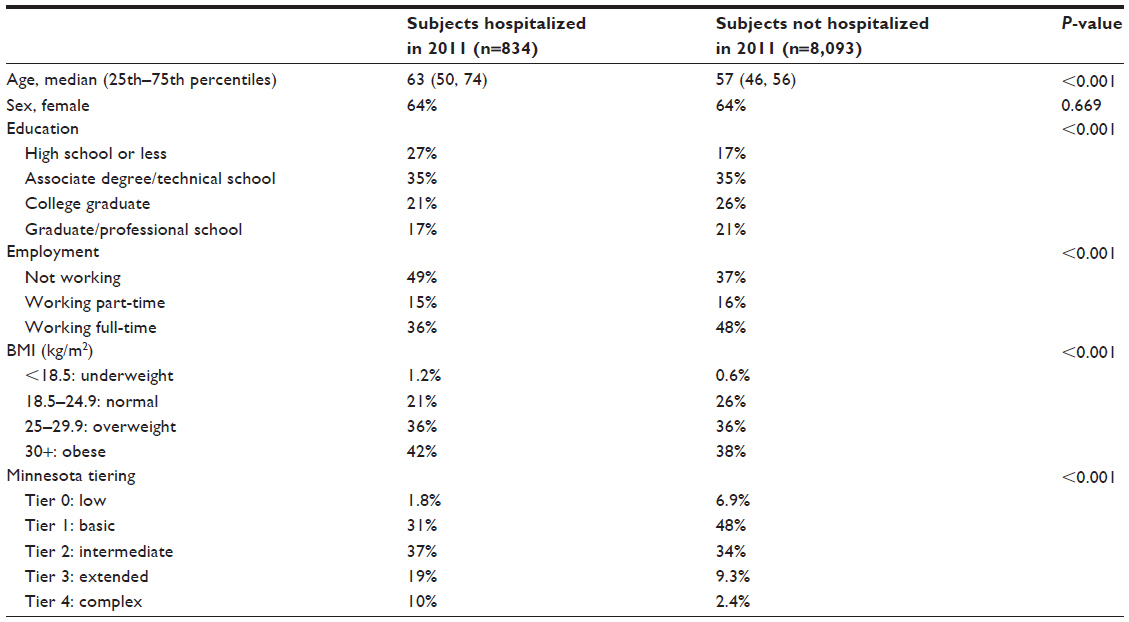 | Table 1 Demographic characteristics and comorbid health burden (based on Minnesota tiering) of Biobank-ECH subjects, stratified by the hospitalization status during 2011 |
Lower education level, unemployed status, underweight, and obesity were all significantly associated with an increased risk of hospitalization (Figure 1). Less educational attainment was associated with increased risk for hospitalization (HR =1.77, 95% CI 1.42–2.21). Working full time had a lower risk of hospitalization (HR =0.72, 95% CI 0.59–0.87) compared to not working. Compared to a normal BMI, underweight (BMI <18.5; HR =1.98, 95% CI 1.04–3.75), and obese (BMI ≥30; HR =1.37, 95% CI 1.14–1.65) participants had higher risk of hospitalization.
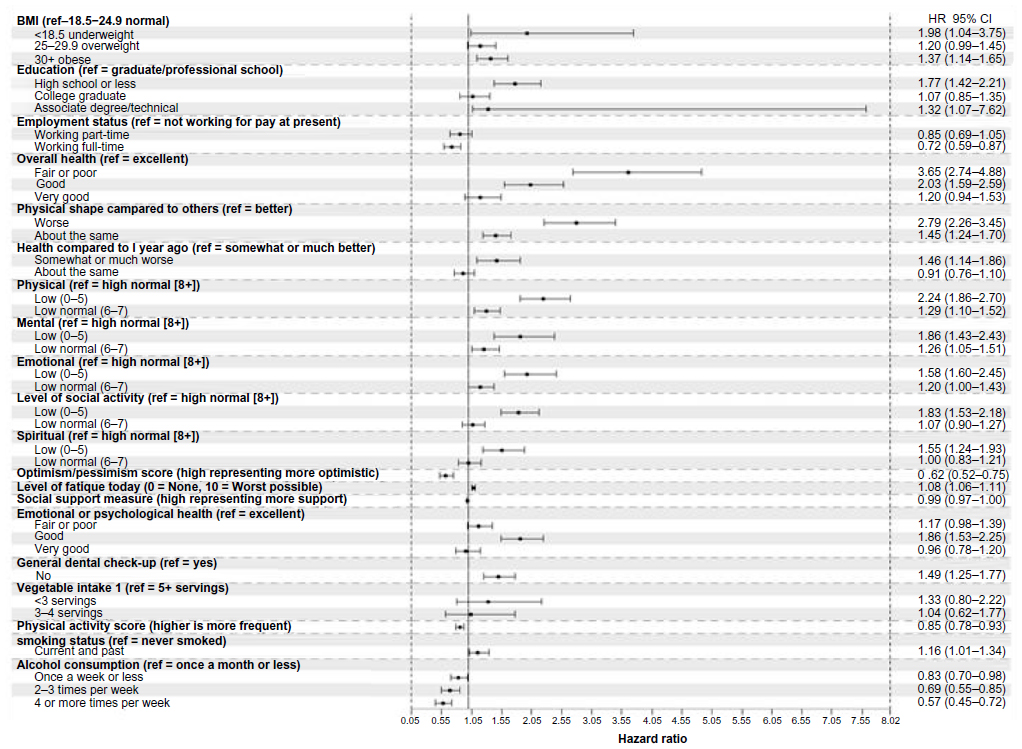 | Figure 1 Associations between demographic factors, QoL and health behaviors and the risk of hospitalization, adjusted for age and sex. |
Among all QoL and health behaviors assessed, self-perceived health status had the strongest association with hospitalization (Figure 1). Compared to excellent health, participants with fair or poor health had a higher risk of hospitalization (HR =3.66, 95% CI 2.74–4.88) (Figure 1). Likewise, participants who reported their physical shape to be worse than others had higher risk of hospitalization (HR =2.79, 95% CI 2.26–3.45). In addition to poor overall QoL, fair or poor emotional QoL was also associated with higher risk of hospitalization (HR =1.93, 95% CI 1.51–2.45). For behavioral factors, alcohol use was inversely associated with hospitalization (HR =0.57 for ≥4 drinks a week compared to <1 drink a month, 95% CI 0.45–0.72). The remaining behavioral predictors were not significantly associated with hospitalization.
A GBM model utilizing all demographic factors, QoL, and health behaviors showed that age had the highest contribution to the risk of hospitalization, followed by self-perceived health. Among all factors considered, relative influence was 41% for age and 16% for self-perceived health (Figure 2). Using tenfold cross-validation, relative influences ranged between 36% and 44% for age and between 13% and 19% for self-perceived health.
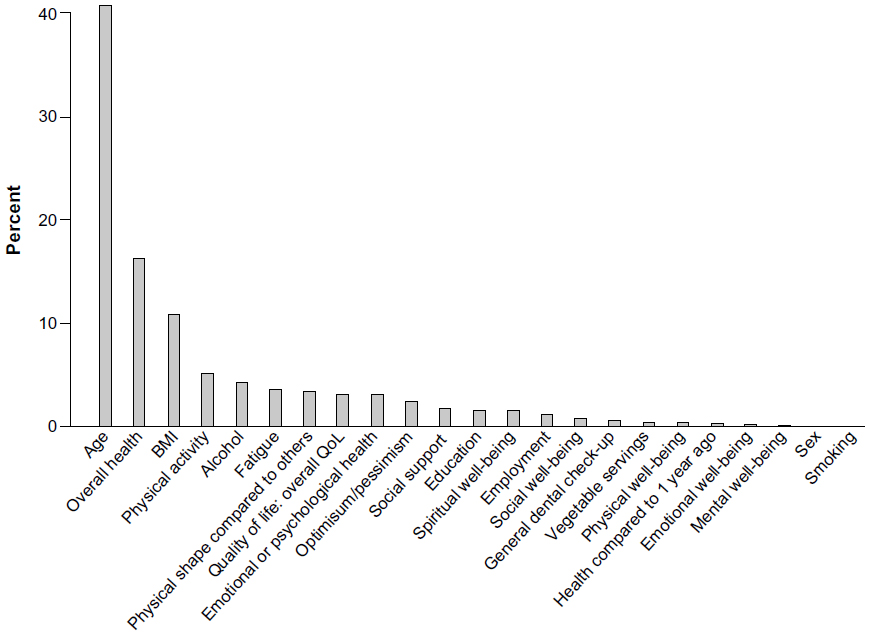 | Figure 2 Relative influence (%) of each demographic factors, QoL, and health behaviors in gradient boosting machines (GBM) model. |
A simple model using age, sex, and self-perceived health status (self-reported variable with highest relative influence) showed slightly lower predictive ability, compared to a traditional model based on age, sex, and tiering (C-statistics =0.65, 95% CI: 0.64–0.66 vs 0.67 95% CI: 0.66–0.68). In addition, both models showed good calibration (overall deviance =6.6, df=8, P=0.58 for perceived general health vs overall deviance =4.8, df=8, P=0.77 for tiering model). Average C-statistics based on tenfold cross-validation was 0.67 for tiering model and 0.65 for self-perceived health status.
Discussion
In our study we hypothesized that PROs and health behaviors can predict hospitalization and would perform as well as standard models for risk stratification. We found that lower self-perceived health status was a strong predictor of hospitalization in the Biobank-ECH population. In our model, we compared age, sex, and comorbid health to a model of age, sex, and self-rated health, and to a model of age, sex, and all significant variables including the QoL and health behaviors. We found comparable C-statistics in all of the models with values ranging from 0.67 to 0.65 with self-perceived health being slightly lower at 0.65, which supports use of the simple model in certain clinical situations. In models based on comorbid illness and billing codes, there may be a lag in the collection of the billing data.
Our results expand on the previous research. In a study of 5,876 older patients, self-perceived health was a predictor of hospitalization, and self-perceived health was included in a hospitalization risk-prediction instrument.8 In a previous study of 2,812 subjects in the Yale Health and Aging Project, self-rated health dichotomized into the bottom three categories versus the top two categories found decreased hospitalization in patients with the highest self-rated health (relative risk 0.85, 95% CI 0.77–0.89).23 We found that worse physical, emotional, and social activity well-being were risk factors for hospitalization whereas worse spiritual and mental well-being were not predictive. Overall, self-rated health remained the primary predictor for hospitalization and has the most utility clinically, while the individual aspects of well-being did not add much to the model as noted in Figure 2.
Our findings are consistent with other studies in selected populations. For example, in a study with 496 patients over 85 years of age, poor self-perceived health status was associated with hospitalization using a 100-point analog scale.24 In 21,732 Veteran Health Administration patients, a single self-rated health question was associated with hospitalization with an area under the curve 0.60–0.64 depending upon the instrument from which the question was drawn.25 Thus, our findings reinforce the potential utility of single-item question for risk stratification.
Moderate exercise and moderate alcohol use were protective for hospitalization. Those who drank four to five drinks a week had lower hospitalization compared to those who did not drink. Alcohol consumption is a complex issue with hospitalizations associated with acute intoxication, withdrawal, pancreatitis, and chronic alcoholic disease like liver disease.26 However, alcohol has also been associated with lower cardiovascular mortality.27 One study of 10,292 health maintenance organization patients found higher number of physician visits and hospitalizations in nondrinkers compared to moderate drinkers.28 Our findings provide some evidence that moderate alcohol use may be protective or may be a marker for better functional status or lifestyle. Moderate alcohol use has been associated with higher socioeconomic status while heavier use has been associated with lower socioeconomic status.29 Patients with severe illness or on certain medications may elect to stop alcohol consumption, which could also potentially explain higher hospitalizations in the nondrinkers. In a study of 7,753 British men, those who quit drinking had a higher prevalence of hypertension, angina, diabetes, and multimorbidity compared with moderate or heavy drinkers.30 Moderate exercise as measured on the Godin scale was associated with a 15% lower risk of hospitalization. The use of exercise can be an important “prescription” for many types of chronic illnesses. For example, exercise in heart failure may reduce heart failure-related hospital admissions.31
There are limitations with this study. One weakness involves the detection of the primary outcome of hospitalization. People may have been hospitalized outside of the Mayo Clinic Rochester hospital system. All members of the cohort receive their primary care within the Mayo system and most receive care within Mayo Clinic which should mitigate loss of outcomes, however there is another hospital in Olmsted County, Minnesota. Furthermore, our models for self-rated health were created in a single cohort and need validation in an external cohort. The accuracy of self-reported information is a concern with some patients electing to minimize information or forgetting other information with some recall bias.32 In some behavioral characteristics like smoking, there is a possibility of under-reporting.33 The research questionnaire used in the MCB differs from clinical surveys which often focus on medications, a review of current complaints, and past medical history.34 In addition, the MCB is largely white13 which may limit the generalizability to other populations or cultures and furthermore, restricting to those within ECH may further limit generalizability. The Olmsted County population is also wealthier, with a higher average educational level, compared to the US population.35
This simple, easy to assess PRO could be very useful in clinical practice and across EHRs. Specifically, it may be useful to add self-rated health to the EHR, which could be assessed at each patient encounter and trigger EHR alert systems to the medical providers. The primary barriers for implementing a single self-rated health question into clinical practice involve the current lack of infrastructure in administering the question and the sporadic nature of administration. Minnesota tiering and other common risk stratification models are commonly derived from EMR data3 and have been integrated into clinical workflow. There is further work being done to improve identification of phenotypes within biobanks and the EHR to refine our processes.36
Conclusion
In this retrospective cohort study of 8,927 participants, we found that self-rated health was an important risk factor for hospitalization in this primary care population. The magnitude of risk was comparable to other risk factors, like BMI. These findings may encourage the clinical use of self-rated health assessment as another clinical factor which can help with the decision for case management. Integration may help risk stratify patients who may best be served by additional medical help like care management; however, further research is needed to best utilize this information. Using self-rated health in the broad population EHR may encourage use of alerts to identify patients who might benefit from services. Previous experience using clinical alerts based on clinical informatics within a primary care population has been positive.37–39 Furthermore, the ability to leverage EHR-integrated PRO data has the potential to lower the barrier for smaller health care practices – without a large health IT or data analyst workforce – to appropriately tier and manage their patients.
Acknowledgments
We would like to acknowledge the Mayo Clinic Center for Individualized Medicine and the Mayo Clinic Department of Internal Medicine for support of this study.
Disclosure
Dr Takahashi is on a medical advisory board for Axial LLC. The other authors report no conflicts of interest in this work.
References
Kocher RP, Adashi EY. Hospital readmissions and the Affordable Care Act: paying for coordinated quality care. JAMA. 2011;306(16):1794–1795. | |
Weiner JP, Starfield BH, Steinwachs DM, Mumford LM. Development and application of a population-oriented measure of ambulatory care case-mix. Med Care. 1991;29(5):452–472. | |
Haas LR, Takahashi PY, Shah ND, et al. Risk-stratification methods for identifying patients for care coordination. Am J Manag Care. Sep 2013;19(9):725–732. | |
Takahashi PY, Ryu E, Olson JE, et al. Hospitalizations and emergency department use in Mayo Clinic Biobank participants within the employee and community health medical home. Mayo Clin Proc. 2013;88(9):963–969. | |
Naessens JM, Stroebel RJ, Finnie DM, et al. Effect of multiple chronic conditions among working-age adults. Am J Manag Care. 2011;17(2):118–122. | |
Crane SJ, Tung EE, Hanson GJ, Cha S, Chaudhry R, Takahashi PY. Use of an electronic administrative database to identify older community dwelling adults at high-risk for hospitalization or emergency department visits: the elders risk assessment index. BMC Health Serv Res. 2010;10:338. | |
Ridgeway JL, Beebe TJ, Chute CG, et al. A brief Patient-Reported Outcomes Quality of Life (PROQOL) instrument to improve patient care. PLoS Med. 2013;10(11):e1001548. | |
Boult C, Dowd B, McCaffrey D, Boult L, Hernandez R, Krulewitch H. Screening elders for risk of hospital admission. J Am Geriatr Soc. 1993;41(8):811–817. | |
O’Grady JS, Thacher TD, Chaudhry R. The effect of an automated clinical reminder on weight loss in primary care. J Am Board Fam Med. 2013;26(6):745–750. | |
Takahashi PY, Sauver JL, Olson TC, Huber JM, Cha SS, Ebbert JO. Association between underweight and hospitalization, emergency room visits, and mortality among patients in community medical homes. Risk Manag Healthc Policy. 2013;6:1–6. | |
Samet JM. Tobacco smoking: the leading cause of preventable disease worldwide. Thorac Surg Clin. 2013;23(2):103–112. | |
Linder JA, Schnipper JL, Middleton B. Method of electronic health record documentation and quality of primary care. J Am Med Inform Assoc. 2012;19(6):1019–1024. | |
Olson JE, Ryu E, Johnson KJ, et al. The Mayo Clinic Biobank: a building block for individualized medicine. Mayo Clin Proc. 2013;88(9):952–962. | |
Solberg LI, Crain AL, Tillema J, Scholle SH, Fontaine P, Whitebird R. Medical home transformation: a gradual process and a continuum of attainment. Ann Fam Med. 2013;11(Suppl 1):S108–S114. | |
Scheier MF, Carver CS, Bridges MW. Distinguishing optimism from neuroticism (and trait anxiety, self-mastery, and self-esteem): a reevaluation of the Life Orientation Test. J Pers Soc Psychol. 1994;67(6):1063–1078. | |
Schwartz AL, Meek PM, Nail LM, et al. Measurement of fatigue. determining minimally important clinical differences. J Clin Epidemiol. Mar 2002;55(3):239–244. | |
The ENRICHD investigators. Enhancing recovery in coronary heart disease patients (ENRICHD): study design and methods. Am Heart J. 2000;139(1 Pt 1):1–9. | |
Godin G, Shephard RJ. A simple method to assess exercise behavior in the community. Can J Appl Sport Sci. 1985;10(3):141–146. | |
Baldwin LM, Klabunde CN, Green P, Barlow W, Wright G. In search of the perfect comorbidity measure for use with administrative claims data: does it exist? Med Care. 2006;44(8):745–753. | |
Atkinson EJ, Therneau TM, Melton LJ 3rd, et al. Assessing fracture risk using gradient boosting machine (GBM) models. J Bone Miner Res. 2012;27(6):67–72. | |
Crowson CS, Atkinson EJ, Therneau TM. Assessing calibration of prognostic risk scores. Stat Methods Med Res. Epub April 7, 2014. | |
The Comprehensive R Archive Network [database on the Internet]. Vienna: The R Foundation; 2014. Available from: http://cran.us.r-project.org. Accessed August 20, 2014. | |
Kennedy BS, Kasl SV, Vaccarino V. Repeated hospitalizations and self-rated health among the elderly: a multivariate failure time analysis. Am J Epidemiol. 2001;153(3):232–241. | |
Nagga K, Dong HJ, Marcusson J, Skoglund SO, Wressle E. Health-related factors associated with hospitalization for old people: comparisons of elderly aged 85 in a population cohort study. Arch Gerontol Geriatr. 2012;54(2):391–397. | |
DeSalvo KB, Fan VS, McDonell MB, Fihn SD. Predicting mortality and healthcare utilization with a single question. Health Serv Res. 2005;40(4):1234–1246. | |
Rehm J, Giesbrecht N, Patra J, Roerecke M. Estimating chronic disease deaths and hospitalizations due to alcohol use in Canada in 2002: implications for policy and prevention strategies. Prev Chronic Dis. 2006;3(4):A121. | |
Costanzo S, Di Castelnuovo A, Donati MB, Iacoviello L, de Gaetano G. Alcohol consumption and mortality in patients with cardiovascular disease: a meta-analysis. J Am Coll Cardiol. 2010;55(13):1339–1347. | |
Rice DP, Conell C, Weisner C, Hunkeler EM, Fireman B, Hu TW. Alcohol drinking patterns and medical care use in an HMO setting. J Behav Health Serv Res. 2000;27(1):3–16. | |
Marmot M. Inequality, deprivation and alcohol use. Addiction. 1997;92(Suppl 1):S13–S20. | |
Wannamethee G, Shaper AG. Men who do not drink: a report from the British Regional Heart Study. Int J Epidemiol. 1988;17(2):307–316. | |
Davies EJ, Moxham T, Rees K, et al. Exercise based rehabilitation for heart failure. Cochrane Database Syst Rev. 2010(4):CD003331. | |
Ritter PL, Stewart AL, Kaymaz H, Sobel DS, Block DA, Lorig KR. Self-reports of health care utilization compared to provider records. J Clin Epidemiol. 2001;54(2):136–141. | |
Dietz PM, Homa D, England LJ, et al. Estimates of nondisclosure of cigarette smoking among pregnant and nonpregnant women of reproductive age in the United States. Am J Epidemiol. 2011;173(3):355–359. | |
St Sauver JL, Hagen PT, Cha SS, et al. Agreement between patient reports of cardiovascular disease and patient medical records. Mayo Clin Proc. 2005;80(2):203–210. | |
St Sauver JL, Grossardt BR, Leibson CL, Yawn BP, Melton LJ 3rd, Rocca WA. Generalizability of epidemiological findings and public health decisions: an illustration from the Rochester Epidemiology Project. Mayo Clin Proc. 2012;87(2):151–160. | |
Pathak J, Bailey KR, Beebe CE, et al. Normalization and standardization of electronic health records for high-throughput phenotyping: the SHARPn consortium. J Am Med Inform Assoc. 2013;20(e2):e341–e348. | |
Chaudhry R, Tulledge-Scheitel SM, Thomas MR, et al. Clinical informatics to improve quality of care: a population-based system for patients with diabetes mellitus. Inform Prim Care. 2009;17(2):95–102. | |
Kesman RL, Rahman AS, Lin EY, Barnitt EA, Chaudhry R. Population informatics-based system to improve osteoporosis screening in women in a primary care practice. J Am Med Inform Assoc. 2010;17(2):212–216. | |
Chaudhry R, Scheitel SM, McMurtry EK, et al. Web-based proactive system to improve breast cancer screening: a randomized controlled trial. Arch Intern Med. 2007;167(6):606–611. |
 © 2015 The Author(s). This work is published and licensed by Dove Medical Press Limited. The full terms of this license are available at https://www.dovepress.com/terms.php and incorporate the Creative Commons Attribution - Non Commercial (unported, v3.0) License.
By accessing the work you hereby accept the Terms. Non-commercial uses of the work are permitted without any further permission from Dove Medical Press Limited, provided the work is properly attributed. For permission for commercial use of this work, please see paragraphs 4.2 and 5 of our Terms.
© 2015 The Author(s). This work is published and licensed by Dove Medical Press Limited. The full terms of this license are available at https://www.dovepress.com/terms.php and incorporate the Creative Commons Attribution - Non Commercial (unported, v3.0) License.
By accessing the work you hereby accept the Terms. Non-commercial uses of the work are permitted without any further permission from Dove Medical Press Limited, provided the work is properly attributed. For permission for commercial use of this work, please see paragraphs 4.2 and 5 of our Terms.