Back to Journals » Cancer Management and Research » Volume 13
Gut Microbiota and Sunitinib-Induced Diarrhea in Metastatic Renal Cell Carcinoma: A Pilot Study
Authors Su Z ![]() , Lu L
, Lu L ![]() , Chen F, Chen J, Chen X
, Chen F, Chen J, Chen X ![]()
Received 12 July 2021
Accepted for publication 29 October 2021
Published 20 November 2021 Volume 2021:13 Pages 8663—8672
DOI https://doi.org/10.2147/CMAR.S328451
Checked for plagiarism Yes
Review by Single anonymous peer review
Peer reviewer comments 3
Editor who approved publication: Dr Ahmet Emre Eşkazan
Zhimin Su,1,2 Linbin Lu,1 Fuyu Chen,3 Jianhui Chen,4 Xiong Chen1
1Department of Oncology, 900th Hospital of PLA, Fuzong Clinical Medical College of Fujian Medical University, Fuzhou, 350024, People’s Republic of China; 2Department of Medical Oncology, Xiamen Branch, Zhongshan Hospital, Fudan University, Xiamen, 361015, People’s Republic of China; 3Department of Substation Maintenance Center, State Grid Quanzhou Electric Power Supply Company, Quanzhou, 362000, People’s Republic of China; 4Department of Urology, Fujian Medical University Union Hospital, Fuzhou, 350024, People’s Republic of China
Correspondence: Xiong Chen
Department of Oncology, 900th Hospital of PLA, Fuzong Clinical Medical College of Fujian Medical University, 156 North Xierhuan Road, Fuzhou, 350024, People’s Republic of China
Email [email protected]
Introduction: Sunitinib-induced diarrhea seriously affects the prognosis of patients with metastatic renal cell carcinoma (mRCC) and reduces their quality of life. We aim to explore and find the relationship between sunitinib-induced diarrhea and gut microbiota.
Methods: Feces were collected from 31 mRCC patients receiving sunitinib treatment. To characterize the feces gut microbiome profiles of patients, the V3-V4 region of 16S rRNA sequencing was carried out in this study.
Results: Gut microbial diversity was decreased both in the severe diarrhea group and in the sunitinib-post group. The microbial composition with higher abundance of Bacteroides (mucus degrading bacteria) and lower abundance of Faecalibacterium, Oscillospira, Ruminococcaceae, Eubacterium and Coriobacteriaceae (butyrate-producing bacteria) were found in patients with diarrhea. Interestingly, the abundance of Actinobacteria was decreased in patients receiving sunitinib with severe diarrhea.
Conclusion: This study reported an association between gut microbiota and sunitinib-induced diarrhea. Defects of the butyrate-producing bacteria and the increase in Bacteroides may be the physiological basis of sunitinib-induced diarrhea.
Keywords: sunitinib-induced diarrhea, 16S rRNA sequencing, gut microbial diversity, butyrate-producing bacteria
Introduction
Kidney cancer, representing 3.7% of all recorded cancer cases, is one of the 10 most common cancers worldwide.1 The 5-year survival rate of kidney cancer is 53% in locoregional phase (stage III) but decreased to 8% in metastatic phase, respectively.2 Vascular endothelial growth factor-tyrosine kinase inhibitors are approved for treatment in patients with metastatic renal cell carcinoma, including sunitinib, sorafenib, pazopanib and axitinib.3,4 Zhang Sh showed that sunitinib can significantly prolong the overall survival (OS) and progression-free survival (PFS) in patients with advanced renal cell carcinoma. In the meantime, the treatment-related side effects are also attracting increasing attention.5 Among the pivotal studies of first-line VEGF-TKIs, the cumulative incidence is 51% of all grades of diarrhea, and 10% of grade 3/4 diarrhea.6,7 High incidences of all grades of diarrhea were reported from patients on sunitinib (61%), sorafenib (53%), pazopanib (63%) and axitinib (55%), respectively.8 Diarrhea may jeopardize the patient’s health and reduce the quality of life. Several consensus statements have been approved for the management of sunitinib’s toxicities, but the recommendations offered therein are merely supported by clinical experience.9 Thus, how to prevent and manage diarrhea is of vital importance since dose reductions and treatment discontinuations may significantly affect the final outcome.
Gut microbiota are located in the intestinal epithelial mucosa. Their physiological functions include maintaining the local barrier homeostasis, affecting the metabolism, inflammation, immune system and other functions of the human body.10 The gut microbiota regulates barrier functions and mucosal immune homeostasis by interacting with epithelial and stromal intestinal cells.11–13 Janelsins BM and Park JH both reported that the gut microbiota is involved in inflammatory immunity via lipopolysaccharide (LPS) or butyrate formation in colon cells.14–16 It has been commonly assumed that sunitinib may cause direct damage to colonic mucosa. Latterly this assumption is further supported by the data which shows the addition of VEGF inhibitors significantly reduced the capillaries network in intestinal villi.17 In recent years, several studies indicated that a mixture of pancreatic, neurologic and vascular bowel dysfunction with potential over-growth of gut microbes may account for sunitinib-induced diarrhea.8 In recent years, immune checkpoint inhibitors (ICIs) and tyrosine kinase inhibitors (TKIs) have been widely used in patients with primary mRCC.3,18 A meta-analysis suggested an increased risk of all-grade diarrhea, grade 3–4 diarrhea and grade 3–4 decreased appetite in patients treated with immuno-TKI combinations.19 In addition, Pal SK has demonstrated that intestinal flora in patients with mRCC has changed after VEGF-TKIs treatment.20 However, the composition and diversity of the gut microbiota and their correlation with prognosis remains unclear.
Our study aims to assess the relationship between sunitinib-induced diarrhea and gut microbiota initially explore the correlation between gut microbiota and gastrointestinal toxicity of sunitinib and provide a new strategy for prevention, diagnosis and treatment of sunitinib-induced diarrhea.
Materials and Methods
Patient Selection
The main criteria for this study were renal cell carcinoma with distant metastasis, no diabetes, hypertension or digestive tract disease, and currently receiving sunitinib. Each patient was treated with sunitinib for at least 2 weeks. Patients who had participated in other studies took probiotics within 8 weeks or combined treatment were excluded in this study. Written informed consent was obtained from each patient. This study was carried out in accordance with the principles of the Helsinki declaration. Participants’ demographics, clinicopathological data and eating habits were collected from hospital electronic medical records and follow-up phone inquiries.
Specimen Collection
A standard operating procedure was used by all the patients. A total of 31 patients were enrolled in this study. Finally, 33 fecal samples were collected (31 samples were collected after sunitinib treatment, while 2 samples were collected before sunitinib treatment). The fecal samples collected directly by participants froze at −80°C within 24 hours of collection. The microbiota of all fecal samples was assessed by the V3-V4 region of 16S rRNA sequencing.
Ethics Approval and Consent to Participate
The Ethics Committee of the 900th Hospital of PLA Biomedical Research Department provided ethical approval, and informed consent for collecting and preserving samples and details was obtained from each patient.
Diarrhea Characterization
Patients were diagnosed as having grade 1–4 diarrhea or no diarrhea by using Common Toxicity Criteria for Adverse Events (CTCAE;4. 0). Based on the severity of diarrhea, the patients were divided into a mild diarrhea group (grade 1–2 diarrhea) and severe diarrhea group (grade 3–4 diarrhea). Each patient with or without diarrhea submitted fecal samples, and together reported the symptoms related to diarrhea at the same time.
Extraction of Genome DNA and PCR Products
Total genome DNA was extracted using the standard CTAB/SDS method. DNA concentration and purity were detected by 1% agarose electrophoresis. DNA was diluted to 1 ng/µL with sterile water for sequencing. Primers used in this study: 16S V4-V5:515F-907R, 18S V9:1380F-1510R, ITS1: ITS1F- ITS2R. 16S/18S rRNA fragments were amplified using the specific primer. All PCR reactions were carried out in 30 µL reactions with 15 µL of Phusion High-Fidelity PCR Master Mix (New England Biolabs); 0.2 µM of forward and reverse primers, and about 10 ng template DNA. Thermal cycling reaction protocol: initial denaturation at 98°C for 1 min, followed by 30 cycles of denaturation at 98°C for 10 s, annealing at 50°C for 30 s, and elongation at 72°C for 60 s, and final extension at 72°C for 5 min. PCR products were mixed with 1X loading buffer (contained SYB green) and loaded on 2% agarose gel for electrophoresis detection. Samples between 400 and 450 bp length with a bright main strip were collected for further experiments. PCR products were mixed in equidensity ratios and then purified with GeneJET Gel Extraction Kit (Thermo Scientific).
Library Preparation and Multiplex Sequencing
Sequencing libraries were constructed using NEB Next®Ultra™DNA Library Prep Kit for Illumina (NEB, USA) following standard protocols and index codes were added for sequencing. The library quality was tested on the Qubit@ 2.0 Fluorometer (Thermo Scientific) and Agilent Bioanalyzer 2100 system. The library was sequenced on an Illumina MiSeq platform, and about 250 bp/300 bp length of paired-end reads were generated and collected.
All fecal samples from patients were sequenced using V3-4 regions. 16S rRNA genes were amplified using a specific primer with a barcode. The following PCR primers were used to amplify 16S V3-V4 region: 341F-806R. Software QIIME was used to analyze the Illumina sequencing reads generated for the V3-V4 region of 16S rRNA.21
OUT Cluster and Species Annotation
Sequence analysis was performed using the UPARSE software package using the UPARSE-OTU and UPARSE-OTUref algorithms.22 Inhouse Perl scripts were used to analyze alpha (within samples) and beta (among samples) diversity. We pick a representative sequence for each OTU and use the RDP classifier to annotate taxonomic information for each representative sequence. The obtained sequences with ≥97% similarity were assigned to the same operational taxonomic units (OTUs). The diversity and taxonomic analysis of gut microbiota were determined by sampling-based OTUs analysis and presented by Shannon index and Rarefaction curves.23,24 The Rank-abundance distribution curve can be used to explain two aspects of diversity, namely species richness and species evenness.25 In horizontal direction, the abundance of species is reflected by the width of the curve. The higher the abundance of species, the larger the range of the curve on the horizontal axis. The shape of the curve (smoothness degree) reflects the average of species in the sample. The smoother the curve is, the more uniform the distribution of species is. Bacterial diversity and taxonomic analysis were determined by sampling-based OTUs analysis. All OTUs annotations are listed in the online Supplementary Table S1.
PCoA Analysis and Community Distribution
Unweighted unifrac distance was used for Principal Coordinate Analysis (PCoA) in this study. PCoA can help to obtain principal coordinates and visualize them from complex, multidimensional data by taking a transformation from a distance matrix to a new set of orthogonal axes.26 Using PCoA, the maximum variation factor was demonstrated by the first principal coordinate, and the second maximum factor by the second principal coordinate, respectively. Graphical representations of the relative abundance of microbes from phylum to species can be visualized using Krona chart.27 To validate differences in the abundances of individual taxonomy between the two groups, metastats software was applied in this study.
Difference Analysis
Linear discriminant analysis (LDA analysis) was used for the quantitative analysis of biomarkers within different groups.28 This LDA analysis was designed to analyze data where the number of species is much higher than the number of samples and to provide biological elucidation to establish statistical significance, biological consistency, and effect size estimation of predicted biomarkers.
Statistical Analyses
Paired Wilcoxon rank-sum tests were conducted to detect differences in clinical parameters between the two groups. A P value or an adjusted P value of less than 0.05 was considered statistically significant. Statistical analyses were performed using SPSS V. 20.0 (SPSS, Chicago, Illinois, USA).
Results
Baseline Characteristics of Patients
A total number of 31 patients were consented and enrolled in this study. Most of the patients were male (77.4%). Of these patients, 20 of them had sunitinib-induced diarrhea, while the other 11 did not. The median age at diagnosis was 59. There was no difference between the two groups in relation to gender, age and BMI score (Table 1). The most frequent metastatic tissues (in descending order) were lung, bone and lymph node metastasis, most of which had higher KPS scores. Most of the patients had intermediate IMDC risk in these two groups, only four patients faced with severe risk (Table 1). Each patient continued to receive sunitinib treatment lasting for an average of 19.1 months (ranging from 1.5 to 112) before collecting fecal sample.
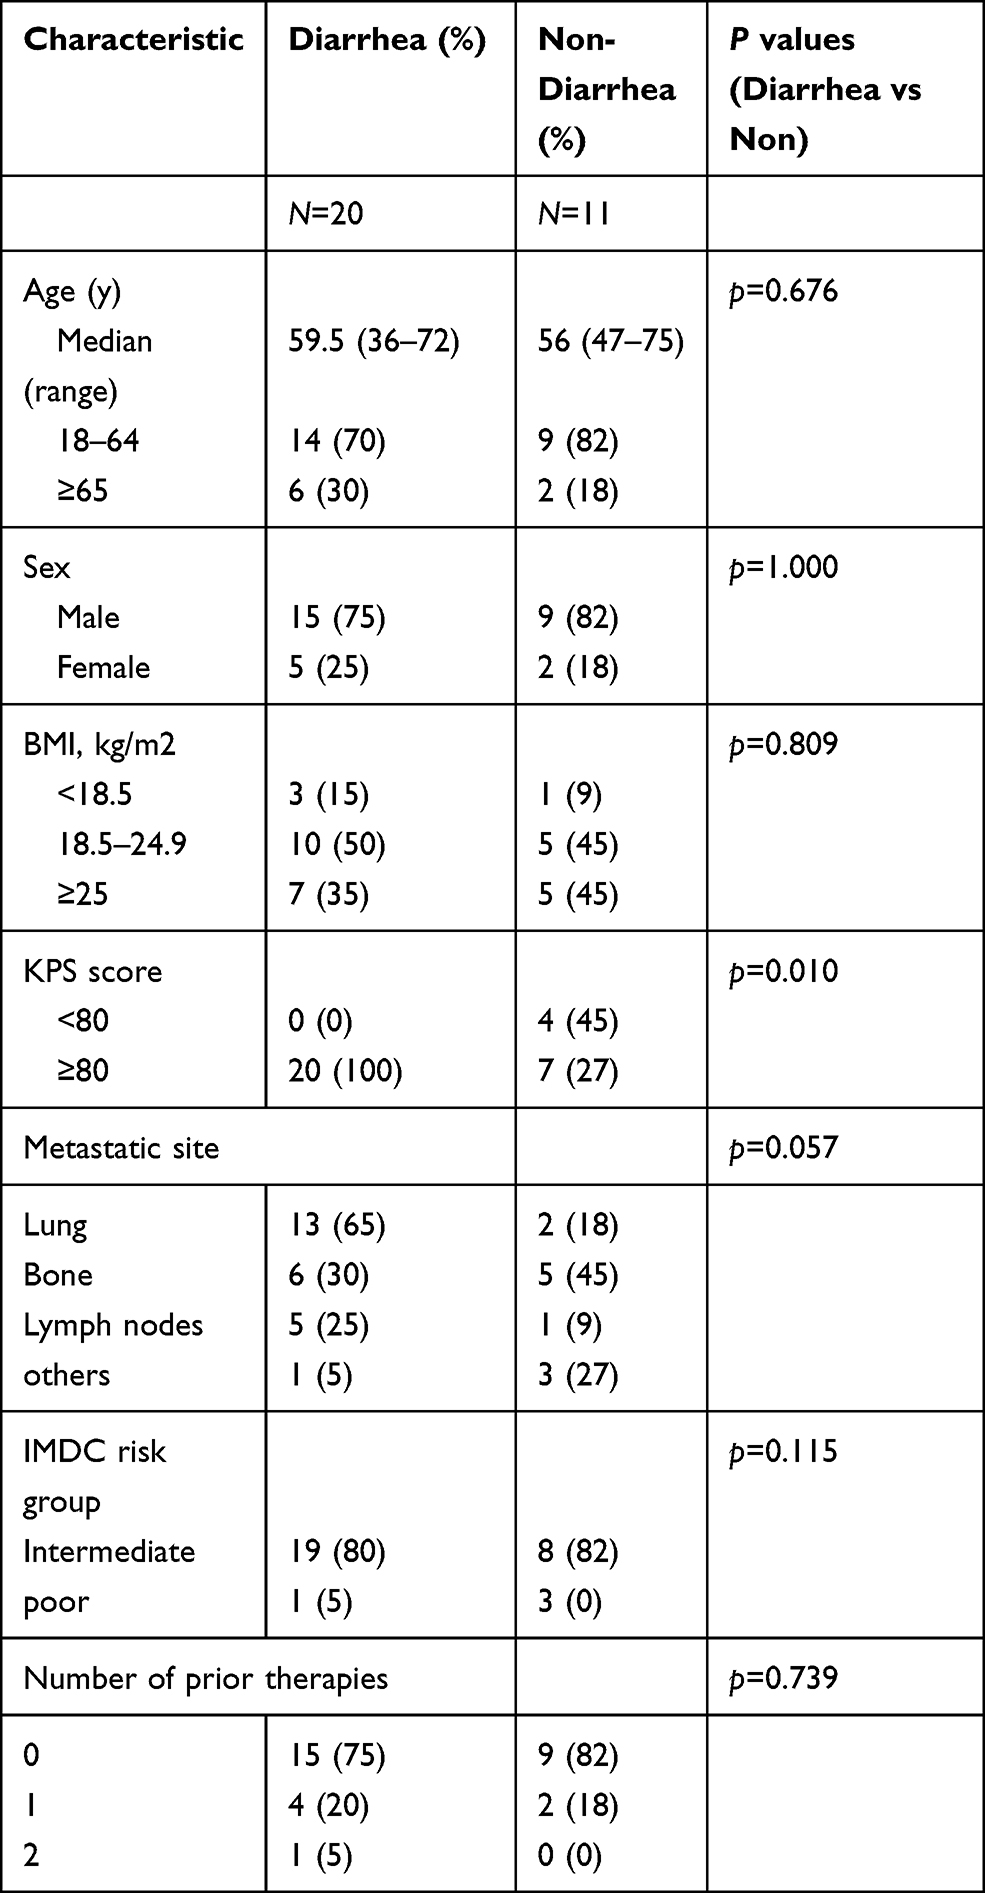 |
Table 1 Baseline Characteristics of Patients |
Gut Microbial Diversity
The species accumulation curves became flatter as the sample size increased, indicating that the sample size of this study was sufficient (Figure 1A). The estimated OTUs richness, which significantly decreased from the non-diarrhea group to the diarrhoea group, was basically close to the saturation level in each group by rarefaction analysis (Figure 1B), especially in the severe group (Figure 1C). The same result could be obtained from the rank-abundance distribution analysis (Figure 1D). Similarly, the rank-abundance distribution decreased in the severe group compared with the mild group (Figure 1E). In addition, Shannon analysis showed that gut microbial diversity in the diarrhea group was lower than that in the non-diarrhea group, but the results were not statistically significant (p=0.168) (Figure 1F); however, gut microbial diversity was significantly higher in the severe group than that in the mild group (p=0.048) (Figure 1G). Moreover, beta diversity was calculated with unweighted UniFrac using PCoA, indicating a symmetrical distribution of fecal microbiome among all the samples (Figure 1H).
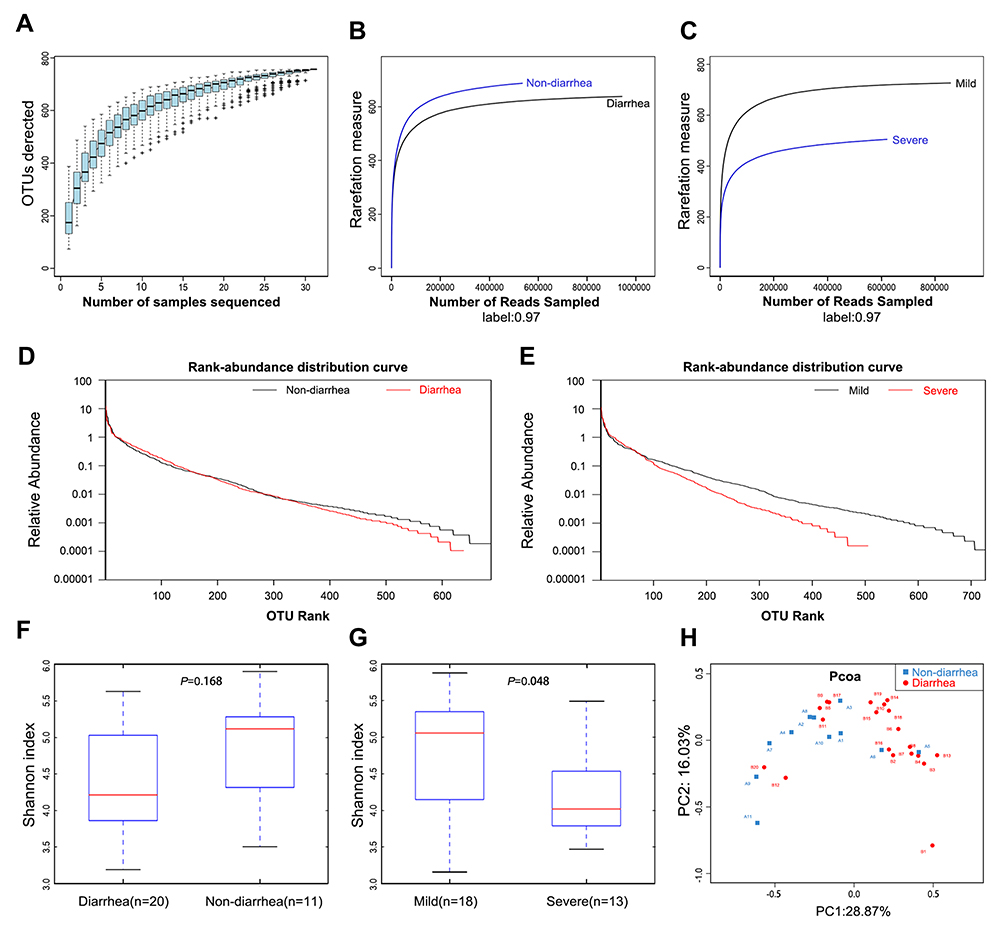 |
Figure 1 Gut microbiota diversity in patients (n=31). (A) Species accumulation curves became flatter as the sample size increased, indicating that the sample size of this study is adequate. (B) The estimated OTUs richness was significantly decreased from the non-diarrhea group (n=11) to the diarrhea group (n=20). (C) The estimated OTUs richness was significantly decreased in the severe group (n=13). (D) Rank-abundance distribution curves analysis showed that the relative abundance of the diarrhea group was lower than that of the non-diarrhea group. (E) The relative abundance of the severe group decreased compared with the mild group. (F) Gut microbial diversity in the diarrhea group was lower than that in the non-diarrhea group by Shannon analysis. (G) Gut microbial diversity was significantly higher in the severe group than that of in the mild group (p=0.048). (H) PCoA analysis indicated a symmetrical distribution of fecal microbial community among all the samples. Abbreviations: OTUs, Operational Taxonomic Units; Boxes represent the interquartile ranges, lines inside the boxes denote medians; PCoA, principal coordinates analysis. |
Microbial Community Composition
Phylogenetic profiles of fecal microbiome phylotypes with a median relative abundance, which was larger than 0.01% of total abundance were included for comparison. The average composition of microbiome at the phylum and genus levels were shown in Figure 2A. Bacterial phyla of Firmicutes, Bacteroidetes, and Proteobacteria were the three predominant classes in non-diarrhea groups and Bacterial phyla of Firmicutes, Bacteroidetes, Proteobacteria and Fusobacteria were the four predominant classes in non-diarrhea groups at phylum level, accounting for up to 90% of total sequences on average (Figure 2B). The microbial community distribution of the two groups at genus level was shown in the online Supplementary Figure S1.
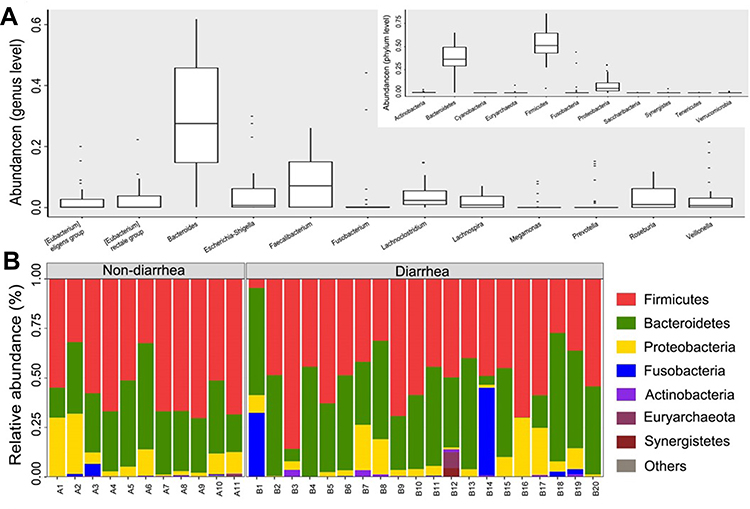 |
Figure 2 The composition of the microbial community and the predominant classes in two groups. (A) Composition of fecal microbiota at the phylum level and genus level. (B) The predominant classes of microbes in two groups at phylum level. The part of the abundance less than 1% was merged into others when plotting. |
The Change of Gut Microbiota in the Diarrhea Group
Notably, the abundance of Tenericutes significantly decreased in the diarrhea group (p=0.037) (Figure 3A). At the genus level, 7 genera of bacteria, including Faecalibacterium, Oscillospira, Ruminococcaceae, Eubacterium, Coriobacteriaceae, Ralstonia and Lachnospiraceae, their abundances in gut microbiota significantly decreased (All p<0.05, Figure 3B–J). Surprisingly, the abundance of Actinobacteria was found to be increased in the severe group (p=0.041) (Figure 3K).
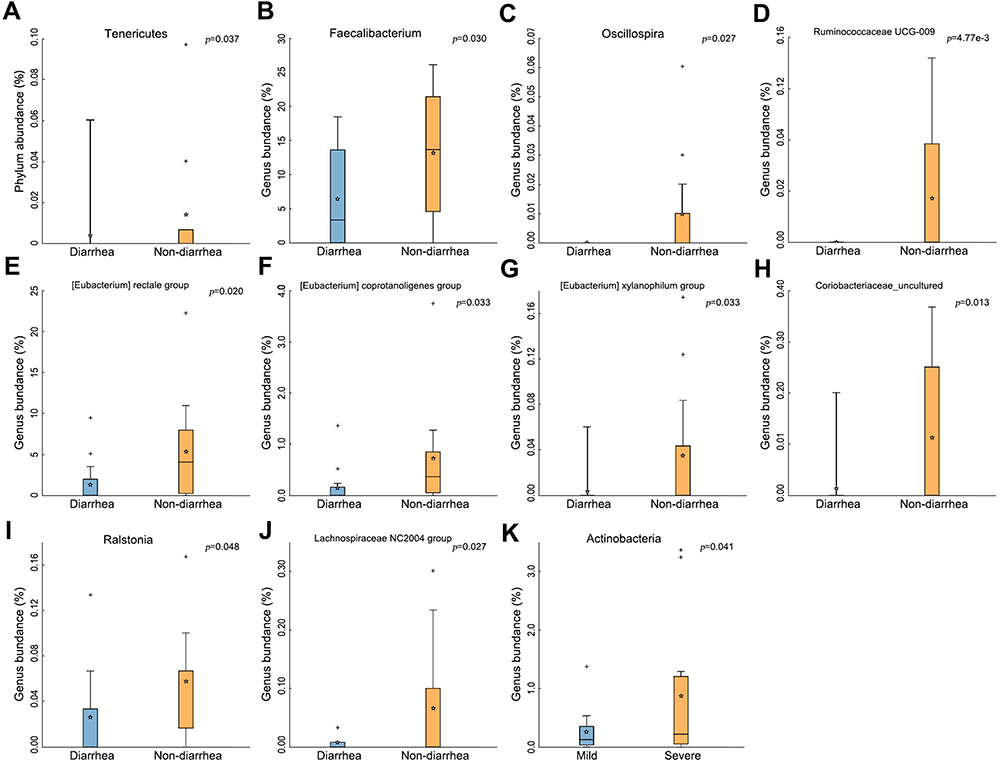 |
Figure 3 The change of gut microbiota in the diarrhea group. (A) Tenericutes significantly decreased in the diarrhea group (p=0.037). (B–J) Types of bacteria reduced in diarrhea group. (K) Less Actinobacteria was found in the severe group (p=0.041). The box presented 95% CIs; the line inside denotes the median, and the symbol “+” denotes the mean value. |
Difference Analysis
To validate the types of bacteria that had changed, LDA analysis was carried out in this study. The cladogram showed that the bacterial abundances of Prevotellaceae, Christensenellaceae, Family XIII, Ruminococcaceae and Burkholderiaceae significantly decreased in the diarrhea group versus non-diarrhea group (all p<0.05), while the abundances of Pasteurellaceae increased in the diarrhea group (Figure 4A). LDA scores were obtained by LDA analysis for the significant microbial communities in the two groups. The higher the scores are, the more significant the difference in microbial abundance is between the two groups. In the non-diarrhea group, Ruminococcaceae had the highest score, while Pasteurellaceae had the lowest score (p=0.0352, 0.0408, respectively) (Figure 4B), similar to the cladogram.
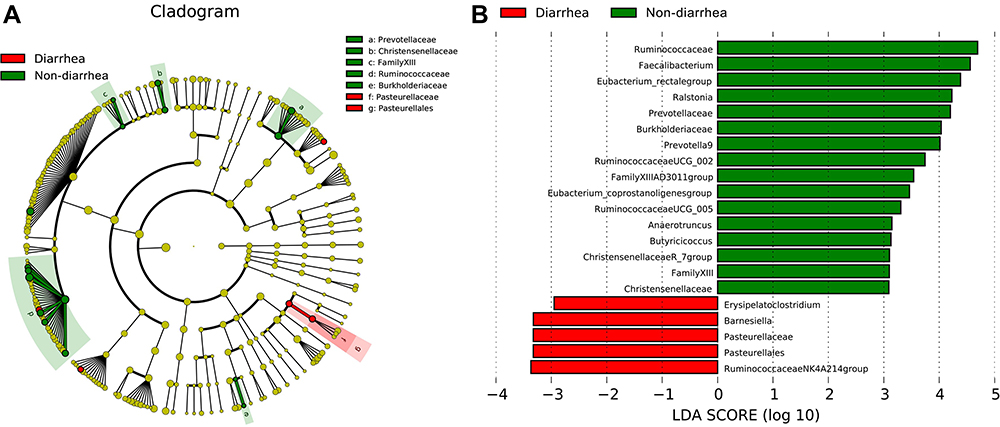 |
Figure 4 The change of bacteria displayed by LDA analysis. (A) Cladogram. The red and green nodes in the branches represented the microbiota that play an important role in the corresponding groups, respectively, while the yellow nodes represented the microbiota that do not play an important role in the two groups. (B) The LDA scores obtained by LDA analysis for the significant microbial communities in the two groups. The red and green regions indicated the abundance of different microbes. |
Bacteroides Decreased in Patients with Sunitinib
To further elucidate whether the sunitinib had affected the intestinal flora of an individual patient or the composition of fecal microbiota was preexisted, we additionally collected and analyzed two stool samples of patients before therapy. Rank-abundance distribution curves analysis showed that the microbial diversity decreased after treatment compared with that of previous treatment (Figure 5A). It is noteworthy that the abundance of Bacteroides decreased in sunitinib-post group (Figure 5B). This finding further revealed that patients with mRCC after taking sunitinib have an altered microbiota profile, which may relate to the vulnerability causing diarrhea. The specific LDA score value is shown in the online Supplementary Table S2.
 |
Figure 5 Bacteroides in patients with sunitinib. (A) Rank-abundance distribution curve. The bacterial diversity increased after sunitinib treatment. (B) Microbial community composition of patients before and after treatment. The abundance of Bacteroides was decreased in patients with sunitinib. |
Discussion
Notably, our study is the first to report changes in gut microbiota in patients with mRCC before and after treatment. Until now, limited studies indicated that there was a direct association between gut microbiota and sunitinib-induced diarrhea. Considering the incidence of gastrointestinal toxicity associated with VEGF-TKIs, we proposed that gut microbiota may be associated with the occurrence of diarrhea.29 In this study, we sequenced the total microbiome of fecal samples from 31 individuals with mRCC. We found that compared with the non-diarrhea group, the gut microbial diversity decreased in the severe diarrhea group. Moreover, the microbial diversity also decreased after taking sunitinib compared with that of before treatment. Therefore, the decline of bacterial diversity implies that greater richness or diversity in the gut microbiota community is a signal of a healthy gut microbiota in our cohort.
The alterations of gut microbiota in different chronic diseases such as inflammatory bowel diseases, T2D, atherosclerotic cardiovascular disease and chronic kidney disease are distinctive.30–33 Different diseases showed relatively characteristic microbial composition and diversity.34 Here, in patients with sunitinib-induced diarrhea, the richness of genera Faecalibacterium, Oscillospira, Ruminococcaceae, Eubacterium and Coriobacteriaceae, which belong to butyrate-producing bacterial families, decreased.35 As a major energy source for mucosal cells, butyrates are considered as important regulators for gene expression, inflammation, differentiation and apoptosis in host cells and appear to play pivotal roles in bacterial energy metabolism and gut health.36 Qin J had demonstrated that the abundances of butyrate-producing microbes in patients with T2D were significantly decreased.33 Moreover, the richness of Bacteroides was observed to be increased in patients with sunitinib-induced diarrhea but decreased in the sunitinib-post group. Therefore, the association between Bacteroides and the severe diarrhea group indicated the overgrowth of various harmful bacteria or archaea in patients with sunitinib-induced diarrhea. Bacteroides belong to mucus degrading bacteria. Mucus degradation led to increased susceptibility to the mucosal pathogen Citrobacter rodentium, resulting in a “leaky gut” condition and colitis, which is a risk factor for diarrhea.37 A preclinical study showed that the relative increase in Bacteroides has a positive effect on chemotherapy-induced diarrhea in the mucositis rat model.38 Interestingly, we found that the decrease of Actinobacteria in patients receiving sunitinib with severe diarrhea was likely consistent with the decrease of Akkermansia. Akkermansia muciniphila is a Gram-negative anaerobic microbe that uses secreted mucins as carbon and nitrogen source. Desirable modulation of Akkermansia muciniphila can provide health benefits by affecting microbiome-related metabolic profiles.39 The administration of Akkermansia muciniphila increased the intestinal levels of endocannabinoids that control inflammation, the gut barrier, and gut peptide secretion. Briefly, the decrease in butyrate-producing bacteria, the increase in mucus degrading bacteria and the potential decrease in Akkermansia muciniphila may promote intestinal mucosal destruction, thereby contributing to sunitinib-induced diarrhea. In the past few years, ICIs plus TKIs have made a major breakthrough in the treatment of mRCC patients.3,18,40 Comparison with the sunitinib group, a higher proportion of grade 3–4 diarrhea and grade 3–4 decreased appetite occurred in patients treated with immuno-TKI combinations in a meta-analysis.19 There remains a critical need to better predict treatment responses in patients with mRCC and to pre-emptively recognize patients at higher risk of treatment-attributable toxicities. Except the non–small-cell lung cancer, predictive biomarkers such as PD-L1 and tumor mutational burden have failed to consistently predict treatment outcomes.3 In clinical practice, Salgia et al prospectively collected feces from 33 mRCC patients with ICIs treatment, used whole-genome shotgun metagenomic sequencing to characterize microbiome, and identified specific bacteria such as Prevotella copri, Bifidobacterium adolescentis, and Faecalibacterium that were over-represented in patients who experienced better outcomes.41 These results implied that the above changed gut microbes may be prognostic factors and potential therapeutic targets to predict and manage sunitinib-induced diarrhea.
In recent years, preclinical data showed that Bifidobacterium Infant ameliorates chemotherapy-induced intestinal mucositis in colorectal cancer rats.42 Probiotics have been shown to prevent inflammatory bowel disease-related diarrhea, chemotherapy-induced diarrhea and other diseases.43–45 Although, the use of probiotics has never been investigated in TKI patients, only individual patients report considerable benefits. In the future, probiotics fortified with butyrate-producing bacteria and Akkermansia muciniphila as a new therapeutic plan for sunitinib-induced diarrhea are promising. Meanwhile, elimination of potential pathogenic species such as Bacteroides may reduce side effects of sunitinib, thereby the prognosis of patients could be improved. At present, to beneficially shift the gut microbiome diversity and composition, relevant clinical studies using probiotics and fecal microbiota transplantation (FMT) (NCT03772899 and NCT03772899) have been carried out.
Although there were restrictions on the dietary factors in this study, the samples were heterogeneous in a number of respects. Gastrointestinal toxicity of sunitinib may be affected by other potential factors in the whole procedure of disease treatment. Also, the collections of fecal samples were not uniformly performed. Patients had received at least 2 weeks of sunitinib treatment before collecting samples, to provide time for diarrhea development. In further study, the stool will be collected at pre-determined time points as baseline, after 2 weeks and 6 months of treatment respectively. Previous work revealed that butyrate regulates the generation of colonic Tregs and dampens the effector T-cell responses.46 Blood samples will be collected additionally from patients and measured by flow cytometry. In addition, the expansion of sample size, the inclusion of healthy samples and the analysis of prognosis will be improved in the next study. Further validation of our work will be carried out to explore the potential mechanisms by which the gut microbiota affects sunitinib-induced diarrhea.
Conclusion
This study showed that the severity of sunitinib-induced diarrhea was found to be inversely correlated with gut microbiota diversity and butyrate-producing bacteria, but positively correlated with Bacteroides. Compositional changes in gut microbiota may be a prognostic factor and a potential therapeutic target to prevent and manage sunitinib-induced diarrhea. Probiotics fortified with butyrate-producing bacteria and Akkermansia muciniphila may be an evidence-based treatment plan for sunitinib-induced diarrhea. Elimination of potentially pathogenic species such as Bacteroides may reduce the side effects of sunitinib, thereby improving the prognosis of patients. Next, we will conduct further studies required to explore the mechanism of intestinal flora affecting sunitinib associated diarrhea.
Acknowledgments
We thank Fuyu Chen for excellent assistant in statistical assistance and constructive advice.
Funding
This work was supported by the Natural Science Foundation of China (Nos. 81302067 and 81502360), the Natural Science Foundation of Fujian Province (Nos. 2016J01576, 2020J011147 and 2021J01281), and the Science and Technology Innovation Joint Foundation of Fujian Province (No.2017Y9125).
Disclosure
The authors report no conflicts of interest in this work.
References
1. Siegel RL, Miller KD, Jemal A. Cancer statistics, 2017. CA Cancer J Clin. 2017;67(1):7–30. doi:10.3322/caac.21387
2. Ravaud A, Motzer RJ, Pandha HS, et al. Adjuvant sunitinib in high-risk renal-cell carcinoma after nephrectomy. N Engl J Med. 2016;375(23):2246–2254. doi:10.1056/NEJMoa1611406
3. Escudier B, Porta C, Schmidinger M, et al. Renal cell carcinoma: ESMO clinical practice guidelines for diagnosis, treatment and follow-up. Ann Oncol. 2016;27(suppl 5):v58–58v68. doi:10.1093/annonc/mdw328
4. Rini BI, Escudier B, Tomczak P, et al. Comparative effectiveness of axitinib versus sorafenib in advanced renal cell carcinoma (AXIS): a randomised Phase 3 trial. Lancet. 2011;378(9807):1931–1939. doi:10.1016/S0140-6736(11)61613-9
5. Sh Z. Adjuvant Sunitinib in Renal-Cell Carcinoma. N Engl J Med. 2017;376(9):893.
6. Motzer RJ, Hutson TE, Tomczak P, et al. Sunitinib versus interferon alfa in metastatic renal-cell carcinoma. N Engl J Med. 2007;356(2):115–124. doi:10.1056/NEJMoa065044
7. Sternberg CN, Davis ID, Mardiak J, et al. Pazopanib in locally advanced or metastatic renal cell carcinoma: results of a randomized Phase III trial. J Clin Oncol. 2010;28(6):1061–1068. doi:10.1200/JCO.2009.23.9764
8. Schmidinger M. Understanding and managing toxicities of vascular endothelial growth factor (VEGF) inhibitors. EJC Suppl. 2013;11(2):172–191. doi:10.1016/j.ejcsup.2013.07.016
9. Appleby L, Morrissey S, Bellmunt J, Rosenberg J. Management of treatment-related toxicity with targeted therapies for renal cell carcinoma: evidence-based practice and best practices. Hematol Oncol Clin North Am. 2011;25(4):893–915. doi:10.1016/j.hoc.2011.05.004
10. Dzutsev A, Goldszmid RS, Viaud S, Zitvogel L, Trinchieri G. The role of the microbiota in inflammation, carcinogenesis, and cancer therapy. Eur J Immunol. 2015;45(1):17–31. doi:10.1002/eji.201444972
11. De Santis S, Cavalcanti E, Mastronardi M, Jirillo E, Chieppa M. Nutritional keys for intestinal barrier modulation. Front Immunol. 2015;6:612. doi:10.3389/fimmu.2015.00612
12. Vaishnava S, Behrendt CL, Ismail AS, Eckmann L, Hooper LV. Paneth cells directly sense gut commensals and maintain homeostasis at the intestinal host-microbial interface. Proc Natl Acad Sci U S A. 2008;105(52):20858–20863. doi:10.1073/pnas.0808723105
13. Peterson LW, Artis D. Intestinal epithelial cells: regulators of barrier function and immune homeostasis. Nat Rev Immunol. 2014;14(3):141–153. doi:10.1038/nri3608
14. Janelsins BM, Lu M, Datta SK. Altered inactivation of commensal LPS due to acyloxyacyl hydrolase deficiency in colonic dendritic cells impairs mucosal Th17 immunity. Proc Natl Acad Sci U S A. 2014;111(1):373–378. doi:10.1073/pnas.1311987111
15. Park JH, Jeong SY, Choi AJ, Kim SJ. Lipopolysaccharide directly stimulates Th17 differentiation in vitro modulating phosphorylation of RelB and NF-κB1. Immunol Lett. 2015;165(1):10–19. doi:10.1016/j.imlet.2015.03.003
16. Roy S, Trinchieri G. Microbiota: a key orchestrator of cancer therapy. Nat Rev Cancer. 2017;17(5):271–285. doi:10.1038/nrc.2017.13
17. Fan L, Iseki S. Immunohistochemical localization of vascular endothelial growth factor in the endocrine glands of the rat. Arch Histol Cytol. 1998;61(1):17–28. doi:10.1679/aohc.61.17
18. Chowdhury N, Drake CG. Kidney cancer: an overview of current therapeutic approaches. Urol Clin North Am. 2020;47(4):419–431. doi:10.1016/j.ucl.2020.07.009
19. Rizzo A, Mollica V, Santoni M, Massari F. Risk of selected gastrointestinal toxicities in metastatic renal cell carcinoma patients treated with immuno-TKI combinations: a meta-analysis. Expert Rev Gastroenterol Hepatol. 2021;15(10):1225–1232. doi:10.1080/17474124.2021.1948328
20. Pal SK, Li SM, Wu X, et al. Stool bacteriomic profiling in patients with metastatic renal cell carcinoma receiving vascular endothelial growth factor-tyrosine kinase inhibitors. Clin Cancer Res. 2015;21(23):5286–5293. doi:10.1158/1078-0432.CCR-15-0724
21. Caporaso JG, Kuczynski J, Stombaugh J, et al. QIIME allows analysis of high-throughput community sequencing data. Nat Methods. 2010;7(5):335–336. doi:10.1038/nmeth.f.303
22. Edgar RC. UPARSE: highly accurate OTU sequences from microbial amplicon reads. Nat Methods. 2013;10(10):996–998. doi:10.1038/nmeth.2604
23. Amato KR, Yeoman CJ, Kent A, et al. Habitat degradation impacts black howler monkey (Alouatta pigra) gastrointestinal microbiomes. ISME J. 2013;7(7):1344–1353. doi:10.1038/ismej.2013.16
24. Wang Y, Sheng HF, He Y, et al. Comparison of the levels of bacterial diversity in freshwater, intertidal wetland, and marine sediments by using millions of illumina tags. Appl Environ Microbiol. 2012;78(23):8264–8271. doi:10.1128/AEM.01821-12
25. Bates ST, Clemente JC, Flores GE, et al. Global biogeography of highly diverse protistan communities in soil. ISME J. 2013;7(3):652–659. doi:10.1038/ismej.2012.147
26. Jiang XT, Peng X, Deng GH, et al. Illumina sequencing of 16S rRNA tag revealed spatial variations of bacterial communities in a mangrove wetland. Microb Ecol. 2013;66(1):96–104. doi:10.1007/s00248-013-0238-8
27. Oberauner L, Zachow C, Lackner S, Högenauer C, Smolle KH, Berg G. The ignored diversity: complex bacterial communities in intensive care units revealed by 16S pyrosequencing. Sci Rep. 2013;3:1413. doi:10.1038/srep01413
28. Zhang C, Li S, Yang L, et al. Structural modulation of gut microbiota in life-long calorie-restricted mice. Nat Commun. 2013;4:2163. doi:10.1038/ncomms3163
29. Liu J, Nicum S, Reichardt P, et al. Assessment and management of diarrhea following VEGF receptor TKI treatment in patients with ovarian cancer. Gynecol Oncol. 2018;150(1):173–179. doi:10.1016/j.ygyno.2018.03.058
30. Armani RG, Ramezani A, Yasir A, Sharama S, Canziani M, Raj DS. Gut microbiome in chronic kidney disease. Curr Hypertens Rep. 2017;19(4):29.
31. Greenblum S, Turnbaugh PJ, Borenstein E. Metagenomic systems biology of the human gut microbiome reveals topological shifts associated with obesity and inflammatory bowel disease. Proc Natl Acad Sci U S A. 2012;109(2):594–599. doi:10.1073/pnas.1116053109
32. Jie Z, Xia H, Zhong SL, et al. The gut microbiome in atherosclerotic cardiovascular disease. Nat Commun. 2017;8(1):845. doi:10.1038/s41467-017-00900-1
33. Qin J, Li Y, Cai Z, et al. A metagenome-wide association study of gut microbiota in type 2 diabetes. Nature. 2012;490(7418):55–60. doi:10.1038/nature11450
34. Qin N, Yang F, Li A, et al. Alterations of the human gut microbiome in liver cirrhosis. Nature. 2014;513(7516):59–64. doi:10.1038/nature13568
35. Hooper LV, Xu J, Falk PG, Midtvedt T, Gordon JI. A molecular sensor that allows a gut commensal to control its nutrient foundation in a competitive ecosystem. Proc Natl Acad Sci U S A. 1999;96(17):9833–9838. doi:10.1073/pnas.96.17.9833
36. Louis P, Flint HJ. Diversity, metabolism and microbial ecology of butyrate-producing bacteria from the human large intestine. FEMS Microbiol Lett. 2009;294(1):1–8. doi:10.1111/j.1574-6968.2009.01514.x
37. Bhatt AP, Redinbo MR, Bultman SJ. The role of the microbiome in cancer development and therapy. CA Cancer J Clin. 2017;67(4):326–344. doi:10.3322/caac.21398
38. Wang Q, Garrity GM, Tiedje JM, Cole JR. Naive Bayesian classifier for rapid assignment of rRNA sequences into the new bacterial taxonomy. Appl Environ Microbiol. 2007;73(16):5261–5267. doi:10.1128/AEM.00062-07
39. Tu P, Bian X, Chi L, et al. Characterization of the functional changes in mouse gut microbiome associated with increased akkermansia muciniphila population modulated by dietary black raspberries. ACS Omega. 2018;3(9):10927–10937. doi:10.1021/acsomega.8b00064
40. Massari F, Rizzo A, Mollica V, et al. Immune-based combinations for the treatment of metastatic renal cell carcinoma: a meta-analysis of randomised clinical trials. Eur J Cancer. 2021;154:120–127. doi:10.1016/j.ejca.2021.06.015
41. Salgia NJ, Bergerot PG, Maia MC, et al. Stool microbiome profiling of patients with metastatic renal cell carcinoma receiving anti-PD-1 immune checkpoint inhibitors. Eur Urol. 2020;78(4):498–502. doi:10.1016/j.eururo.2020.07.011
42. Mi H, Dong Y, Zhang B, et al. Bifidobacterium infantis ameliorates chemotherapy-induced intestinal mucositis via regulating T cell immunity in colorectal cancer rats. Cell Physiol Biochem. 2017;42(6):2330–2341. doi:10.1159/000480005
43. Chang CW, Liu CY, Lee HC, et al. Lactobacillus casei variety rhamnosus probiotic preventively attenuates 5-fluorouracil/oxaliplatin-induced intestinal injury in a syngeneic colorectal cancer model. Front Microbiol. 2018;9:983. doi:10.3389/fmicb.2018.00983
44. Ganji-Arjenaki M, Rafieian-Kopaei M. Probiotics are a good choice in remission of inflammatory bowel diseases: a meta analysis and systematic review. J Cell Physiol. 2018;233(3):2091–2103. doi:10.1002/jcp.25911
45. Mego M, Chovanec J, Vochyanova-Andrezalova I, et al. Prevention of irinotecan induced diarrhea by probiotics: a randomized double blind, placebo controlled pilot study. Complement Ther Med. 2015;23(3):356–362. doi:10.1016/j.ctim.2015.03.008
46. Furusawa Y, Obata Y, Fukuda S, et al. Commensal microbe-derived butyrate induces the differentiation of colonic regulatory T cells. Nature. 2013;504(7480):446–450. doi:10.1038/nature12721
 © 2021 The Author(s). This work is published and licensed by Dove Medical Press Limited. The
full terms of this license are available at https://www.dovepress.com/terms
and incorporate the Creative Commons Attribution
- Non Commercial (unported, 3.0) License.
By accessing the work you hereby accept the Terms. Non-commercial uses of the work are permitted
without any further permission from Dove Medical Press Limited, provided the work is properly
attributed. For permission for commercial use of this work, please see paragraphs 4.2 and 5 of our Terms.
© 2021 The Author(s). This work is published and licensed by Dove Medical Press Limited. The
full terms of this license are available at https://www.dovepress.com/terms
and incorporate the Creative Commons Attribution
- Non Commercial (unported, 3.0) License.
By accessing the work you hereby accept the Terms. Non-commercial uses of the work are permitted
without any further permission from Dove Medical Press Limited, provided the work is properly
attributed. For permission for commercial use of this work, please see paragraphs 4.2 and 5 of our Terms.