Back to Journals » Diabetes, Metabolic Syndrome and Obesity » Volume 15
Guava Leaf Extract Suppresses Fructose Mediated Non-Alcoholic Fatty Liver Disease in Growing Rats
Authors Sharma P, Nair J, Sinh A, Shivangi, Velpandian T, Tripathi R, Mathur R
Received 4 July 2022
Accepted for publication 6 August 2022
Published 15 September 2022 Volume 2022:15 Pages 2827—2845
DOI https://doi.org/10.2147/DMSO.S381102
Checked for plagiarism Yes
Review by Single anonymous peer review
Peer reviewer comments 2
Editor who approved publication: Prof. Dr. Juei-Tang Cheng
Prateek Sharma,1 Jayachandran Nair,1 Anurag Sinh,1 Shivangi,1 Thirumurthy Velpandian,2 Ruchi Tripathi,1 Rajani Mathur1
1Department of Pharmacology, Delhi Institute of Pharmaceutical Science and Research, Delhi Pharmaceutical Sciences and Research University, New Delhi, 110017, India; 2Department of Ocular Pharmacology, Dr. R.P. Center for Ophthalmic Sciences, All India Institute of Medical Sciences, New Delhi, 110029, India
Correspondence: Rajani Mathur, Department of Pharmacology, Delhi Institute of Pharmaceutical Science and Research, Delhi Pharmaceutical Sciences and Research University, Pushp Vihar, Sec III, New Delhi, 110017, India, Tel +91-011-29551490, Fax +91-011-29554503, Email [email protected]
Purpose: Fructose is highly lipogenic, and its unhindered ingestion by children and adolescents is understood to induce hypertriglyceridemia and non-alcoholic fatty liver disease (ped-NAFLD) that is till date managed symptomatically or surgically. The aim of the present study was to investigate the potential of hydroethanolic extract of leaves of Guava (PG-HM) to suppress the alterations in the hepatic molecular signals due to unrestricted fructose (15%) drinking by growing rats.
Methods: Weaned rats (4 weeks old) in control groups had ad libitum access to fructose drinking solution (15%) for four (4FDR) or eight (8FDR) weeks, ie, till puberty or early adulthood, respectively, while treatment groups (4PGR, 8PGR) additionally received PG-HM (500 mg/kg, po).
Results: The PG-HM suppressed ped-NAFLD through hepatic signalling pathways of 1) leptin-insulin (Akt/FOX-O1/SREBP-1c), 2) hypoxia-inflammation (HIF-1ɑ/VEGF, TNF-ɑ), 3) mitochondrial function (complexes I–V), 4) oxidative stress (MDA, GSH, SOD) and 5) glycolysis/gluconeogenesis/de novo lipogenesis (hexokinase, phosphofructokinase, ketohexokinase, aldehyde dehydrogenase). Parri passu, the insulin sensitizing effect of PG-HM and its ethyl acetate fraction (PG-EA) was elucidated using HepG2 cells grown in media enhanced with fructose. Further, in murine hepatocytes cultured in fructose-rich media, PG-HM (35 μg mL-1) outperformed Pioglitazone (15 μM) and Metformin (5 mM), to suppress hepatic insulin resistance.
Conclusion: This study established that hydroethanolic extract of leaves of Guava (PG-HM) has potential to suppress hepatic metabolic alteration for the management of the pediatric NAFLD.
Keywords: Psidium guajava, pediatric NAFLD, insulin sensitizer, mitochondrial function
Graphical Abstract:

Introduction
Today, there is increasing interest in the use of traditional medicines (TMs) as they are perceived to be safe, economical, accessible and effective. The chemical diversity of TMs has been successfully tapped as novel leads or dietary supplements for prevention and treatment of human diseases. Globally, the various parts of the Guava plant (Psidium guajava Linn., fam Myrtaceae) have been extensively used as TM and many of these traditional practices have been evaluated and provided with pharmacological and phytochemical basis.1
The organic and aqueous extracts of guava leaves have been tested and found to possess antibacterial, antifungal, antidiarrhoeal, antiplasmodial, anti-cough, antiinflammatory, antipyretic, analgesic, immunomodulatory, spasmolytic, ulcer protective, nephroprotective, hepatoprotective and hypoglycemic properties.1 Comprehensive studies have established that the oral administration of the aqueous and ethanolic extracts of guava leaves to Albino rats is safe upto the doses of 100–500 and >2000 mg/kg, respectively, with no signs of toxicity or mortality.2,3 In clinical trials, the guava leaves have been associated with curative effects for infantile rotavirus enteritis, hypertension, abdominal pain, acute diarrhea, dysmenorrhea and diabetes. The formulation of aqueous guava leaf extract is approved as Food for Specified Health Uses and commercially available.
The main chemical components of leaves are flavonoids, essential oil, triterpenoids, tannins, flavonoids and saponins. The mature leaves have high concentrations of phenolic flavonoids like quercetin (2883.08 mg kg−1), myricetin (208.44 mg kg−1), luteolin (51.22 mg kg−1) and kaempferol (97.25 mg kg−1).4 It is well established that the quercetin (Qu) is one of the major phytoconstituents in the leaves of Guava and can be attributed for its medicinal effects.5,6
As part of the modern-day lifestyle, today’s children and adolescents are rampantly consuming fructose in the form of high fructose corn syrup that is a constituent of sweetened beverages, soft drinks, juice, soda, energy bars, breakfast cereals, flavored yogurts, sauces and confectioneries.7,8 The ingested fructose is absorbed into portal circulation where its hepatic uptake is characteristically not limited by either insulin or any feedback-dependent pathway. The consequent fructose rush into the liver triggers the hepatocytic machinery into de novo lipogenesis, intrahepatic fat accumulation and metabolic derangements that are clubbed together as non alcoholic fatty liver disease (NAFLD).9–15
Globally, a geometric rise in the incidence of ped-NAFLD has been recorded that has worsened with COVID-19, and as this population ages, the loss of healthy workforce together with rise in health-care demands will pose a huge economic burden on the society.16 Presently, there is no standard line of treatment for ped-NAFLD and it is symptomatically managed without addressing the etiology of the disease. Moreover, the chronic nature of the ailment necessitates that the pharmacotherapy has to be long-standing which is self-limited by adverse events, poor compliance, low adherence and loss of faith in therapy by the patient.
In order to address these lacunae, the leaves of Guava have been investigated to provide an effective solution for the management of ped-NAFLD.
Materials and Methods
Chemicals
All standard chemicals (purity >99.99%) were purchased from Sigma-Aldrich, USA. Ketamine (Aneket®) was purchased from Neon Lab Ltd., India and D (-) fructose was purchased from Central Drug House Pvt. Ltd. India. Chemicals of analytical and LC-MS grades were purchased from E.Merck, Germany.
Authentication of Guava Leaves and Preparation of Hydro-Ethanolic Extract
The Guava leaves were locally collected, identified and authenticated (National Bureau of Plant Genetic Resources, Indian Council of Agricultural Research, New Delhi, India) and a voucher specimen was preserved (NHCP/NBPGR/2014-5).
The fresh Guava leaves were washed with distilled water, dried in shade and powdered. The powder was macerated (ethanol:water::1:1), filtered, and concentrated under reduced pressure to give PG-HM (31 g from 100 g of dry leaf). The PG-HM was further concentrated and fractionated sequentially using organic solvents in increasing order of polarity, ie, n-hexane, chloroform, ethyl acetate, n-butanol to provide PG-H, PG-C, PG-EA, and PG-B, respectively. The aqueous phase from all steps of partitioning was pooled as an aqueous fraction (PG-A). PG-HM and fractions were stored under vacuum until all experiments were over.
Method Validation for Quantification of Quercetin
For the quantification of Qu in PG-HM, PG-H, PG-C, PG-EA, and PG-B, the 4000Q- TRAP Tandem Mass Spectrometer (AB Sciex, USA) was coupled with ultra-high-performance liquid chromatography system (Accela Thermo Fisher Scientific, USA) and controlled by the softwares Analyst, ver 1.4.2 (AB Sciex, USA) and Chrom Quest, ver 4.5 (Thermo Fisher Scientific, USA), respectively.
The separation and elution of Qu was achieved using C18 column (Purospher star, 50×4.6 mm, 3.5 µm, Merck, Germany) and (A) deionized water with 0.1% formic acid and (B) methanol with 0.1% formic acid. The samples were subjected to gradient elution as per following optimized plan: 80% A (0–0.5 min), 80–20% A (0.5–1 min), hold 20% A (1–3 min), 20–80% A (3.5–5 min). The injection volume of samples, column temperature and flow rate were kept at 20 µL, 25 ± 1°C and 1 mL min−1, respectively.
The ionization source was kept in negative ion mode (AB Sciex, USA) and the full mass spectrum of the reference standard was obtained by flow infusion analysis (FIA). The compound dependent parameter like Declustering Potential (84V), Entrance Potential (10V), Collision Energy (31V) and Cell Exit Potential (10V) were manually optimized by pumping (Harvard Company, USA) standard solution (100 ng mL−1) at a flow rate of 5 µL min−1. The quantification of Qu in extract and plasma was performed using multiple reactions monitoring (MRM) mode based on the molecular/fragment ion transitions for the reference standard, Qu (Supplementary Table S1). The FIA was used to optimize the source-dependent parameters: gas1 (40 psi), gas2 (60 psi); curtain gas (30 psi); collection gas (6 psi); ion spray voltage (4500 V) and temperature (450°C).
Preparation of Internal and Reference Standards
For the above mentioned method of quantification of Qu, the internal standard (IS) was Probenecid (50 ng mL−1) that was prepared in acetonitrile (70%) and formic acid (0.1%). The stock solution (1 mg mL−1) of Qu was diluted to prepare the working solution (100 ng mL−1). The aliquots of the working solution (20 µL) and IS (200 µL), were mixed, vortexed (1 min), injected (150 µL) in triplicate and analyzed by LC-MS/MS using the method described in previous section.
Validation of Method
The LC-MS/MS Based Method for the Quantification of Qu Was Validated in Accordance with the ICH Guidelines.17
Linearity and Range
The aliquots of reference standard, Qu (3.9–500 ng mL−1, 20 µL) and IS (200 µL), were mixed, vortexed (1 min), injected (150 µL) in triplicate and analyzed by LC-MS/MS. The regression equation, with correlation coefficient (R2) better than 0.99 was achieved.
Accuracy and Precision
The standard addition method was used to measure the recovery of the reference standard, Qu and establish the accuracy of the optimized method. The precision of the optimized method was studied over three concentrations (7.8, 15.6 and 500 ng mL−1), by repeated application of the sample.
Limit of Detection and Limit of Quantification
The limit of detection (LOD) and limit of quantification (LOQ) were determined by blank determination method.18
Quantification of Quercetin in PG-HM
The PG-HM was weighed (1 mg), dissolved (methanol:water1::1+formic acid 0.1%), vortexed (5 min) and sonicated (10 min at 30°C). An aliquot (20 µL) of this standard sample was mixed with IS (200 µL), vortexed (1 min), centrifuged (15,000 rpm; 10 min; 30°C) and analyzed after loading (150 µL) in LC-MS/MS system.
In vivo Study
Experimental Animals
The male albino rats of Wistar strain (4 weeks old, 50–55 g) were maintained under standard laboratory conditions (25 ± 2°C, 12 h light/dark cycles) in the animal house of the Institute and provided with commercially available pellet diet (M/S Pranav Agro Industries Ltd. India) and filtered drinking water, ad libitum. All experiments using animals were conducted in accordance with the guidelines issued by the CPCSEA and the protocols concerning the animal handling were approved by the standing Institutional Animal Ethics Committee (IAEC/15-II/6-7).
Study I: Weaned animals (4 weeks old) were randomly divided into three groups (n = 6 each) - normal control (4NDR), fructose control (4FDR) and treatment (4PGR) and provided either chow + drinking water, chow + fructose (15%) or chow + fructose (15%) + PG-HM (500 mg kg−1d−1, po), ad libitum, respectively, for 4 weeks.
Study II: Weaned animals (4 weeks old) were randomly divided into three groups (n = 6 each)- normal control (8NDR), fructose control (8FDR) and treatment (8PGR) and provided either chow + drinking water, chow + fructose (15%), or chow + fructose (15%) + PG-HM (500 mg kg−1d−1, po), ad libitum, respectively, for 8 weeks.
Food Intake, Fructose/Water Intake, Body Weight, and Total Calorie Consumed
The record of intake of food, water/fructose over 24 h period of all groups, was maintained. The body weight of all the animals was recorded daily and the total calorie consumed over the study duration (metabolizing energy (kcal)/feed intake (g) + energy (kcal)/fructose intake (g)) was calculated for each group.
Fasting Blood Glucose, Oral Glucose Tolerance Test, HOMA- IR
Once every week, the food and fructose of all the rats was withdrawn for 12 h, and their fasting blood glucose (FBG) was measured (Accu-check glucometer, Hoffmann-La Roche Ltd, India).
OGTT and HOMA-IR
At the end of the study duration, the oral glucose tolerance test (OGTT) was performed. After 16h of fasting, the rats were force-fed glucose (2 g kg−1, po) and their blood glucose was measured at 0 min and after 30, 45, 60, 90 and 120 min of the event. The total area under the blood glucose (mg dl−1) vs time (min) curve was calculated.19 The Homeostasis Model Assessment- Index of Insulin Resistance was calculated using the formula: HOMA IR = glucose (mg dl−1) x insulin /405.
Study Termination
At the study termination, the rats were anesthetized (ketamine/xylazine, 80/15 mg kg−1, ip) and their blood was withdrawn by cardiac puncture. This was followed by euthanasia by carbon dioxide asphyxiation. The plasma and serum were separated from the collected blood, labelled and stored (−80°C) for further biochemical estimations.
The vital organs (heart, liver, kidneys) were surgically removed, washed, dab-dried and weighed (Sartorius CPA 2250, Germany). The hepatic tissue was sectioned and stored as per the standard protocols for biochemical estimations.
Biochemical Estimations
The following biochemical estimations, in the collected blood samples, were conducted using commercially available kits in accordance with the methods given by the manufacturer-protein (GeNei, Merck), high-density lipoprotein, low-density lipoprotein, very low-density lipoprotein, and triglyceride (Bayer Diagnostics), alkaline phosphatase (Accurex Biomedical), aspartate aminotransferase and alanine aminotransferase (Erba Lab), phosphofructokinase (Kinesis DX), leptin, insulin, phosphoprotein kinase B, p-tyr-STAT-3, hypoxia-inducible factor-1α (Ray Biotech), phosphatidylinositol-4,5-bisphosphate 3-kinase (Bioassay Laboratory Technology), uric acid, c-Jun N-terminal kinases, AMP-activated protein kinase, sterol regulatory element-binding transcription factor and forkhead box protein O1 transcription factor (Abcam), vascular endothelial growth factor and tumor necrosis factor-α (Krishgen Biosystems).
Estimation of Glycogen and Hepatic Enzymes
The glycogen content of the liver was determined in accordance with the standard protocol.20
For estimation of the hepatic enzymes, the hepatic tissue (100 mg) was perfused with collagenase-calcium-free Hanks solution till it was completely blanched. The tissue was homogenized (collagenase calcium-free hanks: incubation solution 1:1), centrifuged (500 rpm, 2 min, 4°C) and the supernatant was collected and re-centrifuged (14,000 rpm, 15 min, 4°C). The pellet was resuspended in a cell lysis buffer and centrifuged (12,000 rpm, 4°C). The supernatant was collected for the determination of activities of glucose-6-phosphatase (G6P), fructose −1,6-bisphosphatase (FBP), hexokinase (HK), lactate dehydrogenase (LDH), aldehyde dehydrogenase (ALDH) as per protocols detailed in literature.21–24
In vitro Study
Culture of HepG2 Cells and Study Design
The human hepatocellular carcinoma cell line (HepG2) was sourced from National Centre for Cell Sciences (NCCS, Pune, India) and grown under standard aseptic conditions using sterile Dulbecco’s Modified Eagle Medium (DMEM; HiMedia Laboratories, India), supplemented with FBS (12%) and Penicillin-Streptomycin Antibiotic (1%, HiMedia Laboratories, India) at 37°C under humidified CO2 (5%) (Shel lab, USA). The cells were seeded aseptically (1x10⁵ cells/2mL well) and allowed to grow for 48 h, either in DMEM (NC), DMEM + 0.55 mM fructose (FC1), DMEM + 1mM fructose (FC2) or DMEM + 1 mM fructose + 0.1 µM Insulin (FC3). The HepG2 cells (FC1-FC3) were exposed to either PG-HM, its fractions (PG-H, PG-C, PG-EA, PG-B, PG-A at 35 µg mL−1); or DMSO (0.1% v/v, VC1–VC3). The supernatant and cell lysates were collected and preserved at −80°C for further analysis of glycogen, carbohydrate metabolizing enzymes (hexokinase, aldehyde dehydrogenase, ketohexokinase, phosphofructokinase), secondary messenger of insulin signaling (PI3K p-tyr-STAT-3, mTOR), hypoxia and inflammation (HIF-1α, VEGF, TNF-α), using commercially available kits in accordance with the manufacturer’s instructions.
Isolation of Murine Hepatocytes and Study Design
In accordance with the approved protocol (IAEC/17-I/05), the hepatocytes were harvested from adult Swiss albino mice (25–30 g) as per previously reported method.25 The viability of cells was determined by the following formula: Cells/mL = (Total viable cells in 4 squares)/4 x dilution factor x 104.
The cells were diluted and seeded into collagen pre-coated T75 culture flasks at a density of 1.75×10⁵ cells mL−1. The harvested murine hepatocytes were aseptically cultured in sterile Dulbecco’s Modified Eagle Medium (DMEM; HiMedia Laboratories, India), supplemented with FBS (12%) and Penicillin-Streptomycin Antibiotic (1%, HiMedia Laboratories, India) at 37°C under humidified CO2 (5%) (Shel lab, USA).
Upon reaching 70–90% confluency, the hepatocytes were trypsinized (Trypsin, 0.25% + EDTA, 0.02%), centrifuged (800 rpm x 8 min), re-suspended, counted, and seeded (1x10⁵ cells/2 mL well) on collagen pre-coated well-plate. For next 48 h, the cells were grown either in glucose-free DMEM (DMEM - glucose), DMEM + glucose (4.5 g mL−1), DMEM- glucose + fructose (0.55 mM), DMEM - glucose + fructose (1 mM) or DMEM - glucose + fructose (1 mM) + Insulin (0.1 µM), and grouped as NC, Glu, FC1, FC2 and FC3, respectively.
Cell Treatment and Sample Collection
Following seeding, the cells from each group (NC, Glu, FC1, FC2 and FC3) were exposed to various drugs for 48 h under standard conditions (37°C, 5% CO2). The cells were exposed to either vehicle (DMSO 0.1% v/v), PG-HM (35 µg mL−1), Qu (7 µM), metformin (5 mM) or pioglitazone (15 µM) and identified as VC NC-VC3, PG NC-PG3, Qu NC-Qu3, MET NC - MET3 or PIO NC to PIO3, respectively. After completion of treatment, the supernatant and cell lysates were collected, and stored (−80°C) until analysis.
Estimation of Concentration of Glucose/Fructose in Culture Media
The glucose and fructose concentrations in the media were estimated prior to and following the different treatments using commercial kit (Erba, India) and previously reported method.26
Isolation of Mitochondrial Rich Fraction
The cell suspension was subjected to differential centrifugation for isolating mitochondrial rich fraction in accordance with the reported literature.27
Determination of Activities of Complexes I, II, IV and V
The activity of Complex I (NADH-CoQ reductase) was determined from the rate of reduction of DCPIP at 600 nm. The assay of complex II was based on DCPIP as the electron acceptor and succinate as donor that reflected as change in color. As the terminal enzyme of the electron transport chain, cytochrome c oxidase (complex IV) catalyzes the oxidation of cytochrome c along with generation of H2O. Principally, in the assay, cytochrome c was reduced with dithiothreitol and then re-oxidized by the cytochrome c oxidase. The rate of disappearance of reduced cytochrome c was measured at 550 nm. The Complex V synthesizes ATP from ADP and Pi in the mitochondrial matrix using the energy provided by the proton electrochemical gradient and assayed as previously reported.28–31
Determination of Oxidative and Antioxidative Parameters
Superoxide dismutase activity was assayed as the inhibition of autoxidation of pyrogallol,32 Reduced Glutathione was determined in accordance with the Ellman method, the reduced glutathione (GSH) level in the mitochondrial fraction was determined at 412 nm33 and Lipid peroxidation was assessed by measuring the MDA-TBA adduct formed during the reaction in acidic medium at 532 nm.34
Statistical Analysis
Replicated results from different groups are expressed as mean ± Standard Deviation (SD) and statistically analyzed by one-way analysis of variance (ANOVA) followed by Tukey’s multiple comparison test. Statistical analysis was performed using software, Graph Pad Prism ver5.0 for Windows (Graph Pad Software, San Diego, CA, USA). A value of p < 0.05 was considered statistically significant.
Results
Method Validation for Determination of Quercetin
The MS2 fragmentation of quercetin (Qu) was carried out using liquid chromatography mass spectroscopy (Figure 1A). The proposed method was found linear in the range of 3.9–500 ng mL−1 with regression coefficient of 0.998 and well defined resolution of Qu. The slope of the regression line was 300.82.
 |
Figure 1 Standardization of PG-HM using LC-MS/MS (A) ESI-MRM chromatogram of Qu, its quantification in hydroethanolic extract of leaves of Psidium guajava (PG-HM). (B) Proposed fragmentation pattern for Qu using (-ve) ESI- MS2 product ion mode. |
The method was found to be accurate with good repeatability and the LOD and LOQ were found to be 0.538 and 1.63 ng mL−1, respectively. The average recovery (%) of Qu from plasma at 7.8, 15.6 and 500 ng mL−1, was 90.77 ± 15.10, 95.67 ± 12.08 and 109.21 ± 4.41, respectively. The CV (%) in inter and intraday validation of Qu at 7.8, 15.6 and 500 ng mL−1, was 27.52, 3.41 and 0.56, respectively.
Quantification of Quercetin in PG-HM and Its Fractions
Using the validated LC-MS method, the Qu in PG-HM was detected at retention time of 2.70 min (Figure 1B). The Qu was quantitated to be 3630.66 ± 17.61, 2359.66 ± 30.98, 455.33 ± 4.93, 70,199.66 ± 10.50, 44,975.33 ± 63.68 and 663.33 ± 7.02 ng mL−1 in PG-HM, PG-H, PG-C, PG-EA, PG-B and PG-A, respectively.
Effect of PG-HM on Food Intake, Fructose/Water Intake, Body Weight, and Total Calorie Consumed
Study I: The average food intake, fructose/water intake, body weight of 4NDR, 4FDR and 4PGR after one and four weeks of the study are tabulated (Table 1). Over the four weeks, the total calories intake by 4NDR, 4FDR and 4PGR was 6601.8, 6669.8 and 4652.75 Kcal, respectively.
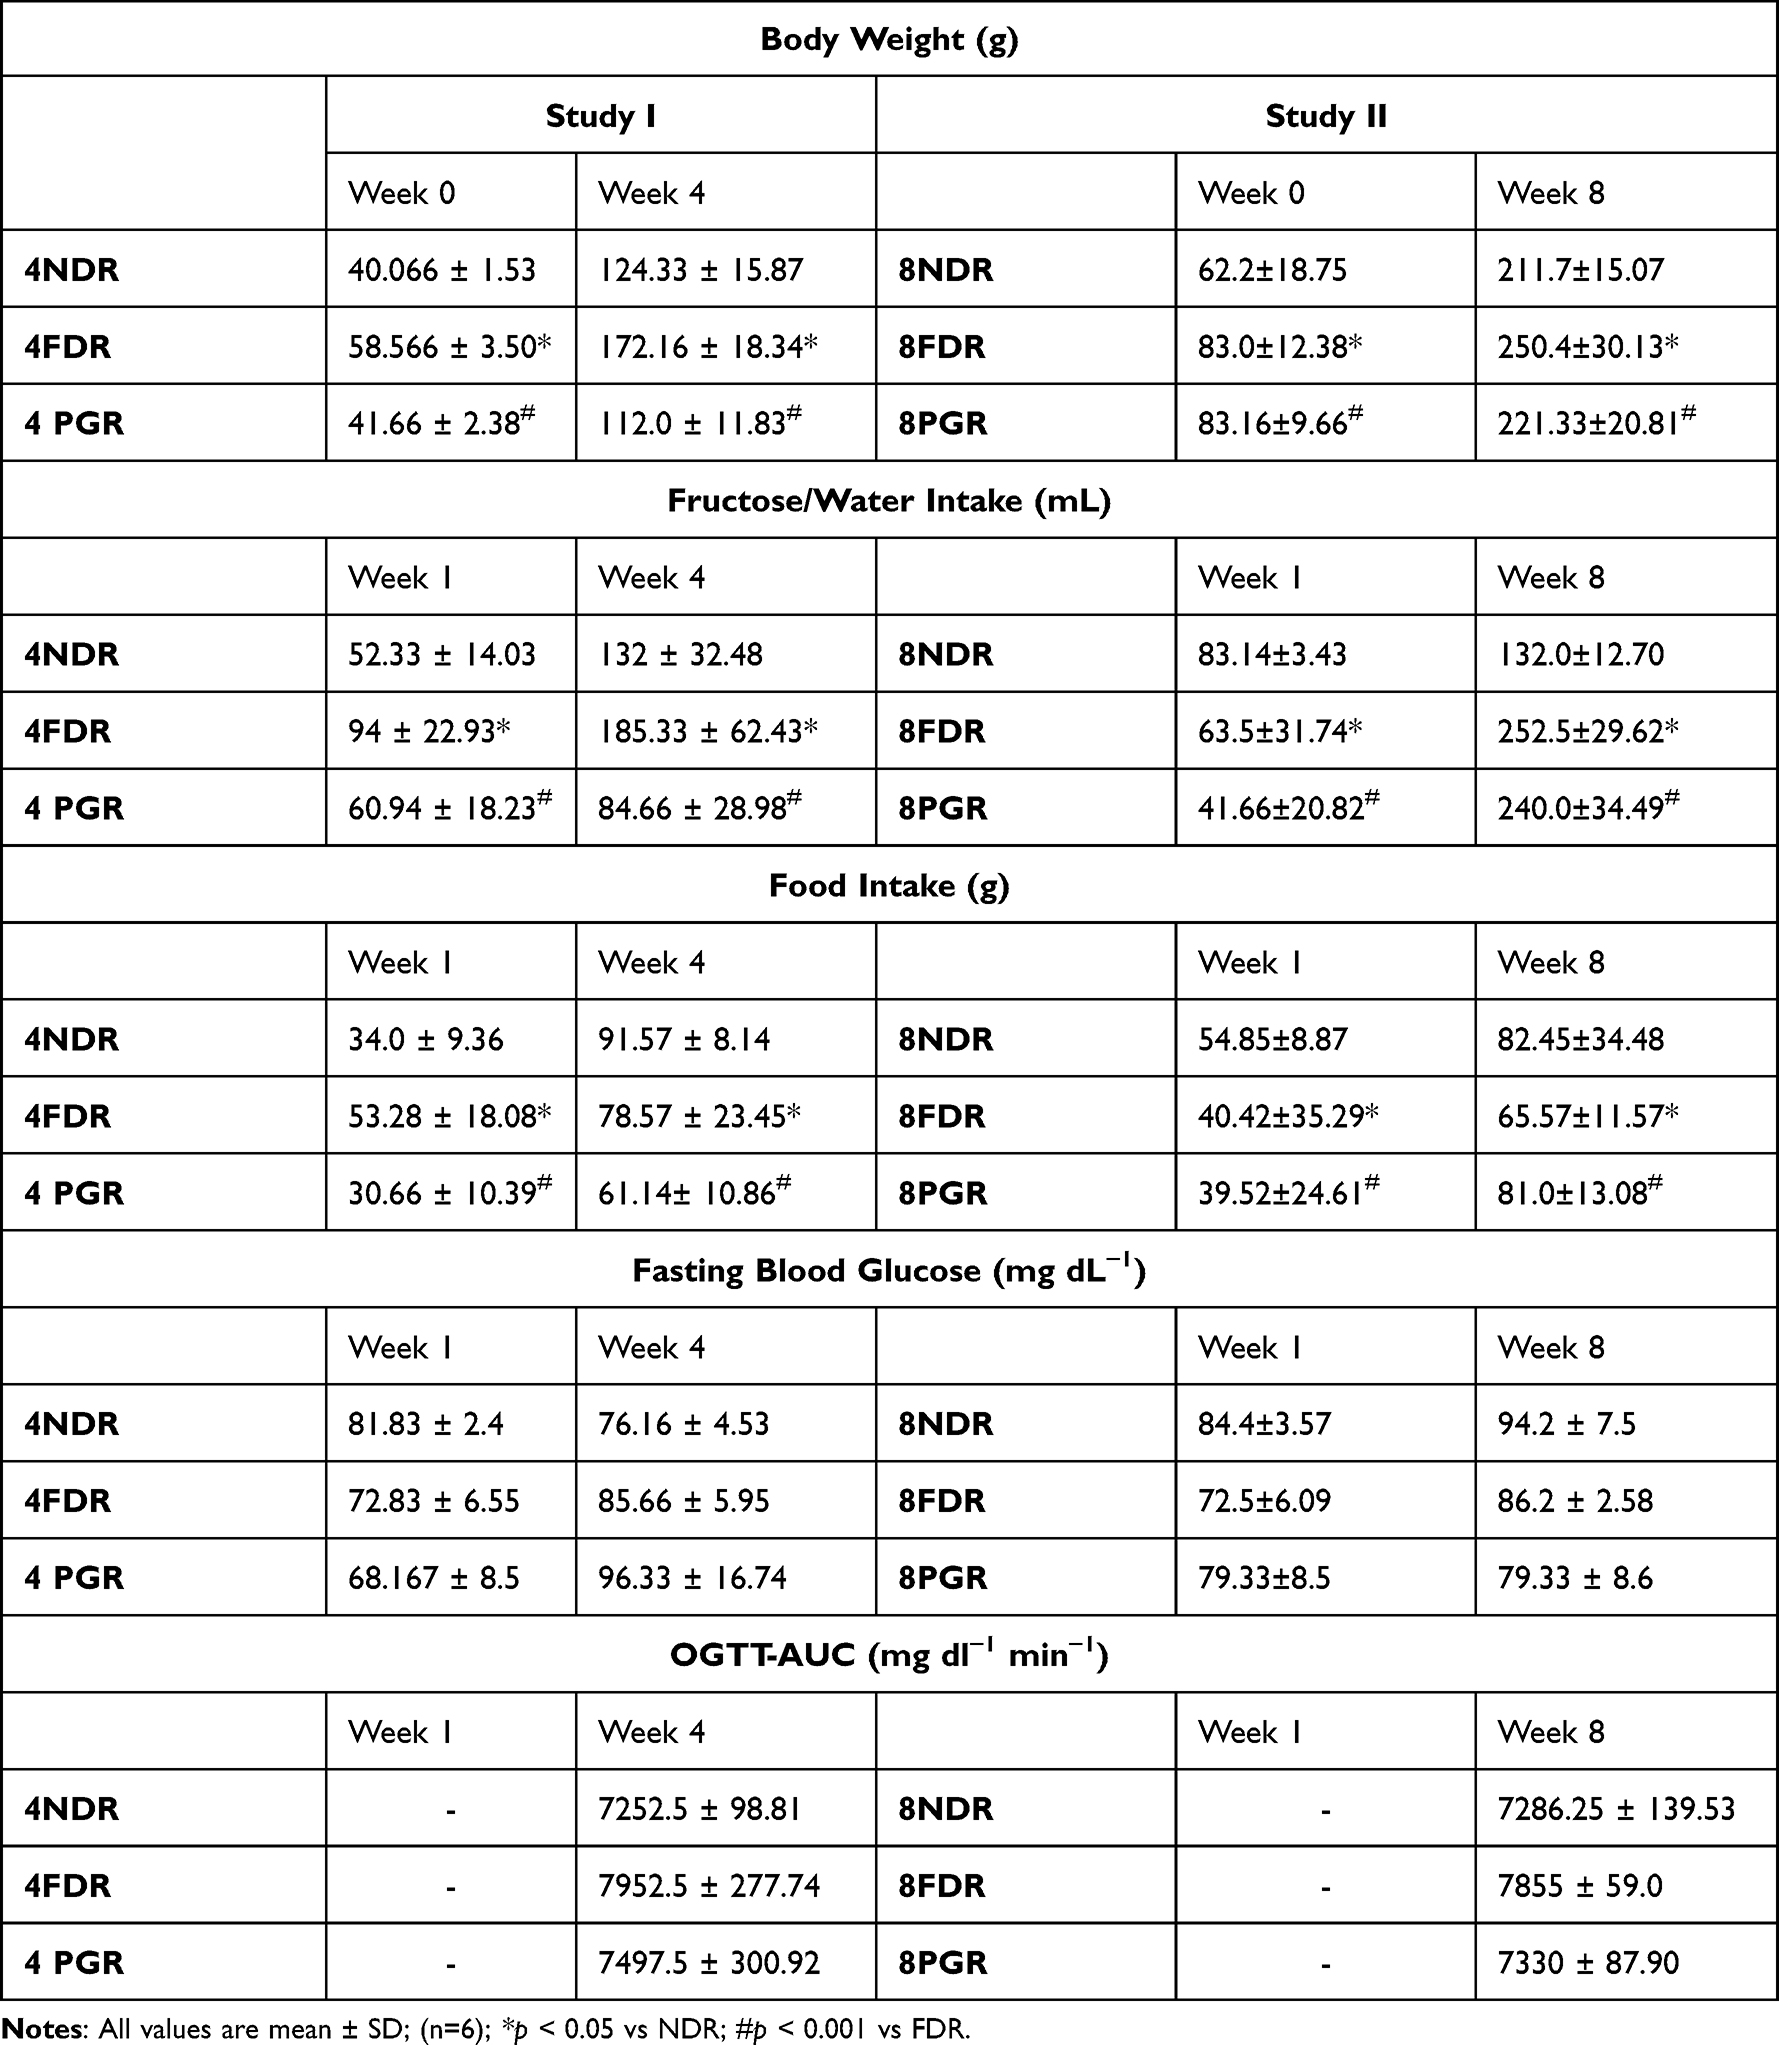 |
Table 1 Effect of PG-HM on Body Weight, Fructose/Water Intake, Food Intake, Fasting Blood Glucose and OGTT-AUC of Fructose Drinking Rats |
Study II: After eight weeks the average food intake, fructose/water intake, and body weight of 8NDR, 8FDR and 8PGR are tabulated (Table 1). Over the eight weeks, the total intake of calories by 8NDR, 8FDR and 8PGR was 16,609.7, 13,733.7, and 14,525.83 Kcal, respectively.
Effect of PG-HM on OGTT and HOMA-IR
Study I: The average FBG and OGTT-AUC of 4NDR, 4FDR and 4PGR at weeks 1 and 4 of the study are tabulated (Table 1). The HOMA-IR of 4NDR, 4FDR and 4PGR was 2.50 ± 0.71, 2.80 ± 0.91 and 3.00 ± 0.53, respectively.
Study II: At study termination, the FBG and OGTT-AUC of 8NDR, 8FDR and 8PGR are tabulated (Table 1). The HOMA-IR of 8NDR, 8FDR and 8PGR was 3.44 ± 1.71, 21.29 ± 2.05 and 9.57 ± 3.81, respectively.
Effect of PG-HM on Blood Biochemistry
Study I: The average weight of liver of 4FDR was significantly greater (p<0.05) than 4NDR but significantly reduced (p<0.001) in 4PGR by ~27%. The LDL in 4FDR was higher by ~70% (p<0.05) than 4NDR but reverted in 4PGR (Table 2). The 4FDR recorded a significant decrease (p<0.05) in plasma leptin (~2.5 fold) and ghrelin (77 fold) as compared to 4NDR (Figure 2A). The ghrelin concentration was ~70 times higher in 4PGR as compared to 4FDR (p<0.001) (Figure 2B). The plasma insulin was elevated in the 4FDR compared to 4NDR but reverted in 4PGR (Table 2). The average uric acid was significantly elevated (p<0.05) in 4FDR but reduced in 4PGR (p<0.001) (Table 2). The downstream signals, Akt, p-tyr-STAT-3 and SREBP-1c were significantly raised (p<0.05) in 4PGR as against 4FDR (Figure 2C and D). A significant fall in the AMPK was recorded in 4PGR as compared to the 4FDR (p<0.001) (Figure 2E) but no change in JNK and FOXO1 was recorded in 4PGR as compared to the 4FDR (Figure 2F and G). A significant rise in the SREBP1c was recorded in 4PGR as compared to the 4FDR (p < 0.001) (Figure 2H). The 4PGR recorded protective fall (p<0.001) in the concentrations of HIF 1α, VEGF and TNF-α (Table 2).
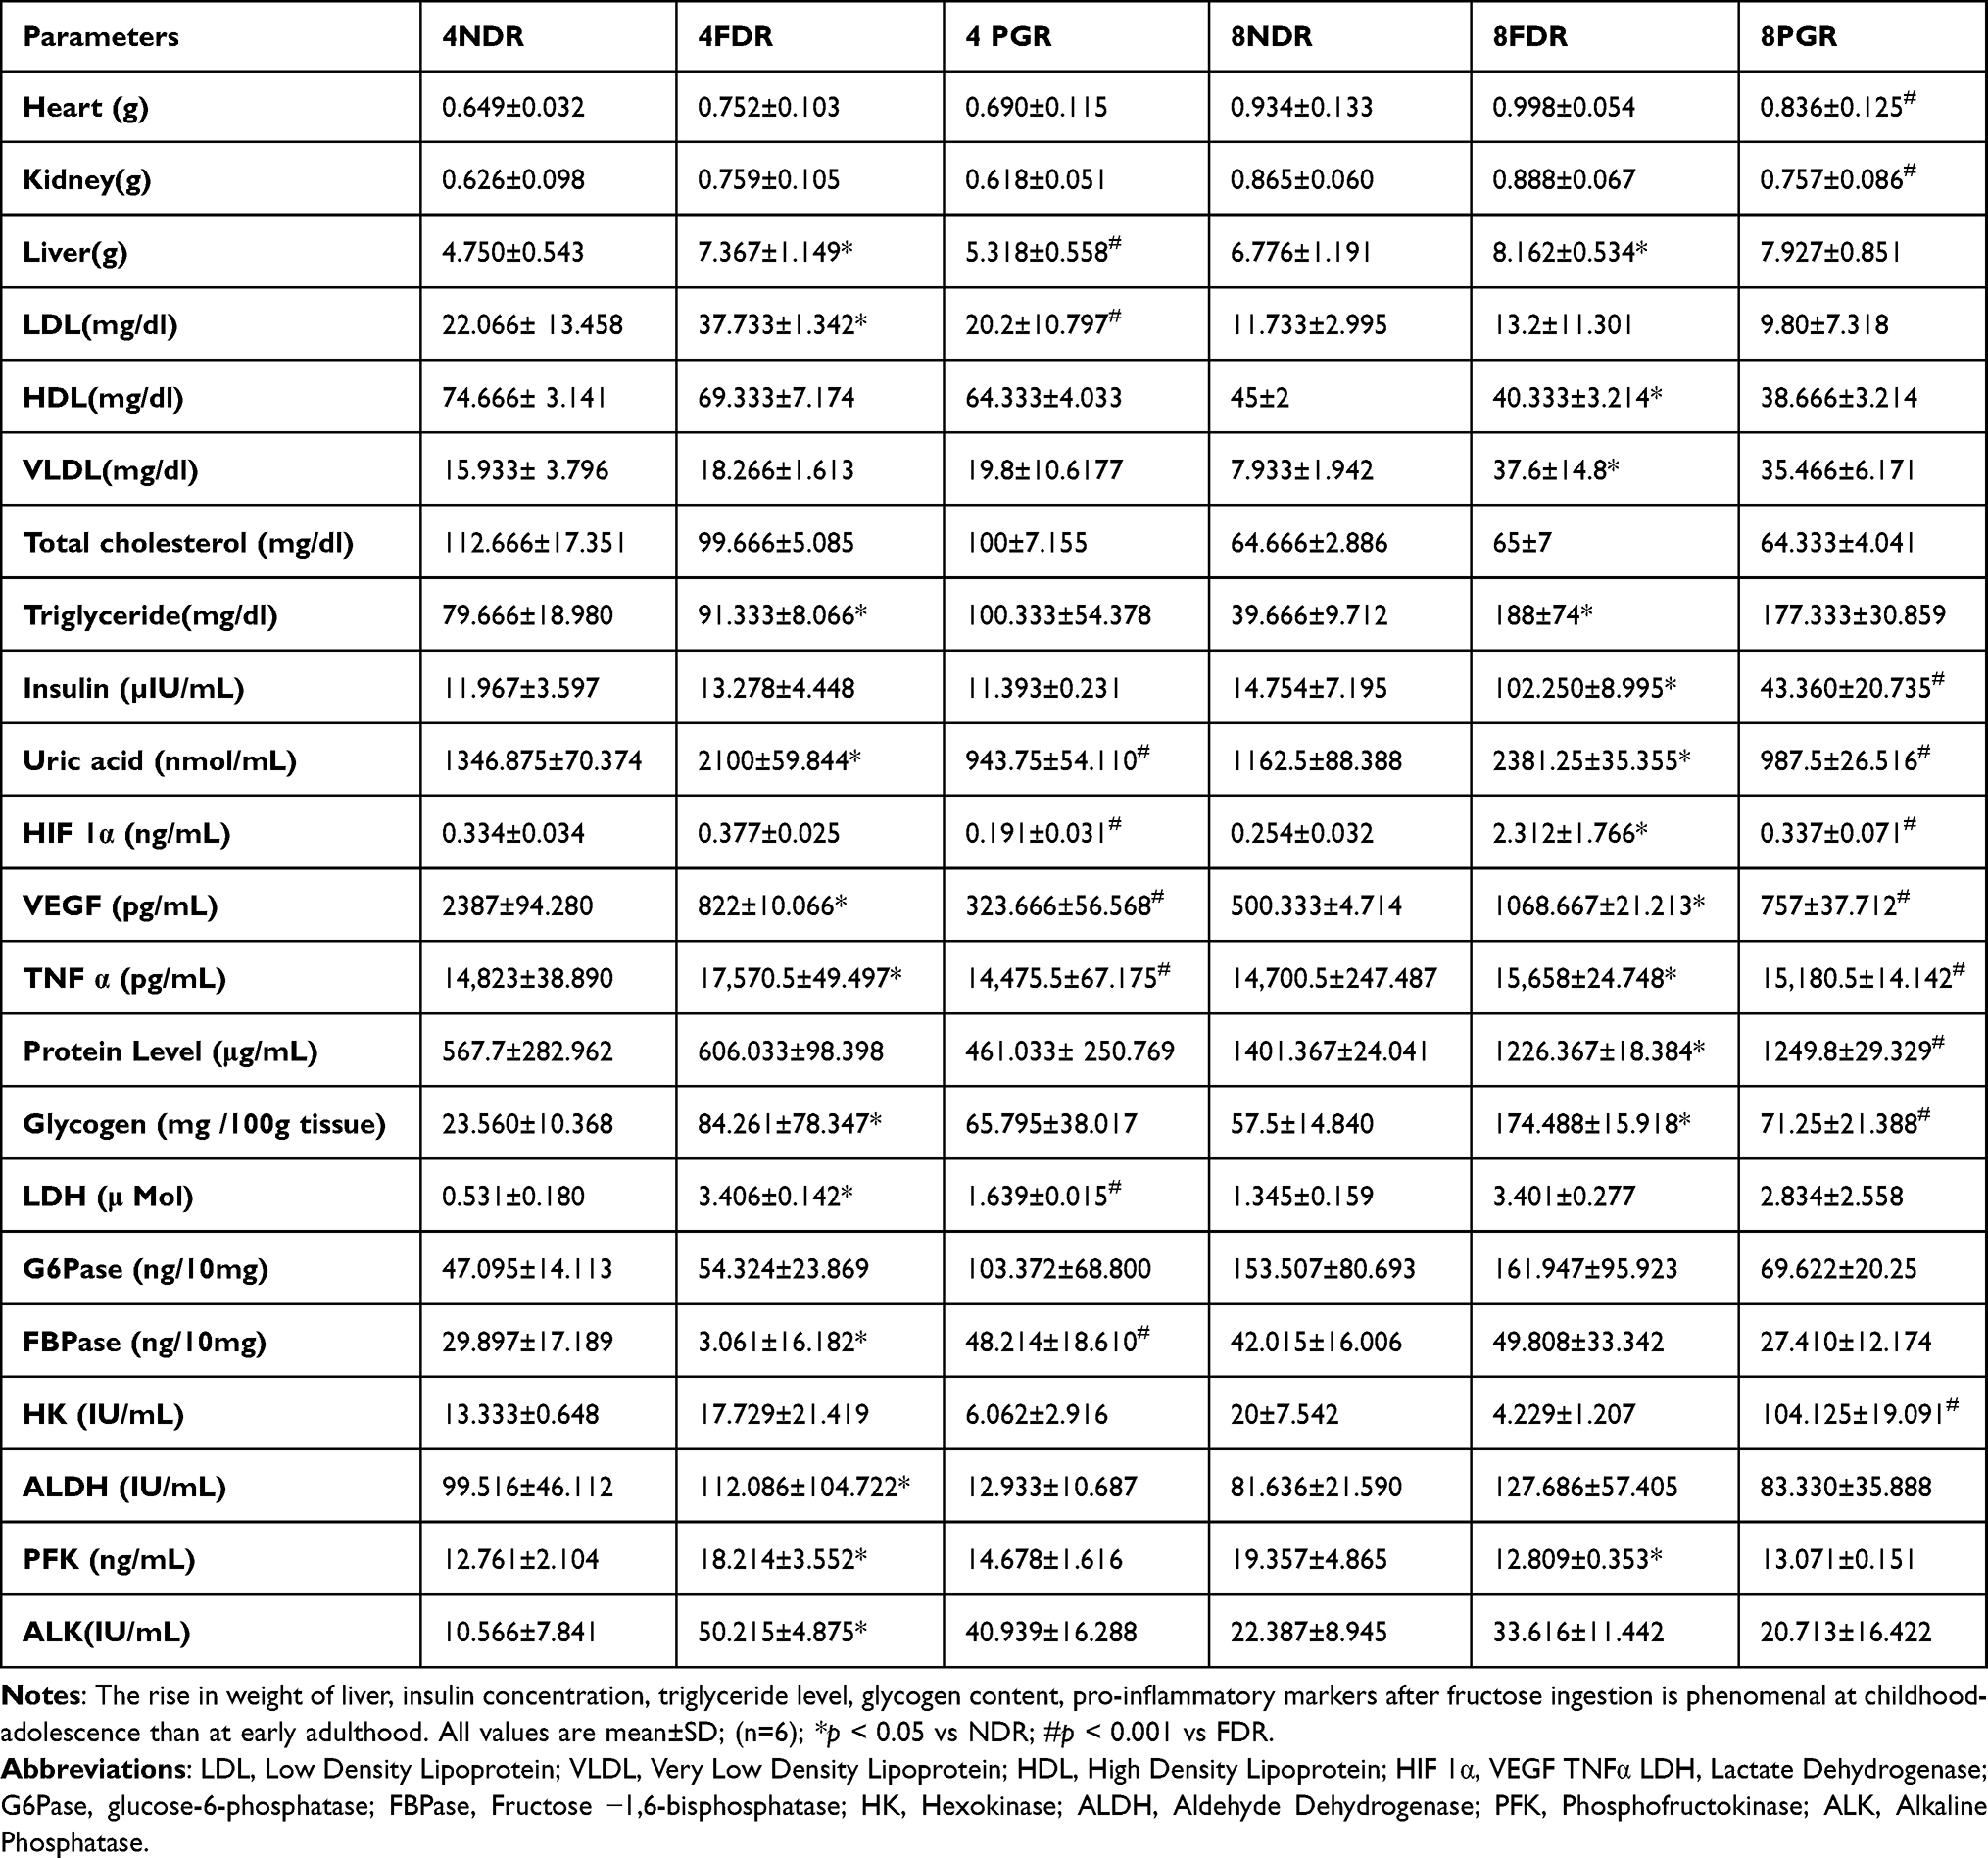 |
Table 2 Effect of PG-HM on Visceral Weight, Lipid Profile, Liver Function Test, Activities of Pro-Inflammatory Markers and Enzymes of Glycolysis and Gluconeogenesis After 4 Weeks (Study I) and 8 Weeks (Study II) of Fructose Ingestion by Developing Rats |
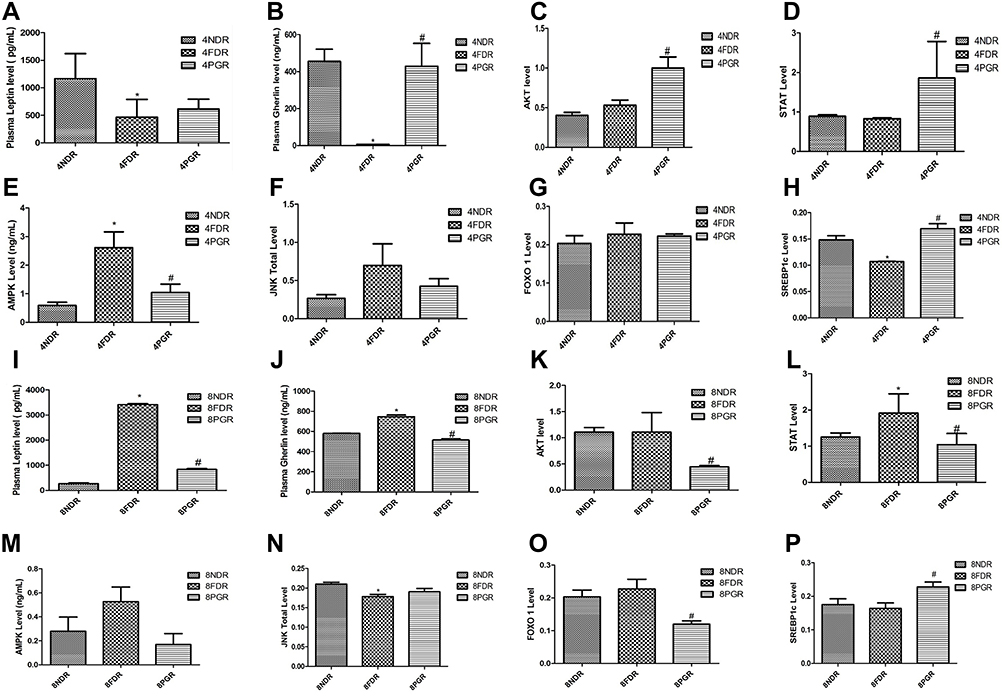 |
Figure 2 PG-HM reverted the levels of ghrelin, AKT, STAT, JNK, FOXO 1 and SREBP 1c that were skewed after (A–H) 4 weeks and (I–P) 8 weeks of unlimited fructose (15%) drinking by weaned rats. Data expressed as mean ± SD; (n=6), *p < 0.05 vs NDR, #p < 0.001 vs FDR. |
Study II: The average plasma insulin was 5fold higher in 8FDR as compared to 8NDR (p<0.05), but reduced by 60% in 8PGR (p<0.001) (Table 2). The average uric acid in 8FDR was raised 100 fold as compared to the 8NDR (p<0.05) but reverted back in the 8PGR (p<0.001) (Table 2). The average plasma leptin and ghrelin concentrations were significantly reduced (p<0.001) in 8PGR that were raised in 8FDR (Figure 2I and J). The average SGOT and SGPT in 8FDR were double that of 8NDR, but reverted in 8PGR (p<0.001) (Table 2). The downstream signals, ie, Akt, p-tyr-STAT-3, AMPK and FOXO-1 were significantly reduced (p<0.001) in 8PGR (Figure 2K–O). The 8PGR recorded significant rise (p<0.001) in SREBP-1c as against 8FDR (Figure 2P). In 8FDR, the average HIF-1α and VEGF were about four and two times, respectively, that of 8NDR. The pro-inflammatory markers, HIF-1α and VEGF in 8FDR, were about ten and two times that of 8NDR, respectively, but reverted in 8PGR (p<0.001) (Table 2).
Effect of PG-HM on Hepatic Glycogen and Enzymes
Study I: The average liver glycogen content of 4FDR and 4PGR was four and three times higher than 4NDR. The average FBPase was ~ten times lower in 4FDR but significantly raised in 4PGR (p<0.001) (Table 2). The elevated concentration of LDH in 4FDR was halved in 4PGR (p<0.001). The HK, ALDH, PFK and ALK were significantly reduced in 4PGR as compared to the 4FDR (p<0.001) (Table 2).
Study II: The 8FDR recorded a threefold rise in average hepatic glycogen content that was significantly reduced in 8PGR (p<0.001). The activities of G6Pase, FBPase, ALDH, ALK and LDH were raised in 8FDR but reduced in 8PGR (Table 2).
In-Vitro Studies
Effect of PG-HM on Glycogen Content and Activities of Carbohydrate Metabolizing Enzymes of HepG2
The glycogen content of HepG2 was increased significantly (p<0.05) in FC1, FC2 and FC3 but reduced (p<0.05) by PG-HM and its fractions (Figure 3A–D). The activities of hexokinase, ALDH, KHK and PFK were significantly raised in FC1, FC2 and FC3 as compared to NC (p<0.05). The hexokinase activity was significantly increased (p<0.05) in PG-HM2 and PG-EA2 (Figure 3E–H). The ALDH activity in FC1-3 was reduced significantly (p<0.05) by PG-HM and all its fractions, especially PG-EA as compared to NC (Figure 3I–L). The KHK activity was significantly reduced (p<0.05) in PG-EA1-3 and PG-B1-3 (Figure 3M–P). Significant reduction (p<0.05) in PFK activity was recorded in PG-B1-3 and PG-EA1-3 (Figure 3Q–T).
 |
Figure 3 The FC3 arm simulates the hyperglycemic and hyperinsulinemic environment for HepG2 cells where PGH-HM and PG-EA reduced levels of (A–D) glycogen, (E–H) hexokinase, (I–L) ALDH (M–P) ketohexokinase and (Q–T) phosphofructokinase. Data expressed as mean ± SD; (n=6), *p < 0.05 vs FC1, FC2, FC3. |
Effect of PG-HM on Secondary Messengers of Insulin Signaling Pathway of HepG2
In FC1-3, the PI3K was reduced, but p-tyr-STAT-3 and mTOR were significantly (p<0.05) increased, as compared to NC. The concentration of PI3K in PG-HM2-3, PG-EA2-3 and PG-B2-3 were significantly raised (p<0.05) (Figure 4A–D). The concentration of p-try-STAT-3 was significantly reduced (p<0.05) in PG-HM1-3, PG-EA1-3 and PG-B1-3 (Figure 4E–H). The concentration of mTOR was significantly reduced (p<0.05) in PG-HM1-2, PG-EA1-3 and PG-B1-3 (Figure 4I–L).
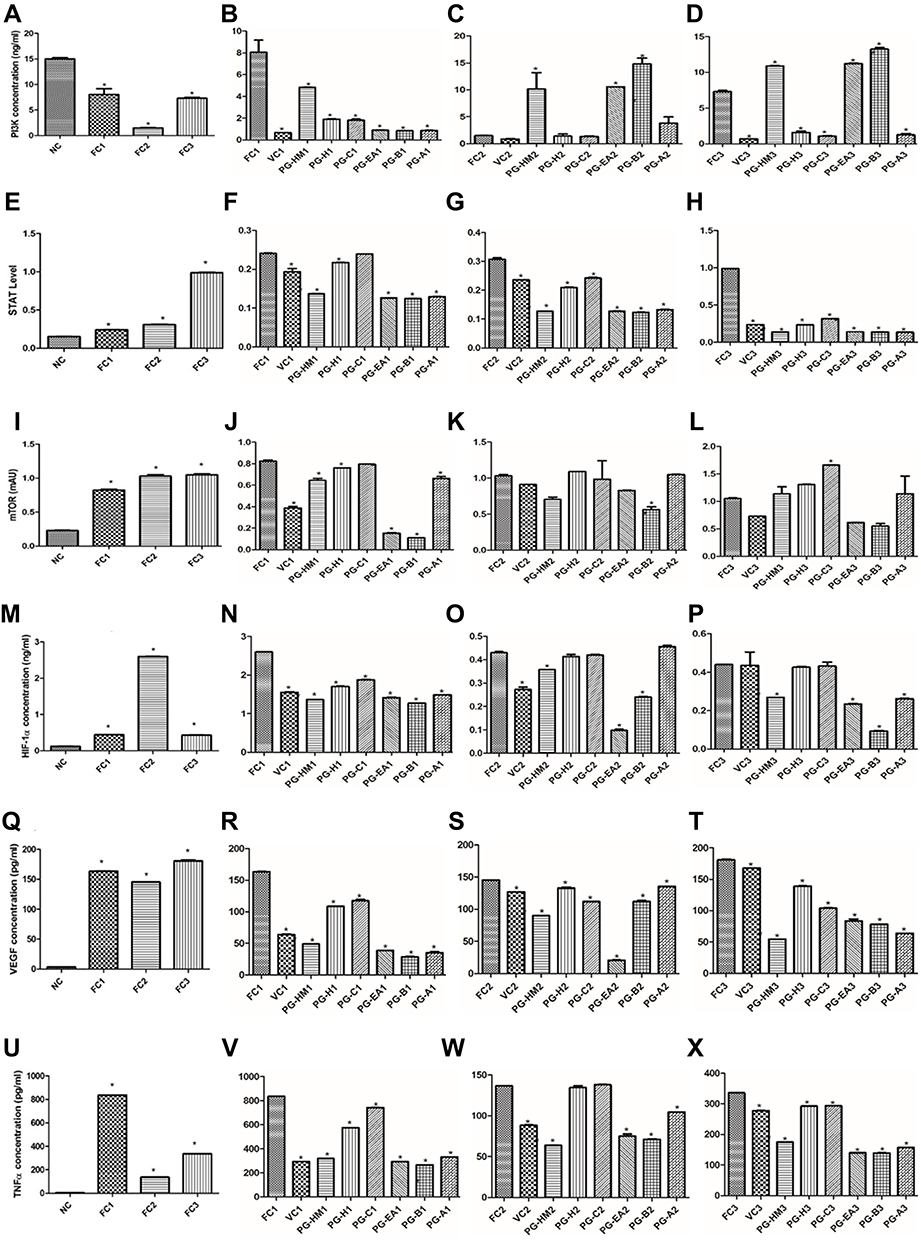 |
Figure 4 The FC3 arm simulates the hyperglycemic and hyperinsulinemic environment for HepG2 cells where PGH-HM and PG-EA reduced levels of (A–D) PI3k, (E–H) STAT3, (I–L) mTOR, (M–P) HIF-1ɑ, (Q–T) VEGF, and (U–X) TNF-ɑ. Data expressed as mean ± SD; (n=6), *p < 0.05 vs FC1, FC2, FC3. |
Effect of PG-HM on Hypoxic and Inflammatory Mediators in HepG2
The HIF-1α, VEGF and TNF-α were significantly increased (p<0.05) in FC1-3 as compared to NC. Significant (p<0.05) reduction in HIF-1α, VEGF and TNF-α were achieved in PG-HM1-3, PG-EA1-3 and PG-B1-3 (Figure 4M–X).
Effect of PG-HM on Fructose and Glucose Uptake by Murine Hepatocytes
The concentration of fructose in media was significantly raised in PG-HM1-3, Qu1-3, PIO1-3 and MET2-3. The concentration of glucose in media was significantly reduced in PG-HM-Glu, Qu-Glu, PIO-Glu and Met-Glu (Figure 5A–D).
 |
Figure 5 Comparison of PG-HM (35µg mL−1) against Pioglitazone (15 µM) and Metformin (5 mM) in facilitating the flux of fructose and glucose across murine hepatocytes. As compared to Pioglitazone and Metformin, the PG-HM performed better to lower media concentration of fructose (A-C). Pioglitazone and Metformin, performed better than PG-HM to lower glucose concentration from the media (D). Data expressed as mean ± SD; (n=6), *p < 0.05 vs FC1, FC2, FC3. |
Effect of PG-HM on the Markers of Mitochondrial Dysfunction in Murine Hepatocytes
Significant decrease (p<0.05) in NADH CoQ reductase, Succinate dehydrogenase, Cytochrome C oxidase and ATP synthase (F0-F1) was recorded in FC1-3 as compared to Normal. Significant increase (p<0.05) in NADH CoQ reductase, Succinate dehydrogenase, Cytochrome C oxidase and ATP synthase (F0-F1) was recorded in PG-HM1-3 (Figure 6A–P).
 |
Figure 6 The effect of PG-HM on the markers of mitochondrial function in murine hepatocytes where FC3 simulates hyperglycemic and hyperinsulinemic environment. The PG-HM raised (A–D) NADHCoQ reductase (E–H), succinate dehydrogenase, (I–L) cytochrome c and (M–P) ATP synthase activities. Data expressed as mean ± SD; (n=6), *p < 0.05 vs Normal. |
Effect of PG-HM on the Markers of Oxidative Stress in Murine Hepatocytes
The SOD and GSH decreased significantly (p<0.05) in FC1–3, as compared to Normal. Significant increase (p<0.05) in SOD and GSH was recorded in PG-HM1-3 as compared to FC1-3 (Figure 7A–H). The MDA increased significantly (p<0.05) in FC1–3, as compared to Normal. Significant reduction (p<0.05) in MDA was recorded in PG1-3 as compared to FC1-3 (Figure 7I–L).
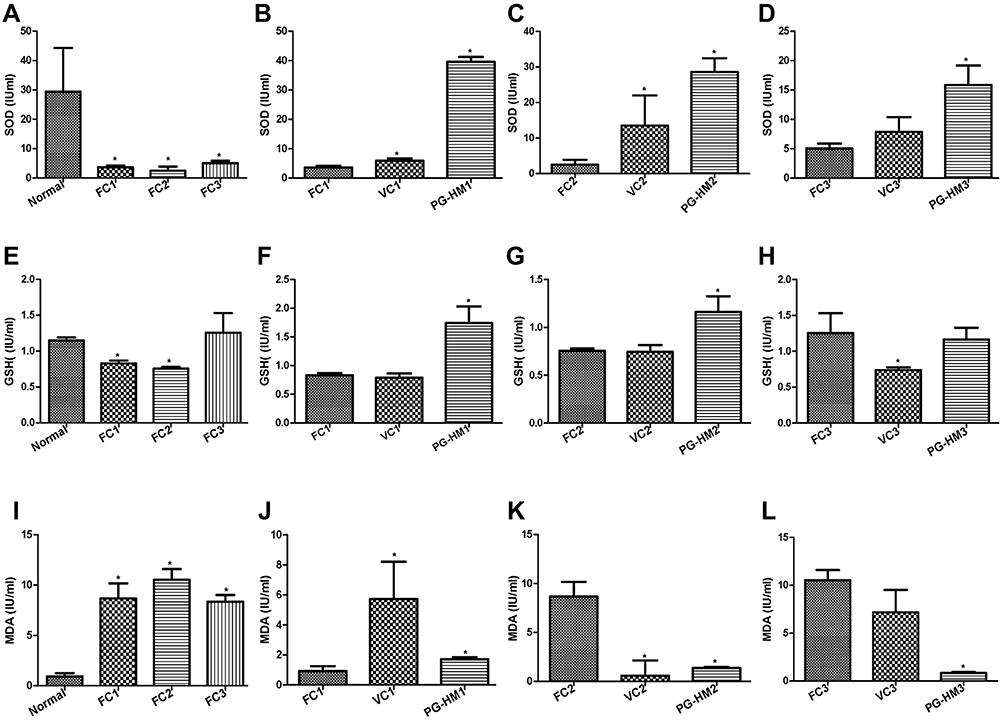 |
Figure 7 The effect of PG-HM on the markers of oxidative stress in murine hepatocytes where FC3 simulates hyperglycemic and hyperinsulinemic environments. The PG-HM elevated (A–D) SOD, (E–H) GSH, but (I–L) reduced MDA levels. Data expressed as mean ± SD; (n=6), *p < 0.05 vs Normal. |
Discussion
The medicinal plants form the backbone of TMs for the treatment of multiple health conditions of humans and animals. They are a readily available repository of bioactive complex phytochemicals that have, time and again, proved to be effective modulators of biomarkers of preventive and therapeutic healthcare. Psidium guajava L. (Myrtaceae), popularly known as Guava, has been classified as food for specified health use (FOSHU).35 In the long-standing practices of ethno-medicine its leaves and fruits have been tapped for a wide array of applications such as anti-diarrhoea, antisepsis, astringent, diuresis, anti-diabetes, analgesia, anti-neoplasm, anti-inflammatory and hepato-protection.36–39 Here, we present the comprehensive data that clinches the Guava leaves as the suppressor of the hepatic metabolic pathways triggered due to copious fructose drinking by weanlings. Preliminary report from our laboratory has shown that of the three doses, ie, 250, 500 and 1000 mg kg−1 P.O.−1 d−1, the Guava leaves re-set the hepatic metabolic machinery most effectively at 500 mg kg−1 P.O.−1 d−1, which has been the basis here for detailed mechanistic investigations. Literature reports show that oral administration of guava leaf extract at 200 and 2000 mg kg−1d−1 caused no abnormal toxic effects in rats, and its LD50 is 2 g Kg−1.40,41
Using the in-house developed and validated LC-MS/MS method, the hydro-ethanolic extract of the Guava leaves (PG-HM) and its fractions were quantified for the Qu concentration therein. The Qu was maximally concentrated in the ethyl-acetate (~70.2 µg mL−1) followed by the butanol (~45.0 µg mL−1) fractions of the PG-HM.
The pharmacodynamic data from the present study show that the fructose-drinking during childhood tumultuously disrupted the leptin-ghrelin mediated satiety-hunger system by puberty and plateaued-off by early adulthood. The ratios of the plasma concentrations of leptin to ghrelin were 76.01×10⁻³ and 4.57×10⁻³ in 4FDR and 8FDR that were exponentially high from 2.56×10⁻³ and 0.458 x 10⁻³, recorded in 4NDR and 8NDR, respectively. When correlated with data from average food, water/fructose intake and gain in body weight in 4NDR, 4FDR, 8NDR and 8FDR, it is evident that the fructose drinking disrupted the leptin/ghrelin system in growing rats that tilted their eating preference in its favor over the pellet diet. The marginally greater total calories consumed by puberty as in 4FDR did not translate as much into weight gain but into phenomenally disrupted hepatic metabolism. Secondly, the paradigms of HOMA-IR, and AUC-OGTT, which are known to be strongly correlated, definitely indicated the development of the insulin-resistant state in pubescent animals of 4FDR.42
The pendulum has swung back in 4PGR and 8PGR in terms of satiety-hunger signals and insulin sensitivity. Thus, the administration of PG-HM effectively lowered fructose drinking, and raised the pellet consumption and weight gain in 4PGR as in 8PGR. Further, in both 4PGR and 8PGR, the ratio of the circulating leptin to ghrelin, HOMA-IR, AUC-ITT and AUC-OGTT were effectively normalized. Elsewhere in literature, the Guava leaf extracts have been credited with promoting the glucose metabolism and improving insulin resistance in skeletal muscle of rats that are spontaneously metabolic at early adulthood.43
There is large volume of evidence that indicates that fructose-overload activates the Akt/FOXO-1/SREBP1c signaling cascade, and that of hypoxia and inflammation (HIF-1α, VEGF, TNF-α) leading to the pathogenesis of insulin-resistant state.44–46 As these are well-established treatment targets, we report here that, in pubescent rats with ad libitum access to fructose (15%), PG-HM acts as an insulin sensitizer by 1) incrementing signals of energy homeostasis (Akt, p-tyr-STAT-3 and SREBP-1C), 2) mitigating signals of de novo lipogenesis (AMPK alpha1), and hypoxia-inflammation (HIF-1α, VEGF, TNF-α). The PG-HM nullified the fundamental mechanisms involved in glucose intolerance and insulin insensitivity by suppressing activities of HK, ALDH, G6Pase, FBPase, PFK, ALK and LDH. The signals that promote gluconeogenesis (FOXO-1) were additionally inhibited to improve glycemic control by early adulthood (8PGR).
The effect of PG-HM on molecular markers of hepatic metabolism was confirmed using the immortal, non-tumorigenic, human hepatoma cells, HepG2, which were cultured in a fructose-rich environment (1mM), such that the FC2 simulated the hepatic insulin-resistant state with activated mTOR/ p-tyr-STAT-3 and HIF-1α, VEGF and TNF-α signaling pathways. In accordance with the data from the in-vivo study, the PG-HM (35µg mL−1) suppressed the signals of lipogenesis (mTOR/ p-tyr-STAT-3) and hypoxia-inflammation-associated insulin resistance (HIF-1α, VEGF and TNF-α). The bioactive polyphenols present in the leaves of P.guajava have been implicated to play an important role in the prevention and treatment of high carbohydrate and high fat diet induced hepatic steatosis and dyslipidemia.47 Here, in our study, the ingestion of fructose (15%) from the weanling stage led to NAFLD, but PG-HM successfully suppressed all. Elsewhere the guava leaf extract (GLE) have been reported to ameliorate insulin resistance in KK-Ay diabetic mice by the activation of PI3K/Akt signaling pathway.48
An attempt was made to study the molecular mechanisms of the fractions of PG-HM and identify the most suitable fraction that can be further developed for its pharmacotherapeutic benefits. From the results of HepG2 cells grown in fructose-rich environment, the PG-HM and PG-EA were consistently effective in 1) reducing glycogen content, 2) elevating activity of the rate limiting enzyme of hepatic glycolysis-hexokinase, and 3) mitigating activities of enzymes responsible for lipogenesis (ALDH), fructolysis (Ketohexokinase), and regulating glycolysis (PFK). The fractions, especially PG-EA, effectively restored the markers of hepatic insulin resistance like mTOR/p-tyr-STAT-3, HIF-1α, VEGF, TNF-α.
Energy homeostasis largely depends on mitochondria to oxidize nutrients to efficiently generate energy in cells. In a pathologically inefficient state, the ratio of ATP production/oxygen consumption is low, leading to an increased production of reactive oxygen species. Thus, the maladaptive consequences stimulate inflammation and mitochondrial dysfunction that together lead to insulin resistance.49,50 On this basis, freshly isolated murine hepatocytes were exposed to conditions that mimic insulin resistance (1mM fructose, FC2) and assessed for markers of mitochondrial dysfunction and oxidative stress.
The Guava leaf extracts have been shown to comprise an effective potential source of natural antioxidants, but the underlying cascade is delineated here.51 The PG-HM suppressed 1) NADH CoQ reductase/complex I that regulates electron leakage, 2) succinate dehydrogenase/complex II, 3) cytochrome C oxidase/complex III, rate-limiting step, regulator of oxidative phosphorylation and membrane potential, 4) ATP synthase/complex V that phosphorylates and releases ATP and 5) marker of oxidative stress (MDA), to restore energy homeostasis. Here, a fructose-rich environment acted as an uncoupling agent that dissociated the electron transport chain from phosphorylation by ATP-synthase, preventing the formation of ATP, but adding to oxidative stress. Despite “fed-state”, the cells remain ATP-starved, and the electron transport chain is in an exaggerated state to cater to the demand for ATP, without success. It may be postulated that the PG-HM plugs the proton leak and restores electrochemical gradient, so that the protons are transferred using ATP-synthase, to produce ATP. The energy dynamics shifted from disorganized to an efficient state that is conducive to promote antioxidant systems (SOD, GSH).
The FC3 arm of fructose uptake assay using freshly isolated murine hepatocytes mimics the hyperglycemic and hyperinsulinemic state of insulin resistance and the effect of PG-HM was compared against Pioglitazone and Metformin which are well-established clinically used insulin sensitizers. At the concentration of 35 µg mL−1, the PG-HM outperformed metformin (5 mM) and pioglitazone (15 µM).
Conclusion
This study distinctly sets the Guava leaves for the management of the hepatic metabolic health of children and adolescents. The PG-HM is evidenced to act via hepatic signalling pathways of leptin-insulin, hypoxia-inflammation, mitochondrial function, oxidative stress, glycolysis, gluconeogenesis and de novo lipogenesis to restore energy homeostasis in juveniles and young adults.
Data Sharing Statement
All data generated or analyzed during this study are included in the manuscript and are also available from the corresponding author upon request.
Ethical Approval
The animal experiments were approved by the Institutional Animal Ethics Committee, Delhi Institute of Pharmaceutical Sciences and Research, New Delhi (IAEC/15-II/6-7) and performed in accordance with the Committee for the Purpose of Control and Supervision of Experiments on Animals.
Acknowledgments
We are thankful to the High-Precision Bioanalytical Facility (HP-BAF) at All India Institute of Medical Sciences (AIIMS), New Delhi, for mass spectroscopy studies.
Funding
This work was supported by financial grants from the Department of Biotechnology (DBT), Government of India, New Delhi (Reference No. BT/PR9068/MED/97/139/2013) and Indian Council of Medical Research (ICMR), New Delhi (Sanction No: 5/10/FR/13/2015-RBMH).
Disclosure
The authors report no conflicts of interest in this work.
References
1. Daswani PG, Gholkar MS, Birdi TJ. Psidium guajava: a single plant for multiple health problems of rural Indian population. Pharmacogn Rev. 2017;11(22):167. doi:10.4103/phrev.phrev_17_17
2. Etuk EU, Francis UU. Acute toxicity and efficacy of Psidium guajava leaves water extract on Salmonella typhi infected Wistar rats. Pak J Biol Sci. 2003;6:195–197. doi:10.3923/pjbs.2003.195.197
3. Dutta S, Das S. A study of the anti-inflammatory effect of the leaves of Psidium guajava Linn. on experimental animal models. Pharmacognosy Res. 2010;2(5):313–317. doi:10.4103/0974-8490.72331
4. Vargas-Alvarez D, Soto-Hernández M, González-Hernández VA, Engleman EM, Martínez-Garza Á. Kinetics of accumulation and distribution of flavonoids in guava (Psidium guajava L.). Agrociencia. 2006;40(1):109–115.
5. Hirudkar JR, Parmar KM, Prasad RS, et al. The antidiarrhoeal evaluation of Psidium guajava L. against enteropathogenic Escherichia coli induced infectious diarrhoea. J Ethnopharmacol. 2020;6:251. doi:10.1016/j.micpath.2019.103807
6. Panchal SK, Poudyal H, Brown L. Quercetin ameliorates cardiovascular, hepatic, and metabolic changes in diet-induced metabolic syndrome in rats. J Nutr. 2012;142(6):1026–1032. doi:10.3945/jn.111.157263
7. Bray GA. Soft drink consumption and obesity: it is all about fructose. Curr Opin Lipidol. 2010;21(1):51–57. doi:10.1097/MOL.0b013e3283346ca2
8. Samuel VT. Fructose induced lipogenesis: from sugar to fat to insulin resistance. Trends Endocrinol Metab. 2011;22(2):60–65. doi:10.1016/j.tem.2010.10.003
9. Softic S, Cohen DE, Kahn CR. Role of dietary fructose and hepatic de novo lipogenesis in fatty liver disease. Dig Dis Sci. 2016;61(5):1282–1293. doi:10.1007/s10620-016-4054-0
10. Lustig RH. Fructose: metabolic, hedonic, and societal parallels with ethanol. J Am Diet Assoc. 2010;110(9):1307–1321. doi:10.1016/j.jada.2010.06.008
11. Basciano H, Federico L, Adeli K. Fructose, insulin resistance, and metabolic dyslipidemia. Nutr Metab. 2005;2(1):1–4. doi:10.1186/1743-7075-2-5
12. Khitan Z, Kim DH. Fructose: a key factor in the development of metabolic syndrome and hypertension. J Nutr Metab. 2013;2013:1–12. doi:10.1155/2013/682673
13. Abdelmalek MF, Suzuki A, Guy C, et al. Nonalcoholic steatohepatitis clinical research network. Increased fructose consumption is associated with fibrosis severity in patients with nonalcoholic fatty liver disease. Hepatology. 2010;51(6):1961–1971. doi:10.1002/hep.23535
14. Elliott SS, Keim NL, Stern JS, Teff K, Havel PJ. Fructose, weight gain, and the insulin resistance syndrome. Am J Clin Nutr. 2002;76(5):911–922. doi:10.1093/ajcn/76.5.911
15. Reaven GM. The insulin resistance syndrome: definition and dietary approaches to treatment. Annu Rev Nutr. 2005;25:391–406. doi:10.1146/annurev.nutr.24.012003.132155
16. Barh D, Tiwari S, Andrade BS, et al. A novel multi-omics-based highly accurate prediction of symptoms, comorbid conditions, and possible long-term complications of COVID-19. Mol Omics. 2021;17(2):317–337. doi:10.1039/d0mo00189
17. Current step 4 version dated 4 June; 2008. Available from: http://www.ich.org/fileadmin/Public_Web_Site/ICH_Products/Guidelines/Quality/Q10/Step4/Q10_Guideline.pdf.
18. Armbruster DA, Pry T. Limit of blank, limit of detection and limit of quantitation. Clin Biochem Rev. 2008;29(Suppl 1):S49.
19. Prabhakar PK, Kumar A, Doble M. Combination therapy: a new strategy to manage diabetes and its complications. Phytomedicine. 2014;21(2):123–130. doi:10.1016/j.phymed.2013.08.020
20. Seifter S, Dayton S, Novic B, Muntwyler E. The estimation of glycogen with the athrone reagent. InFederation Proc. 1949;8:249.
21. Pari L, Srinivasan S. Antihyperglycemic effect of diosmin on hepatic key enzymes of carbohydrate metabolism in streptozotocin-nicotinamide-induced diabetic rats. Biomed Pharmacother. 2010;64(7):477–481. doi:10.1016/j.biopha.2010.02.001
22. Brandstrup N, Kirk JE, Bruni C. The hexokinase and phosphoglucoisomerase activities of aortic and pulmonary artery tissue in individuals of various ages. J Gerontol. 1957;12(2):166–171. doi:10.1093/geronj/12.2.166
23. Cabaud PG, Wroblewski F, Ruggiero V. The determination of serum lactate dehydrogenase. Am J Clin Pathol. 1958;30:234–236. doi:10.1093/ajcp/30.3.234
24. Kraemer RJ, Deitrich RA. Isolation and characterization of human liver aldehyde dehydrogenase. J Biol Chem. 1968;243(24):6402–6408. doi:10.1016/S0021-9258(18)93153-4
25. Titchenell PM, Quinn WJ, Lu M, et al. Direct hepatocyte insulin signaling is required for lipogenesis but is dispensable for the suppression of glucose production. Cell Metab. 2016;23(6):1154–1166. doi:10.1016/j.cmet.2016.04.022
26. Nakamura M. Determination of fructose in the presence of a large excess of glucose: part III. skatole-hydrochloric acid and β-indolyl acetic acid-hydrochloric acid reactions part IV A modified resorcinol-thiourea-hydrochloric acid reaction part VA modified cysteine-carbazole reaction. Agric Biol Chem. 1968;32(6):689–706. doi:10.1271/bbb1961.32.696
27. Graham JM. Isolation of Golgi membranes from tissues and cells by differential and density gradient centrifugation. Curr Protoc Cell Biol. 2001;10(1):3–9. doi:10.1002/0471143030.cb0309s10
28. King MS, Sharpley MS, Hirst J. Reduction of hydrophilic ubiquinones by the flavin in mitochondrial NADH: ubiquinone oxidoreductase (Complex I) and production of reactive oxygen species. Biochemistry. 2009;48(9):2053–2062. doi:10.1021/bi802282h
29. Barrientos A, Fontanesi F, Díaz F. Evaluation of the mitochondrial respiratory chain and oxidative phosphorylation system using polarography and spectrophotometric enzyme assays. Curr Protoc Hum Genet. 2009;63:19–23. doi:10.1002/0471142905.hg1903s63
30. Frazier AE, Thorburn DR. Biochemical analyses of the electron transport chain complexes by spectrophotometry. InMitochondrial Dis. 2012;49–62. doi:10.1007/978-1-61779-504-6_4
31. Griffiths DE, Houghton RL. Studies on energy‐linked reactions: modified mitochondrial ATPase of oligomycin‐resistant mutants of Saccharomyces cerevisiae. Eur J Biochem. 1974;46(2):157–167. doi:10.1111/j.1432-1033.1974.tb03608.x
32. Marklund S, Marklund G. Involvement of the superoxide anion radical in the autoxidation of pyrogallol and a convenient assay for superoxide dismutase. Eur J Biochem. 1974;47(3):469–474. doi:10.1111/j.1432-1033.1974.tb03714.x
33. Ellman GL. Tissue sulfhydryl groups. Arch Biochem Biophys. 1959;82(1):70–77. doi:10.1016/0003-9861(59)90090-6
34. Koster JF, Slee RG. Lipid peroxidation of rat liver microsomes. Biochim Biophys Acta. 1980;620(3):489–499. doi:10.1016/0005-2760(80)90141-1
35. Deguchi Y, Kouji M. Anti-hyperglycemic and anti-hyperlipidemic effects of guava leaf extract. Nutr Metab. 2010;7(1):1–10. doi:10.1186/1743-7075-7-9
36. Díaz-de-cerio E, Rodríguez-Nogales A, Algieri F, et al. The hypoglycemic effects of guava leaf (Psidium guajava L.) extract are associated with improving endothelial dysfunction in mice with diet-induced obesity. Food Res Int. 2017;96:64–71. doi:10.1016/j.foodres.2017.03.019
37. Li Y, Bai D, Lu Y, et al. The crude guava polysaccharides ameliorate high-fat diet-induced obesity in mice via reshaping gut microbiota. Int J Biol Macromol. 2022. doi:10.1016/j.ijbiomac.2022.05.130
38. Chu S, Zhang F, Wang H, et al. Aqueous extract of guava (Psidium guajava L.) leaf ameliorates hyperglycemia by promoting hepatic glycogen synthesis and modulating gut microbiota. Front Pharmacol. 2022;13. doi:10.3389/fphar.2022.907702
39. Mbara KC, Rambharose S, Baijnath H, Nlooto M, Owira PM. Antidiabetic effects of Psidium x durbanensis Baijnath & Ramcharun ined. (Myrtaceae) leaf extract on streptozotocin-induced diabetes in rats. J Ethnopharmacol. 2022;297:115542. doi:10.1016/j.jep.2022.115542
40. Mathur R, Dutta S, Velpandian T, Mathur SR. Psidium guajava Linn. leaf extract affects hepatic glucose transporter-2 to attenuate early onset of insulin resistance consequent to high fructose intake: an experimental study. Pharmacognosy Res. 2015;7(2):166. doi:10.4103/0974-8490.151459
41. Kobayashi T, Kaneko K, Takahashi M, Onoue M. Safety evaluations of guava leaves and unripe fruit of guava: single dose and 1 month repeated dose oral toxicity studies in rats. Annu Rep Yakult Cent Inst Microbiol Res. 2005;24:81–100.
42. Nair J, Velpandian T, Das US, et al. Molecular and metabolic markers of fructose induced hepatic insulin resistance in developing and adult rats are distinct and Aegle marmelos is an effective modulator. Sci Rep. 2018;8(1):1–8. doi:10.1038/s41598-018-33503-x
43. Guo X, Yoshitomi H, Gao M, et al. Guava leaf extracts promote glucose metabolism in SHRSP. Z-Leprfa/Izm rats by improving insulin resistance in skeletal muscle. BMC Complement Altern Med. 2013;13(1):1–8. doi:10.1186/1472-6882-13-52
44. Li YC, Qiao JY, Wang BY, Bai M, Shen JD, Cheng YX. Paeoniflorin ameliorates fructose-induced insulin resistance and hepatic steatosis by activating LKB1/AMPK and AKT pathways. Nutrients. 2018;10(8):1024. doi:10.3390/nu10081024
45. Aggarwal H, Nair J, Sharma P, et al. Aegle marmelos differentially affects hepatic markers of glycolysis, insulin signalling pathway, hypoxia, and inflammation in HepG2 cells grown in fructose versus glucose-rich environment. Mol Cell Biochem. 2018;438(1):1–6. doi:10.1007/s11010-017-3108-8
46. Li L, Fang B, Zhang Y, et al. Carminic acid mitigates fructose-triggered hepatic steatosis by inhibition of oxidative stress and inflammatory reaction. Biomed Pharmacother. 2022;145:112404. doi:10.1016/j.biopha.2021.112404
47. Mamun M, Al A, Faruk M, et al. High carbohydrate high fat diet induced hepatic steatosis and dyslipidemia were ameliorated by psidium guajava leaf powder supplementation in rats. Evid Based Complement Altern Med. 2019;2019:1–12. doi:10.1155/2019/1897237
48. Yang Q, Wen YM, Shen J, et al. Guava leaf extract attenuates insulin resistance via the PI3K/Akt signaling pathway in a type 2 diabetic mouse model. Diabetes Metab Syndr Obes. 2020;13:713. doi:10.2147/DMSO.S231979
49. Das M, Sauceda C, Webster NJ. Mitochondrial dysfunction in obesity and reproduction. Endocrinology. 2021;162(1):bqaa158. doi:10.1210/endocr/bqaa158
50. Souza AF, Woyames J, Miranda RA, et al. Maternal isocaloric high‐fat diet induces liver mitochondria maladaptations and homeostatic disturbances intensifying mitochondria damage in response to fructose intake in adult male rat offspring. Mol Nutr Food Res. 2022;66(8):2100514. doi:10.1002/mnfr.202100514
51. He Q, Venant N. Antioxidant power of phytochemicals from Psidium guajava leaf. J Zhejiang Univ Sci. 2004;5(6):676–683. doi:10.1007/BF02840979
 © 2022 The Author(s). This work is published and licensed by Dove Medical Press Limited. The
full terms of this license are available at https://www.dovepress.com/terms
and incorporate the Creative Commons Attribution
- Non Commercial (unported, 3.0) License.
By accessing the work you hereby accept the Terms. Non-commercial uses of the work are permitted
without any further permission from Dove Medical Press Limited, provided the work is properly
attributed. For permission for commercial use of this work, please see paragraphs 4.2 and 5 of our Terms.
© 2022 The Author(s). This work is published and licensed by Dove Medical Press Limited. The
full terms of this license are available at https://www.dovepress.com/terms
and incorporate the Creative Commons Attribution
- Non Commercial (unported, 3.0) License.
By accessing the work you hereby accept the Terms. Non-commercial uses of the work are permitted
without any further permission from Dove Medical Press Limited, provided the work is properly
attributed. For permission for commercial use of this work, please see paragraphs 4.2 and 5 of our Terms.