Back to Journals » International Journal of Nanomedicine » Volume 15
Graphene Oxide Negatively Regulates Cell Cycle in Embryonic Fibroblast Cells
Authors Hashemi E, Akhavan O, Shamsara M, Ansari Majd S, Sanati MH, Daliri Joupari M, Farmany A ![]()
Received 1 May 2020
Accepted for publication 20 July 2020
Published 19 August 2020 Volume 2020:15 Pages 6201—6209
DOI https://doi.org/10.2147/IJN.S260228
Checked for plagiarism Yes
Review by Single anonymous peer review
Peer reviewer comments 5
Editor who approved publication: Prof. Dr. Anderson Oliveira Lobo
Ehsan Hashemi,1– 3 Omid Akhavan,4 Mehdi Shamsara,1,2 Saeid Ansari Majd,2 Mohammad Hossein Sanati,5 Morteza Daliri Joupari,1,2 Abbas Farmany6
1Animal Biotechnology Department, National Institute of Genetic Engineering and Biotechnology, Tehran, Iran; 2National Research Center for Transgenic Mouse, National Institute of Genetic Engineering and Biotechnology, Tehran, Iran; 3Endocrinology and Metabolism Research Center, Endocrinology and Metabolism Clinical Sciences Institute, Tehran University of Medical Sciences, Tehran, Iran; 4Department of Physics, Sharif University of Technology, Tehran, Iran; 5Medical Genetics Department, National Institute of Genetic Engineering and Biotechnology, Tehran, Iran; 6Dental Research Center, Hamadan University of Medical Sciences, Hamadan, Iran
Correspondence: Morteza Daliri Joupari; Abbas Farmany Tel +98 21 4458-0340
Fax +98 21 44580393
Email [email protected]; [email protected]
Background: Unique properties of graphene and its derivatives make them attractive in the field of nanomedicine. However, the mass application of graphene might lead to side effects, which has not been properly addressed in previous studies, especially with regard to its effect on the cell cycle.
Methods: The effect of two concentrations (100 and 200 μg/mL) of nano- and microsized graphene oxide (nGO and mGO) on apoptosis, cell cycle, and ROS generation was studied. The effect of both sizes on viability and genotoxicity of the embryonic fibroblast cell cycle was evaluated. MTT and flow cytometry were applied to evaluate the effects of graphene oxide (GO) nanosheets on viability of cells. Apoptosis and cell cycle were analyzed by flow cytometry.
Results: The results of this study showed that GO disturbed the cell cycle and nGO impaired cell viability by inducing cell apoptosis. Interestingly, both nGO and mGO blocked the cell cycle in the S phase, which is a critical phase of the cell cycle. Upregulation of TP53-gene transcripts was also detected in both nGO- and mGO-treated cells compared to the control, especially at 200 μg/mL. DNA content of the treated cells increased; however, because of DNA degradation, its quality was decreased.
Conclusion: In conclusion, graphene oxide at both nano- and micro-scale damages cell physiology and increases cell population in the S phase of the cell cycle.
Keywords: apoptosis, cell cycle, fibroblast cell, graphene, TP53 gene
Introduction
As one of the thinnest two-dimensional sheets of graphitized carbon material, graphene is one of the most important nanomaterials used in industry and medicine.1–3 It has several unique properties, such as large surface area, high electrical and thermal conductivity, and enhanced mechanical properties and biocompatibility.4–7 Graphene nanoplatelets are currently used in drug delivery, photothermal cancer therapy, biosensing, biocompatible scaffolds, bioimaging, and as antimicrobial components.8–11 However, increased applications of graphene nanoplatelets might increase the risk of human exposure to this material in the environment. Some studies reported on the toxicity of graphene and its derivatives ondifferent cell lines and revealed its size, surface-functional groups, and dose-dependent toxicity;12–15 however, what is the threshold of graphene concentration as toxic or safe?
Today, MTT and XTT assays are applied to measure the in vitro toxicity of nanomaterials; however, the effects of atoxic doses of nanomaterials on physiological cell pathways has not properly been investigated. Nanomaterials, occasionally like mutagenic materials, may enhance cell division by regulating genes or proteins. To consider a particle biocompatible, not only should its effect on cell viability and apoptosis be evaluated but also its effects on the cell cycle, mutagenesis, and genotoxicity. As one of the most important events in mammalian cells, the cell cycle plays a crucial role in the biology of living cells, eg, cell growth and cell division.16 This biological phenomenon is regulated by some genes and proteins, and in some conditions, such as DNA damage, hypoxia, hyperproliferative signals, growth-factor deprivation, and matrix detachment, the cell cycle goes out of control. In these abnormal conditions, the TP53 gene usually regulates the cell cycle by either arresting or activing apoptosis pathways.17 At this time, the effect of nanomaterials, especially graphene oxide (GO), on the cell cycle has not been studied properly. There have been some controversial reports on the effect of GO on the cell cycle. For example, some studies have reported that GO decreases HepG2 cells in the G2 phase;18 however, it increased the hemangioblast population in the G2/M phase. Arrest of the cell cycle in the S and G0/G1 phases in cell lines and macrophages were detected.19 Moreover, it has been reported that through induction of ROS, cell-membrane damage, and DNA damage, smaller nanomaterials exhibit more toxicity than larger ones.20 Smaller nanoparticles can easily penetrate a cell and interact with biomacromolecules, resulting in side effects.21 GO size, due to its available surface area and chemical functional groups, affects cell uptake and interactions. Therefore, as the effect of GO on the cell cycle has not investigated adequately the main goal of this study was to investigate the effects of GO on the cell cycle and behavior of embryonic fibroblast cells.
Methods
All experimental methods were carried out in accordance with protocol IR.UMSHA.REC.1397.98, approved by the Institutional Cell Culture and Animal Care and Use Committee of the Hamadan University of Medical Sciences of Iran.
Synthesis of Micro- and Nanoscale Graphene Oxide Sheets
Both micro- and nanoscale GO sheets were synthesized using a modified Hummers method.22 To prevent toxic NO2-gas formation, we proceeded in the absence of NaNO3. Briefly, 1 g natural graphite powder (Sigma-Aldrich) was added at room temperature to 100 mL concentrated H2SO4 and stirred for 5 hours at 26 g at 80°C. The mixture was cooled in an ice bath for 10 minutes, then 6 g KMnO4 was added slowly to the mixture. The suspension was stirred at 103 g in an oil bath for 2 hours at 35°C. After dilution of the mixture to 100 mL with deionized (DI) water, its temperature was maintained at <60°C. In continue, in order to reduce the residual permanganate into soluble manganese ions, 6 mL H2O2 and 200 mL DI water were added. An anodic membrane filter (47 mm diameter, 0.2 µm pore size; Whatman) was used to remove residual salts and acids from the suspension. To remove any unexfoliated graphitic particles, the filtered material was dispersed in DI water and centrifuged at 2,582 g for 10 minutes. Finally, a suspension containing microscale GO sheets was obtained by sonication at a frequency of 40 kHz and power 150 W for 15 minutes. To obtain the nanoscale GO sheets, sonication was continued for an additional 100 minutes, followed by centrifugation at 10,329 g for 30 minutes, which was carried out in four cycles.
Cell Culture and Staining
MEF cells were cultured.23 Briefly, cells were extracted from pregnant mice 12.5 days postcoitus and isolated from tissue by 0.05% trypsin–EDTA dissociation. Extracted MEF cells were cultured in DMEM supplemented with 10% FBS, 100 U/mL penicillin, 2 mM inessential amino acid, 2 mM glutamine, and 10 µg/mL streptomycin at an atmosphere of CO2 (5%) at 37°C. Cultured MEF cells were exposed to 100 µg/mL and 200 µg/mL of both mGO and nGO particles, and untreated cells were considered the control group. To stain MEF cells with fluorescein diacetate (FDA) and propidium iodide (PI), cultured cells in six-well plates were washed with PBS and incubated with 5 mg/mL FDA and 2 mg/mL PI at 37°C in the dark for 30 minutes. After incubation, cells were washed three times with PBS and monitored with an inverted florescence microscope (Ti-U; Nikon, Japan) at excitation wavelength of 490 nm and emission wavelength of 526 nm for FDA and excitation wavelength of 490 nm and emission wavelength of 617 nm for PI.
MTT Assay
The viability of treated cells was measured with MTT assays.24 Briefly, treated cells were cultured in a 96-well plate and incubated for 3 hours with MTT solution. DMSO was added to solubilize formazan particles, and absorbance was read at 580 nm using a microplate reader (LabSystems Multiskan; BioTek, USA).
ROS Measurement
ROS was measured in GO-treated fibroblast cells using 2ʹ,7ʹ-dichlorofluorescein diacetate (DCFH-DA; D6883; Sigma-Aldrich). Untreated cells were used as controls. Briefly, cells were incubated in a CO2 atmosphere (5%) at 37°C for 30–60 minutes with 10 µM DCFH-DA. Cells were detached with trypsin and washed three times with PBS. The resulting cell suspension was centrifuged for 5 minutes at 112 g. The conversion rate of DCFH to dichlorofluorescein was measured with fluorescence spectrophotometry (Cary Eclipse; Agilent, USA) at excitation and emission wavelengths of 480 and 520 nm, respectively.
DNA Extraction and Electrophoresis
Genomic DNA was extracted from both treated and control cells using a commercial DNA-extraction kit based on the kit manual (11796828001; Roche, Germany). The extracted DNA was run in 1% agarose for 45 minutes. The gel was stained in ethidium bromide dye and visualized on gel documentation (Fusion FX, Vilber Lourmat, France) under 260 nm wavelength.
RNA Extraction, cDNA Synthesis, and qRT-PCR
Cell total RNA was isolated with a commercial kit (11828665001; Roche) based on the manufacturer’s guidelines. The extracted RNA was stored at −70°C until use. The quality and quantity of RNA was checked with a NanoDrop 2000(Thermo Fisher Scientific). Then, 100 ng extracted RNA was used for cDNA synthesis. cDNA was synthesized with a RevertAid first-strand cDNA-–synthesis kit (K1622; Fermentas, USA). TP53-gene expression was quantified with a real-time qPCR system (Applied Biosystems, USA) using primers of forward 5ʹ CCCTTCCCAGAAAACCTACC 3ʹ and reverse 5ʹ CTCCGTCATGTGCTGTGACT 3ʹ and SYBR Green PCR Master Mix (Applied Biosystems). qRT-PCR measurements were carried out three times using cDNA obtained from three independent experiments.
Apoptosis Assays with Flow Cytometry
Treated and control MEF cells (105) deattached as previously described and then resuspended in 500 µL binding buffer, and 5 µL annexin V–FITC and 5 µLPI incubated at room temperature for 5 minutes in the dark. Finally, annexin V–FITC binding was analyzed with flow cytometry at excitation wavelength 488 nm and emission wavelength 350 nm using a FITC-signal detector and PI staining with a phycoerythrin emission–signal detector.
Cell-Cycle Analysis with Flow Cytometry
Treated and control MEF cells (3×10⁵) were cultured and the cell cycle analyzed with flow cytometry. Briefly, harvested cells (105) were washed with PBS, then detached by trypsin and washed with PBS. The suspension was centrifuged for 5 minutes at 112 g and incubated in the dark in 500 μL staining solution (100 μg/mL RNase A, 50 μg/mL PI, and 1% FBS in PBS) at 37°C for 30 minutes. Finally, DNA content of the stained cells was evaluated with a FACSCalibur (BD Biosciences).
Statistical Analysis
ANOVA and comparisons among obtained data were done using SPSS version 24. One-way ANOVAs followed by Duncan’s test were used for analysis of the experimental data. All experiments were replicated three times, and the significance level was p≤0.05.
Results
Synthesis and Characterization of Micro- and Nanoscale Graphene Oxide Sheets
Micro- and nanoscale GO sheets were synthesized using the modified Hummers method.22 mGO and nGO sheets were obtained after 15 and 100 minutes ultrasonication, respectively. The synthesized mGO and nGO sheets were characterized by using FTIR, XRD, SEM, AFM, and XPS. SEM, AFM and XPS data of synthesized mGO and nGO by our group have been reported elsewhere.13,15 To investigate the structure and functional groups of mGO and nGO, FTIR analysis was performed. Adsorption bands at 1,620, 1,721, 1,230, 1,036, and 3,430 cm−1 were assigned to aromatic C=C, carboxyl C=O, epoxy C–O, alkoxy C–O, and hydroxy –OH groups, respectively. A C–H stretching vibration peak was observed at 2,880 cm−1. As shown in Figure 1A, transmittance percentages of all oxygen-containing functional groups in nGO were more than those of mGO sheets, which may have been due to more exfoliation of nGO sheets than mGO.25–27 To determine the average crystalline properties of GO sheets, XRD analysis was performed. Figure 1B shows the XRD pattern of mGO and nGO samples. GO sheets exhibited a sharp 001 reflection at 2θ=11.95°, corresponding to their interlayer spacing. Thickness of mGO and nGO sheets was calculated using the Scherrer equation. This revealed that mGO and nGO thickness were about 1.5 nm and 0.8 nm in basal spacing, respectively, in agreement with AFM data.13,15 This explains the existence of oxygen-functional groups increasing the interlayer distance between GO sheets. Furthermore, XRD patterns of mGO and nGO samples were different, showing that the crystal size of nGO was decreased by more sonication, which confirms that after oxidation, the crystalline structure was distorted.28
 |
Figure 1 FTIR and XRD analyses of GO particles. (A) FTIR spectra; (B) XRD patterns of nGO and mGO. |
Cell Viability
The viability of treated cells was evaluated by both fluorescence microscopy and MTT assays. As shown in Figure 2A, microscopy revealed more cell viability in the control group (green cells) than the treated groups. The number of dead cells (red cells) in the control group was fewer than other groups (Figure 2B). Viable and dead cells treated with mGO and nGO are shown in Figure 2C–F. As shown in Figure 2G, MTT assays revealed that cell-viability rates in the control, 100 µg/mL mGO, 200 µg/mL mGO, 100 µg/mL nGO, and 200 µg/mL nGO were 100%, 79%± 5%, 66%± 4%, 72%± 5%, and 60±4%, respectively.
 |
Figure 2 Microscopic analysis of cell death. Fluorescence imaging of cells stained by PI and FDA: (A) viable cells in control, (B) dead cells in control, (C) viable cells in 200 µg/mL mGO–treated culture, (D) dead cells in 200 µg/mL mGO–treated culture, (E) viable cells in 200 µg/mL nGO–treated culture, and (F) dead cells in 200 µg/mL nGO-treated culture. (G) MTT assay of cell-viability rate. *P<0.05 (n =3). |
Cell Apoptosis
Programmed cell death was analyzed by flow cytometry. As shown in Figure 3, cellviability rates in 100 and 200 μg/mL mGO were 71.6% and 44.1%, respectively, significantly less than the control group. Cell apoptosis in these groups was 5.86%, which was greater than the control group. Cell viability in nGO-treated groups decreased to 63% and 27.5% with 100 and 200 μg/mL nanoparticles, respectively. Cell apoptosis in the nGO-treated group at concentrations of 100 and 200 μg/mL was 6.21% and 6.14%, respectively, significantly greater than the control group. The proportion of necrotic cells was also measured (Figure 3F), and results showed that the percentage of necrotic cells in 200 μg/mL of both mGO and nGO was significantly higher than the control group. A size- and concentration-dependent sub-G1 apoptosis can be seen in Figure 4B–E. This confirmed the results of apoptosis assays, in which the rate of apoptosis was higher in nGO and 200 μg/mL than mGO and 100 μg/mL.
 |
Figure 3 Cell-viability and cell-death evaluation. Flow-cytometry density plots for cell-apoptosis analysis: (A) control group, and (B) treatment with 100 µg/mL mGO, (C) 200 µg/mL mGO, (D) 100 µg/mL nGO, and (E) 200 µg/mL nGO. (F) Percentage of necrotic cell in treated and control cells, (G) percentage of apoptosis in treated and control cells. *P<0.05 (n=3). |
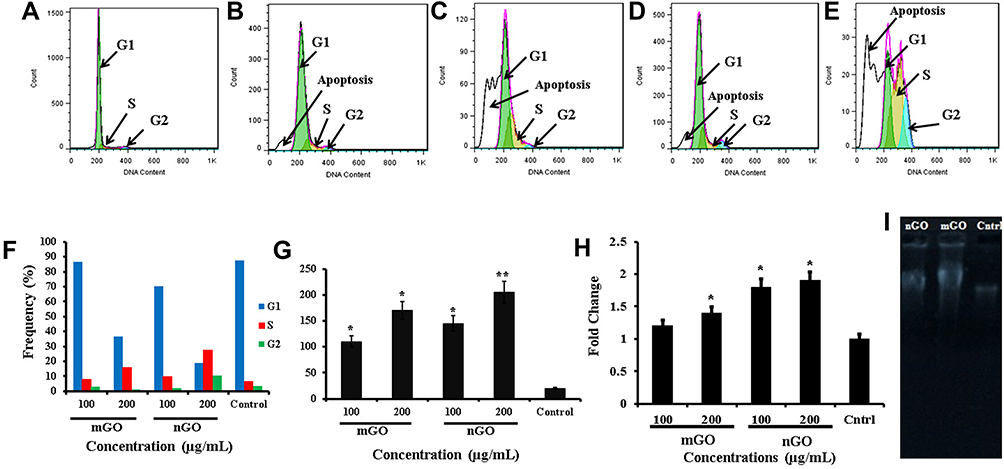 |
Figure 4 Cell-cycle analysis by flow cytometry: (A) control group, (B) treated with 100 µg/mL mGO, (C) 200 µg/mL mGO, (D) 100 µg/mL nGO, (E) and 200 µg/mL nGO. (F) Frequency of cell-cycle phases with different treatments. (G) ROS levels, (H) transcript levels of TP53 gene, (I) gel electrophoresis of DNA of treated and untreated cells (results are for 200 µg/mL mGO and nGO). *P<0.05; **P<0.01 (n=3). |
Cell Cycle
The effect of nGO and mGO on different phases of the cell cycle was studied with flow cytometry. As shown in Figure 4, graphene particles triggered cell division and boosted the S phase in the treated cells. The cell population in the S phase in the 200 μg/mL nGO group was 27.1%±1.4%, significantly greater than the other groups (p≤0.05). Levels for cells treated with 100 and 200 μg/mL mGO were 8.2%±0.5% and 16.8%±1.1%, respectively, and 5.2%±0.2% for the control cells, showing a significant difference between the 200 μg/mL mGO–treated group and the control group.
ROS Assays
A significant increase in ROS level was detected in mGO and nGO treated fibroblasts at both concentrations of 100 and 200 μg/mL (p≤0.05) (Figure 4G). The ROS level in 200 μg/mL nGO was 205, which was meaningfully greater than that of control group as 27 (p≤0.05). The ROS level in nGO treated cells was higher than mGO, which might be because of the smaller size of nGO, as nanoscale graphene could easily penetrate cells, damage membranes due to sharp-edges, impair cellular organelles and increase intracellular free radicals.
Genotoxicity
Quantitative real-time PCR analysis revealed a significant increase in TP53-transcript levels in GO-treated groups. Treatment with nGO 200 μg/mL increased the TP53-transcript level to 1.9±0.2-fold that of control. Also, this level was 1.6±0.15-fold in 100 μg/mL nGO. Transcript levels for 100 and 200 μg/mL mGO were 1.2±0.1-fold and 1.5±0.13-fold respectively (Figure 4H).
Figure 4I presents the gel-electrophoresis pattern of genomic DNA of treated and untreated cells. The measure of DNA in treated cells was higher than that control group, but DNA damage in the treated cells was greater than controls. As shown in Figure 4H, DNA of treated cells was broken and smeared on gel electrophoresis, but a sharp DNA band was detected by the DNA of control cells.
Discussion
Micro- and nanoscale GO sheets were obtained by sonication of the suspension at different times using a modified Hummers method.22 As mentioned in the Methods section, mGO and nGO sheets were obtained at 15 and 100 minutes’ ultrasonication, respectively. mGO and nGO nanosheets were fully characterized by FTIR, XRD, SEM, AFM, and XPS. SEM, AFM, and XPS data of synthesized mGO and nGO are reported elsewhere.13,15 The structure and functional groups of mGO and nGO were evaluated using FTIR analysis. The main adsorption bands at 1,620, 1,721, 1,230, 1,036, and 3,430 cm−1 are registered for both mGO and nGO, and can be assigned to aromatic C=C, carboxyl C=O, epoxy C–O, alkoxy C–O, and hydroxy-OH groups, respectively (see Figure 1A).25–27 The crystalline structure of GO sheets was evaluated using XRD analysis. A sharp (001) reflection peak at 2θ=11.95° is shown in Figure 1B. In the XRD pattern of synthesized GO in Figure 1B, only a (001) peak at 2θ=11.95° is found, which shows an increase in interplanar d-spacing of GO nanoplatelets due to the existence of oxygen-functional groups and confirms the success of the oxidation process.29–32 Intensity of the (001) band seems to be oxygen-functional group–dependent. A more intense (001) Miller index value in nanoscale GO indicates more progressive exfoliation of nGO sheets than mGO and its crystalline structure.33
Cytotoxicity of fibroblast cells exposed to mGO and nGO was studied with flow cytometry. Results indicated an increase in the cell population in the S phase, whereas no increase was detected in untreated cells. This finding shows that the accumulation of cells in the S phase was mainly associated with GO particles. Furthermore, gene-expression variation contributed to S-phase accumulation, and DNA damage was investigated. TP53 is the most important gene in the cell cycle related to DNA damage, and quantification of TP53 expression of revealed changes. TP53 also regulates the cell cycle through cell arrestin the G1 phases and triggers apoptosis in cells by indirect control of cyclin-dependent kinases 2, 3, 4, and 6.34
Synthesis of DNA is a crucial step in cell division, and any change in this step may lead to undesired results in cell behavior and biology. Mutagenic materials usually trigger the S phase in the cell cycle and increase DNA synthesis.35 Previous research has shown that the GO family can change the cell cycle: Wang et al revealed that GO blocked cells in the S phase.36 The results of this study revealed that GO particles increased DNA synthesis through such mechanisms as ROS production, damaged DNA, and caused double-strand breaks in the DNA of fibroblast cells. The genotoxicity of GO and its derivates was assessed using Comet and chromosomal-aberration assays.12,13,37 The current results are also in agreement with Mohamed et al, as they showed that GO trigger DNA and chromosomal damage in in vivo conditions when orally administered to Swiss mice.38
Through either direct interaction of extremely sharp edges or ROS generation, GO particles can penetrate exposed cells and interact with biological membranes, causing impairment of intracellular organelles and increasing production of free radicals, which in turn can have an impact on cell nuclei and vital processes, such as interference with the cell cycle, damage to DNA and RNA and protein synthesis.39–41 Apoptosis of treated cells was also evaluated to find by which mechanism GO triggered cell toxicity. Our results revealed size- and concentration-dependent apoptosis when cells were treated with GO. Cell-cycle analysis also revealed sub-G1 apoptosis in GO-treated groups, which increased with concentration. These data confirmed our apoptosis assays in treated cells. The apoptosis and viability results of Kang et al are in agreement with our results, as they showed GO and reduced GO increased cell toxicity and apoptosis in the PC12 cell line. However, their cell-cycle results were in contrast with ours, as they revealed an increase in G0/G1 phases in PC12-treated cells.40
RNA-sequencing data analysis by Gurunathan et al revealed that GO, through changingexpression of genes involved in apoptosis-related biological pathways in HEK293 cells, triggered apoptosis and cell death, in agreement with our results.42 Tang et al showed that exposing K7M2 cells to GO increased cell apoptosis due to generation of ROS, confirmed our apoptosis- and ROS-assay results, as more ROS generation led to higher levels of apoptosis.43 Cell cycle-analysis also showed a block in the G2/M phase in GO-treated groups, but the pattern for 200 µg/mL nGO was completely different, as this treatment increased the G2/M phase more than the control group. This may have been due to abnormal growth of treated cells showing an altered capacity for mitotic division. The results of Kang et al also confirm ours, as they detected a decrease in the G2/M cell population.40
The results of this study are in agreement with those previously reported, as GO particles not only changed the cell-cycle pattern but also increased DNA damage. However, these results contradict those of Liu et al, who concluded that nanoparticles cannot impair DNA.44 This inconsistency may be related to cell and nanoparticle types used and also differences in physicochemical properties. The interaction of nanoparticles with biological molecules is highly dependent on size and surface area.45 Our results confirmed the size-dependent toxicity of GO.
Conclusion
In conclusion, GO at both nano- and microscale disrupted cell physiology and increased the cell population in the S phase of the cell cycle. GO acts as mutagenic material that triggers cell division and DNA synthesis. DNA damage and TP53-transcript levels were increased by GO treatment. These results indicated GO not only boosted cell division and DNA synthesis but also exhibited cellular apoptosis. The DNA damage and TP53 transcripts were in contrast to the increase in cell population in the S phase of the cell cycle. These conflicting data may be because of toxic effects of ultrasharp-edged GO leading to ROS generation and interaction with cellular macromolecules.
Acknowledgments
The authors would like to thank the National Institute of Genetic Engineering and Biotechnology (970308-II-705) and Hamadan University of Medical Sciences (9703081282) for their financial support and provision of facilities.
Disclosure
The authors report no conflicts of interest in this work.
References
1. Newby SD, Masi T, Griffin CD, et al. Functionalized graphene nanoparticles induce human mesenchymal stem cells to express distinct extracellular matrix proteins mediating osteogenesis. Int J Nanomed. 2020;15:2501–2513. doi:10.2147/IJN.S245801
2. Ahmadian H, Hashemi E, Akhavan O, et al. Apoptotic and anti-apoptotic genes transcripts patterns of graphene in mice. Mater Sci Eng C Mater Biol Appl. 2017;71:460–464. doi:10.1016/j.msec.2016.09.073
3. Ou L, Sun T, Liu M, et al. Efficient miRNA inhibitor delivery with graphene oxide-polyethylenimine to inhibit oral squamous cell carcinoma. Int J Nanomed. 2020;15:1569–1583. doi:10.2147/IJN.S220057
4. Heidarimoghadam R, Akhavan O, Ghaderi E, Hashemi E, Mortazavi SS, Farmany A. Graphene oxide for rapid determination of testosterone in the presence of cetyltrimethylammonium bromide in urine and blood plasma of athletes. Mater Sci Eng C Mater Biol Appl. 2016;61:246–250. doi:10.1016/j.msec.2015.12.005
5. Liu F, Seo TS. A controllable self-assembly method for large-scale synthesis of graphene sponges and free-standing graphene films. Adv Funct Mater. 2010;20:1930–1936. doi:10.1002/adfm.201000287
6. Melvin S, Swati S, Venkateshkannan SE, Mathimani T, Pugazhendhi A. Immobilization of Cu3(btc)2 on graphene oxide-chitosan hybrid composite for the adsorption and photocatalytic degradation of methylene blue. J Photochem Photobiol B: Biol. 2020;204:111809. doi:10.1016/j.jphotobiol.2020.111809
7. Jiang Z, Shan K, Song J, et al. Toxic effects of magnetic nanoparticles on normal cells and organs. Life Sci. 2019;220:156–161. doi:10.1016/j.lfs.2019.01.056
8. Pugazhendhi A, Nesakumar T, Immanuel E, Indir K, Brindhad K. Inorganic nanoparticles: a potential cancer therapy for human welfare. Int J Pharmaceu. 2018;25:104–111. doi:10.1016/j.ijpharm.2018.01.034
9. Samuel S, Selvarajan E, Subramaniam K, Mathimani T, Seethappan S, Pugazhendhi A. Synthesized β-cyclodextrin modified graphene oxide (β-CD-GO) composite for adsorption of cadmium and their toxicity profile in cervical cancer (HeLa) cell lines. Process Biochem. 2020;93:28–35. doi:10.1016/j.procbio.2020.02.014
10. Sun XM, Liu Z, Welsher K, et al. Nano-graphene oxide for cellular imaging and drug delivery. Nano Res. 2008;1(3):203–212. doi:10.1007/s12274-008-8021-8
11. Mao HY, Laurent S, Chen W, et al. Graphene: promises, facts, opportunities, and challenges in nanomedicine. Chem Rev. 2013;113(5):3407–3424. doi:10.1021/cr300335p
12. Hashemi E, Akhavan O, Shamsara M, Rahighi R, Esfandiar A, Tayefeh AR. Cyto- and geno-toxicities of graphene oxide and reduced graphene oxide sheets on spermatozoa. RSC Adv. 2014;4:27213–27223. doi:10.1039/c4ra01047g
13. Hashemi E, Akhavan O, Shamsara M, Daliri M, Dashtizad M, Farmany A. Synthesis and cyto-genotoxicity evaluation of graphene on mice spermatogonial stem cells. Colloids Surf B Biointerfaces. 2016;146:770–776. doi:10.1016/j.colsurfb.2016.07.019
14. Sydlik SA, Jhunjhunwala S, Webber MJ, Anderson DG, Langer R. In vivo compatibility of graphene oxide with differing oxidation states. ACS Nano. 2015;9(4):3866–3874. doi:10.1021/acsnano.5b01290
15. Akhavan O, Ghaderi E, Hashemi E, Akbari E. Dose-dependent effects of nanoscale graphene oxide on reproduction capability of mammals. Carbon. 2015;95:309–317. doi:10.1016/j.carbon.2015.08.017
16. Hartwell L, Kastan M. Cell cycle control and cancer. Science. 1994;266(5192):1821–1828. doi:10.1126/science.7997877
17. Bartek J, Lukas C, Lukas J. Checking on DNA damage in S phase. Nat Rev Mol Cell Biol. 2004;5(10):792–804. doi:10.1038/nrm1493
18. Yuan JF, Gao HC, Sui JJ, Duan HW, Chen WN, Ching CB. Cytotoxicity evaluation of oxidized single-walled carbon nanotubes and graphene oxide on human hepatoma HepG2 cells: an iTRAQ-coupled 2D LC-MS/MS proteome analysis. Toxicol Sci. 2012;126(1):149–161. doi:10.1093/toxsci/kfr332
19. Hu W, Peng C, Lv M, Li X, Zhang Y, Chen N. Protein corona-mediated mitigation of cytotoxicity of graphene oxide. ACS Nano. 2011;5(5):3693–3700. doi:10.1021/nn200021j
20. Matesanz MC, Vila M, Feito MJ, Linares J, Gonçalves G, Vallet-Regi M. The effects of graphene oxide nanosheets localized on F-actin filaments on cell-cycle alterations. Biomaterials. 2013;34(5):1562–1569. doi:10.1016/j.biomaterials.2012.11.001
21. Villanueva-Flores F, Castro-Lugo A, Ramírez OT, Palomares LA. Understanding cellular interactions with nanomaterials: towards a rational design of medical nanodevices. Nanotechnology. 2020;31:132002. doi:10.1088/1361-6528/ab5bc8
22. Schniepp HC, Li JL, McAllister MJ, et al. Functionalized single graphene sheets derived from splitting graphite oxide. J Phys Chem B. 2006;110:8535–8539. doi:10.1021/jp060936f
23. Jozefczuk J, Drews K, Adjaye J. Preparation of mouse embryonic fibroblast cells suitable for culturing human embryonic and induced pluripotent stem cells. J Vis Exp. 2012;64:3854.
24. Kumar P, Nagarajan A, Pradeep U. Analysis of cell viability by the MTT assay. Cold Spring Harbor Protocols. 2018;6:469–472.
25. Zhou K, Zhu Y, Yang X, Jiang X, Li C. Preparation of graphene-TiO2 composites with enhanced photocatalytic activity. New J Chem. 2011;35:353–359. doi:10.1039/C0NJ00623H
26. Zhang Y, Pan C. TiO2/graphene composite from thermal reaction of graphene oxide and its photocatalytic activity in visible light. J Mater Sci. 2011;46:2622–2626. doi:10.1007/s10853-010-5116-x
27. Shen J, Shi M, Yan B, Ma H, Li N, Ye M. Ionic liquid assisted one-step hydrothermal synthesis of TiO2-reduced graphene oxide composites. Nano Res. 2011;4:795–806. doi:10.1007/s12274-011-0136-7
28. Gao W, Alemany LB, Ci L, Ajayan PM. New insights into the structure and reduction of graphite oxide. Nat Chem. 2009;1:403–408. doi:10.1038/nchem.281
29. Shin H-J, Kim KK, Benayad A, et al. Efficient reduction of graphite oxide by sodium borohydride and its effect on electrical conductance. Adv Funct Mater. 2009;19(12):1987–1992. doi:10.1002/adfm.200900167
30. Brahmayya M, Dai SA, Suen S-Y. Sulfonated reduced graphene oxide catalyzed cyclization of hydrazides and carbon dioxide to 1,3,4-oxadiazoles under sonication. Sci Rep. 2017;7(1):4675. doi:10.1038/s41598-017-04143-4
31. Li ZQ, Lu CJ, Xia ZP, Zhou Y, Luo Z. X-ray diffraction patterns of graphite and turbostratic carbon. Carbon. 2007;45(8):1686–1695. doi:10.1016/j.carbon.2007.03.038
32. Kim KH, Yang M, Cho KM, Jun YS, Lee SB, Jung HT. High quality reduced graphene oxide through repairing with multi-layered graphene ball nanostructures. Sci Rep. 2013;3(1):3251. doi:10.1038/srep03251
33. Muzyka R, Drewniak S, Pustelny T, Chrubasik M, Gryglewicz G. Characterization of graphite oxide and reduced graphene oxide obtained from different graphite precursors and oxidized by different methods using raman spectroscopy. Materials. 2018;11(7):1050. doi:10.3390/ma11071050
34. Shaw PH. The role of p53 in cell cycle regulation. Pathol Res Pract. 1996;192(7):669–675. doi:10.1016/S0344-0338(96)80088-4
35. Olivero OA, Tejera AM, Fernandez JJ. Zidovudine induces S-phase arrest and cell cycle gene expression changes in human cells. Mutagenesis. 2005;20:139–146. doi:10.1093/mutage/gei019
36. Wang Y, Xu J, Xu L, et al. Functionalized graphene oxide triggers cell cycle checkpoint control through both the ATM and the ATR signaling pathways. Carbon. 2018;129:495–503. doi:10.1016/j.carbon.2017.12.012
37. Demir E, Marcos R. Toxic and genotoxic effects of graphene and multi-walled carbon nanotubes. J Toxicol Environ Health, Part A. 2018;81(14):645–660. doi:10.1080/15287394.2018.1477314
38. Mohamed HRH, Welson M, Yaseen AE, El-Ghor A. Induction of chromosomal and DNA damage and histological alterations by graphene oxide nanoparticles in Swiss mice. Drug Chem Toxicol. 2019;1:1–11. doi:10.1080/01480545.2019.1643876
39. Lindberg HK, Falck GCM, Suhonen S, Vippola M, Vanhala E, Catalán J. Genotoxicity of nanomaterials: DNA damage and micronuclei induced by carbon nanotubes and graphite nanofibres in human bronchial epithelial cells in vitro. Toxicol Lett. 2009;186(3):166–173. doi:10.1016/j.toxlet.2008.11.019
40. Kang Y, Liu J, Wu J, et al. Graphene oxide and reduced graphene oxide induced neural pheochromocytoma-derived PC12 cell lines apoptosis and cell cycle alterations via the ERK signaling pathways. Int J Nanomed. 2017;12:5501–5510. doi:10.2147/IJN.S141032
41. Gurunathan S, Kim JH. Synthesis, toxicity, biocompatibility, and biomedical applications of graphene and graphene-related materials. Int J Nanomed. 2016;11:1927–1945. doi:10.2147/IJN.S105264
42. Gurunathan S, Iqbal M, Qasim M, et al. Evaluation of graphene oxide induced cellular toxicity and transcriptome analysis in human embryonic kidney cells. Nanomaterials. 2019;9:969. doi:10.3390/nano9070969
43. Tang Z, Zhao L, Yang Z, et al. Mechanisms of oxidative stress, apoptosis, and autophagy involved in graphene oxide nanomaterial anti-osteosarcoma effect. Int J Nanomed. 2018;13:2907–2919. doi:10.2147/IJN.S159388
44. Liu KK, Wang CC, Cheng CL, Chao JI. Endocytic carboxylated nanodiamond for the labeling and tracking of cell division and differentiation in cancer and stem cells. Biomaterials. 2009;30(26):4249–4259. doi:10.1016/j.biomaterials.2009.04.056
45. Xing Y, Xiong W, Zhu L, O̅sawa E, Hussin S, Dai L. DNA damage in embryonic stem cells caused by nanodiamonds. ACS Nano. 2011;5(3):2376–2384. doi:10.1021/nn200279k
 © 2020 The Author(s). This work is published and licensed by Dove Medical Press Limited. The
full terms of this license are available at https://www.dovepress.com/terms
and incorporate the Creative Commons Attribution
- Non Commercial (unported, 3.0) License.
By accessing the work you hereby accept the Terms. Non-commercial uses of the work are permitted
without any further permission from Dove Medical Press Limited, provided the work is properly
attributed. For permission for commercial use of this work, please see paragraphs 4.2 and 5 of our Terms.
© 2020 The Author(s). This work is published and licensed by Dove Medical Press Limited. The
full terms of this license are available at https://www.dovepress.com/terms
and incorporate the Creative Commons Attribution
- Non Commercial (unported, 3.0) License.
By accessing the work you hereby accept the Terms. Non-commercial uses of the work are permitted
without any further permission from Dove Medical Press Limited, provided the work is properly
attributed. For permission for commercial use of this work, please see paragraphs 4.2 and 5 of our Terms.