Back to Journals » International Journal of Nanomedicine » Volume 16
Graphene Oxide Based Electrochemical Genosensor for Label Free Detection of Mycobacterium tuberculosis from Raw Clinical Samples
Authors Javed A, Abbas SR ![]() , Hashmi MU, Babar NUA, Hussain I
, Hashmi MU, Babar NUA, Hussain I ![]()
Received 5 July 2021
Accepted for publication 7 September 2021
Published 2 November 2021 Volume 2021:16 Pages 7339—7352
DOI https://doi.org/10.2147/IJN.S326480
Checked for plagiarism Yes
Review by Single anonymous peer review
Peer reviewer comments 2
Editor who approved publication: Dr Yan Shen
Aisha Javed,1 Shah Rukh Abbas,1 Muhammad Uzair Hashmi,1 Noor Ul Ain Babar,2 Irshad Hussain2
1Department of Industrial Biotechnology, Atta-ur-Rahman School of Applied Biosciences, National University of Science and Technology, Islamabad, 44000, Pakistan; 2Department of Chemistry, Syed Babar Ali School of Science and Engineering, Lahore University of Management Sciences, Lahore, 54792, Pakistan
Correspondence: Shah Rukh Abbas
Department of Industrial Biotechnology, Atta-ur-Rahman School of Applied Biosciences, National University of Sciences and Technology, H-12, Islamabad, Pakistan
Tel +92 3355449622
; +92 51-9085-6125
Email [email protected]
Background: Mycobacterium tuberculosis’ rapid detection is still a formidable challenge to have control over the lethal disease. New diagnostic methods such as LED fluorescence microscopy, Genexpert, Interferon Gamma Release Assay (IGRA) are limited on efficacy spectrum owing to their high cost, time-intensive and laborious nature, in addition their low sensitivity hinders their robustness and portability. Electroanalytical methods are now being considered as an excellent alternative, being currently employed for efficient detection of the analytes with the potential of being portable. This report suggests label-free electrochemical detection of Mycobacterium tuberculosis (Mtb) via its marker, insertion sequence (IS6110).
Methods: In this pursuit, graphene oxide-chitosan nanocomposite (GO-CHI), a biocompatible matrix, having a large electroactive area with an overall positively charged surface, is fabricated and characterized. The obtained GO-CHI nanocomposite is then immobilized on the ITO surface to form a positively functionalized electrochemical sensor for the detection of Mtb. DNA probe, specific for the IS6110, was electrostatically anchored on a positively charged electrode surface and the resistance of charge transfer was investigated for the sensitive and specific (complementary vs non-complementary) detection of Mtb by cyclic voltammetry and differential pulse voltammetry techniques.
Results: The cyclic voltammetry was found to be diffusion controlled facilitating the absorption of analyte on the electrode surface. The label-free “genosensor” was found to detect a hybridization efficiency with a limit of detection of 3.4 pM, and correlation coefficient R2=0.99 when analysed over a range of concentrations of DNA from 7.86 pM to 94.3pM. The genosensor was also able to detect target DNA from raw sputum samples of clinical isolates without DNA purification.
Conclusion: This electrochemical genosensor provides high sensitivity and specificity; thus offering a promising platform for clinical diagnosis of TB and other infectious diseases in general.
Keywords: label-free detection, DNA genosensor, Mycobacterium detection, tuberculosis, graphene oxide nanocomposites, GO nanocomposites electrochemical sensing
Introduction
According to the Global WHO TB Report 2020, annually an estimated 10 million people were infected with tuberculosis (TB) in 2019, and out of these, 1.7 million deaths were reported in developing countries.1 It calls for the development of robust, rapid, and sensitive methods for reliable detection of Mycobacterium tuberculosis (Mtb) to diagnose TB at an early stage that may warrant its effectiveness. Current methods for TB diagnosis include LED fluorescence microscopy, chest X-rays, Genexpert, Interferon Gamma Release Assay (IGRA), Antigen Detection Assay, which are costly, time-consuming, laborious, less sensitive, and need highly sophisticated laboratory setups.2 These limitations, along with the need for skilled personnel, hinder the robustness, portability, and accurateness of tests.
To counter these limitations, many new diagnostic tests are being introduced, the majority of which are Polymerase Chain Reactions (PCR) based, which enjoy the benefit of enhanced sensitivity and a short reaction time but are limited by their affordability.3 Although DNA hybridization-based methods provide a successful alternative,4,5 when it comes to the non-invasive detection procedures, however, the electrochemical biosensors are considered ideal candidates owing to their robust nature and have a huge potential to be converted into a point of care (POC) device.6,7 Cells, proteins, and hormone receptors are generally employed for the target ligands/analytes in these biosensors. Rapid and active detection of nucleic acids has been tremendously popular in disease diagnostics and forensic identification.8,9 Electrochemical signal changes based on DNA/analyte hybridization are generally used as a principal basis in various electrochemical biosensors and genosensors.10
DNA hybridization generally results in very weak electrochemical signal changes on conventional metal electrodes; however, they are being currently enhanced using various nanomaterial-based modifiers having numerous electroactive and bioactive sites on the surface available for facile adsorption/desorption of variations during analysis.4,11 Among various nanomaterials, graphene oxide (GO) has gained unstoppable attention due to its excellent conductance in electrochemistry.12 GO is electrochemically active and it can further be functionalized with biopolymers13 like Chitosan (CHI). Chitosan (CHI) obtained by partial deacetylation of chitin is biocompatible and biodegradable, possessing antimicrobial properties. It exhibits a tremendous film-forming ability that makes it a popular choice for immobilization of bioactive molecules on biosensors. It is being utilized as scaffolds for tissue engineering, and as a drug carrier in wound dressings, etc. Lately, biosensors based on chitosan have been reported for measurement of a large variety of analytes from biological, environmental and chemical sources.14 However, the use of CHI-based biosensors to in-vitro measurements is limited because of the degradability of CHI in aqueous medium.15 In this aspect, recent studies have demonstrated the possibility to improve the mechanical properties (both in wet and dry conditions) and the thermal stability of CHI by adding Graphene Oxide (GO) in the CHI matrix.16 This is owing to the crosslinking between amine (–NH2) and hydroxyl (–OH) groups of CHI and the carboxyl (–COOH) group of GO. The CHI-GO substrate can also be made ultra-flexible film, which is helpful for the development of sensors.17 GO displays a negative charge when dispersed in water due to the ionization of hydroxyl groups and carboxylic acids. Whereas CHI bearing –OH and –NH2 in acidic medium is protonated to polycationic material, that facilitates the interactivity linking of polymer chains and GO to form graphene oxide-chitosan (GO-CHI) hybrid nanocomposite.18
Two approaches have been used for monitoring electrochemical biosensors based on the feasibility, sensitivity, and appropriateness of the transduction principle. The first approach is the label-free approach where a signal is generated via analyte-containing intrinsically electroactive species.19 The use of nucleic acid hybridization is an example of utilizing a label-free approach. Receptors for target ligands in these biosensors could range from cells or proteins or hormones to target a DNA probe as an analyte. However, in the labelled approach, sandwich assay (redox label), nucleic acid intercalators, and molecular beacons are used for detection purposes. Though robust, these approaches can be limited by electrode fouling and generation of nonspecific signals creating difficulty in accurate measurements. This limitation is avoided by careful pre-treatment of samples or membrane-coating to avoid false-positive results.
DNA-based electrochemical biosensors work by detecting changes in the electrochemical signals upon DNA hybridization.20 DNA biosensors are minuscule single-stranded DNA (ssDNA) or RNA with roughly 100–200 nucleotides or less and offer greater stability. Owing to their specific and robust hybridization, DNA-based biosensors are being investigated as potential genosensors in various applications.21,22
In the current study, DNA based electrochemical sensor platform has been made for the detection of tuberculosis at an early stage from both sputum and purified DNA samples. DNA probe has been utilized for the detection of insertion element IS6110. IS6110, a mobile genetic element, has been used for detection and molecular epidemiological studies of the M. tuberculosis complex group (M. tuberculosis, M. africanum, M. bovis, M. microti and M. canetti). Because of its high level of replication throughout the genome it is considered a gold standard biomarker for the detection of tuberculosis.23 IS6110, being a 1354-bp repetitive insertion sequence, has an occurrence of 1–20 copies per cell, consequently making it an ideal target for amplification.24 Cyclic voltammetry (CV) and differential pulse voltammetry (DPV) were the prime analytical techniques used to assess the performance of the sensor platform. This study aims to cater to the need for a robust, accurate, and portable TB diagnostic procedure to screen the population and find out missed active TB cases to treat them properly.
Materials and Methods
Synthesis of GO
A published improved method called modified Hummers’ method was used for the preparation of graphene oxide (GO).25 Previously, Hummers’ method (including KMnO4, NaNO3, H2SO4) was most commonly used for preparing graphene oxide.26 Excluding the NaNO3 and increasing the amount of KMnO4, and performing the reaction in a 9:1 mixture of H2SO4/H3PO4 improves the efficiency of the oxidation process. Briefly, 3g of graphite flakes (150 mm, Sigma-Aldrich) were added in a mixture of concentrated sulfuric (360mL of H2SO4, Sigma-Aldrich) and phosphoric acid (40mL of H3PO4, Sigma-Aldrich) (mixing ratio of 9:1) in a total volume of 60mL and was stirred for 4 hours. This was followed by the addition of 180g of KMnO4 (Sigma-Aldrich) resulting in an exothermic reaction (35°C–40°C). The resultant solution was placed on a magnetic stirrer (Velp-Scientifica, Europe) and was heated to 50°C under continuous stirring for 6 hours and subsequently stirred overnight, and then slowly cooled down to room temperature. The oxidation reaction was stopped by the addition of 30mL of hydrogen peroxide (H2O2, 3%,). The resultant mixture was washed several times with deionized (DI) water (200mL), hydrochloric acid (HCL, 30%), and ethanol (C2H5OH, 70%), respectively. This was followed by multiple washing of mixture with equal amounts of DI water and centrifuged at 6000 rpm for 15 minutes to obtain viscous gel which was allowed to dry overnight at 60°C, as shown in Figure 1. This improved Hummers' method provides a greater amount of hydrophilic oxidized graphene material as compared to the original Hummers’ method.27
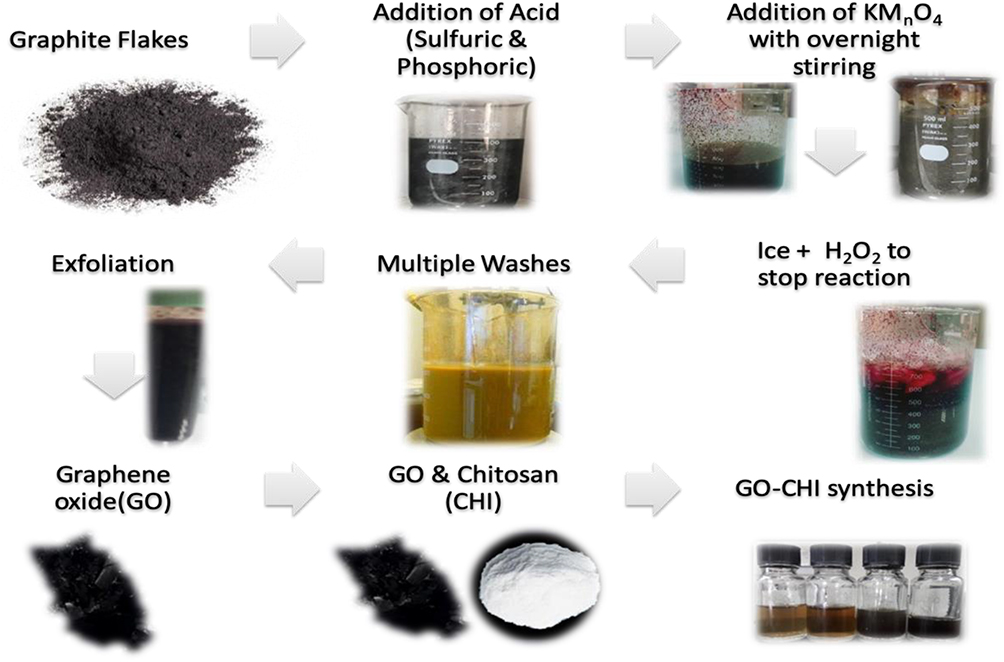 |
Figure 1 Step-wise synthesis of GO by improved Hummer’s method and GO-CHI nanocomposite. |
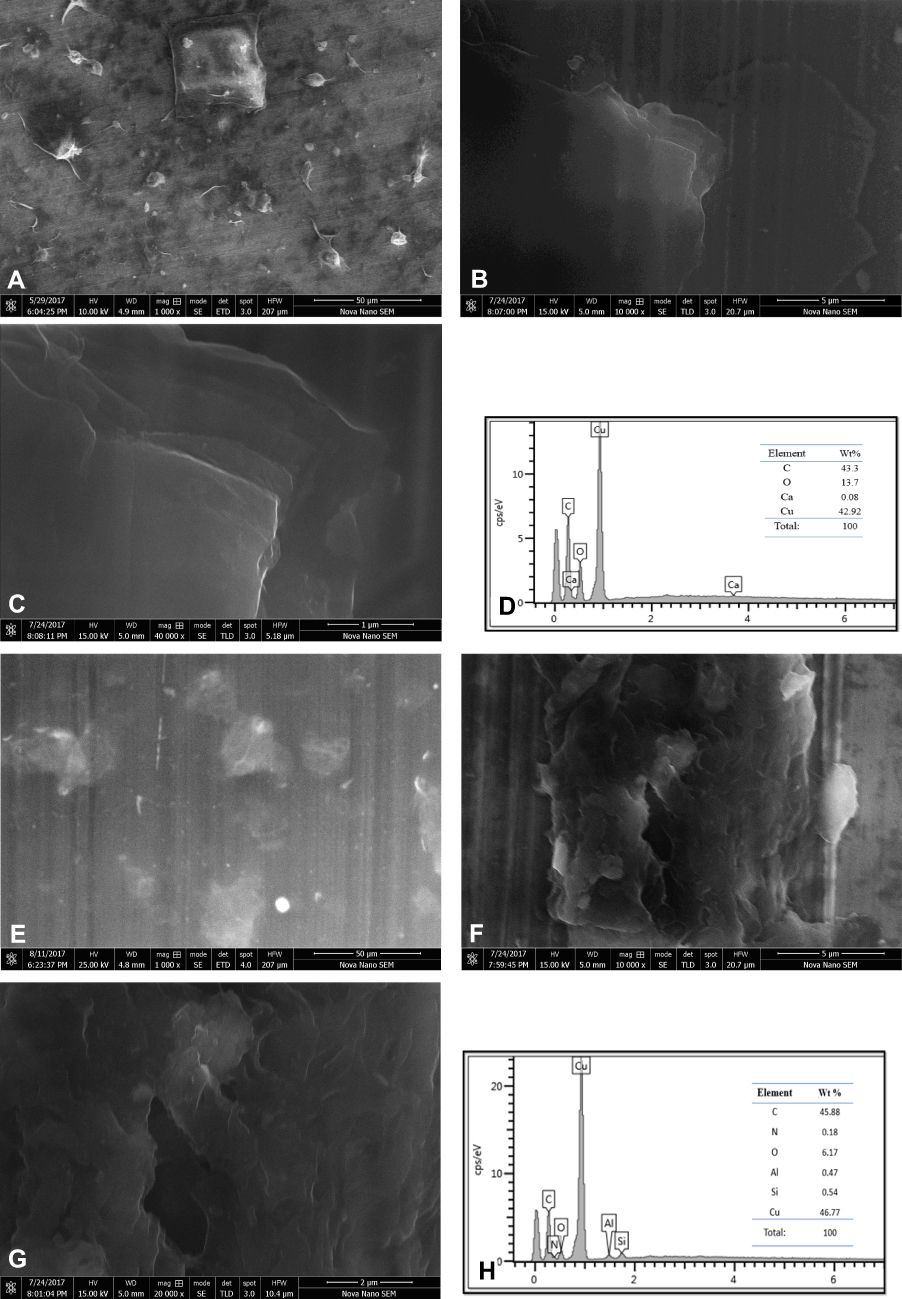 |
Figure 2 Scanning electron microscopy of graphene oxide (GO) at (A) 50μm, (B) 5μm, (C) 1μm (D) EDX spectrum of GO, and graphene oxide and chitosan nanocomposite (GO-CHI) at (E) 50μm, (F) 5μm, (G) 2μm and (H) EDX spectrum of GO-CHI. |
Synthesis of GO-CHI Nanocomposite
To prepare GO-CHI nanocomposite, 0.15g of CHI ((M.W. 200,000, Santa Cruz Biotech, Heidelberg, Germany) was added slowly in 15mL of 1%v/v acetic acid (Phytotechnology labs, Lenexa, USA) and was stirred continuously for 15 minutes. 7 mg of GO was added in 2.5mL of Millipore ultra-pure water (Thermo Fisher Scientific, USA) and sonicated (Cole-Parmer 8890, USA) for 1 minute for complete dispersion. This separately prepared dispersion of GO was gradually added to the previously prepared CHI solution and the resultant solution was vortexed for 35 minutes followed by sonication in a sonicator bath for 3 hours at room temperature to obtain a completely dispersed solution as shown in Figure 1.
Genosensor Fabrication
For the fabrication and assembly of DNA probe bound genosensor for IS6110 sensing, indium tin oxide (ITO) coated glass coverslips were purchased from Sigma-Aldrich (USA), washed with 70% of ethanol (Sigma-Aldrich, USA) and Millipore ultra pure water (Thermo Fisher Scientific, USA), and subsequently blow-dried to remove microfibers or dust particles. ITO slides were functionalized with G0-CHI composite by pouring 100mL of the nanocomposite on the slide surface and were spun at 3000 rpm for 20 seconds on a spin coater to obtain a uniform layer of GO-CHI on the ITO slide surface. It was then allowed to dry at room temperature for 4 hours. To remove contamination, the surface of the sensor (electrode) was washed with 0.1M NaOH (Sigma-Aldrich, USA) followed by its overnight drying in a nitrogen environment.
ssDNA Probe Immobilization
To immobilize DNA probes on the electrode’s surface, amine groups in GO-CHI composite were the first surface exposed by treating GO-CHI coated ITO slide with 40µL of 1% glutaraldehyde (Sigma-Aldrich, USA), 30µL of Phosphate Buffer (0.1 M, pH7) and 0.8 g Bovine Serum Albumin (BSA Sigma-Aldrich, USA) solution for 2 hours. The electrode was subsequently washed with Millipore ultra-pure water (Thermo Fisher Scientific, USA) to remove untreated glutaraldehyde and residues. Then, 30µL of 1.5mM ssDNA probe (Integrated DNA Technologies, USA) having Amino Linker C6 (AmMC6) attached to its sequence 5ʹ-/5AmMC6/ GGT GAG GTC T-3ʹ specific to DNA Mtb insertion sequence IS6110 (Target DNA 5ʹ –AGACCTCACCTATGTGTCGA −3ʹ)5 was poured drop wise and was covalently attached to amine activated electrode (GO-CHI coated ITO) by incubating it for 1 hour at room temperature. The surface of the electrode was then washed multiple times with Millipore ultra-pure type −1 (Thermo Fisher Scientific, USA) water (to remove the remaining unbound ssDNA strands on the electrode surface) and was stored at 4°C for future use.
Target DNA Hybridization
The functionalized ITO slide with assembled DNA probes was checked to sensitively and specifically detect Mtb. Purified DNA samples (n=4) of Mtb taken from a bank of raw sputum samples (n=4) from TB patients in the BSL-3 clinical laboratory of Pakistan Institutes of Medical Sciences (PIMS) Islamabad, after taking their consent and ethical approval, were used to assess hybridization efficacy and hence detection limits of the developed DNA genosensor (ssDNA probe to GO-CHI/ITO electrode). Non-complementary DNA samples of Methicillin-resistant Staphylococcus aureus (MRSA) were taken from BSL-2 Microbiology Laboratory at National University of Science and Technology (NUST), Islamabad. Raw sputum samples were also kindly provided by the TB center at PIMS Islamabad after approval of ethical compliance for research project by Institutional Review Board (IRB) at NUST. Raw sputum samples were decontaminated at PIMS BSL-3 laboratory using 1% N-acetyl-l-cysteine–sodium hydroxide (NALC-NaOH). Following 25 minutes of incubation, the samples were centrifuged, and the pellet was washed with Tris HCL. DNA was then purified using the GeneJET™ Gel Extraction Kit and was stored at −20°C. DNA in the purified DNA samples was serially diluted using 10-fold serial dilution method, and concentration was measured using the Nanodrop Spectrophotometer (Thermo Scientific™ NanoDrop 2000). The concentrations of the DNA samples recorded were 7.86 pM, 15.7 pM, 47.15pM, 94.3 pM.
Denaturation of genomic DNA of purified and raw sputum samples was done by heating at 95 °C using a water bath (Thermo Scientific, USA) for 5 minutes and immediately chilled in ice to obtain a denatured ssDNA.
Purified DNA samples and BSA (0.8g) were dispersed in phosphate buffer saline (PBS, pH7). For each electrochemical experiment, 10 μL of sample, from both TB and non-complementary DNA samples, was poured drop wise on to the surface of electrode and incubated for 45 mins to allow maximum hybridization. It was subsequently washed with Millipore ultra pure water to remove unbound DNA and electrochemical scanning was performed on probe functionalized ITO slides after being treated with sample analytes.
Characterization of GO-CHI Coated ITO DNA Genosensor
Field Emission Scanning Electron Microscopy (FESEM)
Vacuum dried samples of GO and GO-CHI were aluminum sputtered and were characterized by FESEM (Nova NanoSEM 650, EU) and scanning was performed at 1500kV at a magnification of 40,000 X. Energy Dispersive X-Ray Spectroscopy (EDS) of the sample was done at 20 eV, with a probe current of 50 nA, at a take-off angle of 350.
Fourier-Transform Infrared Spectroscopy (FTIR)
FTIR analysis was performed using a PerkinElmer Spectrum-100 FTIR spectrometer and the sample was scanned between 400–4000 cm−1. Pallets for both GO and GO-CHI were prepared using potassium bromide (KBr) as a foundation using a manual hydraulic press (Specac, USA). The spectra obtained were further analysed through eFTIR (Operant LLC, USA) for peak labelling.
X-Ray Diffraction (XRD)
To assess the crystalline structure of graphene oxide, X-ray diffraction (XRD) was performed on an STOE Powder Diffractometer θ-θ (STOE Inc. Germany) with an operating voltage of 40kV and current of 40mA, using a scanning rate of 0.5 min-1. The samples were completely dried at 60°C for 3 hours before XRD analysis to deplete the sample of any possible moisture. The interplanar distance “d” value was calculated using the following Bragg’s law:

Zeta Potential
The surface charge of samples was measured to assess the zeta potential shift between GO and GO-CHI nanocomposite, on a Malvern Zetasizer Ver. 7.10 (Malvern Instruments, UK) at room temperature (25°C). A clear disposable zeta cell was employed for loading samples in the zeta sizer.
Electrochemical Characterization of DNA Genosensor
Electrochemical characterization via CV and DPV was performed using a standard three-electrode configuration glass cell on a computer-controlled electrochemical workstation (Gamry potentiostat, Reference 600™). GO-CHI coated ITO electrode was used as a working electrode (0.5 cm2), platinum wire as an auxiliary (counter) electrode and saturated calomel electrode (SCE) functioned as a reference electrode. 3mM ferricyanide [Fe(CN)6]3−containing 0.1 M KCL was used as electrolytes during CV investigations and, for differential pulse voltammetry, phosphate buffer saline (50mM) was used as a supporting electrolyte. CV was performed at a scan rate of 100 mV s−1. The potential range for both experiments was taken between −0.6 to 0.6 V vs SCE. Before use, all glassware and electrochemical cells were well cleaned by boiling in a 1:3 solution of sulfuric acid and nitric acid followed by boiling in Millipore ultra-pure water (Thermo Fisher Scientific, USA). They were rinsed many times with Millipore water, methanol, ethanol, and finally with acetone and ultimately dried by keeping inside an oven at 100°C for 1 hour. All the solutions involving electrochemical studies were freshly prepared using ultra-pure water.
Comparative Analysis of TB Samples via Polymerase Chain Reaction (PCR)
Purified DNA samples were amplified using Bio-Rad T100tm thermal cycler. Forward primers (5ʹ-AGAAGGCGTACTCGACCTGA-3ʹ) and reverse primers (5ʹ-GATCGTCTCGGCTAGTGCAT-3ʹ) were used to amplify the insertion sequence IS6110 of Mtb. The primer sequences against IS6110 were adapted from Liu et al.5 Purified DNA was denatured initially at 95°C for 4 min and at 94°C for 30 sec followed by 35 cycles, then 56°C for 45 sec, 72°C for 45 sec, and a final 7 min extension at 72°C. The obtained PCR product was run on 2% agarose gel (Sigma-Aldrich, USA), stained with ethidium bromide (Sigma-Aldrich, USA) and visualized through Gel LOGIC 2200 PRO imaging system.
Results and Discussion
Physicochemical and Structure Analysis of GO and GO-CHI Composite
Scanning electron micrograph (Figure 2) shows different flakes morphology, which reflects the variations in diffusion rates of oxidants. The difference in the diffusion rates speaks for the variation in the extent of oxidation. The size and crystalline structure of flakes play a decisive role in the formation of Pristine Graphene Oxide (PGO) where more disordered flakes of small size show significantly higher oxidation rates.28 Figure 2A–C shows the scan region (50µm to 1µm) of exfoliated graphene oxide prepared from oxidation of graphene and shows properly interspersed layers of carbon with oxygen molecules forming well-defined, interlinked three-dimensional graphene sheets.
In GO-CHI nanocomposite, amide linkage (from Carboxyl-amine groups to form C-N bond) resulted in proper dispersion of exfoliated GO sheets in chitosan matrix and hence the underneath SEM micrograph (Figure 2E–G) reveals the appearance of embedded structures showing unidirectional dispersion of GO nanosheets in clouded chitosan matrix.
EDX spectra of graphene oxide (Figure 2D) and its composite (Figure 2H) show that both graphene oxide and nanocomposite formation successfully possess oxygen species. The greater concentration of oxygen in the EDX spectrum of graphene oxide is due to variety of functional groups such as –OH, –COOH, and –CHO, in contrast to GO-CHI nanocomposite, where the functional groups of GO were utilized in the formation of amide (C-N), carbamate esters (CHN) and glycosidic linkage between amine (–NH2) and hydroxyl (–OH) groups of CHI and the carboxyl (–COOH) group of GO.
FTIR was performed to assess the abundance of functional groups present in CHI, GO, and GO-CHI. The appearance of peaks at wavenumbers 1739 cm−1 and 3325 cm−1 confirmed the presence of graphene oxide. The peak at 1739 cm−1 shows the presence of carbonyl moieties (C=O), revealing successful synthesis of graphene oxide.29 The broad peak at 3325 cm−1 shows water absorption by GO as shown by the O-H stretching of water molecules. Characteristic chitosan peaks were seen at 1030 cm−1, 1602 cm−1, 3450 cm−1. Peaks at 1030 cm−1 and 1602 cm−1 showed the presence of glycosidic bond (C-O) and C=O (NHCO), respectively. Graphene oxide-chitosan nanocomposite (GO-CHI) showed characteristic peaks at 1035 cm−1, 1648 cm−1, and 3325 cm-1. The peak at 3325 cm−1 is ascribed to the stretching of the amine group from chitosan and hydroxyl (OH) in GO that was responsible for the formation of nanocomposite.15 The conserved peak of glycosidic bond and C=O in the case of NHCO is stretched by vibrations and N-H of NH2 bends. For graphene oxide, peak shift from 1739 cm−1 to 1648 cm−1 in the nanocomposite, whereas peak shift from 1624 cm−1 to 1648 cm−1 in case of chitosan reveals the interaction of GO and CHI resulting in the formation of nanocomposite, as shown in Figure 3.
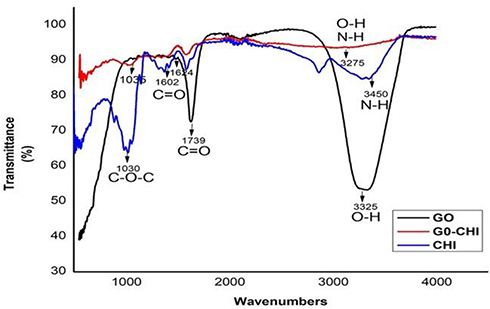 |
Figure 3 FTIR analysis of graphene oxide (GO), chitosan (CHI) and graphene oxide-chitosan nanocomposite (GO-CHI). |
FTIR spectrum of GO-CHI (formed by mixing GO and chitosan) showed a shift around 1602 cm−1 that indicates the formation of amides (C-N) and carbamate esters (CHN). Peaks around 1035 cm−1 reflect the presence of a C-O-C bond in the glycosidic linkage in chitosan.
For confirmation of the crystalline structure of graphene oxide, powder X-Ray Diffraction (XRD) was performed and XRD patterns of graphene oxide were compared with that of graphite flakes and are presented in Figure 4.
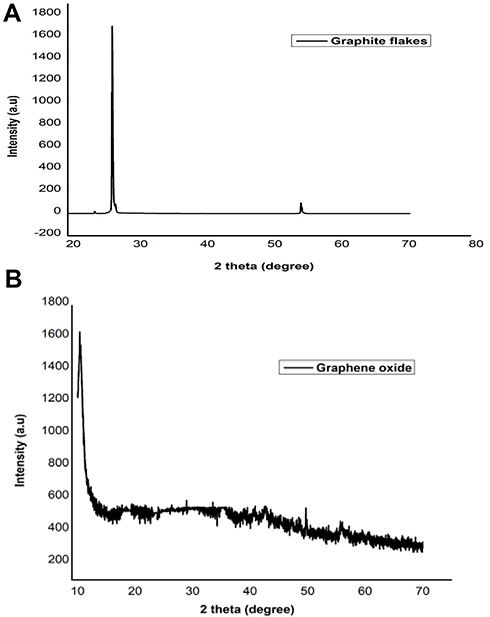 |
Figure 4 XRD of (A) graphite flakes. (B) Graphene oxide (GO). |
The diffraction angle for graphite at 2q was found to be at 26o, revealing a highly organized and layered structure of graphite (Figure 4A) and interlayer spacing “d” was found to be 0.34 nm using Bragg’s equation.
GO obtained by oxidation graphite flakes showed a diffraction angle of 10.2° with the disappearance of peak at 26o in Figure 4B, depicting proper oxidation and exfoliation, and an increase in the interlayer spacing is found to be at 0.82nm, which is around 3 times higher than that of graphite (0.34 nm).
XRD pattern showed a sharp peak of 10.2o at 2q showing that signal originated from Moiré patterns in graphene bilayer. It should be noted that GO is consistent on two randomly distributed domains. Oxidized GO does not show signals owing to irregular C atoms because of sporadic bond formation as the intact graphene domains are the prime site of signal production.30 In the last step, PGO was converted into GO by exfoliating PGO into single-layered sheets. This is achieved by hydrolysing sulfates which act as protective clusters.
To evaluate the surface charge of GO-CHI nanocomposites, zeta potential measurements were made. The surface charge on graphene oxide was found to be −20.2 mV, depicting a negative charge owing to the presence of abundant carboxylic groups. Upon addition of CHI, the resultant nanocomposite (GO-CHI) showed a shift in potential from −20.2mV to +34.9mV. This switch in surface charge occurred due to the addition of chitosan having abundant positively charged amino (–NH2+) groups. The positive charge at the surface of GO-CHI nanocomposite played a significant role in enhanced adherence of negatively charged DNA on the ITO electrode surface.
Electrochemical Characterization of DNA Genosensor
Stability of Functionalized Working Electrode (GO-CHI)
GO-CHI coated ITO electrodes were used as working electrodes and were initially characterized via cyclic voltammetry investigations in 3mM Potassium ferricyanide K3[Fe(CN)6]3− containing 0.1M KCL as an electrolyte solution. The obtained voltammogram showed prominent increase in peak current when GO-CHI nanocomposite was coated on the surface of ITO due to smooth electron transmission as compared to that of bare ITO. An increase in peak current and peak potential in the case of GO-CHI reflected better electron mobility owing to the high surface area resulting in enhanced conductivity.
Redox peak currents (Ipa, Ipc) at respective potentials were recorded as shown in Figure 5.
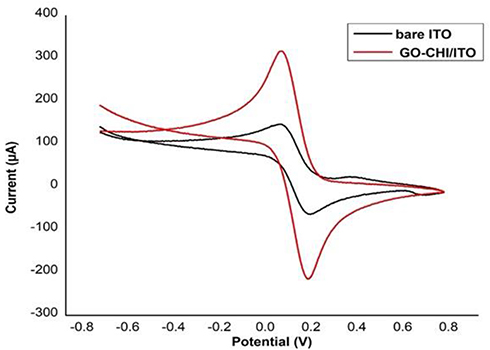 |
Figure 5 Cyclic voltammogram (CV) of bare ITO and GO-CHI/ITO electrodes at 100mV1/2. |
The anodic peak current (Ipa) for bare ITO was −51.43 μA, while that of ITO coated with GO-CHI was −179.96 μA, resulting in roughly ~3.5-fold higher conductance. Similarly, bare ITO showed cathodic peak current (IPC) of 37.66 μA, and this was increased to 167.88 μA (~ 4-fold increase) in the case of ITO coated with GO-CHI (Table 1).
 |
Table 1 Redox Peak Currents and Peak Potentials of Bare ITO and GO-CHI/ITOs |
Peak breath (Δ Ep) was calculated to assess electron transfer during the chemical process and was found to be greater in GO-CHI coated ITO (0.12) as compared to bare ITO (0.06) confirming the irreversibility of the reaction. For a reversible electron transfer, Δ Ep must be equal to 0.059V and Ipa/Ipc must be equal to 1. Here, Δ Ep for ITO coated with GO-CHI (0.12) was greater than 0.0059V and Ipa/Ipc (1.07) was greater than 1.31
For an in-depth investigation of the kinetics of the electron transfer process on the surface of GO-CHI electrode, cyclic voltammetry of GO-CHI coated ITO electrode was performed again at different scan rates (20–120 mV), as shown in Figure 6A. The increase in Ipc and Ipa was observed as the scan rate was increased from 20 (88.3μA, −84.42 μA) to 120 mV (239.48 μA,- 272.18 μA). The process was found to be diffusion controlled and quasi reversible when Ipc and Ipa were plotted against the square root of scan rate, exhibiting linear curve as shown in Figure 6B showing the stability of the sensor, ie GO-CHI transduction film coated on ITO electrode.
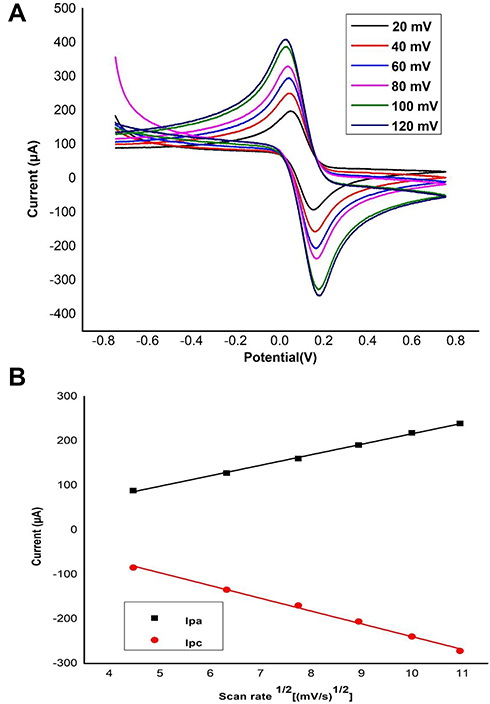 |
Figure 6 (A) CV of GO-CHI/ITO electrodes at various scan rates from 20 mV s−1 to 120 mV s−1 in 3mM K3[Fe(CN)6]3− and 0.1 M KCl. (B) Anodic and cathodic peak current at different scan rates. |
The diffusion-controlled reaction is considered to have a very fast charge transfer reaction and is kinetically favourable. This is attributed to the high electroactive surface area of graphene oxide and chitosan film.
To demonstrate that GO-CHI electrode could improve surface area of biosensor CV of GO-CHI/ITO electrodes at various scan rates from 20 mV s-1 to 120 mV s-1 in 3mM K3 [Fe(CN)6]3− and 0.1 M KCl at different scan rates, the electroactive surface area of both bare and GO-CHI modified electrode was calculated by Randle Sevcik equation:32
Ip = 2.69x10⁵n3/2AD1/2V1/2 C
where Ip corresponds to the peak current, D is the diffusion coefficient of analyte which is 4.033×10⁻⁶ cm2 s−1,33 A is the area of the working electrode (0.48cm2), C is the bulk concentration in mol cm−3 which is for 3mM K3[Fe(CN)6]3− and 0.1 M KCl, n is the number of electrons, that is, 1 and V is the scan rate in V s−1. The electroactive area for the bare electrode is 0.48 cm2, and that of GO-CHI modified electrode has increased to 6.04 cm.2.
GO-CHI modified ITO electrode when stored under 4 °C, showed stable conductance up to 25 days with minimal conduction loss (data not shown). GO prevents the degradation of CHI, and GO-CHI composite is reported to make a stable electrostatic bond which retains its thin film characteristic while also facilitating the electron mobility.34
DNA Genosensor: SsDNA Probe Immobilization and Its Hybridization with Target DNA on Functionalized Working Electrode (GO-CHI)
CV and DPV were carried out to observe the change in current values upon DNA probe immobilization on GO-CHI/ITO working electrode, and its subsequent hybridization to purified target DNA samples. A definite decrease in the cathodic and anodic peak current (154.31 μA, −157.7 μA) was observed when capture DNA probe (ssDNA of IS6110) was immobilized on GO-CHI/ITO electrode in 3 mM K3[Fe(CN)6]3− and 0.1M KCL, as shown in Figure 7. A further decrease in the peak current (105.16 μA, −135.56 μA) was observed when 10μL of purified target DNA (25pM/μL) was allowed to bind and hybridize to the ssDNA probe. This is due to the surface coverage of electrode with the analyte that may be blocking the active sites of modified GO-CHI/ITO, hence hindering the charge transfer.
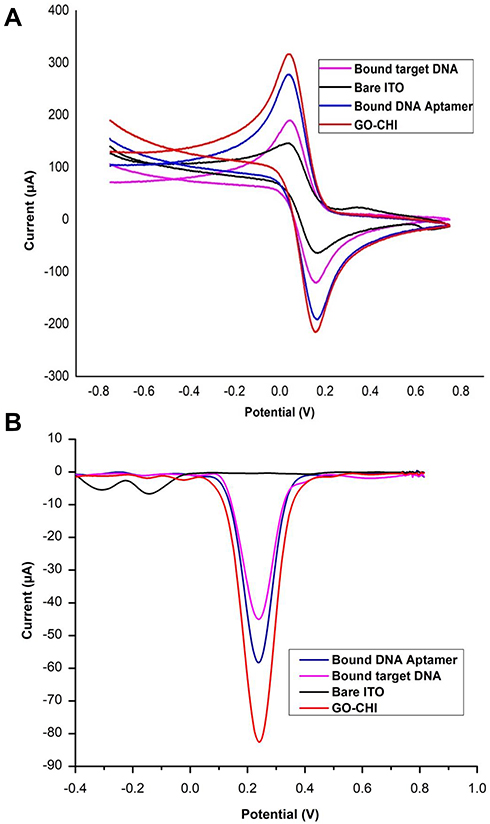 |
Figure 7 (A) CV analysis, (B) DPV of bare ITO, GO-CHI on ITO, bound ssDNA probe on GO-CHI-ITO and target DNA (25pM/μL) to ssDNA probe attached GO-CHI-ITO, all in 3 mM K3 [Fe(CN)6]3− 0.1 M KCl at the scan rate of 100 mV s−1. |
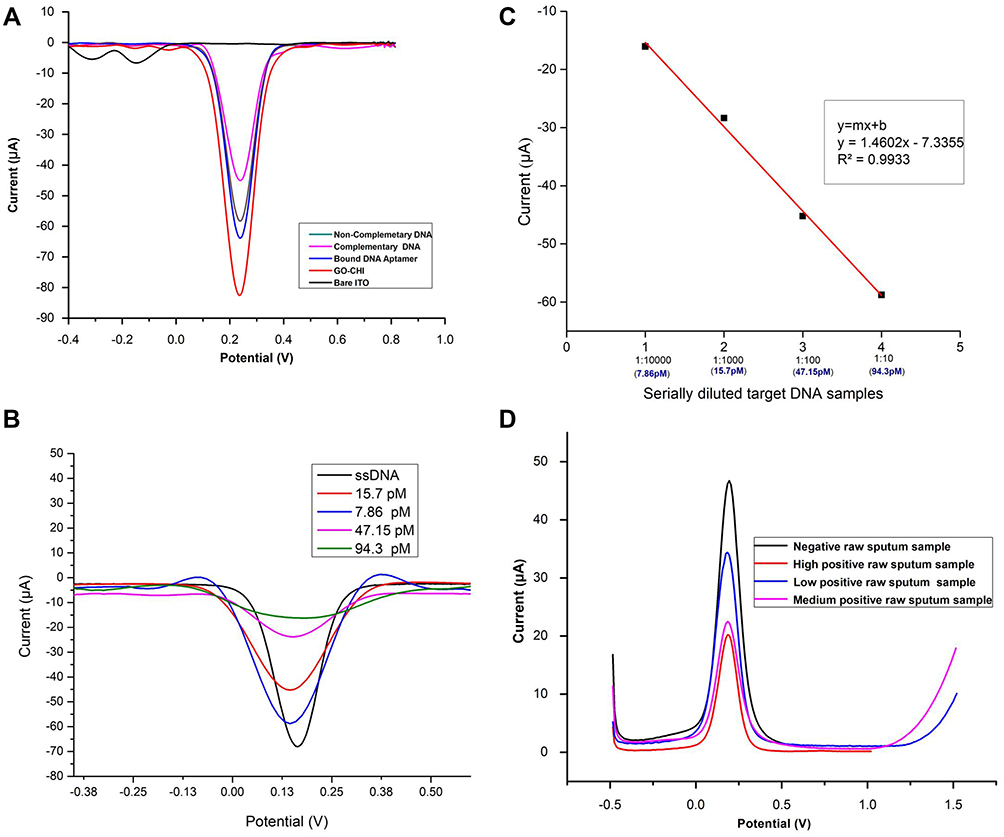 |
Figure 8 (A) Specificity analysis of biosensor via DPV for targeted analyte. (B) Sensitivity analysis of biosensor via DPV. (C) The calibration curve of serially diluted target DNA of different concentrations based on DPV results. (D) Raw sputum sample analysis of biosensor via DPV. |
CV and DPV voltammogram revealed insights into the sensitivity and specificity of biosensors, where selective hybridization of only complementary strands (dsDNA) showed an increase in resistance of charge transfer, as compared to nonspecific stand, where a very small increase in charge transfer resistance was observed as specified by peak current. The reduction in current when hybridized with complementary target is 30% in contrast to non-specific targets that showed just 9% decrease in current.
The slight decrease in peak current of DNA capture probe (ssDNA) bound GO-CHI was due to the remaining glutaraldehyde (after washing) precedingly used for cross-linking the ssDNA to the amino groups of CHI in GO-CHI working electrode. The target DNA analyte when incubated with ssDNA probe was electrochemically characterized, and the decrease in the current was seen due to formation of dsDNA. The oligonucleotides of target DNA were successfully hybridized to the oligonucleotides of the capture probe. Hence, the absence of functional groups (free oligonucleotides) prevented the ease of flow of electrons which increased the resistance in current flow. A highly selective and specific strand from DNA did not leave any free groups and the charge was further decreased as depicted in the DPV voltammogram.
The treated ssDNA probe functionalized GO-CHI electrode with target DNA was reused by simple heat regeneration method in aqueous solution that removed the bound target DNA by heat denaturing. The hybridized DNA form also33 supported the full regeneration of GO-CHI composite films by heat removal of bound probe molecules.
Sensitivity and Specificity Analysis of DNA Genosensor
After having satisfactory results for Mtb detection over positively charged functionalized GO-CHI/ITO electrode, a further experiment was performed to check the sensitivity and specificity of the DNA genosensor in neutral PBS (pH≈7) at 25°C. Being a more sensitive electroanalytical technique, differential pulse voltammetry was performed for further analysis.
Purified TB DNA samples: The DNA genosensor’s specificity was assessed by alternatively exposing the surface of the electrode to 10μL (25pM/μL) of complementary and 10μL (50nM/ μL) of non-complementary strands (of MRSA) of DNA. A significant change with a 30% decrease in peak current was observed upon binding of ssDNA modified electrode with complementary DNA strand, relative to non-complementary strand binding that shows just 9% decrease in peak current of ssDNA modified electrode, and was not much noticeable, as shown in Figure 8A. Noticeable decrease in the peak current of complementary strand was due to conformation change from ssDNA to dsDNA upon hybridization, as evident in Figure 8A.
Furthermore, a 10μL DNA sample with 94.3pM/μL was serially diluted using a 10-fold serial dilution method, and varying concentrations (7.86 pM, 15.7 pM, 47.15 pM, 94.3pM) of DNA samples were recorded using Nano drop spectrophotometer to assess the saturation points and sensitivity, as shown in Figure 8B. It was observed that 94.3 pM was the saturation point achieved as the lowest current and no prominent peak height was seen at this concentration, and was observed as the maximum analyte concentration. A significant increase in the peak current was observed on decreasing the concentration from 94.3 pM onwards to 47.15 pM and 15.7 pM. The highest peak current (of all concentrations) was observed at 7.86 pM, indicating the lowest concentration of target DNA detected, as shown in Figure 8B. From DPV analysis, a calibration plot was made against the current produced by four serially diluted (10μL each) samples of different concentrations (of target DNA), and the correlation coefficient was calculated to be R2=0.9933, as shown in Figure 8C.
The limit of detection (LOD) of biosensor was calculated by the formula:

Whereas σ indicates the standard deviation and m represents the the slope. Hence, the LOD was calculated to be 3.40 pM, indicating it to be sensitive to the extremely low amount of target DNA in the sample. When this proposed genosensor was compared with recently reported nanomaterial-DNA electrochemical biosensors for Mtb detection35–38 (Table 2), the synthesised DNA genosensor in this study demonstrated lowest LOD and high specificity. Thus, the comparison further elaborates that this method can be applied successfully for Mtb detection.
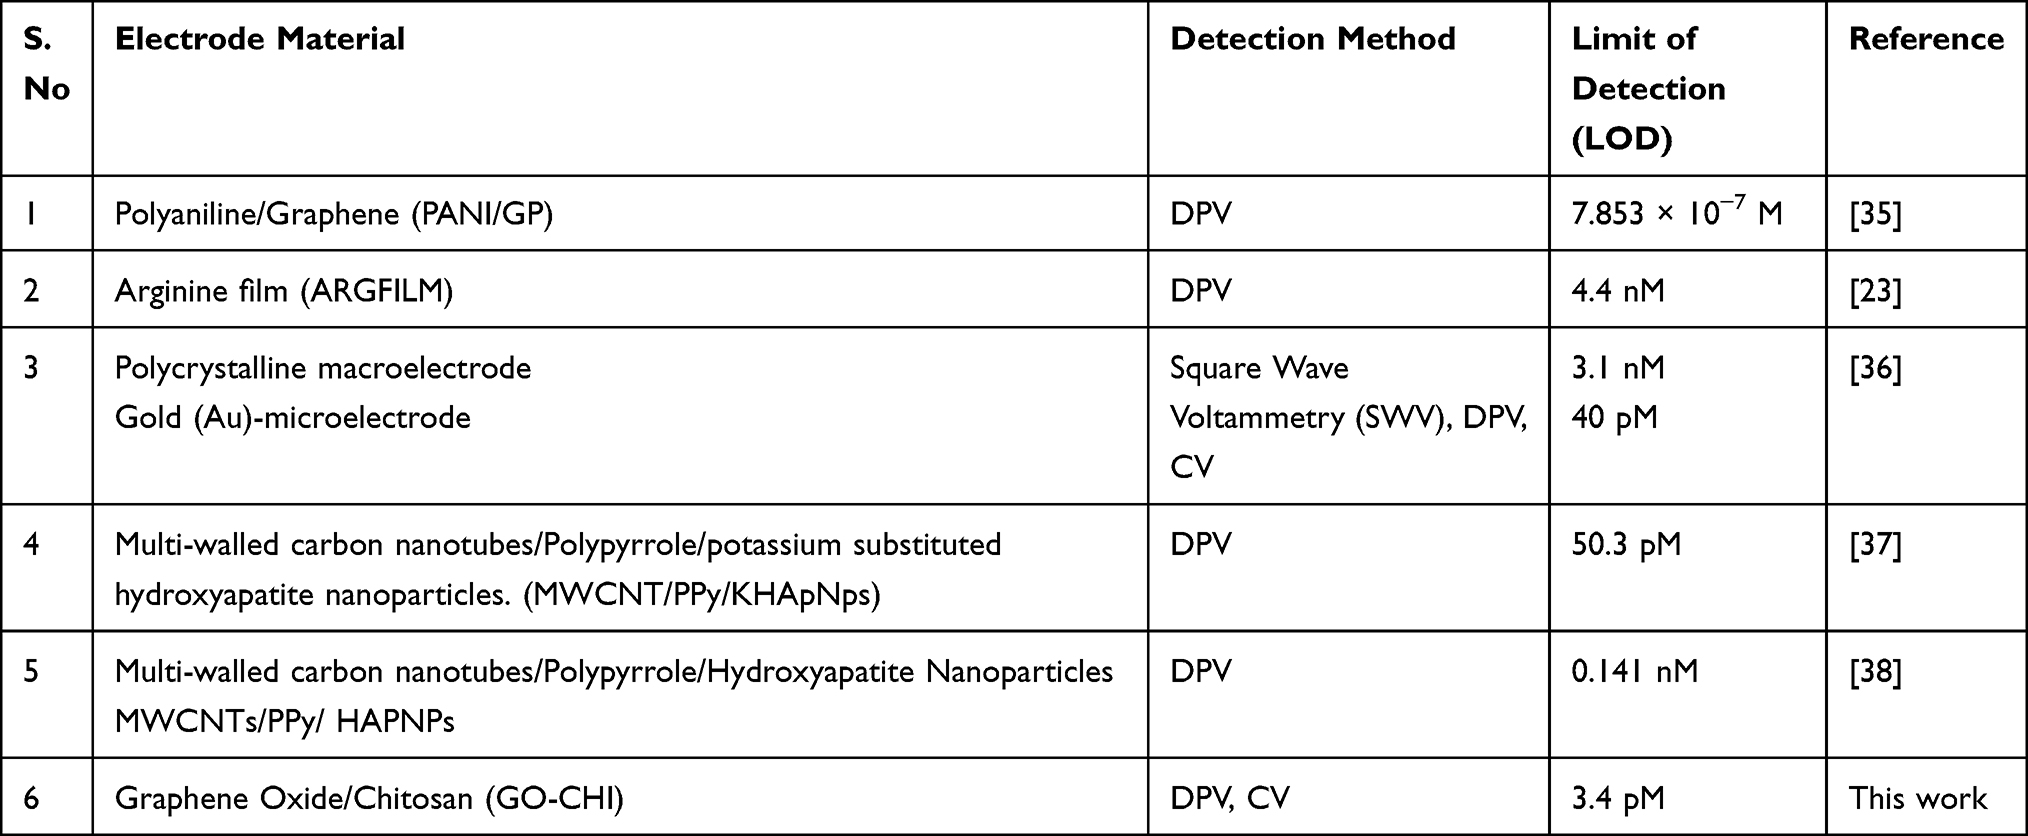 |
Table 2 Comparison of Reported Nanoparticle Based Electrochemical DNA Biosensors for Detection of Mtb with the Proposed Work |
Raw sputum TB samples: Selectivity of the synthesized ssDNA biosensor (19 nucleotides) was tested using DPV against the fresh raw sputum samples without using any DNA purification kit to analyse the sensor performance with raw biological samples. Three disinfected samples were decontaminated and disinfected as mentioned in Target DNA Hybridization. The raw samples were already tested with Genexpert installed at the TB center and were categorized as “Medium positive TB sample” and “Highly positive TB sample”. After disinfection, the samples were labeled as medium and high as per Genexpert results and were analysed with the fabricated DNA genosensor by recording DPV after 45 minutes of incubation with sample (unlike 2 hours wait in case of Genexpert), as shown in Figure 8D. Significant peak reduction (amount of current produced) was observed in all three samples, showing the detection performance of the genosensor with raw biological samples. Also, there was a significant difference in the peak reductions produced by highly positive and medium positive samples, thus not only supporting and giving comparable sensitivity as Genexpert but also showing that the fabricated DNA genosensor could distinguish among the pathogenic strength of samples.
DNA samples were extracted and purified using a GeneJET™ Gel Extraction Kit and the PCR product obtained as a result was run on gel electrophoresis. The four tuberculosis types when run in duplicate gave the product a correct size (i-e 157bp) of IS6110, as was also confirmed via Next Generation Sequencing (NSG) by Macrogen Korea whereas no product was seen in the negative samples. This confirmed that the biosensor sensitively and specifically is associated with the presence of IS6110 in the sample (Figure 9).
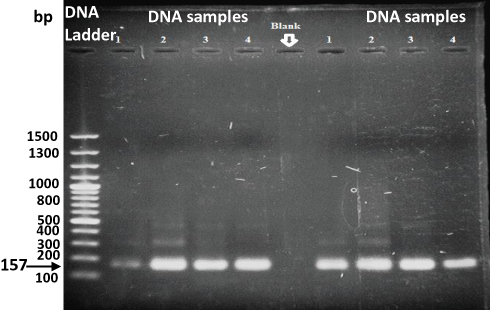 |
Figure 9 Gel electrophoresis of four Mtb DNA samples used in the study run in duplicate, confirming the presence of 1S6110. |
Conclusion
In the current study, DNA genosensor was fabricated using ITO slides as electrode base coated with GO-CHI nanocomposite for the rapid detection of tuberculosis. The nanocomposite was prepared by mixing freshly prepared graphene oxide from graphite flakes and chitosan. This graphene oxide-chitosan nanocomposite (GO-CHI) was uniformly coated on the ITO surface to increase conductivity and to give the electrode surface an overall positive charge for the ssDNA probe to bind and immobilize effectively. DNA genosensor showed specificity to distinguish between non-complementary DNA of MRSA and complementary DNA (IS6110) of Mycobacterium tuberculosis. The analytical performance of DNA genosensor was studied using different concentrations of target DNA, the square of the linear correlation coefficient was 0.99, and a detection limit was found to be 3.40 pM. This limit of detection was found to be lowest among the recently reported electrochemical biosensors for Mtb detection, demonstrating the great sensitivity of biosensor (Table 2). The obtained results also suggested that the GO-CHI based electrochemical DNA genosensor could distinguish among the pathogenic strengths of raw sputum samples. Hence, it clearly indicates that GO-CHI based electrochemical biosensor can be regarded as a successful candidate for tuberculosis point-of-care medical diagnosis.
Acknowledgments
We are thankful for the kind technical support and facilitation provided by the Pakistan Institute of Medical Sciences (PIMS) Hospital for providing us with TB samples and Genexpert facility. We further extend our thanks to the School of Chemical and Materials Engineering (SCME)-NUST for FTIR, XRD, and SEM facilitation.
Author Contributions
All authors contributed to data analysis, drafting or revising the article, gave final approval of the version to be published, agreed to the submitted journal, and agree to be accountable for all aspects of the work.
Disclosure
Dr Shah Rukh Abbas reports a Utility Patent Application No. 175/2019 pending; not licensed yet. The authors declare no other potential conflicts of interest for this work.
References
1. Chakaya J, Khan M, Ntoumi F, et al. Global tuberculosis report 2020–Reflections on the global TB burden, treatment and prevention efforts. Int J Infect Dis. 2021. doi:10.1016/j.ijid.2021.02.107
2. Cave MD, Eisenach KD, McDermott PF, et al. IS6110: conservation of sequence in the Mycobacterium tuberculosis complex and its utilization in DNA fingerprinting. Mol Cell Probes. 1991;5(1):73–80. doi:10.1016/0890-8508(91)90040-Q
3. Dinnes J, Deeks J, Kunst H, et al. A systematic review of rapid diagnostic tests for the detection of tuberculosis infection. Health Technol Assess. 2007;11(3):1–196.
4. Miodek A, Mejri N, Gomgnimbou M, et al. E-DNA sensor of Mycobacterium tuberculosis based on electrochemical assembly of nanomaterials (MWCNTs/PPy/PAMAM). Anal Chem. 2015;87(18):9257–9264. doi:10.1021/acs.analchem.5b01761
5. Liu C, Jiang D, Xiang G, et al. An electrochemical DNA biosensor for the detection of Mycobacterium tuberculosis, based on signal amplification of graphene and a gold nanoparticle–polyaniline nanocomposite. Analyst. 2014;139(21):5460–5465. doi:10.1039/C4AN00976B
6. Cheon SA, Cho HH, Kim J, et al. Recent tuberculosis diagnosis toward the end TB strategy. J Microbiol Methods. 2016;123:51–61. doi:10.1016/j.mimet.2016.02.007
7. Zribi B, Roy E, Pallandre A, et al. A microfluidic electrochemical biosensor based on multiwall carbon nanotube/ferrocene for genomic DNA detection of Mycobacterium tuberculosis in clinical isolates. Biomicrofluidics. 2016;10(1):014115. doi:10.1063/1.4940887
8. Paleček E, Fojta M, Tomschik M, et al. Electrochemical biosensors for DNA hybridization and DNA damage. Biosens Bioelectron. 1998;13(6):621–628. doi:10.1016/S0956-5663(98)00017-7
9. Srivastava SK, Van Rijn CJ, Jongsma MA. Biosensor-based detection of tuberculosis. RSC Adv. 2016;6(22):17759–17771. doi:10.1039/C5RA15269K
10. Arya SK, Zhurauski P, Jolly P, et al. Capacitive aptasensor based on interdigitated electrode for breast cancer detection in undiluted human serum. Biosens Bioelectron. 2018;102:106–112. doi:10.1016/j.bios.2017.11.013
11. Chien JC, Mage PL, Soh HT et al. An aptamer-based electrochemical-sensing implant for continuous therapeutic-drug monitoring in vivo. In
12. Pumera M, Ambrosi A, Bonanni A, et al. Graphene for electrochemical sensing and biosensing. Trends Anal Chem. 2010;29(9):954–965. doi:10.1016/j.trac.2010.05.011
13. Nag A, Mitra A, Sc M, et al. Graphene and its sensor-based applications: a review. Sens Actuators a Phys. 2018;270:177–194.
14. Ragavan K, Ahmed SR, Weng X, et al. Chitosan as a peroxidase mimic: paper based sensor for the detection of hydrogen peroxide. Sens Actuators B Chem. 2018;272:8–13. doi:10.1016/j.snb.2018.05.142
15. Maurya A, Kant S, Nag VL, et al. Detection of 123 bp fragment of insertion element IS6110 Mycobacterium tuberculosis for diagnosis of extrapulmonary tuberculosis. Indian J Med Microbiol. 2012;30(2):182–186. doi:10.4103/0255-0857.96688
16. He L, Wang H, Xia G, et al. Chitosan/graphene oxide nanocomposite films with enhanced interfacial interaction and their electrochemical applications. Appl Surf Sci. 2014;314:510–515. doi:10.1016/j.apsusc.2014.07.033
17. Neethirajan S. Recent advances in wearable sensors for animal health management. Sens Biosensing Res. 2017;12:15–29.
18. Terzopoulou Z, Kyzas GZ, Bikiaris DN. Recent advances in nanocomposite materials of graphene derivatives with polysaccharides. Materials. 2015;8(2):652–683.
19. Park JY, Park SM. DNA hybridization sensors based on electrochemical impedance spectroscopy as a detection tool. Sensors. 2009;9(12):9513–9532.
20. Stoltenburg R, Reinemann C, Strehlitz B. SELEX—a (r) evolutionary method to generate high-affinity nucleic acid ligands. Biomol Eng. 2007;24(4):381–403.
21. Erdem A, Eksin E, Muti M, et al. Chitosan–graphene oxide based aptasensor for the impedimetric detection of lysozyme. Colloids Surf B Biointerfaces. 2014;115:205–211.
22. Li Y, Ran G, Lu G, et al. Highly sensitive label-free electrochemical aptasensor based on screen-printed electrode for detection of cadmium (II) ions. J Electrochem Soc. 2019;166(6):B449.
23. Eloi P, Nascimento GA, Córdula C, et al. Toward a point-of-care diagnostic for specific detection of Mycobacterium tuberculosis from sputum samples. Tuberculosis. 2020;121:101919.
24. Chu ZJ, Xiao SJ, Liu YH, et al. Rapid and sensitive detection of the IS6110 gene sequences of Mycobacterium tuberculosis based on hybridization chain reaction and reusable magnetic particles. Sens Actuators B Chem. 2019;282:904–909.
25. Marcano DC, Kosynkin DV, Berlin JM, et al. Improved synthesis of graphene oxide. ACS Nano. 2010;4(8):4806–4814.
26. Hummers WS
27. Chen J, Yao B, Li C, et al. An improved Hummers method for eco-friendly synthesis of graphene oxide. Carbon. 2013;64:225–229.
28. Dimiev AM, Tour JM. Mechanism of graphene oxide formation. ACS Nano. 2014;8(3):3060–3068.
29. Zaaba N, Foo KL, Hashim U, et al. Synthesis of graphene oxide using modified hummers method: solvent influence. Procedia Eng. 2017;184:469–477.
30. Shao G, Lu Y, Wu F, et al. Graphene oxide: the mechanisms of oxidation and exfoliation. J Mater Sci. 2012;47(10):4400–4409.
31. Xu S, Zhang Y, Dong K, et al. Electrochemical DNA biosensor based on graphene oxide-chitosan hybrid nanocomposites for detection of Escherichia coli O157: H7. Int J Electrochem Sci. 2017;12:3443–3458.
32. Karabiberoğlu ŞU, Dursun Z. Fabrication of nickel coated graphene oxide composite electrode for sensitive determination of Rutin. J Electroanal Chem. 2018;815:76–85.
33. Singh A, Sinsinbar G, Choudhary M, et al. Graphene oxide-chitosan nanocomposite based electrochemical DNA biosensor for detection of typhoid. Sens Actuators B Chem. 2013;185:675–684.
34. Kafi MA, Paul A, Vilouras A, et al. Chitosan-graphene oxide-based ultra-thin and flexible sensor for diabetic wound monitoring. IEEE Sens J. 2020;20:6794–6801.
35. Mohamad FS, Mat ZMH, Abdullah J, et al. Synthesis and characterization of polyaniline/graphene composite nanofiber and its application as an electrochemical DNA biosensor for the detection of Mycobacterium tuberculosis. Sensors. 2017;17(12):2789.
36. Blair EO, Hannah S, Vezza V, et al. Biologically modified microelectrode sensors provide enhanced sensitivity for detection of nucleic acid sequences from Mycobacterium tuberculosis. Sens Actuator Rep. 2020;2(1):100008.
37. Rizi KS, Meshkat Z, Chahkandi M, et al. A PCR-free genome detection of mycobacterium tuberculosis complex in clinical samples using MWCNT/PPy/KHApNps modified electrochemical nano-biosensor. J Electrochem Soc. 2021;168(7):077501.
38. Rizi KS, Hatamluyi B, Rezayi M, et al. Response surface methodology optimized electrochemical DNA biosensor based on HAPNPTs/PPY/MWCNTs nanocomposite for detecting Mycobacterium tuberculosis. Talanta. 2021;226:122099.
 © 2021 The Author(s). This work is published and licensed by Dove Medical Press Limited. The
full terms of this license are available at https://www.dovepress.com/terms
and incorporate the Creative Commons Attribution
- Non Commercial (unported, 3.0) License.
By accessing the work you hereby accept the Terms. Non-commercial uses of the work are permitted
without any further permission from Dove Medical Press Limited, provided the work is properly
attributed. For permission for commercial use of this work, please see paragraphs 4.2 and 5 of our Terms.
© 2021 The Author(s). This work is published and licensed by Dove Medical Press Limited. The
full terms of this license are available at https://www.dovepress.com/terms
and incorporate the Creative Commons Attribution
- Non Commercial (unported, 3.0) License.
By accessing the work you hereby accept the Terms. Non-commercial uses of the work are permitted
without any further permission from Dove Medical Press Limited, provided the work is properly
attributed. For permission for commercial use of this work, please see paragraphs 4.2 and 5 of our Terms.