Back to Journals » International Journal of General Medicine » Volume 15
GLUT1 and ASCT2 Protein Expression in Papillary Thyroid Carcinoma Patients and Relation to Hepatitis C Virus: A Propensity-Score Matched Analysis
Authors Ibrahiem AT ![]() , Fawzy MS
, Fawzy MS ![]() , Abdulhakim JA
, Abdulhakim JA ![]() , Toraih EA
, Toraih EA ![]()
Received 15 December 2021
Accepted for publication 7 March 2022
Published 14 March 2022 Volume 2022:15 Pages 2929—2944
DOI https://doi.org/10.2147/IJGM.S354108
Checked for plagiarism Yes
Review by Single anonymous peer review
Peer reviewer comments 2
Editor who approved publication: Dr Scott Fraser
Afaf T Ibrahiem,1,2 Manal S Fawzy,3,4 Jawaher A Abdulhakim,5 Eman A Toraih6,7
1Department of Pathology, Faculty of Medicine, Northern Border University, Arar, Saudi Arabia; 2Department of Pathology, Faculty of Medicine, Mansoura University, Mansoura, Egypt; 3Department of Biochemistry, Faculty of Medicine, Northern Border University, Arar, Saudi Arabia; 4Department of Medical Biochemistry and Molecular Biology, Faculty of Medicine, Suez Canal University, Ismailia, Egypt; 5Medical Laboratory Department, College of Applied Medical Sciences, Taibah University, Yanbu, Saudi Arabia; 6Department of Surgery, Tulane University, School of Medicine, New Orleans, LA, USA; 7Genetics Unit, Histology and Cell Biology Department, Faculty of Medicine, Suez Canal University, Ismailia, Egypt
Correspondence: Manal S Fawzy, Tel +966 583241944, Fax +966 146640705, Email [email protected]
Purpose: Recently, glucose and amino acid transporters have gradually become a hot topic in thyroid gland biology and cancer research. We aimed to investigate the expressions of glucose transporter 1 (GLUT1) and glutamine transporter 2 (ASCT2) in papillary thyroid carcinoma (PTC) and their clinical significance and relation to HCV-related hepatitis.
Patients and Methods: Screening 202 TC tissue samples against the selection criteria using a propensity-score matched analysis to adjust for age, sex, side of tumor, histopathological variants, TNM staging system, and the positivity for HCV yielded 51 matched (17 HCV positive and 34 HCV negative) PTC samples. The expressions of GLUT1 and ASCT2 expressions were detected by immunohistochemical staining. Kaplan–Meier survival curves were generated for disease-free and overall survival, and multivariate Cox regression analysis was applied to identify predictors for mortality.
Results: Of 51 thyroid cancer tissues, 85% showed positive GLUT1 cytoplasmic staining, and 26% had a high expression score. All thyroid cancer specimens demonstrated ASCT2 cytoplasmic staining with membranous accentuation. Of these, 78% showed a high expression score, and 22% showed weak staining. On stratifying the study cohort based on the HCV status, HCV negative cohort showed a significantly higher immunoreactivity score for GLUT1 (p = 0.004) but not ASCT2 (p = 0.94) than HCV positive group. The expressions of the studied transporters showed no significant associations with the prognostic features of PTC nor the disease-free/overall survival.
Conclusion: GLUT1 and ASCT2 immunohistochemical staining showed positive expression with variable intensity in nearly 85% and 100% of PTC tissue samples compared to normal ones, respectively. Furthermore, GLUT1 protein expression, not ASCT2, showed a higher immunoreactivity score in PTC patients who are negative for HCV than cancer patients with positive HCV. Meanwhile, the expression of both protein markers was not associated with the clinicopathological characteristics of the studied PTC patients. Further large-scale multicenter studies are recommended to validate the present findings.
Keywords: papillary thyroid cancer, glucose transporter 1, glutamine transporter 2, immunohistochemistry, HCV
Introduction
Thyroid carcinoma (TC) is one of the most prevalent cancer worldwide, associated with more death rate than other cancers of endocrine glands, with a mean incidence rate nearly increasing by 6.2% per year.1,2 Approximately 90% of non-medullary thyroid malignancies originating from thyroid follicular cells are classified as well-differentiated thyroid carcinomas (DTCs). DTCs are subdivided into follicular thyroid carcinoma (FTC) and papillary thyroid carcinoma (PTC), the latter of which is more prevalent, accounting for approximately 80% of DTCs.3 Although most TC has a good prognosis, approximately 10% of patients with well-differentiated TC lose response to radioactive iodine therapy, even for TNM stage I patients and approximately 15% of patients experienced recurrence during ten years of follow-up.4 Therefore, the molecular basis and targeted therapies for PTC still need more investigation and identifying prognostic markers.
Several metabolic changes have been associated with the histological/cytological and molecular abnormalities during TC progression.5 Transformed cells exhibit a high rate of glucose consumption which regulates essential cellular signaling for oncogenic progression, among other vital roles.6 Glutamine, another essential nutrient and the most plentiful amino acid in the serum, represents a significant nitrogen source for amino and nucleic acid biosynthesis and is considered one of the primary carbon sources for Krebs cycle intermediates replenishment.7 Accumulating evidence indicates that glucose and glutamine are essential nutrients for not only tumor survival but also for immune cell function (eg T-cell activation and differentiation).8 Cellular metabolic reprogramming, in which increased glucose uptake and glutamine utilization support rapid growth, is reported to be an emerging hallmark of most cancers.9,10 One of the significant glucose transporters (GLUT1-14) in malignant cells is GLUT1 isoform (also known as solute carrier family 2 member 1; SLC2A1), demonstrated to be related to cancer progression microvessel density, tumor invasion, and/or metastasis.11,12 Although GLUT1 is reported to be overexpressed in several cancer types, some in vitro and in vivo studies showed that GLUT1 expression is absent from certain human cancers, and other cellular biomolecules and molecular pathways can impact its role and expression in TC.13–21 Furthermore, expression of GLUT1 was found to be higher in PTC than follicular type and in anaplastic than PTC and could have a prognostic utility in these types of TC.22,23
The sodium-dependent neutral amino acid transporter ASCT2 “Alanine, Serine, Cysteine Transporter 2” (also known as solute carrier family 1 member 5; SLC1A5) is preferentially transporting glutamine and subjects to several posttranslational modifications that regulate its transport activity, trafficking, and stability.24 Its expression is enhanced in rapidly proliferative cells as cancers to support the high metabolic demand of glutamine.25 Therapeutic blocking of this transporter has been reported to successfully inhibit cancer cell proliferation in several cancers,24,26,27 and recently, it emerged as a hot topic for thyroid gland biology or cancer research.28,29 In fact, few studies have focused on its role in TC, especially the PTC.26,30
Previous studies have reported that about 38–76% of hepatitis C virus (HCV) infected patients can develop extrahepatic manifestations with a high prevalence of certain types of cancer, not only hepatocellular carcinoma but also PTC.31–34 In this sense, HCV is considered a well-known potential risk factor for TC.32,33,35 The exact etiopathological role of HCV in TC is not fully characterized, but several hypothetical impacts can be concluded from previous studies.36,37 HCV could exert its possible oncogenic role through direct/indirect mechanisms with potential contribution of other non-viral factors as environmental, hormonal, and genetic factors. It is speculated that the “quasispecies nature of HCV” is one of the crucial mechanisms through which the virus can progress into chronic infection and induce genetic changes associated with papillary, follicular, and/or anaplastic TC.36 Also, the increased prevalence of thyroid autoimmunity, chronic thyroiditis, and thyroid lymphocytic infiltration in patients with CV have been regarded as preneoplastic conditions for PTC.37
As studies related to the transporters mentioned above, in particular the ASCT2, still show controversy in different thyroid cancer pathological types, and there are not enough data, up to the authors’ knowledge, to explore such types of transporters in PTC in the authors’ region, we aim to evaluate GLUT1 and ASCT2 protein expression and analyze their prognostic significance in PTC. Furthermore, as a relative number of eligible TC patients are infected with HCV, we aim to investigate the expression of the specified transporter in TC patients stratified by their HCV status.
Materials and Methods
Study Population and Propensity Matching Analysis
We retrospectively analyzed surgically resected thyroid tissue specimens that had been histologically diagnosed as PTC at the Department of Pathology, Mansoura University, during the years 2015–2017. All demographic, clinical, morphologic, and survival data were retrieved from patients’ medical records. Two hundred and two TC formalin-fixed paraffin-embedded sections with hepatitis C virus data recorded as either confirmed positive or negative for HCV-related hepatitis were screened. Pediatric cases (<18 years old), non-papillary thyroid cancer cases, secondary carcinoma, or cases who received preoperative treatment were excluded. Histopathological analysis by Hematoxylin and Eosin was performed to confirm the histological type, grading, staging of cancer, extra-thyroidal local extension, circumferential margin, lymph node metastasis, lymphovascular and perineural invasion. Patients with insufficient cancer and paired non-neoplastic thyroid tissues, missing clinical data, or loss of follow-up were excluded. Nearest neighbor propensity score matching analysis was performed with a ratio of 2 to 1 based on the presence of HCV-related hepatitis. Propensity score analysis could be employed to match patients with an equal number per group 1:1 till 4:1.38 During screening TC patients with and without HCV; we noticed that non-HCV patients were higher than those diagnosed with HCV comorbidity. In this sense, we selected 2:1 to have a sufficiently balanced range of possible matches and enough representative exposed and unexposed groups to be able to calculate a causal effect estimation of the outcomes of all observed individuals. After adjustment by age, sex, tumor side, histopathological variants, and TNM staging system, a total of 51 matched patients were selected, including 17 HCV positive and 34 HCV negative cases (Figure 1). The BRAF mutation status data of enrolled samples were collected from the archived medical records of the patients. The local ethical committee approved the present study following the “Declaration of Helsinki” guidelines.
 |
Figure 1 Workflow for the selection process of the study population. Abbreviation: HCV, hepatitis C virus. |
Immunohistochemistry (IHC) Staining of Tissue Sections
Immunohistochemical analysis was performed on 4-μm-thick sections of formalin-fixed paraffin-embedded PTC biopsies. Tissue sections, spread on poly-L-lysine coated slides, were dewaxed, rehydrated, and washed in 1x phosphate-buffered saline (PBS; Lonza, Verviers, Belgium). The epitope was retrieved by treating the slides in a PT Link (Dako, Agilent Technologies, Santa Clara, CA, United States), containing acid or basic solution (as appropriate), preheated to 97 °C, for 30 minutes. The paraffin sections were immersed in three xylene changes and hydrated using a graded series of alcohol solutions. Next, endogenous peroxidase was inhibited with a peroxidase-blocking solution (Dako, Agilent Technologies, Santa Clara, CA, United States) for 5 minutes. Afterward, sections were incubated with one of the following primary antibodies: anti-GLUT1 antibody (rabbit polyclonal antibody IgG, diluted 1:200 at 4°C overnight, citrate buffer, pH 6.0), and anti-ASCT2 antibody (rabbit polyclonal antibody IgG, diluted 1:200, clone YPA2006; Chongqing Biopsies CO., Ltd, pH 7.4). Appropriate positive and negative control tissues were included for all antibodies. The photos were obtained using a Nikon magnifying lens prepared with a 5–megapixel cooled CCD camera joined with the Picture Pro Plus AMS7 computer program.
Interpretation of Immunohistochemical Results
GLUT1 staining appeared as fine granular cytoplasmic staining of tumor cells, either cytoplasmic and/or nuclear. ASCT 2 showed cytoplasmic staining with linear staining of the basolateral membrane. The immune histochemical staining score (IHS) was calculated semi-quantitatively by combining an estimate of the percentage of immunoreactive cells (quantity score) with an estimate of the staining intensity (staining intensity score). For the percentage of staining, 0 indicated no staining; 1, 1–10% of cells stained; 2, 11–50%; 3, 51–80%; 4, 81–100%. Staining intensity scores were as follows: 0, negative; 1, weak; 2, moderate; and 3, strong. Combining the quantity and staining intensity scores was done to convert the raw data into the HIS, which ranged from 0 to 12, with 0 indicating negative, 1 to 4 indicating weak, 5 to 8 indicating moderate, and 9 to 12 indicating strong immunoreactivity (high expression). Scoring was performed in a double-blind manner. Intra-tumoral erythrocytes served as a positive control, and negative control staining was performed without applying the primary antibody.39,40
Statistical Analysis
Data analysis was performed using SPSS v27.0 and GraphPad prism v9.1.2. The study population was selected using propensity score matching analysis with a ratio 2:1 nearest neighbor algorithm. Data were described as number/percentage, mean/standard deviation, or median/quartiles as appropriate. Two-sided Chi-square, Fisher’s exact, student’s-t, or Mann–Whitney U-tests were used. P-value <0.05 was considered significant. Kaplan–Meier survival curves were generated for the disease-free survival (DFS), defined as “the time length that the patient survives after primary cancer treatment ends without any signs/symptoms of that cancer”, and the overall survival (OS) defined as “the interval between the time of surgery to death or the last follow-up”. “Multivariate Cox regression analysis” was run to identify predictors for mortality.
Results
Characteristics of Papillary Thyroid Cancer Patients
Of the whole study population, 76.5% were females. The median age at diagnosis was 43.0 (31.0–62.0). Most of the patients (86.3%) underwent total/subtotal thyroidectomy, and 70.6% had neck dissection. After a 7-years follow-up, 31.4% progressed, and 13.7% (N=7) died. The propensity-score analysis yielded matched thyroid cancer patients; 17 HCV positive and 34 negative groups. They matched age (p=0.74), sex (p=0.72), along other clinicopathological parameters (Table 1).
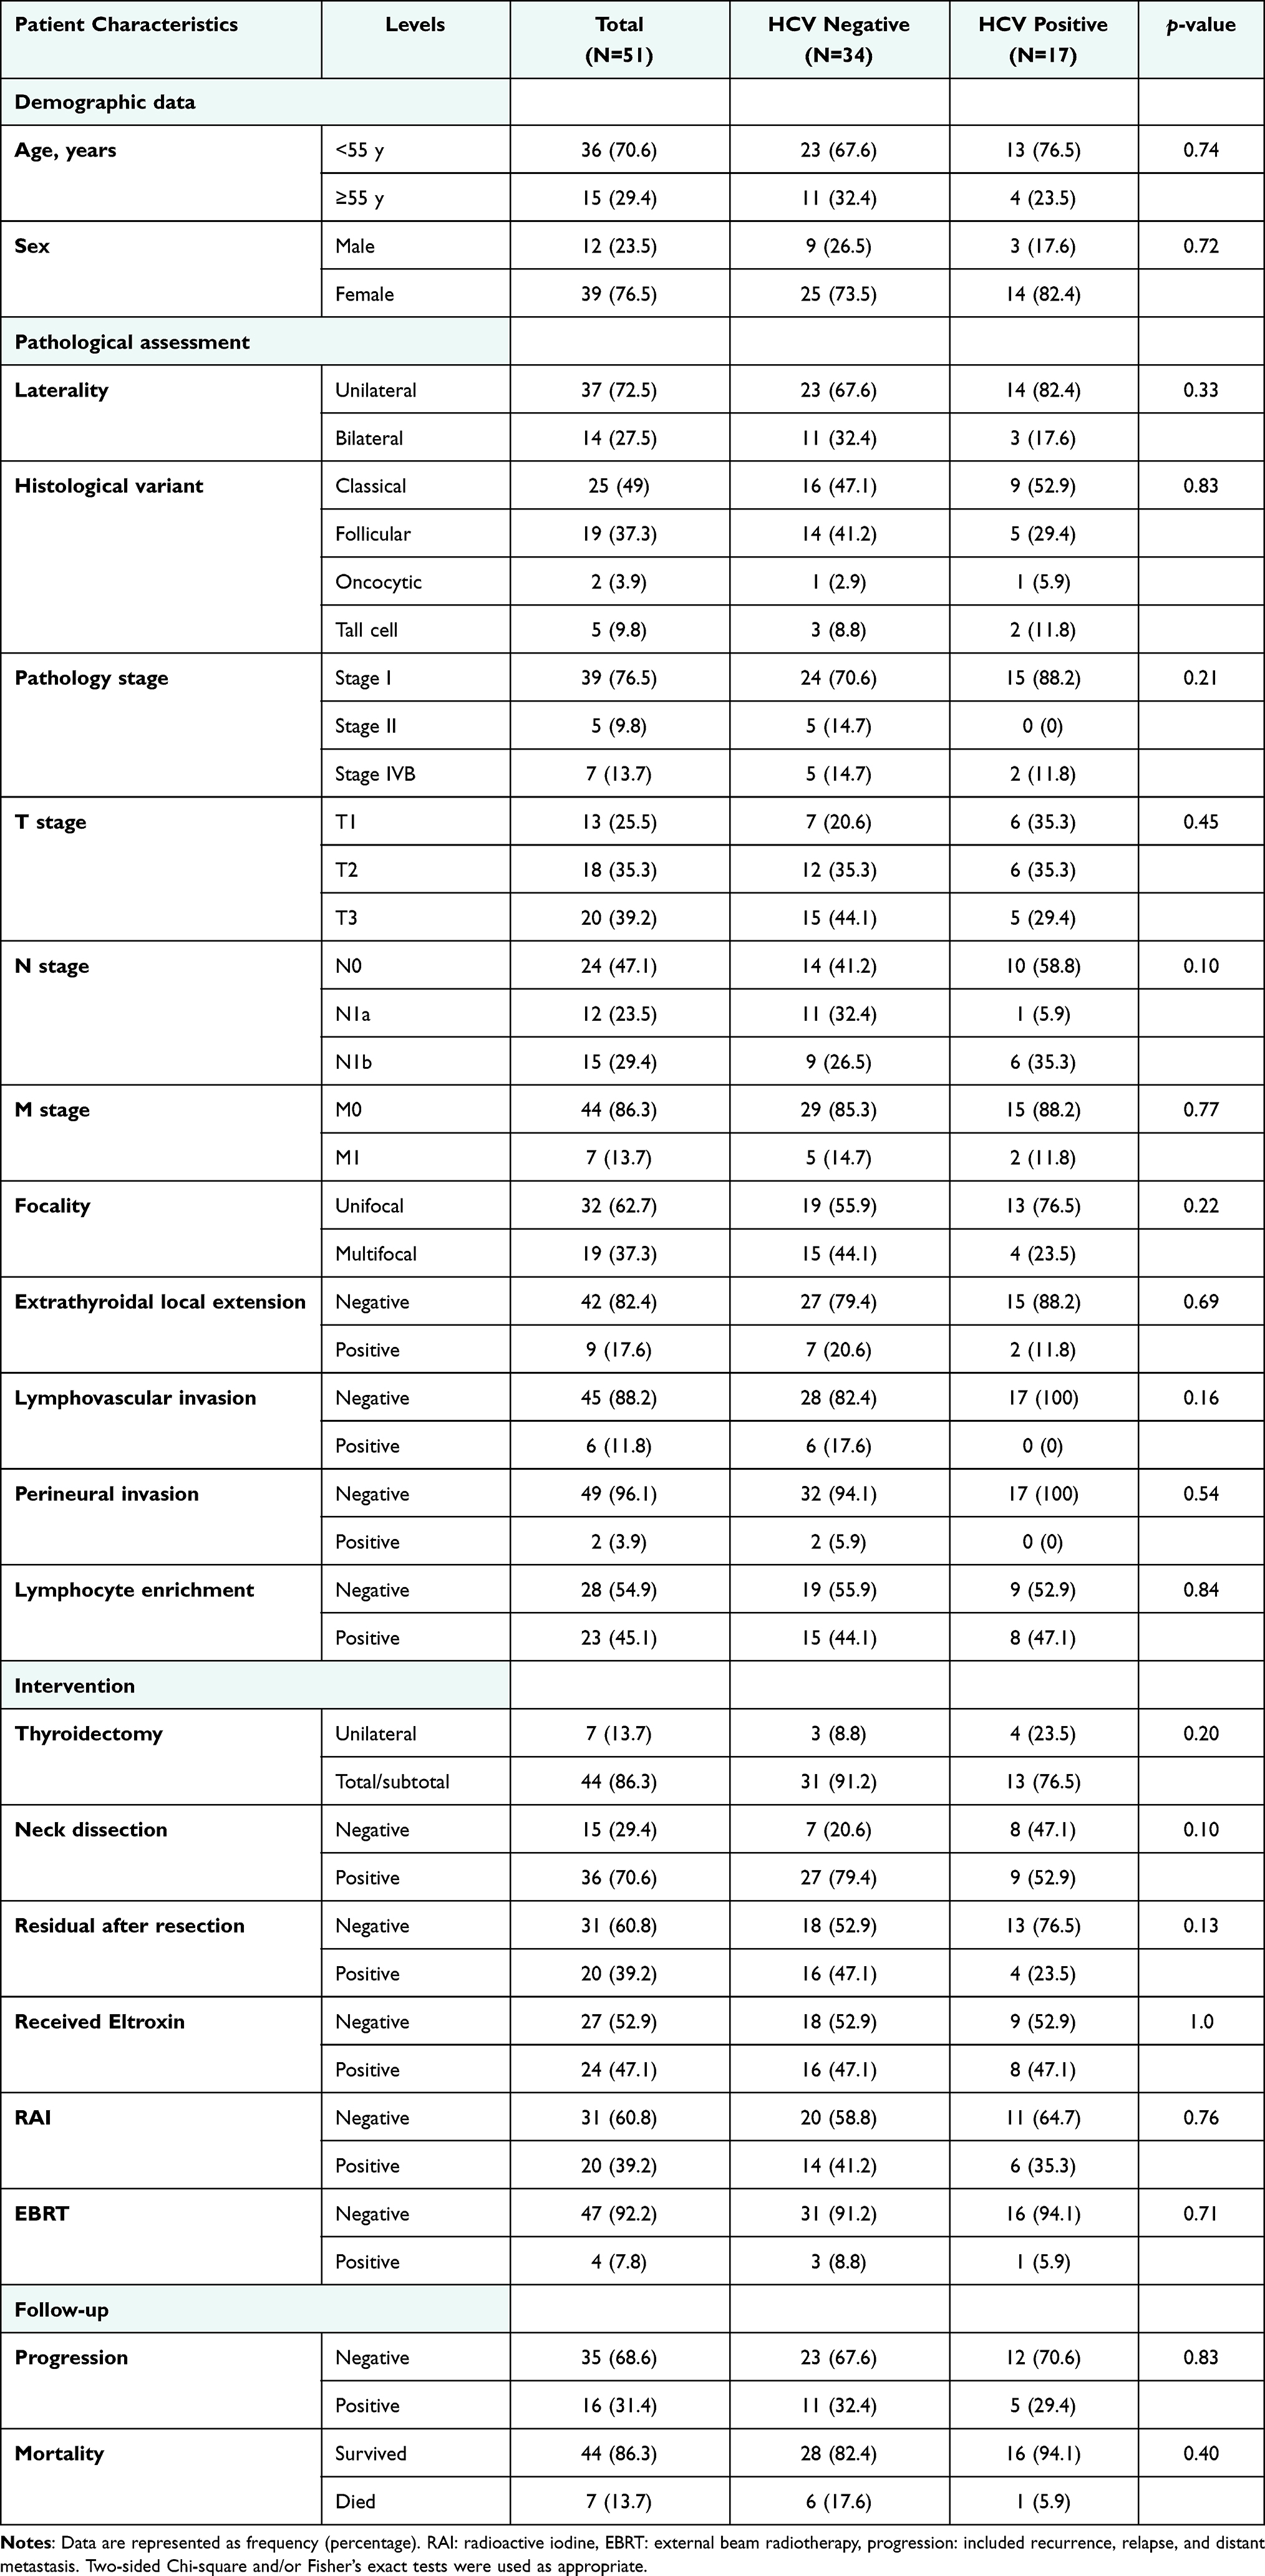 |
Table 1 Characteristics of Matched Cohorts |
Stratified analysis by HCV rendered insignificant correlation results to clinicopathological features of the studied PTC cases (Table 1). HCV positive antibodies were predominated in patients with age <55 years (76.5%), female gender (82.4%), unilaterally (82.4%), classic variant (52.9%), Stage I (88.2%), T1 (35.3) and T2 (35.3), tumors with no metastatic deposits (N0; 58.8%), tumors with no metastatic deposits (88.2%), unifocal (76.5%), tumors with no extrathyroidal local extension (88.2%), tumors with no lymphovascular invasion (100%), no perineural invasion (100%), or no progression (70.6%).
GLUT1 and ASCT2 Expression in Thyroid Cancer Specimens
The GLUT1 and ASCT2 thyroid tissue IHC analysis results are shown in Figures 2 and 3 and summarized in Figure 4. GULT1 showed variable expression in PTC samples with recorded high expression (in more than 75% of tumor tissue). Nearly 85% of PTC cases were positively expressed GLUT1 that was mainly cytoplasmic with associated nuclear staining. For cancer tissue expression of GLUT 1, we had more than half of the cases weakly express the marker (59%). Moderate and intense expressions were observed in 12% and 14% of cases, respectively. Intense cytoplasmic staining was associated with nuclear staining.
 |
Figure 2 Immunohistochemistry staining of GLUT1 protein. (A) Non-neoplastic thyroid tissue with negative staining (x400), (B) papillary thyroid carcinoma (Classic variant) with diffuse cytoplasmic solid staining with membranous accentuation (x200), (C) papillary thyroid carcinoma with diffuse cytoplasmic solid staining with membranous accentuation (x400), (D) papillary thyroid carcinoma (Tall cell variant) with weak staining and positive inflammatory cells in the papillary core (x400), (E) papillary thyroid carcinoma (follicular variant) showing moderate diffuse cytoplasmic staining (x200), (F) papillary thyroid carcinoma (follicular variant) showing weak cytoplasmic staining (x400). |
 |
Figure 3 Immunohistochemistry staining of ASCT2 protein in well-differentiated thyroid cancer specimens. (A) Non-neoplastic thyroid tissue with negative staining (x400), (B) papillary thyroid carcinoma with diffuse cytoplasmic solid staining with membranous accentuation (x200), (C) papillary thyroid carcinoma with diffuse cytoplasmic solid staining with membranous accentuation (x400), (D) papillary thyroid carcinoma with negative staining (x400), (E) papillary thyroid carcinoma (follicular variant) showing partial cytoplasmic staining (x200), (F) papillary thyroid carcinoma (follicular variant) showing partial cytoplasmic staining (x400). |
 |
Figure 4 Differential expression of GLUT1 and ASCT2 proteins in thyroid cancer patients according to their hepatitis C virus (HCV) infection status. The immune histochemical staining score (IHS) was determined by combining an estimate of the percentage of immunoreactive cells (quantity score) with the staining intensity (staining intensity score). For the percentage of staining, 0 indicated no staining; 1: 1–10% of cells stained; 2: 11–50%; 3: 51–80%; 4: 81–100%. Staining intensity scores were as follows: 0: negative; 1: weak; 2: moderate; and 3: strong. The raw data were converted to the IHS by multiplying the quantity and staining intensity scores. The IHS ranged from 0 to 12, with 0 indicating negative, 1 to 4 indicating weak, 5 to 8 indicating moderate, and 9 to 12 indicating strong immunoreactivity. (A) Overall GLUT1 protein expression is categorized according to protein staining severity scores. (B) GLUT1 protein immunohistochemistry quantitative score (from 0 to 12) according to the presence of HCV antibodies. Median and interquartile range was 4 (2–6) in HCV negative group, compared to 2 (0.5–4) in HCV positive group. Mann–Whitney U-test was used. (C) GLUT1 protein immunoreactivity categories are classified according to the presence of HCV. A two-sided Chi-square test was used. (D) Overall ASCT2 protein expression is categorized according to protein staining severity scores. (E) ASCT2 protein immunohistochemistry quantitative score (from 0 to 12) according to the presence of HCV antibodies. The median and interquartile range was 6 (6–9.75) in HCV negative group, compared to 6 (4.5–9) in HCV positive group. Mann–Whitney U-test was used. (F) ASCT2 protein immunoreactivity categories are classified according to the presence of HCV. A two-sided Chi-square test was used. Statistical significance was set at p-value < 0.05. Abbreviations: ASCT2, alanine, serine, cysteine transporter 2; GLUT1, glucose transporter 1. |
ASCT2 immunohistochemical staining showed positive expression in PTC tissue compared to rare weak expression in normal thyroid tissue. The subcellular localization of ASCT2 is cytoplasmic staining with membranous staining. All studied cases of PTC showed ASCT2 expression but with variable intensity and percentage of tissue involved (45% were of moderate expression, 33% with an intense expression, and 22% with weak expression).
Prognostic Value of GLUT1 and ASCT2 Protein Expression
Immunoreactivity scores and expression categories of each protein in association with clinical and pathological features are summarized in Tables 2 and 3. There was no significant association found with any of the studied parameters. Stratified analysis by HCV also rendered insignificant results. Four samples were dual negative results, while seven others demonstrated dual positive staining. Dose effect analysis did not yield a significant association with any prognostic features.
 |
Table 2 Association of GLUT1 Protein Expression with Clinical and Pathological Parameters |
 |
Table 3 Association of ASCT2 Protein Expression with Clinical and Pathological Parameters |
Differential Expression of GLUT1 and ASCT2 Proteins in TC Patients According to HCV Status
There was a significant difference in tissue GLUT1 expression between patients with positive HCV versus negative cases (p = 0.004). Also, the intensity of expression of GLUT 1 showed a significant association with HCV status (p =0.045). Regarding ASCT2 expression, no significant difference in tissue expression was observed between patients with positive HCV and patients without (p = 0.94). Also, there was no significant difference related to the intensity of ASCT2 expression (p = 0.58).
Survival Analysis and Predictors of Disease Progression
To identify the role of GLUT1 and ASCT2 on survival times, Kaplan–Meier survival curve analysis for overall and disease-free survivals was carried out. Although patients with low expression of GLUT1 showed long DFS (63.6 months with range 50.8 −76.4 months) compared to 46.6 months (25.5–67.8 months) for those with high GLUT 1 expression, this difference did not reach significant results (p = 0.35) (Figure 5A). The DFS for patients with low ASCT2 expression is near to those with high expression, and no significant difference was reported (54.4 with a range (26.6 −81.9) and 58.4 with a range (47.3–69.5), respectively (Figure 5B). Cox proportional hazard regression analysis for disease-free survival was employed to predict putative independent risk factors revealed that cancer tissue expression of GULT1 or ASCT2 were not independent predictors for DFS in studied patients (Figure 5C).
 |
Figure 5 Disease-free survival (DFS) analysis. Cohorts with moderate and intense staining scores were considered high expression (scores 5–12) compared to negative/weak ones who considered low expression (scores 0–4). (A) Kaplan–Meier curve for survival analysis based on GLUT1 protein expression. (B) Kaplan–Meier curve for survival analysis based on ASCT2 protein expression. Log Rank test was applied for significance test. (C) Independent risk factors for disease progression. Cox proportional hazard regression analysis for disease-free survival (DFS) was employed to predict putative independent risk factors. Hazard ratio (HR) and 95% confidence interval (CI) are shown. Abbreviations: ASCT2, alanine, serine, cysteine transporter 2; GLUT1, glucose transporter 1; HCV, hepatitis C virus; mo, month. |
Discussion
As one of the most common cancers of the endocrine glands with a growing incidence in the past few decades, identifying markers for early diagnosis/prognosis and effective treatment of TC is substantially important.41 In this study, we explored the expression of two essential cellular substrate transporters, GLUT1/ASCT2, to uncover their role in PTC and evaluate their prognostic significance.
Our data revealed that GULT1 showed high expression (in more than 75% of tumor tissues), and nearly 85% of PTC cases were positively expressed GLUT1. Furthermore, all studied cases of PTC showed ASCT2 expression, but with variable intensity and percentage of tissue involved.
Upregulated GLUT1 levels were reported in several cancer types, summarized by the recent review of Zambrano et al, to meet the metabolic needs of cancer transformation.42 Florian et al identified that TC dedifferentiation is associated with GLUT1 upregulation and increased proliferation, and the poorly differentiated thyroid cancer was found to be intermediate between well-differentiated and anaplastic TC in terms of GLUT1 expression.43 The later investigators suggested that the “flip-flop phenomenon” could be correlated with the dedifferentiation stage of the TC that impacts the GLUT1 distribution and expression. The increased proliferation rate of the cancer cells causes hypoxia which induces the expression of hypoxia-inducible factor-1 with subsequent upregulation of its target genes, including the GLUT1.44 Previous studies have reported high hypoxia-inducible factor-1 nuclear staining in anaplastic TC,45 and upregulated GLUT1 in other types of cancer was associated with distant metastasis.46,47 These findings indicate that the GLUT1 expression level may be positively correlated with the invasiveness and degree of dedifferentiation of thyroid tumors.28 As all the eligible cases in the present study were well-differentiated PTC, and small percentages of cases (17.6% and 11.8%) presented with extrathyroidal local extension and lymphovascular invasion, respectively, this can in part explain the absence of significant variations of GLUT1 expression among the high/low expressor cohorts regards the clinicopathological features of the TC.
Similarly, as a transporter for glutamine, ASCT2 plays an essential role in cancer metabolism regulation. After entering the cell, the glutamine is converted into glutamate by the glutaminase enzyme, which is transported to the mitochondria and then converted into useful metabolic intermediates such as α-ketoglutarate, aspartate, alanine, among others, participating by this way in intracellular metabolic functions.29 Using IHC for tissue microarray comprising 557 TC samples, Kim et al found that “ASCT2 was expressed in all TC tissues; however, the expression level was dissimilar in different types of TC samples”.26 Also, ASCT2 expression was associated with the degree of TC differentiation28 and cancer invasion.48 Wang and his colleagues concluded that
ASCT2 expression in TC could be affected by a variety of factors, among which include gene mutations (eg BRAF, RAS, MYC) that cause changes in signaling pathways involved in ASCT2 expression.29
In this sense, further studies uncovering the exact relation of ASCT2 with these genes in several types of TC and in variable populations are required.
Correlation of the immunoreactivity scores of studied transporters with the clinicopathological variables of TC patients revealed no significant associations with any of the studied parameters. These findings were consistent in part with Kaida et al, who found that the PTC prognosis was not correlated with age/sex, extra-thyroidal local extension, or GLUT-1/3/4 expressions.22 Also, Kim et al found that GLUT1 expression was not associated with the extrathyroidal local extension, LN metastasis, or advanced tumor stage in patients with primary thyroid cancer.49
On stratifying the TC patients based on HCV status, there was a significant difference in tissue GLUT1 expression levels between patients with positive HCV versus negative cases, in which the former sub-group showed less GLUT1 expression levels than the later one.
The prevalence of PTC among cases with HCV was investigated in several studies31,37,50,51 and confirmed by Wang et al’s meta-analysis.34 Using Huh-7.5 cells harboring HCV sub-genomic/full-genomic RNA replicons and liver tissue samples from patients with/without HCV, Kasai et al reported downregulation of GLUT1/2 at the transcriptional levels (for GLUT2) or at the intracellular trafficking level (for GLUT1).52 This could support in part our findings.
Given the relatively small sample size of eligible cases of one type of TC, the PTC, large scale, multicenter studies included several types of TC are recommended to validate the study results. Further molecular studies, including quantification of the studied transporters at the transcriptomic levels, are warranted to clarify the precise mechanisms behind the study findings.
Conclusion
GLUT1 and ASCT2 IHC staining showed positive expression with variable intensity in nearly 85% and 100% of the current PTC tissue samples compared to normal ones, respectively. GLUT1 protein expression showed a higher immunoreactivity score in thyroid cancer patients negative for HCV than positive ones. Meanwhile, the protein expression of both proteins was not associated with the clinicopathological characteristics of the studied PTC patients.
Data Sharing Statement
All data generated or analyzed during this study are included in the article.
Ethics Statement
All procedures performed in studies involving human participants were following the ethical standards of the institutional and/or national research committee and with the 1964 Helsinki declaration and its later amendments or comparable ethical standards. The study was approved by the ethics committee of Northern Border University (NO. F-7954-MED-2018-3-9).
Informed Consent
Informed consent was waived as enrolled samples were archived with a retrospective study design.
Author Contributions
All authors contributed to data analysis, drafting, or revising the article, have agreed on the journal to which the article has been submitted, gave final approval of the version to be published, and agree to be accountable for all aspects of the work.
Funding
The authors would like to acknowledge the approval and the support of this research study by grant No. (F-7954-MED-2018-3-9) from the Deanship of Scientific Research, Northern Border University, Arar, Saudi Arabia.
Disclosure
The authors report no conflicts of interest. The authors alone are responsible for the content and writing of this article.
References
1. Yan KL, Li S, Tseng C-H, et al. Rising incidence and incidence-based mortality of thyroid cancer in California, 2000-2017. J Clin Endocrinol Metab. 2020;105(6):356. doi:10.1210/clinem/dgaa121
2. Rossi ED, Pantanowitz L, Hornick JL. A worldwide journey of thyroid cancer incidence centred on tumour histology. Lancet Diabetes Endocrinol. 2021;9(4):193–194.
3. Nikiforov YE, Nikiforova MN. Molecular genetics and diagnosis of thyroid cancer. Nat Rev Endocrinol. 2011;7(10):569–580.
4. Schmidbauer B, Menhart K, Hellwig D, Grosse J. Differentiated Thyroid Cancer-Treatment: state of the Art. Int J Mol Sci. 2017;18(6):46.
5. Ciavardelli D, Bellomo M, Consalvo A, Crescimanno C, Vella V. Metabolic Alterations of Thyroid Cancer as Potential Therapeutic Targets. Biomed Res Int. 2017;2017:2545031.
6. Adekola K, Rosen ST, Shanmugam M. Glucose transporters in cancer metabolism. Curr Opin Oncol. 2012;24(6):650–654.
7. Ganapathy V, Thangaraju M, Prasad PD. Nutrient transporters in cancer: relevance to Warburg hypothesis and beyond. Pharmacol Ther. 2009;121(1):29–40.
8. Kedia-Mehta N, Finlay DK. Competition for nutrients and its role in controlling immune responses. Nat Commun. 2019;10(1):2123.
9. Cazzaniga M, Bonanni B. Relationship Between Metabolic Reprogramming and Mitochondrial Activity in Cancer Cells. Understanding The Anticancer Effect of Metformin and Its Clinical Implications. Anticancer Res. 2015;35(11):5789.
10. Sun HW, Yu XJ, Wu WC, et al. GLUT1 and ASCT2 as Predictors for Prognosis of Hepatocellular Carcinoma. PLoS One. 2016;11(12):e0168907.
11. Wang J, Ye C, Chen C, et al. Glucose transporter GLUT1 expression and clinical outcome in solid tumors: a systematic review and meta-analysis. Oncotarget. 2017;8(10):16875–16886.
12. Mamun AA, Hayashi H, Yamamura A, Nayeem MJ, Sato M. Hypoxia induces the translocation of glucose transporter 1 to the plasma membrane in vascular endothelial cells. J Physiol Sci. 2020;70(1):44.
13. Matsuzu K, Segade F, Matsuzu U, Carter A, Bowden DW, Perrier ND. Differential expression of glucose transporters in normal and pathologic thyroid tissue. Thyroid. 2004;14(10):806–812.
14. Chandan VS, Faquin WC, Wilbur DC, Khurana KK. The role of immunolocalization of CD57 and GLUT-1 in cell blocks in fine-needle aspiration diagnosis of papillary thyroid carcinoma. Cancer. 2006;108(5):331–336.
15. Carvalho KC, Cunha IW, Rocha RM, et al. GLUT1 expression in malignant tumors and its use as an immunodiagnostic marker. Clinics. 2011;66(6):965–972.
16. Jóźwiak P, Lipińska A. The role of glucose transporter 1 (GLUT1) in the diagnosis and therapy of tumors. Postepy Hig Med Dosw. 2012;66:165–174.
17. Morani F, Pagano L, Prodam F, Aimaretti G, Isidoro C. Loss of expression of the oncosuppressor PTEN in thyroid incidentalomas associates with GLUT1 plasma membrane expression. Panminerva Med. 2012;54(2):59–63.
18. Morani F, Phadngam S, Follo C, et al. PTEN regulates plasma membrane expression of glucose transporter 1 and glucose uptake in thyroid cancer cells. J Mol Endocrinol. 2014;53(2):247–258.
19. Zhang B, Xie Z, Li B. The clinicopathologic impacts and prognostic significance of GLUT1 expression in patients with lung cancer: a meta-analysis. Gene. 2019;689:76–83.
20. Khabaz MN, Qureshi IA, Al-Maghrabi JA. GLUT 1 expression is a supportive mean in predicting prognosis and survival estimates of endometrial carcinoma. Ginekol Pol. 2019;90(10):582–588.
21. Yang H, Zhong JT, Zhou SH, Han HM. Roles of GLUT-1 and HK-II expression in the biological behavior of head and neck cancer. Oncotarget. 2019;10(32):3066–3083.
22. Kaida H, Hiromatsu Y, Kurata S, et al. Relationship between clinicopathological factors and fluorine-18-fluorodeoxyglucose uptake in patients with papillary thyroid cancer. Nucl Med Commun. 2011;32(8):690–698.
23. Wang YF, Liu B, Fan XS, et al. Thyroid carcinoma showing thymus-like elements: a clinicopathologic, immunohistochemical, ultrastructural, and molecular analysis. Am J Clin Pathol. 2015;143(2):223–233.
24. Scalise M, Pochini L, Console L, Losso MA, Indiveri C. The Human SLC1A5 (ASCT2) Amino Acid Transporter: from Function to Structure and Role in Cell Biology. Front Cell Dev Biol. 2018;6:96.
25. Cluntun AA, Lukey MJ, Cerione RA, Locasale JW. Glutamine Metabolism in Cancer: understanding the Heterogeneity. Trends Cancer. 2017;3(3):169–180.
26. Kim HM, Lee YK, Koo JS. Expression of glutamine metabolism-related proteins in thyroid cancer. Oncotarget. 2016;7(33):53628–53641.
27. Lopes C, Pereira C, Medeiros R. ASCT2 and LAT1 Contribution to the Hallmarks of Cancer: from a Molecular Perspective to Clinical Translation. Cancers. 2021;13(2):21.
28. Wen SS, Zhang TT, Xue DX, et al. Metabolic reprogramming and its clinical application in thyroid cancer. Oncol Lett. 2019;18(2):1579–1584.
29. Wang H, Ma Z, Cheng X, Tuo B, Liu X, Li T. Physiological and Pathophysiological Roles of Ion Transporter-Mediated Metabolism in the Thyroid Gland and in Thyroid Cancer. Onco Targets Ther. 2020;13:12427–12441.
30. Enomoto K, Hotomi M. Amino Acid Transporters as Potential Therapeutic Targets in Thyroid Cancer. Endocrinol Metab. 2020;35(2):227–236.
31. Montella M, Crispo A, Pezzullo L, et al. Is hepatitis C virus infection associated with thyroid cancer? A case-control study. Int J Cancer. 2000;87(4):611–612.
32. Montella M, Pezzullo L, Crispo A, et al. Risk of thyroid cancer and high prevalence of hepatitis C virus. (- 1):- 133. Int J Med. 2019;1:543
33. Fallahi P, Ferrari SM, Politti U, Giuggioli D, Ferri C, Antonelli A. Autoimmune and neoplastic thyroid diseases associated with hepatitis C chronic infection. Int J Endocrinol. 2014;2014:935131.
34. Wang P, Jing Z, Liu C, et al. Hepatitis C virus infection and risk of thyroid cancer: a systematic review and meta-analysis. Arab J Gastroenterol. 2017;18(1):1–5.
35. Fallahi P, Ferrari SM, Giuggioli D, et al. Thyroid involvement in hepatitis C - associated mixed cryoglobulinemia. Hormones. 2014;13(1):16–23.
36. Montella M, Pezzullo L, Crispo A, et al. Risk of thyroid cancer and high prevalence of hepatitis C virus. Oncol Rep. 2003;10(1):133–136.
37. Antonelli A, Ferri C, Fallahi P, et al. Thyroid cancer in HCV-related chronic hepatitis patients: a case-control study. Thyroid. 2007;17(5):447–451.
38. Austin PC. Statistical criteria for selecting the optimal number of untreated subjects matched to each treated subject when using many-to-one matching on the propensity score. Am J Epidemiol. 2010;172(9):1092–1097.
39. Yan S, Coffing BN, Li Z, et al. Diagnostic and Prognostic Value of ProEx C and GLUT1 in Melanocytic Lesions. Anticancer Res. 2016;36(6):2871–2880.
40. Toda K, Nishikawa G, Iwamoto M, et al. Clinical Role of ASCT2 (SLC1A5) in KRAS-Mutated Colorectal Cancer. Int J Mol Sci. 2017;18(8):498.
41. Ratajczak M, Gaweł D, Godlewska M. Novel Inhibitor-Based Therapies for Thyroid Cancer-An Update. Int J Mol Sci. 2021;22:21.
42. Zambrano A, Molt M, Uribe E, Salas M. Glut 1 in Cancer Cells and the Inhibitory Action of Resveratrol as A Potential Therapeutic Strategy. Int J Mol Sci. 2019;20:13.
43. Grabellus F, Nagarajah J, Bockisch A, Schmid KW, Sheu SY. Glucose transporter 1 expression, tumor proliferation, and iodine/glucose uptake in thyroid cancer with emphasis on poorly differentiated thyroid carcinoma. Clin Nucl Med. 2012;37(2):121–127.
44. Pereira KM, Chaves FN, Viana TS, et al. Oxygen metabolism in oral cancer: HIF and GLUTs (Review). Oncol Lett. 2013;6(2):311–316.
45. Burrows N, Resch J, Cowen RL, et al. Expression of hypoxia-inducible factor 1 alpha in thyroid carcinomas. Endocr Relat Cancer. 2010;17(1):61–72.
46. Jiwa LS, van Diest PJ, Hoefnagel LD, et al. Upregulation of Claudin-4, CAIX and GLUT-1 in distant breast cancer metastases. BMC Cancer. 2014;14:864.
47. Zuo J, Wen J, Lei M, et al. Hypoxia promotes the invasion and metastasis of laryngeal cancer cells via EMT. Med Oncol. 2016;33(2):15.
48. Kim S, Jung WH, Koo JS. The expression of glutamine-metabolism-related proteins in breast phyllodes tumors. Tumour Biol. 2013;34(5):2683–2689.
49. Kim BH, Lee CH, Kim SJ, et al. Clinicopathologic characteristics of synchronous primary thyroid cancer detected by initial staging 18F-FDG PET-CT examination in patients with underlying malignancy. Thyroid. 2013;23(11):1431–1436.
50. Montella M, Crispo A, de Bellis G, et al. HCV and cancer: a case-control study in a high-endemic area. Liver. 2001;21(5):335–341.
51. Lee MH, Yang HI, Lu SN, et al. Chronic hepatitis C virus infection increases mortality from hepatic and extrahepatic diseases: a community-based long-term prospective study. J Infect Dis. 2012;206(4):469–477.
52. Kasai D, Adachi T, Deng L, et al. HCV replication suppresses cellular glucose uptake through down-regulation of cell surface expression of glucose transporters. J Hepatol. 2009;50(5):883–894.
 © 2022 The Author(s). This work is published and licensed by Dove Medical Press Limited. The
full terms of this license are available at https://www.dovepress.com/terms
and incorporate the Creative Commons Attribution
- Non Commercial (unported, 3.0) License.
By accessing the work you hereby accept the Terms. Non-commercial uses of the work are permitted
without any further permission from Dove Medical Press Limited, provided the work is properly
attributed. For permission for commercial use of this work, please see paragraphs 4.2 and 5 of our Terms.
© 2022 The Author(s). This work is published and licensed by Dove Medical Press Limited. The
full terms of this license are available at https://www.dovepress.com/terms
and incorporate the Creative Commons Attribution
- Non Commercial (unported, 3.0) License.
By accessing the work you hereby accept the Terms. Non-commercial uses of the work are permitted
without any further permission from Dove Medical Press Limited, provided the work is properly
attributed. For permission for commercial use of this work, please see paragraphs 4.2 and 5 of our Terms.