Back to Journals » Clinical Epidemiology » Volume 14
Global Patterns and Trends in Total Burden of Hepatitis B from 1990 to 2019 and Predictions to 2030
Authors Zhang C, Liu Y, Zhao H, Wang G
Received 6 October 2022
Accepted for publication 2 December 2022
Published 14 December 2022 Volume 2022:14 Pages 1519—1533
DOI https://doi.org/10.2147/CLEP.S389853
Checked for plagiarism Yes
Review by Single anonymous peer review
Peer reviewer comments 2
Editor who approved publication: Professor Lars Pedersen
Chi Zhang,1 Yiqi Liu,1 Hong Zhao,1,2 Guiqiang Wang1,2
1Department of Infectious Disease, Center for Liver Disease, Peking University First Hospital, Beijing, 100034, People’s Republic of China; 2Department of Infectious Diseases, Peking University International Hospital, Beijing, 102206, People’s Republic of China
Correspondence: Guiqiang Wang; Hong Zhao, Department of Infectious Disease, Center for Liver Disease, Peking University First Hospital, Beijing, 100034, People’s Republic of China, Email [email protected]; [email protected]; [email protected]
Background and Aims: Despite widespread vaccination against hepatitis B and availability of antiviral drugs, hepatitis B remained a major global public health problem. Therefore, an improved understanding of the burden of hepatitis B was required to help design strategies for global intervention.
Methods: Data on hepatitis B was collected by the Global Burden of Disease (GBD) 2019 database from 1990 to 2019. Age-standardized incidence rates (ASIR), mortality rates (ASMR) and disability-adjusted life year rates (ASDR) for hepatitis B were extracted from GBD 2019 and stratified by age, level of regionals and country. Estimated annual percentage changes (EAPC) of ASIR, ASMR and ASDR were calculated to quantify the temporal trends in hepatitis B.
Results: Globally, ASIR showed a continuous downward trend, from 1552.2 in 1990 to 1010.0 per 100,000 persons in 2019, with an annual decrease of 1.52% (95% CI − 1.66--1.38). ASMR showed a persistent decline, declining by nearly half in 2019 compared to 1990 (6.7 vs 12.4 per 100,000 persons), with an annual decrease of 2.55% (95% CI − 2.74--2.35). ASDR showed a continuing downward trend, and the EAPC was − 2.55% (95% CI − 2.74--2.35). This decreasing pattern was heterogeneous across regions and countries. Hepatitis B related deaths increased significantly in high socio-demographic index countries such as UK, USA, and Canada. The ARIMA model estimates a 36.14% and 6.00% decrease in ASIR and ASMR, respectively, by 2030 compared to 2015.
Conclusion: Global hepatitis B morbidity and mortality rates decreased significantly from 1990 to 2019, but with a high degree of heterogeneity among regions and countries. It was still far from achieving the WHO goal of elimination of viral hepatitis by 2030, especially mortality rate.
Keywords: hepatitis B, age-standardized incidence rates, age-standardized incidence rates, age-standardized mortality rates, prevention
Highlights
1 Global hepatitis B burden decreased significantly from 1990 to 2019.
2 Hepatitis B-related morbidity and mortality is now predominantly in Africa and Asia.
3 Hepatitis B-related deaths rise yearly in UK and US.
4 At current trends, achieving “eliminating viral hepatitis by 2030” was difficult.
Introduction
Despite the availability of vaccine to exempt hepatitis B virus (HBV) infection and potent antiviral drugs low-resistance (entecavir [ETV], tenofovir disoproxil fumarate [TDF], tenofovir alafenamide [TAF]), HBV infection and its complications remained a major global public health threat.1–3 WHO estimates that 296 million people were living with chronic hepatitis B (CHB) infection in 2019, with 1.5 million new infections each year.4 In 2019, hepatitis B resulted in an estimated 820,000 deaths, mostly from cirrhosis and hepatocellular carcinoma.4 In view of this, in 2016, WHO called for the elimination of viral hepatitis as a public health threat by 2030 (defined as a 65% reduction in mortality and a 90% reduction in incidence compared with the 2015 baseline).5
The prevention and treatment of hepatitis B was a complex systemic project that required worldwide cooperation and efforts. Managing the source of infection, cutting off the transmission route, and protecting the susceptible population were three key steps in the prevention of hepatitis B.6 WHO proposed 5 major interventions to reduce the threat of viral hepatitis, including prevention mother-to-child transmission (MTCT); vaccination; injection, blood and surgical safety; harm reduction services for people who inject drugs; active antiviral treatment.5 MTCT was the major of HBV infection.7,8 EASL2017, AASLD2018 and CHINA2019 guidelines recommended that in all pregnant women with HBV DNA>200000 IU/mL, antiviral prophylaxis should start at week 24–28 of gestation.6,9,10 Under the action of oral antiviral drug therapy for pregnant women and vaccination for newborns, China has made great progress in MTCT interruption. The prevalence of HBsAg positivity in children under 5 years of age decreased from 9.9% in 1992 to 0.3% in 2014.11,12 More important, significant reduction in HBV-attributable liver cancer observed among children was mainly caused by the universal HBV vaccination.13 In 26th May 2022, WHO recommended screening for HIV, hepatitis B, hepatitis C, and syphilis should be mandatory in all blood donations.14 However, it was screened only 76% and 83% in low- and lower-middle-income countries, much lower than in high or upper-middle income countries (>99%). The prevalence of transfusion-transmissible HBV infections in blood donations in low-income countries was considerably higher than in high- and middle-income countries (2.81% vs 0.02%).14 China has made some efforts to ensure the safety of the people who inject drug (PWID). The first attempt to provide clean needles and syringes to the PWID was made in 1997. Since 2005, the cost of the needle exchange program has been covered by the central government’s funds. 208 needles per PWID were distributed on average in 2015 (2030 target was 300 needles per PWID per year), with a safe injection rate of 86.5% (2030 target is 90%).15 However, WHO projected that only 5% of patients with CHB know they were infected worldwide.5 The cost-effectiveness economic model proposed that initiating universal HBV screening (serum HBsAg, HBsAb, HBeAg, HBeAb, HBcAb [five-test]) as soon as possible was recommendable for HBV prevention in China. It might improve the current suboptimal rates of diagnostic and treatment coverage.16 Testing HBV DNA and its genotyping, when necessary, was also important for the diagnosis and prognosis of CHB.17,18 Reducing the cost and increasing the accessibility of oral antivirals can also be beneficial for timely treatment.
The Global Burden of Disease (GBD) study assessed the burden of hepatitis B in 204 countries and regions around the world, providing a unique opportunity to understand the situation of hepatitis B. We extracted detailed data of the incidence, mortality, and disability-adjusted life years (DALYs) of hepatitis B from the GBD 2019 to assess the burden of hepatitis B at global, regional, and national levels from 1990 to 2019. Our findings can serve as an extension of other viral hepatitis, cirrhosis, and liver cancer disease burdens, as well as a reference for different countries to achieve the goal of eliminating the threat of viral hepatitis by 2030.
Materials and Methods
Study Data
Annual incident cases, death cases, DALYs counts, age-standardized incidence rate (ASIR), age-standardized mortality rate (ASMR) and age-standardized DALYs rate (ASDR) data, by age, region and country, were collected from the Global Health Data Exchange (GHDx) query tool.19 Data were available from a total of 204 countries and territories, which can be classified into 5 different levels in terms of socio-demographic index (SDI), including low, low-middle, middle, high-middle, and high.20 We also collected human development index (HDI) data at the national level from the World Bank. The total burden of hepatitis B in this study included acute hepatitis B infection, liver cirrhosis and liver cancer caused by chronic hepatitis B infection. DALYs were the total healthy life years lost from onset to death, including both years of life lost due to premature death and years lived with disability (DALY= YLLs+ YLDs). This study was approved by the Ethics Committee of Peking University First Hospital (Shen2016191).
SDI Definition
The SDI (ranging from 0 to 1) was a new developmental classification indicator proposed by the Institute for Health Metrics and Evaluation (IHME) in conjunction with the results of the GBD 2015. It was strongly linked to social development status and population health outcomes, which was composited by lag distributed income per capita (LDI), mean education for those age 15 and older (EDU15+) and total fertility rate under 25 (TFU25). SDI was a composite indicator of socio-demographic development, with a value of 0 indicating the lowest LDI, the lowest EDU15+, and the highest TFU25, which meant that the region had the lowest theoretical level of development related to health outcomes; an SDI value of 1 was opposite. Countries were categorized into low, low-middle, middle, high-middle, and high SDI based on their SDI values.21
Statistical Analysis
Our statistical analyses consisted of 5 main steps. In step 1, we described the cases of hepatitis B and ASIR; the cases of deaths and ASMR; DALYs counts and ASDR globally and in different regions. Different regions included 204 countries, 21 geographical regions and 5 SDI level regions. Next, locally weighted scatterplot smoothing (LOWESS) algorithms were used to fit the trends in above counts and standardized rates. All data were presented as values and 95% uncertainty interval (UI). In step 2, the different age proportions of ASIR, ASMR and ASDR were analyzed in 1990 and 2019, globally and regionally separately. The ages were divided into 5 segments, including 0–9 years, 10–24 year, 25–49 years, 50–69 years, and 70+ years. In step 3, we fitted the relationship between ASIR, ASMR, ASDR and SDI in different regions and countries and applied the LOWESS method to describe their trends.22 In step 4, we calculated the estimated annual percentage change (EAPC) of ASIR, ASMR and ASDR; explored the correlation (Pearson correlation coefficient) between EAPC and ASIR, ASMR and ASDR. EAPC was a widely used indicator to evaluate trends in various rates over specific time intervals. A linear regression equation Y=α+βX+ε was used to calculate it, where calendar year was the independent variable (X) and ln (rate) was the dependent variable (Y). The EAPC was calculated as 100×(e^β-1).
In step 5, We fitted the changes in ASIR and ASMR from 1990 to 2019 and forecast the values of them in 2030 with autoregressive integrated moving average (ARIMA) model in the time series.23 The ARIMA model was a hybrid model consisting of an autoregressive (AR) model and a moving average (MA) model. The model specification can be mainly based on the following formulations:

For the above equation, ε: constant; βt: white noise process; p: order.

Where; µ: constant; q: order.
A combined ARMA (p, q) process can be derived from the two equations. The ARIMA (p, d, q) model combines non-parametric differencing and integration with a parametric ARMA process, where d is the number of differencing operations. The “I” in the ARIMA acronym represents this time-series integration process.24 The construction of the ARIMA model included several steps of sequence smoothing test, model identification, parameter estimation, model diagnosis, and model prediction. Sequence smoothing test: since ASIR and ASMR were usually not smooth series, differential transforms were used to transformed them into smooth series. Model identification: our model was identified automatically by using “Expert Modeler” in SPSS Statistics, and the model was also identified by observing autocorrelation and partial autocorrelation plots. Parameter estimation was performed using the great likelihood method. Model diagnosis: in order to check whether the model was qualified, a white noise test was also performed on the residuals. We performed qualitative tests of observation of the autocorrelation function (ACF) and partial ACF (PACF) plots of the residuals, and quantitative tests of Ljung-Box Q statistic. If P>0.05, it was considered that the residuals of the models were non-white noise series. Model prediction: ASIR and ASMR were calculated using our models from 1990 to 2019. Then, the values of ASIR and ASMR and their 95% CI for 2030 were forecasted.
All analyses were performed with R 4.1.0 software and SPSS 26.0 software (IBM Corp., Armonk, NY., USA). P values less than 0.05 (two sided) were considered statistically significant.
Results
Global Burden of Hepatitis B
Globally, there were 806.5 (95%UI 646.6–990.7) ×10^5 incident cases of hepatitis B in 2019, the number decreased by 4.5% from 844.5 (95%UI 693.8–1010.3) ×10^5 in 1990 (Tables 1 and S1). The number of incidences experienced a parabolic-like change (first up, then down), with the inflection point around the year 2000 (Figure 1A). However, ASIR showed a continuous downward trend (Figure 1D), from 1552.2 (95%UI 1288.3–1842.4) per 100,000 persons in 1990 to 1010.0 (95%UI 811.7–1234.1) per 100,000 persons in 2019 (Table 1), with an average annual decrease of 1.52% (EAPC=−1.52 [95% CI −1.66--1.38], Figure 2A).
 |
Table 1 Region-Wise Total Hepatitis B Burden in 2019 |
 |
Figure 1 Global temporal patterns of total hepatitis B burden, 1990–2019. (A) Incident counts; (B) Deaths counts; (C) DALYs counts (D) ASIR per 10^5 persons (E) ASMR per 10^5 persons (F) ASDR per 10^5 person-years. Red curves were fitted with LOWESS (locally weighted scatterplot smoothing) methods. Abbreviations: DALYs, disability adjusted life years; ASIR, age-standardized incidence rate; ASMR, age-standardized mortality rate; ASDR, age-standardized DALYs rate. |
 |
Figure 2 EAPC of hepatitis B from 1990 to 2019 at regional level. (A) EAPCs of hepatitis B ASIR; (B) EAPCs of hepatitis B ASMR; (C) EAPCs of hepatitis B ASDR. Abbreviations: DALYs, disability adjusted life years; ASIR, age-standardized incidence rate; ASMR, age-standardized mortality rate; ASDR, age-standardized DALYs rate; EAPC, estimated annual percentage change; SDI, sociodemographic index. |
The number of deaths increased from 524.5 (95%UI 468.3–585) ×10^3 in 1990 to 555.5 (95%UI 487.1–630.1) ×10^3 in 2019, an increase of 5.9% (Tables 1 and S1). The number of deaths experienced a change of “increasing-decreasing-re-increasing”, with the highest peak in 1999 (Figure 1B). The latest 3 years from 2017 to 2019 showed a new increasing trend (Figure 1E). It was noteworthy that the ASMR showed a persistent decline, declining by nearly half in 2019 compared to 1990 (6.7 vs 12.4 per 100,000 persons), with an average annual decrease of 2.55% (EAPC=−2.55 [95% CI −2.74--2.35], Figure 2B). Cirrhosis and liver cancer were the most common causes of death due to hepatitis B. Therefore, we further analyzed the disease burden of them. As shown in Figure S1, the incidence of cirrhosis, death and DALYs due to hepatitis B showed a parabolic-like trend (increasing and then decreasing), which started to decrease around year of 2010. On the other hand, ASIR, ASMR and ASDR showed a significant decreasing trend. Figure S2 illustrated the disease burden of hepatitis B leading to liver cancer. Interestingly, both incidence, mortality and DALYs showed a sinusoidal curve-like change. The last 15 years (from 2005 to 2019) showed increase gradually. The changes in ASIR, ASMR and ASDR were divided into two segments, decreasing annually from 1990 to 2005 and remaining essentially flat from 2005 to 2019.
From 1990 to 2019, DALYs declined by 2.3% (186.3 vs 182.0 ×10^3 person-years) (Tables 1 and S1). DALY also showed an upward and then downward trend, peaking around 1999 (Figure 1C). As shown in Figure 1F, ASDR showed a continuing downward trend, and the EAPC was −2.55% (95% CI −2.74--2.35, Figure 2C). In brief, globally, the incidence, deaths and DALYs counts of hepatitis B all showed an upward and then downward trend from 1990 to 2019, while ASIR, ASMR and ASDR showed a continuous downward trend.
Regional Burden of Hepatitis B
At the regional level, the number of cases in East Asia was 245.9 (95%UI 182.6–314.9) ×10^5, which ranked the first among the 21 GBD regions in 2019, however, the highest ASIR was 2539.3 (95%UI 2065.1–3059.8) per 100,000 persons in Western Sub-Saharan Africa (Tables 1 and S1). Correspondingly, medium SDI and low SDI were the first rank of incidence cases and ASIR, which reached 286.9 (95%UI 225–353) ×10^5 and 1580.3 (95%UI 1294.6–1913) per 100,000 persons (Figure 3A). The EAPC of ASIR was significantly decreasing for all regions (Table S1 and Figure 2A).
 |
Figure 3 Global burden of hepatitis B by SDI. (A) ASIR in global and 21 GBD regions, 1990–2019; (B) ASIR in all countries and territories, 2019; (C) ASMR in global and 21 GBD regions, 1990–2019; (D) ASMR in all countries and territories, 2019; (E) ASDR in global and 21 GBD regions, 1990–2019; (F) ASDR in all countries and territories, 2019. Expected trends based on SDI and disease rates in all locations were shown as the red line with LOWESS (locally weighted scatterplot smoothing) methods. Abbreviations: DALYs, disability adjusted life years; ASIR, age-standardized incidence rate; ASMR, age-standardized mortality rate; SDI, sociodemographic index; GBD, Global Burden of Diseases; ASDR, age-standardized DALYs rate. |
The highest deaths cases and ASMR in 2019 were East Asia (169.5×10^3) and Western Sub-Saharan Africa (20.0 per 100,000 persons), respectively (Tables 1 and S2). Similarly, medium SDI and low SDI were the highest number of deaths and ASMR, respectively (Figure 3C). EAPC of ASMR decreased significantly in most regions (85.7%, 18/21), except for Central Asia, where there was no significant change, and Eastern Europe and High-income North America, where there were significant increases (Figure 2B). The deaths cases in Eastern Europe increased by 63% from 7.3 ×10^3 in 1990 to 11.9 ×10^3 in 2019. Meanwhile, the ASMR also increased from 2.7 per 100,000 persons in 1990 to 4 per 100,000 persons in 2019. Meanwhile, the deaths cases in High-income North America increased by 81.5% from 2.7 ×10^3 in 1990 to 4.9 ×10^3 in 2019.
The highest DALYs counts (in East Asia) and ASDR (in Western Sub-Saharan Africa) in 2019 were consistent with deaths data. EAPC of ASDR significant increases in Eastern Europe (1.58 [95% CI 0.38–2.8]) and High-income North America (0.19 [95% CI 0.1–0.28]), meanwhile, rest of the regions were decreased significantly, as shown in Table S3, Figure 2C. In brief, from 1990 to 2019, there was a significant decreasing of ASIR in different regions (Figure 3E). Consistently, ASMR and ASDR also decreased significantly in most regions, except for Eastern Europe and High-income North America.
National Burden of Hepatitis B
At the National level, the highest ASIR of hepatitis B was Mauritania (4172.7), which was the only country more than per 100,000 persons in 2019. There were 7 countries with ASIR over 3000 per 100,000 persons (Figures 3B and 4A and Table S4), all in Africa (Mauritania, Somalia, Niger, Burkina Faso, Central African Republic, Guinea, Angola). As shown in Figure 4C and Table S4, there were 2 countries (United Arab Emirates [299.3%], Qatar [283.8%]) with an increase of more than 200% from 1990 to 2019. EAPC of ASIR was significantly decreasing in the remaining countries, except for the UK (Figure 4E and Table S5). Notably, the incident cases in the UK increased from 92,850.8 in 1990 to 113,511.5 in 2019, an increase of 22.3%, with an average annual growth rate of 0.22% (95% CI 0.09–0.34).
 |
Figure 4 Geographical distribution of global disease burden of hepatitis B in all countries and territories. (A) ASIR of hepatitis B in 2019; (B) ASMR of hepatitis B in 2019; (C) The relative change in incident cases of hepatitis B between 1990 and 2019; (D) The relative change in deaths cases of hepatitis B between 1990 and 2019; (E) The EAPC of hepatitis B ASIR from 1990 to 2019; (F) The EAPC of hepatitis B ASMR from 1990 to 2019. Abbreviations: DALYs, disability adjusted life years; ASIR, age-standardized incidence rate; ASMR, age-standardized mortality rate; EAPC, estimated annual percentage change. |
Mongolia was the highest ASMR, which was reached to 39.7 (95% CI 28.2–54.2) per 100,000 persons. The other countries over 30 per 100,000 persons were Guinea, Egypt and Gambia (Figures 3D and 4B and Table S4). It was noteworthy that compared to 1990, the deaths cases decreased in only 32.4% countries mainly in China, continental Europe, and South America (Figure 4D and Table S5). The highest increasing countries were the United Arab Emirates (510.0%) and Qatar (302.1%), respectively. There were 9 countries with significant increases in EAPC of ASMR, mainly in Europe and North America (Figure 4F and Table S6). The top 3 countries were UK (2.25), Ukraine (2.14) and Ireland (1.55).
Whether ASDR, DALYs changes or EAPC of ASDR, the indicators of DALYs were similar with the indicators of death. The highest ASDR were Guinea and Mongolia (Figure S3A and Table S4). Compared to 1990, DALY decreased in only 37.3% countries (Figure S3B and Table S5). There were 10 countries with significant increasing in EAPC of ASDR, and the top three were Ukraine, UK, and Russia (Figure S3C and Table S6). In brief, at the country level, hepatitis B morbidity and mortality mainly in Asian and African countries, such as Mauritius and Mongolia (Figure 3F). It should be noted that the number of deaths and EAPC of ASMR increased significantly from 1990 to 2019 in developed countries such as the United States, the United Kingdom, and Canada.
Age Distribution of Incidence and Mortality Proportion of Hepatitis B
Globally, the incidence cases of hepatitis B in children under 10 years old has decreased significantly, from 16.9% in 1990 to 4.7% in 2019 (Figure 5A). The proportion of children in high to middle SDI areas were less than 3% in 2019. Geographically, the predominant incidence of children under 10 years old was in the Sahara and Oceania areas (around 10%). From 1990 to 2019, globally, the proportion of elderly people (≥70 years) who die from hepatitis B was increasing significantly (19.4% to 25.7%, Figure 5B). This trend was more evident in high SDI regions (24.8% to 41.1%), high-income Asia Pacific (22.3% to 46.9%) and Western Europe (33% to 44.8%), as shown in Figure 5B. There were no obvious changes in the proportion of DALYs in all age groups (Figure S4).
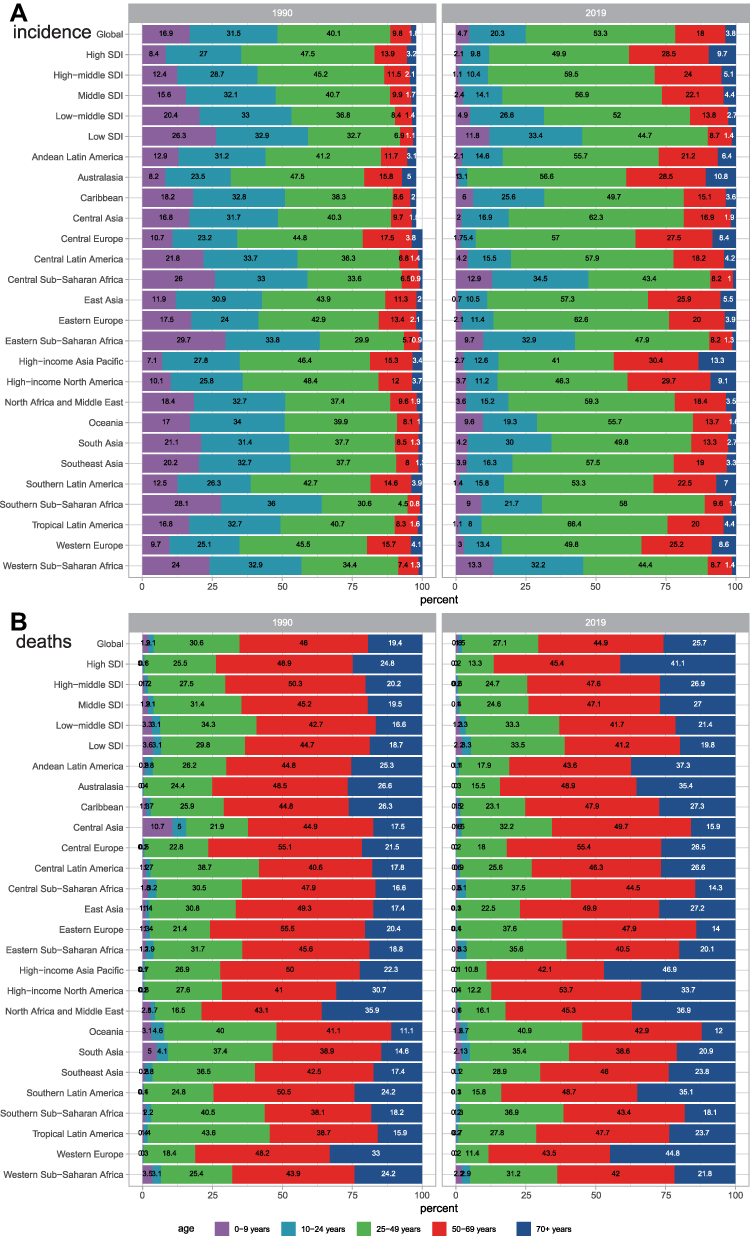 |
Figure 5 Age distribution of incident cases and deaths cases of hepatitis B by globally and region in 1990 and 2019. (A) ASIR in 1990 and 2019; (B) ASMR in 1990 and 2019. |
The Influential Factors for EAPC
The ASID, ASMR and ASDR of hepatitis B in 1990 reflected the disease reservoir at baseline and the HDI in 2019 can serve as alternative medical level of each country. As shown in Figure 6A, there was no significant correlation between ASIR and EAPC of ASIR (P=0.067). Globally, a significant negative association was found between EAPC of ASIR and HDI (ρ=−0.251, P=0.002). Surprisingly, a significant positive relation was detected between EAPCs and HDIs (ρ=0.327, P=0.019), when the HDI>0.8 (Figure 6B). That meant countries with HDI>0.8 have experienced a rapid increase in ASIR of hepatitis B from 1990 to 2019. Overall, ASMR was not significantly correlated with EAPC of ASMR (P= 0.496, Figure 6C), but they were significantly negatively correlated when ASMR < 20 per 100,000 persons (ρ=−0.164, P= 0.038). As shown in Figure 6D, HDI was significantly negatively correlated with EAPC of ASMR when HDI<0.8 (ρ=−0.233, P=0.016), while HDI was significantly positively correlated with EAPC of ASMR when HDI > 0.8 (ρ=0.281, P=0.045). There was no significant correlation between ASDR and EAPC of ASDR (P=0.927, Figure 6E). The correlation between HDI and EAPC of ASDR was completely opposite in HDI<0.8 (negative) and HDI>0.8 (positive), as illustrated in Figure 6F.
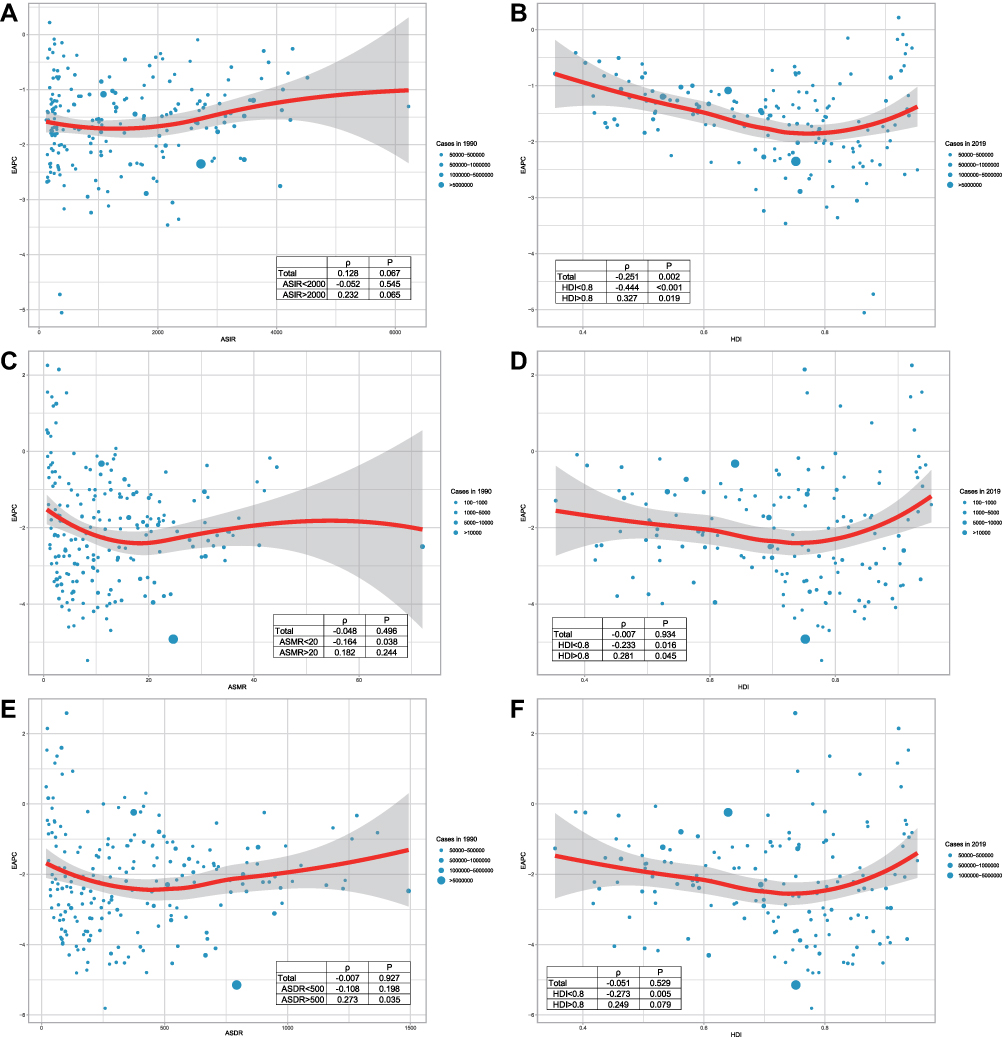 |
Figure 6 Correlation between EAPC, hepatitis B disease burden and HDI. (A) Correlation between EAPC and ASIR in 1990; (B) Correlation between ASIR-EAPC and HDI in 2019; (C) Correlation between EAPC and ASMR in 1990; (D) Correlation between ASMR-EAPC and HDI in 2019; (E) Correlation between EAPC and ASDR in 1990; (F) Correlation between ASDR-EAPC and HDI in 2019. Pearson’s tests were used for correlation analysis. ρ and P values were the correlation coefficient and significance respectively. Abbreviations: DALYs, disability adjusted life years; ASIR, age-standardized incidence rate; ASMR, age-standardized mortality rate; ASDR, age-standardized DALYs rate; EAPC, estimated annual percentage change; HDI, human development index. |
Predictions of Hepatitis B Incidence and Mortality Rates
We used the ARIMA model to fit the ASIR and ASMR from 1990 to 2019 and predict them in 2030. We transformed the ASIR into a stationary time series after 2 difference transformations of the it (Figure S5A). According to ACF and PACF plots (Figure S5B) and “Expert Modeler” in SPSS, the ARIMA (2,2,0) model was constructed. The parameter β value of AR was −0.601 (P=0.002); the white noise test Q statistic was 9.154 (P=0.935, the residuals ACF and PACF were shown in Figure S5C). As shown in Figure 7A and C, the ASIR of hepatitis B was expected to be 712.88 per 100,000 persons by 2030, which meant a decrease of 36.14% compared with 1116.25 per 100,000 persons in 2015.
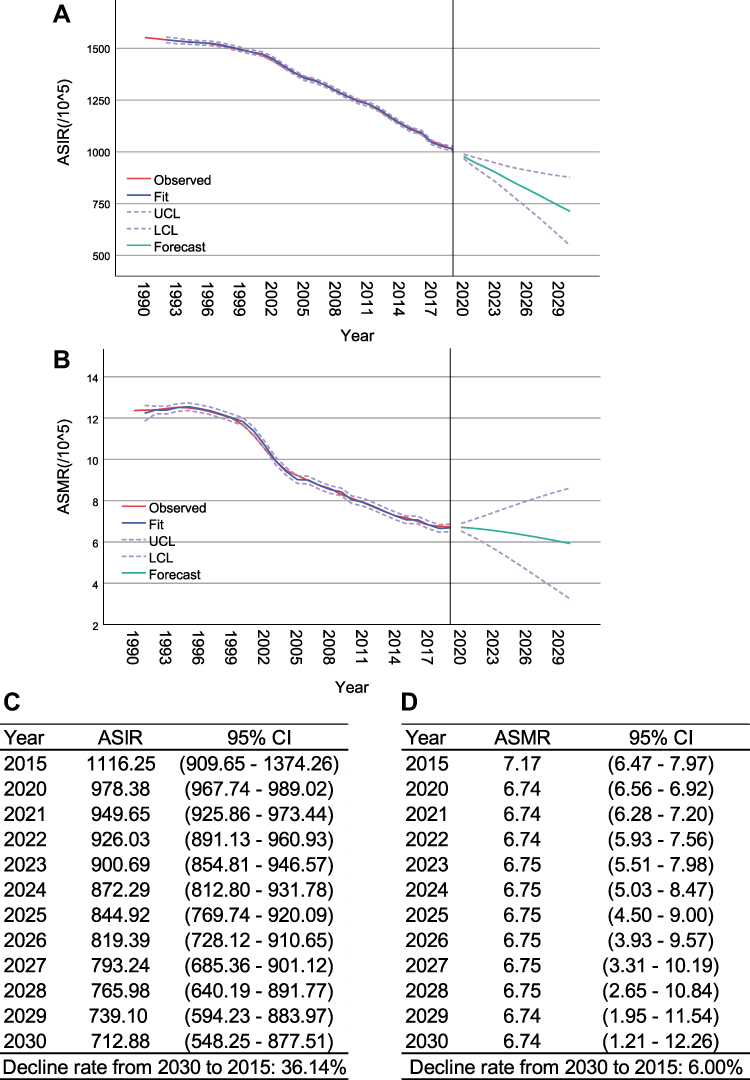 |
Figure 7 Global hepatitis B incidence and mortality trends from 1990 to 2019 and projections from 2020 to 2030. (A) ASIR trends and projections; (B) ASMR trends and projections; (C) Forecast values of ASIR from 2020 to 2030; (D) Forecast values of ASMR from 2020 to 2030. The ARIMA models were adopted for predictions. ASIR and ASMR models were ARIMA (2,2,0) and ARIMA (1,1,0), respectively. The red line represented the observed value; the blue line represented the fitted value; the purple dashed line represented the confidence interval; and the green line represented the forecast value. Abbreviations: ASIR, age-standardized incidence rate; ASMR, age-standardized mortality rate; ARIMA, autoregressive integrated moving average. |
Construction process of ARIMA prediction model of ASMR were shown in Figure S6. Figure S6A shows the results of the original series and the one difference transformation. With the ACF and PACF plots in Figure S6B, ARIMA (1,1,0) was finally selected as the fitted model for ASMR. The parameter β value of AR was 0.874 (P<0.001); the white noise test Q statistic was 16.849 (P= 0.465, the residuals ACF and PACF were shown in Figure S6C). The ASMR for hepatitis B in 2030 was estimated to be 6.74 per 100,000 persons, a decrease of only 6% from the 7.17 per 100,000 persons in 2015 (Figure 7B and D).
Discussion
In this study, we comprehensive analyzed the disease burden (incidence, deaths, DALYs) of hepatitis B at the global, regional, and national level. In general, the GBD of hepatitis B has declined significantly, whether ASIR, ASMR or ASDR. The global ASIR, ASMR and ASDR of hepatitis B decreased by a mean of 1.52%, 2.55% and 2.58% per year from 1990 to 2019, respectively. However, there was significant heterogeneity across regions and different countries. At the regional level, morbidity was significantly decreased in all regions in line with the overall global level. Mortality levels were also consistent with global level in most regions. Of note, mortality increased significantly in Eastern Europe and High-income North America, with annual increases of 1.22% and 0.49%, respectively. At the national level, the UK was the only country with an increase in ASIR for hepatitis B. Mongolia was the highest ASMR in 2019. Developed countries such as the US, Canada, and UK have seen a significant increase in ASMR per year. We estimated that in 2030, global hepatitis B ASIR and ASMR will decrease by only 36.1% and 6.0%, respectively, compared to 2015. This may fall far short of WHO’s goal of eliminating the threat of viral hepatitis by 2030.
ASIR for hepatitis B has continued to decrease from 1990 to 2019 (Figure 1). We conjectured this was attributable to hepatitis B vaccination and MTCT interruption. Take China for example. In 1990, there were 33.43 million patients in China, accounting for 40% of the world’s total. By 2019, the number of patients in China had dropped to 23.36 million, accounting for 30% of the global total. Prior to widespread hepatitis B vaccination, MTCT rate of HBV in China was about 50%, and as high as 72–91% among HBeAg-positive pregnant women.25 In order to effectively block MTCT, China has taken a series of programs since 1992.26 In 1992, hepatitis B vaccination was included in the neonatal immunization program.27 In 2002, free hepatitis B vaccine was provided to all newborns. From 2009 to 2011, catch-up vaccination programs were provided for children who had not been vaccinated before, with a total of 68 million children being vaccinated.28 By 2015, the hepatitis B vaccination rate (completion of three doses) among Chinese children reached 99.6%. On the contrary, Mongolia, also an East Asian country, had more hepatitis B cases in 2019 than in 1990 (55,029.3 vs 58,370.1). It was no surprise that the mortality rate of hepatitis B in Mongolia was the highest in the world. Important reasons were the low rate of hepatitis B vaccination and untimely vaccination.29
In the context of the continuous reduction of ASMR of hepatitis B worldwide, developed countries (such as US and UK) have increased significantly both the number of hepatitis B deaths and the average annual mortality rate. Our analysis may be related to the following reasons. Aging was an important risk factor for hepatitis B leading to hepatocellular carcinoma. The proportion of people aged 65 years or older in US and UK increased from 12.33% and 15.89% in 2000 to 16.21% and 18.51% in 2019, respectively.30 Our analysis also supports this reason. In high SDI region, the proportion of hepatitis B deaths aged 70+ years increased from 24.8% in 1990 to 41.1% in 2019 (Figure 5). Increased migration from traditionally high hepatitis B endemic regions, such as Asian and African, to developed countries also contributes.31 Our correlation analysis showed that HDI was significantly positively correlated with EAPC (either ASIR, ASMR, or SADR) when HDI > 0.8 (Figure 6). Liu et al study indicated that a significant positive association between HDI and liver cancer incidence, by analyzing the burden of liver cancer disease from 1990 to 2016. Countries with higher HDI have experienced a more rapid increase in ASIR of liver cancer.32 To further strengthen hepatitis B prevention and control, the CDC has announced universal hepatitis B vaccination in adults aged 19–59 years, which will help reduce hepatitis B morbidity and mortality.33,34 In addition, it was important to note that although the global ASMR showed a decreasing trend, the number of HBV-related deaths was on the rise, from 524.5 (95% UI 468.3–585) ×10^3 in 1990 to 555.5 (95% UI 487.1–630.1) ×10^3 in 2019 (Table S2), due to the population growth and aging.35
Several limitations of this study should be noted. First, the accuracy and robustness of the results depend greatly on the quality of the GBD2019 data. Since asymptomatic infection was not rare in hepatitis B, the results of this study (incidence and deaths) may be underestimated. Second, the imperfection of infectious disease reporting systems in developing countries may lead to information bias in model estimation, especially in the first 10 years of this study (1990–1999). Third, due to space limitations, an in-depth analysis of the disease burden of hepatitis B leading to cirrhosis and liver cancer was not performed.
In conclusion, global hepatitis B morbidity and mortality rates decreased significantly from 1990 to 2019, but with a high degree of heterogeneity among regions and countries. Although Asia and Africa have experienced significant decreases in morbidity and mortality year-to-year, they currently continue to have the highest number of morbidity and mortality. Notably, the annual hepatitis B-related deaths rate was increasing each year in North America and Europe. Without puissant approaches to further reduce morbidity and mortality, achieving the WHO goal of elimination of viral hepatitis by 2030 was unrealistic based on current trends in the hepatitis B epidemic.
Abbreviations
HBV, hepatitis B virus; CHB, chronic hepatitis B; MTCT, mother-to-child transmission; AASLD, American Association for the Study of Liver Diseases; EASL, European Association for the Study of the Liver; APASL, Asian Pacific Association for the Study of the Liver; PWID, people who inject drug; GBD, Global Burden of Disease; DALYs, disability-adjusted life years; ASIR, age-standardized incidence rate; ASMR, age-standardized mortality rate; ASDR, and age-standardized DALYs rate; SDI, socio-demographic index; HDI, human development index; LOWESS, locally weighted scatterplot smoothing; UI, uncertainty interval; EAPC, estimated annual percentage change; ARIMA, autoregressive integrated moving average; ACF, autocorrelation function; PACF, partial autocorrelation function.
Ethics Approval and Consent to Participate
This study was approved by the Ethics Committee of Peking University First Hospital (Shen2016191).
Acknowledgments
We thank two pediatric experts Zhi Li and Fang Wang (all from Department of Infectious Diseases, Children’s Hospital Affiliated to Zhengzhou University, Zhengzhou, 450053, China) about the epidemiology of hepatitis B in children and mother to child transmission in this study. What’s more, thanks to Xiao Ming ([email protected]) for his work in the GBD database. His excellent sharing of GBD database analysis procedure and other public database, makes it easier for us to explore the GBD database.
Funding
This study was supported by National Natural Science Foundation of China (82270626); China Mega-Project for Infectious Diseases (2017ZX10203202, 2013ZX10002005); the Project of Beijing Science and Technology Committee (Z191100007619037).
Disclosure
The authors have no conflict of interest to declare.
References
1. Schweitzer A, Horn J, Mikolajczyk RT, Krause G, Ott JJ. Estimations of worldwide prevalence of chronic hepatitis B virus infection: a systematic review of data published between 1965 and 2013. Lancet. 2015;386(10003):1546–1555. doi:10.1016/s0140-6736(15)61412-x
2. Sepanlou SG, Safiri S, Bisignano C. The global, regional, and national burden of cirrhosis by cause in 195 countries and territories, 1990–2017: a systematic analysis for the Global burden of disease study 2017. Lancet Gastroenterol Hepatol. 2020;5(3):245–266. doi:10.1016/s2468-1253(19)30349-8
3. Yang J, Pan G, Guan L, et al. The burden of primary liver cancer caused by specific etiologies from 1990 to 2019 at the global, regional, and national levels. Cancer Med. 2022;11(5):1357–1370. doi:10.1002/cam4.4530
4. World Health Organization. Hepatitis B. Available from: https://www.who.int/en/news-room/fact-sheets/detail/hepatitis-b.
5. World Health Organization. Global hepatitis report; 2017. Available from: https://www.who.int/publications/i/item/9789241565455.
6. Wang G, Duan Z. Guidelines for prevention and treatment of chronic hepatitis B. J Clin Transl Hepatol. 2021;9(5):769–791. doi:10.14218/jcth.2021.00209
7. Wang X, Liu J, Wang Q, et al. Economic-related inequalities in hepatitis B virus infection among 115.8 million pregnant women in China from 2013 to 2020. EClinicalMedicine. 2022;49:101465. doi:10.1016/j.eclinm.2022.101465
8. Ríos-Hincapié CY, Murad-Rivera R, Tohme RA, et al. Progress towards the elimination of hepatitis B in children in Colombia: a novel two-phase study approach. J Viral Hepat. 2022. doi:10.1111/jvh.13719
9. Lampertico P, Agarwal K, Berg T. EASL 2017 clinical practice guidelines on the management of hepatitis B virus infection. J Hepatol. 2017;67(2):370–398. doi:10.1016/j.jhep.2017.03.021
10. Terrault NA, Lok ASF, McMahon BJ, et al. Update on prevention, diagnosis, and treatment of chronic hepatitis B: AASLD 2018 hepatitis B guidance. Hepatology. 2018;67(4):1560–1599. doi:10.1002/hep.29800
11. Cui F, Shen L, Li L, et al. Prevention of chronic hepatitis B after 3 decades of escalating vaccination policy, China. Emerg Infect Dis. 2017;23(5):765–772. doi:10.3201/eid2305.161477
12. Liang X, Bi S, Yang W, et al. Epidemiological serosurvey of hepatitis B in China--declining HBV prevalence due to hepatitis B vaccination. Vaccine. 2009;27(47):6550–6557. doi:10.1016/j.vaccine.2009.08.048
13. Li C, He WQ. The impact of universal hepatitis B vaccine on the trend of liver cancer from the global burden of disease study 2017. Liver Int. 2021;41(8):1762–1774. doi:10.1111/liv.14821
14. World Health Organization. Blood safety and availability. Available from: https://www.who.int/news-room/fact-sheets/detail/blood-safety-and-availability.
15. Liu J, Liu M. Progress and challenges in achieving the WHO goal on elimination of hepatitis b by 2030 in China (in Chinese). Zhonghua Liu Xing Bing Xue Za Zhi. 2019;40(6):605–609. doi:10.3760/cma.j.issn.0254-6450.2019.06.001
16. Su S, Wong WC, Zou Z, et al. Cost-effectiveness of universal screening for chronic hepatitis B virus infection in China: an economic evaluation. Lancet Global Health. 2022;10(2):e278–e287. doi:10.1016/s2214-109x(21)00517-9
17. Behzadi P, Behzadi E, Alavian SM. DNA microarray technology in HBV genotyping. Minerva Med. 2017;108(5):473–476. doi:10.23736/s0026-4806.17.05059-5
18. Behzadi P, Ranjbar R, Alavian SM. Nucleic acid-based approaches for detection of viral hepatitis. Jundishapur J Microbiol. 2015;8(1):e17449. doi:10.5812/jjm.17449
19. Global burden of disease study 2019 (GBD 2019) data resources. Available from: https://ghdx.healthdata.org/gbd-2019.
20. A new way to measure progress in global health. Available from: https://www.humanosphere.org/global-health/2016/10/a-new-way-to-measure-progress-global-health/.
21. Lacey BW. Global age-sex-specific fertility, mortality, healthy life expectancy (HALE), and population estimates in 204 countries and territories, 1950–2019: a comprehensive demographic analysis for the global burden of disease study 2019. Lancet. 2020;396(10258):1160–1203. doi:10.1016/s0140-6736(20)30977-6
22. Locally weighted scatterplot smoothing (LOWESS). Available from: https://en.wikipedia.org/wiki/Local_regression.
23. Autoregressive integrated moving average (ARIMA). Available from: https://en.wikipedia.org/wiki/Autoregressive_integrated_moving_average.
24. Guo K, Song S, Qiu L, Wang X, Ma S. Prediction of red blood cell demand for pediatric patients using a time-series model: a single-center study in China. Front Med. 2022;9:706284. doi:10.3389/fmed.2022.706284
25. Society of Infectious Diseases and Chinese Medical Association GCC. Guidelines for prevention and control of mother to child transmission of hepatitis B virus in China-2019 Edition (in Chinese). Chin J Infect Dis. 2019;37(7):388–396. doi:10.3760/cma.j.issn.1000-6680.2019.07.002
26. Luo Z, Li L, Ruan B. Impact of the implementation of a vaccination strategy on hepatitis B virus infections in China over a 20-year period. Int J Infect Dis. 2012;16(2):e82–e88. doi:10.1016/j.ijid.2011.10.009
27. Liao X, Liang Z. Strategy vaccination against hepatitis B in China. Hum Vaccin Immunother. 2015;11(6):1534–1539. doi:10.4161/21645515.2014.980206
28. Jia Y, Li L, Cui F, et al. Cost-effectiveness analysis of a hepatitis B vaccination catch-up program among children in Shandong Province, China. Hum Vaccin Immunother. 2014;10(10):2983–2991. doi:10.4161/hv.29944
29. Rauniyar SK, Munkhbat E, Ueda P, Yoneoka D, Shibuya K, Nomura S. Timeliness of routine vaccination among children and determinants associated with age-appropriate vaccination in Mongolia. Heliyon. 2020;6(9):e04898. doi:10.1016/j.heliyon.2020.e04898
30. The proportion of elderly people (65 years and older) in the total population of all countries in the world. Available from: https://www.kylc.com/stats/global/yearly_overview/g_population_65above_perc.html.
31. Kumar GS, Pezzi C, Payton C, et al. Health of asylees compared to refugees in the United States using domestic medical examination data, 2014–2016: a cross-sectional analysis. Clin Infect Dis. 2021;73(8):1492–1499. doi:10.1093/cid/ciab502
32. Liu Z, Jiang Y, Yuan H, et al. The trends in incidence of primary liver cancer caused by specific etiologies: results from the global burden of disease study 2016 and implications for liver cancer prevention. J Hepatol. 2019;70(4):674–683. doi:10.1016/j.jhep.2018.12.001
33. Kuehn BM. Age range is expanded for universal hepatitis B vaccination. JAMA. 2022;327(18):1749. doi:10.1001/jama.2022.6515
34. Weng MK, Doshani M, Khan MA, et al. Universal hepatitis B vaccination in adults aged 19–59 years: updated recommendations of the advisory committee on immunization practices - United States, 2022. MMWR Morb Mortal Wkly Rep. 2022;71(13):477–483. doi:10.15585/mmwr.mm7113a1
35. Sheena BS, Hiebert L, Han H, et al. Global, regional, and national burden of hepatitis B, 1990–2019: a systematic analysis for the global burden of disease study 2019. Lancet Gastroenterol Hepatol. 2022;7(9):796–829. doi:10.1016/s2468-1253(22)00124-8
 © 2022 The Author(s). This work is published and licensed by Dove Medical Press Limited. The
full terms of this license are available at https://www.dovepress.com/terms
and incorporate the Creative Commons Attribution
- Non Commercial (unported, 3.0) License.
By accessing the work you hereby accept the Terms. Non-commercial uses of the work are permitted
without any further permission from Dove Medical Press Limited, provided the work is properly
attributed. For permission for commercial use of this work, please see paragraphs 4.2 and 5 of our Terms.
© 2022 The Author(s). This work is published and licensed by Dove Medical Press Limited. The
full terms of this license are available at https://www.dovepress.com/terms
and incorporate the Creative Commons Attribution
- Non Commercial (unported, 3.0) License.
By accessing the work you hereby accept the Terms. Non-commercial uses of the work are permitted
without any further permission from Dove Medical Press Limited, provided the work is properly
attributed. For permission for commercial use of this work, please see paragraphs 4.2 and 5 of our Terms.